

Abstract
Aims
Measurement of B‐type natriuretic peptide (BNP) or N‐terminal pro‐BNP is recommended as part of the diagnostic workup of patients with suspected heart failure (HF). We evaluated the diagnostic and prognostic utility of the novel urinary proteomic classifier HF1, compared with BNP, in HF. HF1 consists of 85 unique urinary peptide fragments thought, mainly, to reflect collagen turnover.
Methods and results
We performed urinary proteome analysis using capillary electrophoresis coupled with mass spectrometry in 829 participants. Of these, 622 had HF (504 had chronic HF and 118 acute HF) and 207 were controls (62 coronary heart disease patients without HF and 145 healthy controls). The area under the receiver operating characteristic (ROC) curve (AUC) using HF1 for the diagnosis of HF (cases vs. controls) was 0.94 (95% CI, 0.92–0.96). This compared with an AUC for BNP of 0.98 (95% CI, 0.97–0.99). Adding HF1 to BNP increased the AUC to 0.99 (0.98–0.99), P < 0.001, and led to a net reclassification improvement of 0.67 (95% CI, 0.54–0.77), P < 0.001. Among 433 HF patients followed up for a median of 989 days, we observed 186 deaths. HF1 had poorer predictive value to BNP for all‐cause mortality and did not add prognostic information when combined with BNP.
Conclusions
The urinary proteomic classifier HF1 performed as well, diagnostically, as BNP and provided incremental diagnostic information when added to BNP. HF1 had less prognostic utility than BNP.
Keywords: Heart failure, Biomarkers, Proteomics, Collagen, Diagnosis, Prognosis
Introduction
The diagnosis of heart failure (HF) is based on the presence of typical symptoms and signs, supported by investigative evidence. Measurement of a natriuretic peptide is the recommended first‐line investigation, with a normal plasma level suggesting an alternative diagnosis and an elevated level an indication for cardiac imaging. 1 Demonstration of a structural or functional cardiac abnormality on imaging confirms the diagnosis, clarifies the cause of HF, and is essential for selection of the most appropriate therapy. Interpretation of natriuretic peptide levels can, however, be difficult in certain groups of patients, for example, those with atrial fibrillation, patients who are obese, individuals with renal impairment, and patients with pulmonary hypertension and right ventricular dysfunction secondary to chronic lung disease. Patients with HF with preserved ejection fraction (EF) (HFpEF) can be particularly difficult to diagnose, in part because they often have one or more of these co‐morbidities. Consequently, new biomarkers that might aid the diagnosis of HF are of great interest, especially if convenient for patients, if non‐invasive, and if cost‐effective and time effective.
The urinary proteome is a potential source of novel diagnostic biomarkers. Proteomic analysis using capillary electrophoresis coupled to mass spectrometry (CE‐MS) has previously been used to identify a panel of urinary peptides, termed HF1, which was able to distinguish patients with hypertension and diastolic impairment from healthy controls. 2 The same classifier was able to identify those with diastolic dysfunction in a sample of 745 people randomly recruited from a Flemish population 3 and distinguished patients with overt HF (16 hypertensive patients in New York Heart Association class II or III) from healthy controls (n = 16). 2
Confirmation of these initial findings in a large cohort of patients with HF is still outstanding. Therefore, our aim was to test whether HF1 can discriminate clinical HF, both HF with reduced EF (HFrEF) and HFpEF from healthy controls and control subject with coronary heart disease (CHD). We also assessed how this classifier compared with B‐type natriuretic peptide (BNP), the current ‘gold standard’ first‐line test in the diagnostic pathway for HF, as well as the prognostic value of this marker.
Methods
Participants
Three participant cohorts were studied: (i) outpatients with chronic HF, (ii) patients hospitalized owing to HF, and (iii) controls (patients with CHD and healthy volunteers). Diagnosis of HF (both acute and chronic) was made using the European Society of Cardiology definition of HF recommended at the time of recruitment. 4 , 5 The chronic HF cohort included patients from two separate descriptive studies that enrolled participants between December 2006 and January 2009 and between March 2013 and December 2014. 6 , 7 Patients with acute HF were enrolled in a descriptive study between January 2013 and December 2014. 8 , 9 CHD and healthy controls were enrolled in a descriptive study between March 2013 and December 2014. 6 The studies were each approved by the West of Scotland Research Ethics Committee, and each patient consented to measurement of potential biomarkers in their blood and urine.
All participants had measurement of plasma BNP and a detailed echocardiographic examination, including measurement of left ventricular EF using the Simpson biplane method. 10 Potential participants were excluded from the healthy volunteer cohort if they had a BNP > 100 pg/mL, and patients with suspected acute HF were excluded if their BNP was <100 pg/mL at time of screening.
Urinary proteomics analysis
Sample preparation and capillary electrophoresis coupled with mass spectrometry analysis
Urine samples were collected on the same day that echocardiograms and clinical assessment were performed and stored at −80°C. Proteomic analysis was undertaken by operators blind to participant group. CE‐MS analyses were performed using a P/ACE MDQ CE system (Beckman Coulter, Fullerton, CA) online coupled to a micro‐TOF MS (Bruker Daltonics, Bremen, Germany) as described previously. 11 , 12 Mass spectrometric data were evaluated as previously described, 13 and the HF classifier, based on 85 urine peptides, 2 was applied. The obtained peak lists characterize each polypeptide by its molecular mass, normalized CE migration time, and normalized signal intensity. HF1 proteomic classifier is a normalized, dimensionless variable; further details regarding the scoring of this proteomic classifier have previously been described. 13
Further details of the urinary proteomic analysis are provided in the Supporting Information. Urine samples were collected on the same day as other study assessments, and no specific requirements were stipulated, for example, for an early‐morning sample or mid‐stream sample.
Statistical analysis
Baseline characteristics are presented according to participant group. Continuous variables are described as median and inter‐quartile range, and categorical variables as counts and percentages. Boxplots are presented for the urinary classifier HF1 and split by the same groups.
Correlations of HF1 with log BNP, EF, and left ventricular size were calculated using Pearson's coefficient; and scatterplots are provided for each comparison. Receiver operating characteristic (ROC) was used to evaluate the diagnostic utility of HF1 as a continuous measure for discriminating between HF patients and controls, first as individual predictors and, then, as linear combinations, derived using logistic regression. C‐Statistics were calculated. The net reclassification improvement (NRI) was calculated to compare the predictive probabilities of models using BNP alone and BNP with HF1.
Patients who provided consent were followed up for vital status by record linkage through the Information Services Division of National Services Scotland. This record linkage has previously been described and provides near‐complete follow‐up with rare loss to follow‐up. 14 For patients with follow‐up data, HF1 was grouped into tertiles, and Kaplan–Meier survival curves were generated for time to all‐cause death in relation to each tertile. P‐values for differences in curves were obtained using log rank tests. A Cox proportional hazard model was fitted using the Meta‐analysis Global Group in Chronic Heart Failure (MAGGIC) risk score as the only covariate. 15 To assess the prognostic value of HF1, this model was extended to include this classifier as a continuous covariate. Hazard ratios, 95% confidence intervals (CIs), and P‐values are reported for each model.
All analyses were conducted using R® version 3.3.3.
Results
We performed urinary proteome analysis by CE‐MS in 829 participants. Of these, 622 had HF (504 had chronic HF and 118 acute HF) and 207 were controls (62 with CHD and 145 healthy volunteers).
Baseline demographics of all three cohorts are shown in Table 1 . Patients with HF [median age 72 (66–80) years] were older than controls [66 (63–72) years]. Higher proportions of patients with HF and CHD controls were men, compared with the healthy volunteers. Renal function was better and haemoglobin was higher in healthy volunteers and CHD controls than in patients with HF. Liver function was similar in all cohorts.
Table 1.
Baseline characteristics
| Heart failure | Controls | |||||||
|---|---|---|---|---|---|---|---|---|
| Acute HF | Chronic HF | |||||||
| All n = 622 | HFrEF n = 79 | HFpEF n = 39 | HFrEF n = 430 | HFpEF n = 74 | All n = 184 | CHD n = 45 | Healthy n = 139 | |
| Age, years | 72 [66–80] | 75 [69–82] | 77 [72–83] | 71 [64–78] | 74 [70–80] | 65 [63–71] | 65 [62–68] | 66 [63–72] |
| Female sex | 234 (38) | 35 (44) | 24 (62) | 134 (31) | 41 (55) | 100 (54) | 14 (31) | 86 (62) |
| SBP, mmHg | 132 [116–149] | 132 [113–152] | 135 [120–158] | 131 [116–148] | 135 [122–147] | 140 [130–156] | 138 [130–150] | 140 [130–156] |
| NYHA class | ||||||||
| I | 56 (9) | 0 (0) | 0 (0) | 53 (12) | 3 (4) | 207 (100) | 45 (100) | 139 (100) |
| II | 350 (56) | 30 (38) | 14 (36) | 253 (59) | 53 (72) | 0 (0) | 0 (0) | 0 (0) |
| III | 193 (31) | 33 (42) | 20 (51) | 122 (28) | 18 (24) | 0 (0) | 0 (0) | 0 (0) |
| IV | 23 (4) | 16 (20) | 5 (13) | 2 (1) | 0 (0) | 0 (0) | 0 (0) | 0 (0) |
| Medical history | ||||||||
| Previous HF diagnosis | 377 (61) | 47 (60) | 25 (64) | 292 (68) | 24 (32) | 0 (0) | 0 (0) | 0 (0) |
| Hypertension | 439 (71) | 54 (68) | 26 (67) | 302 (70) | 57 (77) | 31 (17) | 28 (62) | 3 (2) |
| Myocardial infarction | 282 (45) | 35 (44) | 15 (39) | 209 (49) | 23 (31) | 39 (22) | 39 (87) | 0 (0) |
| Atrial fibrillation | 300 (48) | 38 (48) | 20 (51) | 199 (46) | 43 (58) | 0 (0) | 0 (0) | 0 (0) |
| TIA/CVA | 91 (15) | 14 (18) | 7 (18) | 52 (12) | 18 (24) | 0 (0) | 0 (0) | 0 (0) |
| Peripheral arterial disease | 81 (13) | 11 (14) | 6 (15) | 54 (13) | 10 (14) | 0 (0) | 0 (0) | 0 (0) |
| Diabetes | 191 (31) | 27 (34) | 11 (28) | 133 (31) | 20 (27) | 9 (6) | 8 (18) | 1 (1) |
| COPD | 142 (10) | 18 (23) | 10 (26) | 90 (21) | 24 (32) | 4 (2) | 4 (9) | 0 (0) |
| Medication | ||||||||
| ACEi | 415 (67) | 40 (51) a | 17 (44) a | 315 (73) | 43 (58) | 30 (16) | 30 (67) | 0 (0) |
| ARB | 87 (14) | 5 (6) a | 9 (23) a | 66 (15) | 7 (10) | 5 (3) | 4 (9) | 1 (1) |
| Beta‐blocker | 441 (71) | 45 (57) a | 24 (62) a | 326 (76) | 46 (62) | 37 (20) | 37 (82) | 0 (0) |
| MRA | 129 (21) | 6 (8) a | 3 (8) a | 116 (27) | 4 (5) | 1 (1) | 1 (2) | 0 (0) |
| Diuretic | 546 (88) | 48 (61) a | 27 (69) a | 400 (93) | 71 (96) | 7 (4) | 7 (16) | 0 (0) |
| Digoxin | 115 (19) | 1 (1) a | 6 (15) a | 83 (19) | 25 (34) | 0 (0) | 0 (0) | 0 (0) |
| Aspirin | 311 (50) | 37 (47) a | 17 (44) a | 220 (51) | 37 (50) | 43 (23) | 43 (96) | 0 (0) |
| Statin | 431 (69) | 46 (58) a | 23 (59) a | 310 (72) | 52 (70) | 44 (24) | 43 (96) | 1 (1) |
| Echocardiography | ||||||||
| EF, % | 38 [30–45] | 26 [22–36] | 57 [53–66] | 37 [30–41] | 55 [51–58] | 64 [60–68] | 66 [62–70] | 63 [60–68] |
| LVIDD, mm | 56 [50–61] | 59 [53–63] | 51 [45–53] | 57 [51–62] | 48 [44–52] | 48 [45–52] | 48 [44–49] | 48 [45–52] |
| Laboratory | ||||||||
| BNP, pg/mL | 378 [175–795] | 744 [442–1366] | 464 [340–619] | 328 [150–774] | 222 [129–450] | 28 [17–43] | 46 [22–67] | 25 [15–35] |
| Na+, mmol/L | 139 [137–140] | 137 [134–140] | 138 [135–139] | 139 [137–141] | 139 [137–141] | 139 [137–140] | 138 [137–140] | 139 [137–140] |
| Creatinine, μmol/L | 103 [82–130] | 100 [71–135] | 97 [74–132] | 105 [85–131] | 99 [81–124] | 70 [61–79] | 73 [66–89] | 67 [61–76] |
| eGFR, ml/min/1.73 m2 | 61 [44–76] | 67 [44–83] | 62 [38–76] | 60 [45–77] | 59 [48–71] | 88 [76–99] | 87 [75–102] | 88 [80–98] |
| Hb, g/L | 127 [115–140] | 124 [111–139] | 118 [105–133] | 129 [116–143] | 126 [113–134] | 139 [132–149] | 140 [132–149] | 139 [132–149] |
| AST, mmol/L | 21 [17–27] | 24 [18–33] | 22 [18–30] | 21 [17–26] | 20 [16–24] | 21 [18–25] | 23 [19–26] | 21 [18–24] |
| ALT, mmol/L | 18 [13–25] | 18 [13–34] | 21 [13–30] | 18 [13–25] | 17 [12–22] | 21 [17–27] | 22 [18–32] | 20 [16–25] |
| Bilirubin, mmol/L | 14 [8–16] | 17 [11–26] | 13 [10–21] | 11 [8–15] | 9 [7–13] | 9 [8–13] | 10 [7–13] | 9 [8–13] |
| Proteomics | ||||||||
| HF1 | 1.35 [0.63–2.19] | 1.92 [1.08–2.46] | 1.31 [0.40–2.40] | 1.30 [0.62–2.12] | 1.16 [0.30–1.94] | −0.93 [−1.61 to −0.40] | −0.06 [−0.57–0.52] | −1.24 [−1.71 to −0.76] |
Values are expressed as n (%) or median [inter‐quartile range]. HFrEF defined as ejection fraction < 50%.
ACEi, angiotensin converting enzyme inhibitor; ALT, alanine transaminase; ARB, angiotensin receptor agonist; AST, aspartate aminotransferase; BNP, B‐type natriuretic peptide; COPD, chronic obstructive pulmonary disease; CVA, cerebral vascular accident; EF, ejection fraction; eGFR, estimated glomerular filtration rate; Hb, haemoglobin; HF, heart failure; HFpEF, heart failure with preserved ejection fraction; HFrEF, heart failure with reduced ejection fraction; IHD, ischaemic heart disease; LVIDD, left ventricular internal diameter diastole; MRA, mineralocorticoid receptor antagonist; Na+, sodium; NYHA, New York Heart Association; SBP, systolic blood pressure; TIA, transient ischaemic attack.
Medication pre‐admission.
Of the patients with chronic HF, 430 (85%) had HFrEF; of those with acute HF, the number with HFrEF was 79 (67%). There was a stepwise increase in BNP concentration from healthy controls (who had the lowest median BNP at 26 pg/mL) to patients with acute HFrEF (who had the highest median concentration at 744 pg/mL).
The results of urinary proteomic analysis and application of the HF1 classifier are shown in Table 1 and Figure 1 . Patients with HF had higher values for HF1 than had both the CHD controls and healthy volunteers. Patients with acute HF (both HFrEF and HFpEF) had the highest levels of HF1 (higher than those of patients with chronic HF). Scatterplots of HF1 and BNP, EF, and left ventricular size are shown in Figure 2 . There were positive correlations between HF1 and BNP (r = 0.40, P < 0.001) and ventricular size, as measured by left ventricular end‐diastolic dimension (r = 0.32, P < 0.001) and an inverse correlation between HF1 and EF (r = −0.52, P < 0.001).
Figure 1.
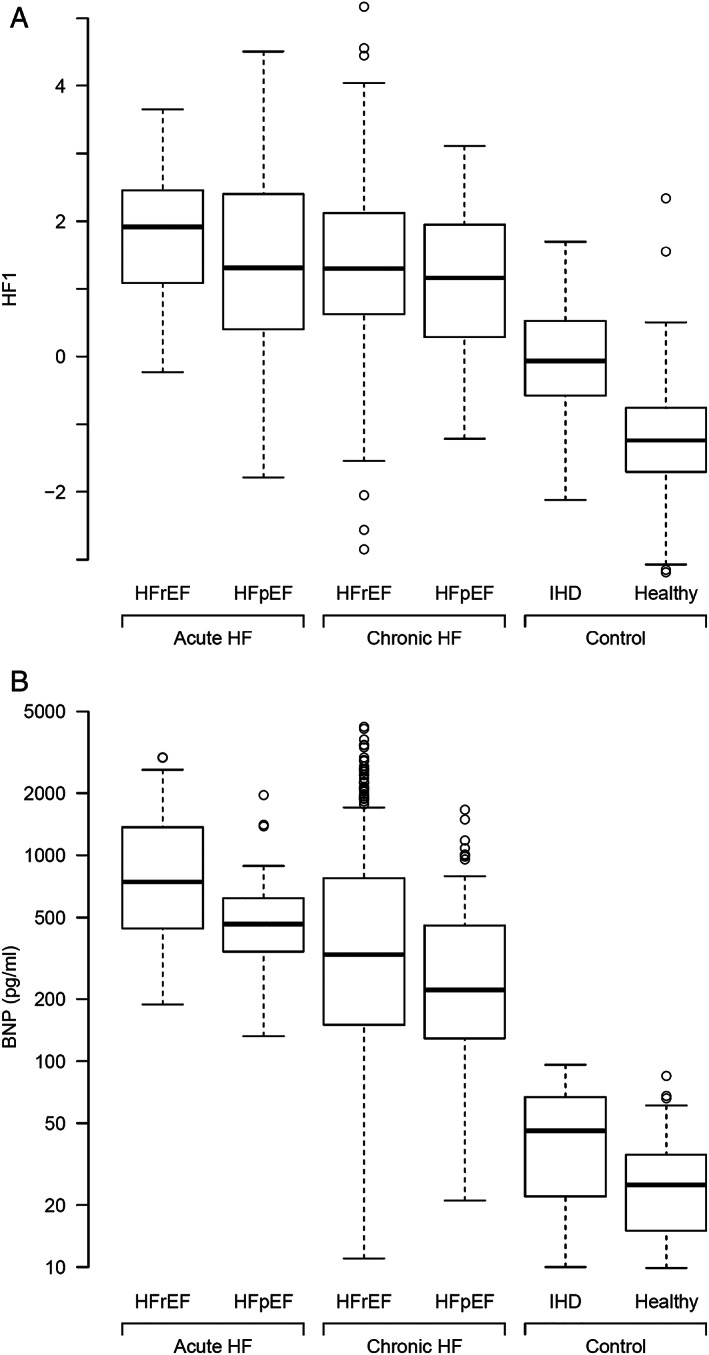
(A) Boxplots of HF1 urinary classifier by HF and control groups. HF1, heart failure 1 urinary proteomic classifier; HFpEF, heart failure with preserved ejection fraction; HFrEF, heart failure with reduced ejection fraction; IHD, ischaemic heart disease. (B) Boxplots of BNP by HF and control groups. BNP, B‐type natriuretic peptide; HFpEF, heart failure with preserved ejection fraction; HFrEF, heart failure with reduced ejection fraction; IHD, ischaemic heart disease.
Figure 2.
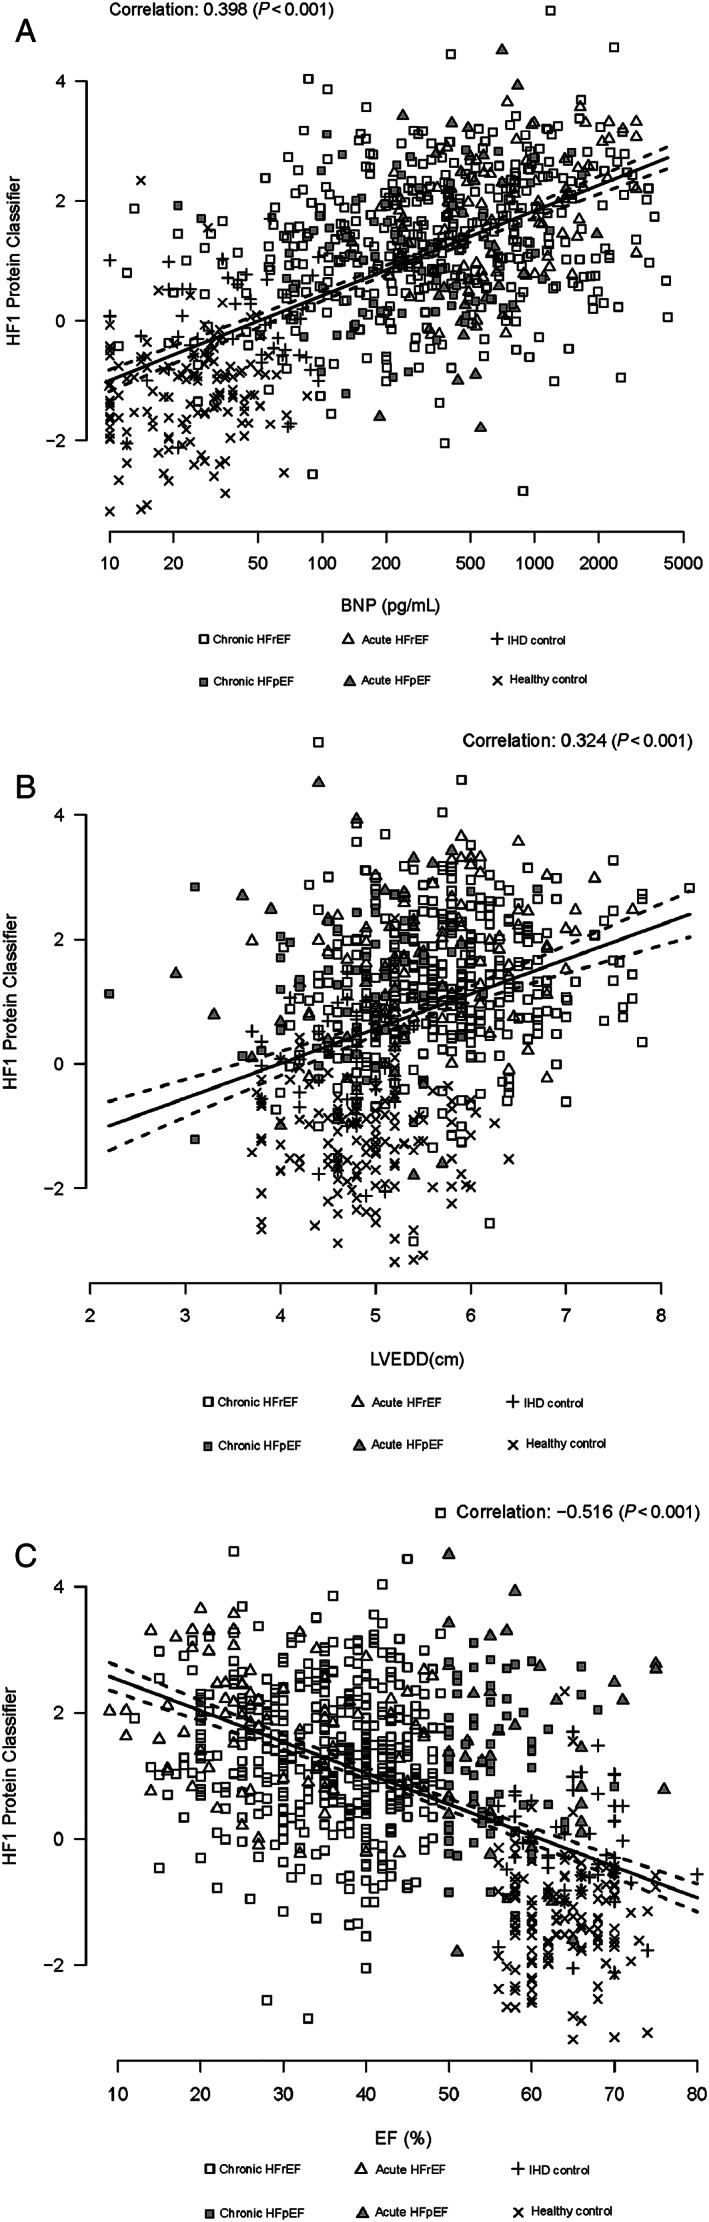
(A) Scatterplot HF1 and BNP. HF1, heart failure 1 urinary proteomic classifier; BNP, B‐type natriuretic peptide. Cases presented include acute and chronic HF and control subjects. (B) Scatterplot HF1 and LVEDD. HF1, heart failure 1 urinary proteomic classifier; LVEDD, left ventricular end‐diastolic dimension. Cases presented include acute and chronic HF, and control subjects. (C) Scatterplot HF1 and EF. HF1, heart failure 1 urinary proteomic classifier; EF, ejection fraction. Cases presented include acute and chronic HF and control subjects.
Diagnostic utility of HF1
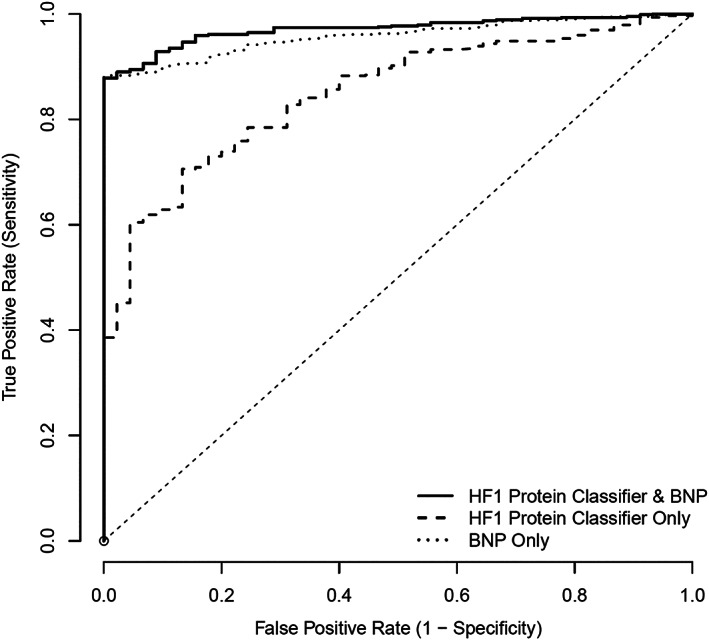
The ROC curve for HF1, comparing definite cases of HF with control participants (both CHD controls and healthy volunteers), is shown in Figure 3 . The area under the ROC (AUC) for HF1 was 0.94 (95% CI, 0.92–0.96). This compared with an AUC for BNP of 0.98 (95% CI, 0.97–0.99). Adding HF1 to BNP resulted in AUC of 0.99 (95% CI, 0.98–0.99). The addition of HF1 to BNP resulted in an NRI of 0.67 (95% CI, 0.54–0.78), P < 0.001.
Figure 3.
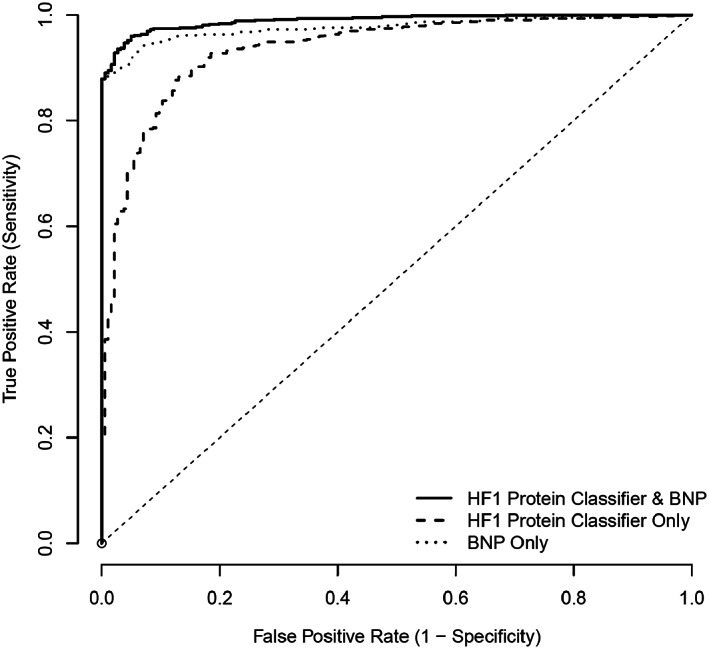
ROC for HF1 protein classifier, BNP, and HF1 + BNP: HF (both acute and chronic) vs. control (both CHD and healthy). BNP, B‐type natriuretic peptide; CHD, coronary heart disease; HF1, heart failure 1 urinary proteomic classifier; ROC, receiver operating characteristic.
When chronic HF cases (i.e. acute HF cases were excluded from analysis) were compared with controls only (Figure 4 ), the AUC for HF1 was 0.93 (95% CI, 0.91–0.95); the corresponding AUC for BNP was 0.97 (95% CI, 0.96–0.98). Adding HF1 to BNP resulted in an AUC of 0.99 (0.98–0.99). The addition of HF1 to BNP resulted in an NRI of 0.71 (0.58–0.84), P < 0.001.
Figure 4.
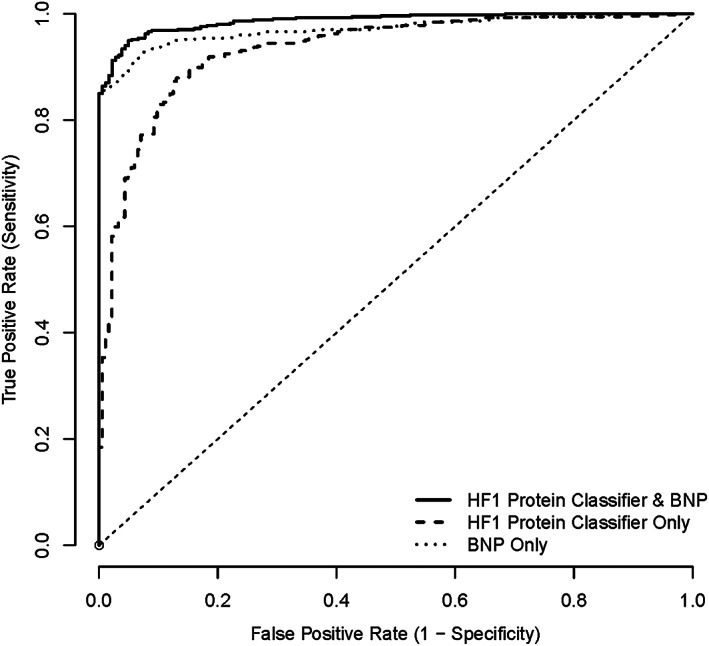
ROC for HF1 protein classifier, BNP, and HF1 + BNP: chronic HF vs. control (both CHD and healthy). BNP, B‐type natriuretic peptide; CHD, coronary heart disease; HF1, heart failure 1 urinary proteomic classifier; ROC, receiver operating characteristic.
When HF cases were compared with CHD controls only (Figure 5 ), the AUC for HF1 was 0.85 (95% CI, 0.80–0.90); the corresponding AUC for BNP was 0.96 (95% CI, 0.94–0.97). Adding HF1 to BNP resulted in an AUC of 0.97 (0.96–0.98). The addition of HF1 to BNP resulted in an NRI of 0.68 (0.40–0.97), P < 0.001.
Figure 5.
ROC for HF1 protein classifier, BNP, and HF1 + BNP: HF (both acute and chronic) vs. IHD control. BNP, B‐type natriuretic peptide; CHD, coronary heart disease; HF1, heart failure 1 urinary proteomic classifier; IHD, ischaemic heart disease; ROC, receiver operating characteristic.
Survival analysis
Of the 622 patients with HF, 433 patients provided consent to be followed up for vital status using long‐term record linkage. Follow‐up for vital status of the healthy and ischaemic heart disease controls was not available; and these subjects were therefore not included in the survival analyses. During a median follow‐up of 989 days, 186 patients died. Kaplan–Meier estimates of survival by tertile of HF1 are shown in Figure 6 , with a significant association between HF1 and mortality (P = 0.004). The additive value of HF1 to the MAGGIC prognostic risk score and to BNP is shown in Table 2 . HF1 did not retain prognostic predictive value in this cohort when added to either the MAGGIC risk score or BNP.
Figure 6.
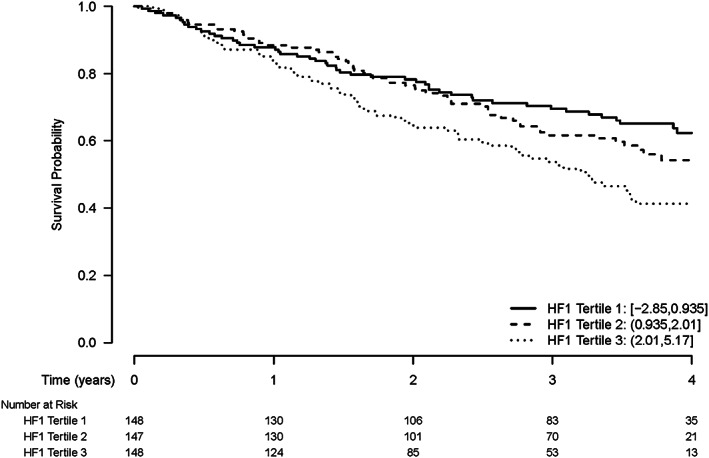
Kaplan–Meier estimates of time to death by tertile of HF1 protein classifier. Log Rank Test P‐value 0.004.
Table 2.
All‐cause mortality in univariable and multivariable analyses
| n | HR (95% CI) | P‐value | |
|---|---|---|---|
| Univariate analysis | |||
| MAGGIC risk score a | 440 | 1.10 (1.08–1.13) | <0.001 |
| LogBNP b | 443 | 1.53 (1.32–1.77) | <0.001 |
| HF1 b | 443 | 1.22 (1.05–1.42) | <0.001 |
| Multivariate analysis—MAGGIC + BNP | |||
| MAGGIC risk score a | 440 | 1.09 (1.06–1.12) | <0.001 |
| LogBNP b | 440 | 1.24 (1.06–1.45) | 0.008 |
| Multivariate analysis—MAGGIC + HF1 | |||
| MAGGIC risk score a | 440 | 1.10 (1.07–1.13) | <0.001 |
| HF1 b | 440 | 1.02 (0.89–1.17) | 0.750 |
| Multivariate analysis—BNP + HF1 | |||
| LogBNP b | 443 | 1.49 (1.28–1.73) | <0.001 |
| HF1 b | 443 | 1.07 (0.95–1.24) | 0.211 |
P‐values derived from a Cox proportional hazards model.
CI, confidence interval; HR, hazard ratio; HF1, heart failure protein classifier 1; MAGGIC, Meta‐analysis Global Group in Chronic Heart Failure.
Per unit increase.
Per 1 standard deviation increase.
Discussion
We describe the diagnostic and prognostic performance and potential utility of a novel urinary proteomic panel, HF1, in a large cohort of patents with HF, compared with healthy and CHD controls.
The first important observation from our study is the similarity in diagnostic utility of HF1 and BNP. The high AUC for BNP in our study is similar to that reported in previous studies assessing the diagnostic utility of BNP. In the Breathing Not Properly study, where 1586 patients who presented to an emergency department with acute dyspnoea had BNP analysed and a clinical diagnosis of HF was adjudicated by two cardiologists, BNP had an AUC of 0.91 (95% CI, 0.90–0.93). 16 An elevated BNP of >100 pg/mL was the strongest independent predictor of having a diagnosis of HF, with an odds ratio of 30. Similarly, high AUCs have been reported for N‐terminal pro‐BNP (NT‐proBNP), for example, in the ProBNP Investigation of Dyspnea in the Emergency department study (PRIDE), where 600 patients presenting with acute dyspnoea had NT‐proBNP assessed. 17 The AUC for NT‐proBNP in PRIDE was 0.94, and again elevated NT‐proBNP was the strongest predictor of a diagnosis of HF with an odds ratio of 44. The AUC in the present study was probably particularly high because we used BNP to include and exclude participants; that is, patients with HF had to have an elevated BNP, and normal controls a low BNP, to be eligible. 7 , 8 Because of this, HF1 was at a potential disadvantage, yet had a similar AUC to BNP and was additive when combined with BNP, with the combined AUC reaching 0.99.
The peptides in HF1 sequenced to date are not related to BNP and mainly reflect collagen fragments. 2 This is supported by the moderate association between BNP and HF1, and the additive value of this proteomic panel to BNP. HF1 is therefore a marker of a different aspect of the disease process in HF. Where BNP is a compensatory up‐regulated mechanism, with BNP released in response to volume expansion and/or pressure overload resulting in increased wall stress, HF1 probably reflects changes in the extracellular matrix and, therefore, interstitial fibrosis. 2 Although HF is a clinical syndrome, with a multitude of causes and different clinical phenotypes, myocardial interstitial fibrosis is a common pathophysiological process in most, if not all, of these. 18 Future studies should build upon our findings by assessing the association between the proteomic classifier HF1 and direct and indirect markers of myocardial interstitial fibrosis such as endomyocardial biopsy and cardiac magnetic resonance (CMR) imaging.
Myocardial interstitial fibrosis is associated with worse clinical outcomes in patients with HFrEF and HFpEF. 19 , 20 Therefore, the proteomic marker HF1 should also have been associated with poorer prognosis in our cohort. This is what we found, although the relationship between HF1 and prognosis was not as strong as that with diagnosis. Although HF1 was an independent predictor of all‐cause mortality, it had a lower predictive value to BNP for all‐cause mortality and did not add prognostic information when combined with BNP. Neither BNP nor HF1 improved upon the prognostic information provided by the MAGGIC risk score. So our findings suggest that, in terms of prognosis, HF1 may be an alternative to BNP but has no added value. Further studies in larger cohorts are required to assess the predictive value of HF1 with more confidence.
Study strengths and limitations
The strengths of our study were that the different cohorts of HF patients and controls were enrolled at a single investigative centre and each participant had a BNP level assayed and an echocardiographic measurement of EF using the Simpson biplane method. Both acute and chronic HF patients were included in our analysis as were patients with HFpEF and HFrEF. Limitations included that this was a retrospective analysis. Although a detailed echocardiogram was performed in each patient, only one measure of function (EF) and one measure of remodelling (left ventricular size) were included in the analysis. Further studies utilizing more advanced imaging techniques, such as myocardial strain or extracellular volume, using echocardiography and CMR, would provide further insights into the potential source of high HF1 in patients with HF. We studied only one clinical outcome, all‐cause death; and cardiac biomarkers may not predict all‐cause mortality as well as death due to cardiovascular causes. We did not have information of HF hospitalization, which is also predicted well by most cardiac biomarkers.
Although efforts were made to collect urine samples on the same day as other study assessments, this may not have been the case for every participant, although this was not recorded. There was no standard operating procedure for collection of urine; specifically, there were no requirements made for an early‐morning or mid‐stream sample. Although urinary peptides undergo changes throughout the day, by using a urinary proteomic classifier composed of multiple peptide (such as in our study), variance based on time of sample is reduced to non‐significant levels. 13
Conclusions
The urinary proteomic classifier HF1 is a novel biomarker that discriminates between patients with HF and both healthy controls and patients with CHD but no HF. Diagnostically, HF1 performed as well as BNP and provided incremental diagnostic information when added to BNP. HF1 also predicted all‐cause mortality but did not do this better than BNP or add to the prognostic value of BNP.
Conflict of interest
H.M. is the founder and co‐owner of Mosaiques Diagnostics, which developed the CE‐MS technology for clinical application. E.N‐K. and A.L. are employed by Mosaiques Diagnostics.
Funding
One cohort study was supported by funding from British Heart Foundation project grant, grant number PG/13/17/30050, and another by a Scottish Executive Chief Scientist Office project, grant number CZH/4/439. J.C. was supported by a fellowship from the British Society of Heart Failure. Funding to H.M. and E.N‐K. was provided by the European Commission via the HOMAGE project (HEALTH‐FP7‐305507). C.D. and J.J.V.M. are supported by a British Heart Foundation Centre of Research Excellence Award (reference numbers RE/13/5/30177 and RE/18/6/34217).
Supporting information
Table S1. Univariate Cox model ‐ time to death: MAGGIC risk score.
Table S2. Univariate Cox model ‐ time to death: log (BNP).
Table S3. Univariate Cox model ‐ time to death: HF1.
Table S4. Multivariable Cox model ‐ time to death: MAGGIC risk score and log (BNP) continuous.
Table S5. Multivariable Cox model ‐ time to death: MAGGIC risk score and HF1 continuous.
Table S6. Multivariable Cox model ‐ time to death: log (BNP) and HF1 continuous.
Campbell, R. T. , Jasilek, A. , Mischak, H. , Nkuipou‐Kenfack, E. , Latosinska, A. , Welsh, P. I. , Jackson, C. E. , Cannon, J. , McConnachie, A. , Delles, C. , and McMurray, J. J. V. (2020) The novel urinary proteomic classifier HF1 has similar diagnostic and prognostic utility to BNP in heart failure. ESC Heart Failure, 7: 1595–1604. 10.1002/ehf2.12708.
References
- 1. Ponikowski P, Voors AA, Anker SD, Bueno H, Cleland JGF, Coats AJS, Falk V, González‐Juanatey JR, Harjola V‐P, Jankowska EA, Jessup M, Linde C, Nihoyannopoulos P, Parissis JT, Pieske B, Riley JP, Rosano GMC, Ruilope LM, Ruschitzka F, Rutten FH, van der Meer P, Authors/Task Force Members, Document Reviewers . 2016 ESC Guidelines for the diagnosis and treatment of acute and chronic heart failure: The Task Force for the diagnosis and treatment of acute and chronic heart failure of the European Society of Cardiology (ESC). Developed with the special contribution. Eur J Heart Fail 2016; 18: 891–975. [DOI] [PubMed] [Google Scholar]
- 2. Kuznetsova T, Mischak H, Mullen W, Staessen JA. Urinary proteome analysis in hypertensive patients with left ventricular diastolic dysfunction. Eur Heart J 2012; 33: 2342–2350. [DOI] [PMC free article] [PubMed] [Google Scholar]
- 3. Zhang Z, Staessen JA, Thijs L, Gu Y, Liu Y, Jacobs L, Koeck T, Zürbig P, Mischak H, Kuznetsova T. Left ventricular diastolic function in relation to the urinary proteome: a proof‐of‐concept study in a general population. Int J Cardiol The Authors 2014; 176: 158–165. [DOI] [PMC free article] [PubMed] [Google Scholar]
- 4. Dickstein K, Cohen‐Solal A, Filippatos G, McMurray JJV, Ponikowski P, Poole‐Wilson PA, Stromberg A, van Veldhuisen DJ, Atar D, Hoes AW, Keren A, Mebazaa A, Nieminen M, Priori SG, Swedberg K, Vahanian A, Camm J, De Caterina R, Dean V, Dickstein K, Filippatos G, Funck‐Brentano C, Hellemans I, Kristensen SD, McGregor K, Sechtem U, Silber S, Tendera M, Widimsky P, Zamorano JL, ESC Committee for Practice Guidelines (CPG), Document Reviewers . ESC Guidelines for the diagnosis and treatment of acute and chronic heart failure 2008: The Task Force for the Diagnosis and Treatment of Acute and Chronic Heart Failure 2008 of the European Society of Cardiology. Developed in collaboration with the Heart. Eur Heart J 2008; 29: 2388–2442. [DOI] [PubMed] [Google Scholar]
- 5. McMurray JJV, Adamopoulos S, Anker SD, Auricchio A, Böhm M, Dickstein K, Falk V, Filippatos G, Fonseca C, Gomez‐Sanchez MA, Jaarsma T, Køber L, Lip GYH, Pietro MA, Parkhomenko A, Pieske BM, Popescu BA, Rønnevik PK, Rutten FH, Schwitter J, Seferovic P, Stepinska J, Trindade PT, Voors AA, Zannad F, Zeiher A. ESC Guidelines for the diagnosis and treatment of acute and chronic heart failure 2012: The Task Force for the Diagnosis and Treatment of Acute and Chronic Heart Failure 2012 of the European Society of Cardiology. Developed in collaboration with the Heart. Eur Heart J 2012; 33: 1787–1847. [DOI] [PubMed] [Google Scholar]
- 6. Cannon JA. Cognitive Impairment in Heart Failure. University of Glasgow; 2016. [Google Scholar]
- 7. Jackson CE, Myles RC, Tsorlalis IK, Dalzell JR, Spooner RJ, Rodgers JR, Bezlyak V, Greenlaw N, Ford I, Cobbe SM, Petrie MC, McMurray JJV. Profile of microvolt T‐wave alternans testing in 1003 patients hospitalized with heart failure. Eur J Heart Fail 2012; 14: 377–386. [DOI] [PubMed] [Google Scholar]
- 8. Campbell RT, Petrie MC, Jackson CE, Jhund PS, Wright A, Gardner RS, Sonecki P, Pozzi A, McSkimming P, McConnachie A, Finlay F, Davidson P, Denvir MA, Johnson MJ, Hogg KJ, McMurray JJV. Which patients with heart failure should receive specialist palliative care? Eur J Heart Fail 2018: 1–10. [DOI] [PMC free article] [PubMed] [Google Scholar]
- 9. Campbell RT, Jackson CE, Wright A, Gardner RS, Ford I, Davidson PM, Denvir MA, Hogg KJ, Johnson MJ, Petrie MC, McMurray JJV. Palliative care needs in patients hospitalized with heart failure (PCHF) study: rationale and design. ESC Hear Fail 2015; 2: 25–36. [DOI] [PMC free article] [PubMed] [Google Scholar]
- 10. Lang RM, Bierig M, Devereux RB, Flachskampf F, Foster E, Pellikka P, Picard MH, Roman MJ, Seward J, Shanewise JS, Solomon SD, Spencer KT, Sutton MSJ, Stewart WJ. Recommendations for chamber quantification: a report from the American Society of Echocardiography's Guidelines and Standards Committee and the Chamber Quantification Writing Group, developed in conjunction with the European Association of Echocardiograph. J Am Soc Echocardiogr 2005; 18: 1440–1463. [DOI] [PubMed] [Google Scholar]
- 11. Theodorescu D, Wittke S, Ross MM, Walden M, Conaway M, Just I, Mischak H, Frierson HF. Discovery and validation of new protein biomarkers for urothelial cancer: a prospective analysis. Lancet Oncol 2006; 7: 230–240. [DOI] [PubMed] [Google Scholar]
- 12. Wittke S, Mischak H, Walden M, Kolch W, Rädler T, Wiedemann K. Discovery of biomarkers in human urine and cerebrospinal fluid by capillary electrophoresis coupled to mass spectrometry: towards new diagnostic and therapeutic approaches. Electrophoresis 2005; 26: 1476–1487. [DOI] [PubMed] [Google Scholar]
- 13. Mischak H, Vlahou A, Ioannidis JPA. Technical aspects and inter‐laboratory variability in native peptide profiling: the CE‐MS experience. Clin Biochem Elsevier B.V. 2013; 46: 432–443. [DOI] [PubMed] [Google Scholar]
- 14. MacIntyre K, Capewell S, Stewart S, Chalmers JW, Boyd J, Finlayson A, Redpath A, Pell JP, McMurray JJ. Evidence of improving prognosis in heart failure: trends in case fatality in 66 547 patients hospitalized between 1986 and 1995. Circulation 2000; 102: 1126–1131. [DOI] [PubMed] [Google Scholar]
- 15. Meta‐analysis Global Group in Chronic Heart Failure (MAGGIC) . The survival of patients with heart failure with preserved or reduced left ventricular ejection fraction: an individual patient data meta‐analysis. Eur Heart J 2012; 33: 1750–1757. [DOI] [PubMed] [Google Scholar]
- 16. Maisel AS, Krishnaswamy P, Nowak RM, McCord J, Hollander JE, Duc P, Omland T, Storrow AB, Abraham WT, Wu AHB, Clopton P, Steg PG, Westheim A, Knudsen CW, Perez A, Kazanegra R, Herrmann HC, McCullough PA. Rapid measurement of B‐type natriuretic peptide in the emergency diagnosis of heart failure. N Engl J Med 2002; 347: 161–167. [DOI] [PubMed] [Google Scholar]
- 17. Januzzi JL, Camargo CA, Anwaruddin S, Baggish AL, Chen AA, Krauser DG, Tung R, Cameron R, Nagurney JT, Chae CU, Lloyd‐Jones DM, Brown DF, Foran‐Melanson S, Sluss PM, Lee‐Lewandrowski E, Lewandrowski KB. The N‐terminal Pro‐BNP investigation of dyspnea in the emergency department (PRIDE) study. Am J Cardiol 2005; 95: 948–954. [DOI] [PubMed] [Google Scholar]
- 18. González A, Schelbert EB, Díez J, Butler J. Myocardial interstitial fibrosis in heart failure: biological and translational perspectives. J Am Coll Cardiol 2018; 71: 1696–1706. [DOI] [PubMed] [Google Scholar]
- 19. Gulati A, Jabbour A, Ismail TF, Guha K, Khwaja J, Raza S, Morarji K, Brown TDH, Ismail NA, Dweck MR, Pietro, E , Di Roughton M, Wage R, Daryani Y, O'Hanlon R, Sheppard MN, Alpendurada F, Lyon AR, Cook SA, Cowie MR, Assomull RG, Pennell DJ, Prasad SK. Association of fibrosis with mortality and sudden cardiac death in patients with nonischemic dilated cardiomyopathy JAMA 2013;309:896. [DOI] [PubMed] [Google Scholar]
- 20. Schelbert EB, Fridman Y, Wong TC, Abu Daya H, Piehler KM, Kadakkal A, Miller CA, Ugander M, Maanja M, Kellman P, Shah DJ, Abebe KZ, Simon MA, Quarta G, Senni M, Butler J, Diez J, Redfield MM, Gheorghiade M. Temporal relation between myocardial fibrosis and heart failure with preserved ejection fraction: association with baseline disease severity and subsequent outcome. JAMA Cardiol 2017; 2: 995–1006. [DOI] [PMC free article] [PubMed] [Google Scholar]
Associated Data
This section collects any data citations, data availability statements, or supplementary materials included in this article.
Supplementary Materials
Table S1. Univariate Cox model ‐ time to death: MAGGIC risk score.
Table S2. Univariate Cox model ‐ time to death: log (BNP).
Table S3. Univariate Cox model ‐ time to death: HF1.
Table S4. Multivariable Cox model ‐ time to death: MAGGIC risk score and log (BNP) continuous.
Table S5. Multivariable Cox model ‐ time to death: MAGGIC risk score and HF1 continuous.
Table S6. Multivariable Cox model ‐ time to death: log (BNP) and HF1 continuous.