

Abstract
Aims
Hypokinetic non‐dilated cardiomyopathy (HNDC), which is determined by impaired left ventricular (LV) systolic function despite normal LV size, has been categorized as a subgroup of dilated cardiomyopathy (DCM) spectrum. Lack of data regarding advanced echocardiographic data in this population motivated us to design the present study in order to assess LV myocardial deformation properties of HNDC patients against the ones with dilated left ventricle.
Methods and results
Thirty‐one HNDC patients and 23 DCM patients were enrolled in the study consecutively. Myocardial deformation parameters including global longitudinal strain, global circumferential strain, LV basal and apical rotation, LV twist, and LV mechanical dispersion were obtained with the use of two‐dimensional speckle tracking‐based methods in all patients. Left cardiac chamber volume was also measured using three‐dimensional HeartModel application. Patients with enlarged left ventricle tend to have lower LV ejection fraction. Comparing with HNDC group, DCM patients showed worse global circumferential strain (coefficient ± standard error 3.59 ± 0.94, P < 0.001) and LV mechanical dispersion (coefficient ± standard error 16.46 ± 7.09, P = 0.02) after regression analysis, while neither the global longitudinal strain nor the LV twist was not significantly different between two study population.
Conclusions
Left ventricular enlargement has a substantial effect on the circumferential strain and mechanical dispersion more than other deformation parameters that may play a role in the assumed poor prognosis of heart failure patients with dilated left ventricle.
Keywords: HNDC (hypokinetic non‐dilated cardiomyopathy), DCM (dilated cardiomyopathy), Speckle tracking echocardiography, GLS (global longitudinal strain), GCS (global circumferential strain), Left ventricular mechanical dispersion
Introduction
Idiopathic dilated cardiomyopathy (DCM), the most frequently diagnosed phenotype in cardiomyopathies classification, 1 has been described as left ventricular (LV) dilation and dysfunction in the absence of abnormal loading conditions or coronary artery disease. 2 Knowing that LV contractile dysfunction with normal LV size is not an uncommon finding that has been introduced as mildly dilated congestive cardiomyopathy (MDCM) before, 3 the European Society of Cardiology described a new clinical spectrum of DCM with a novel category called hypokinetic non‐dilated cardiomyopathy (HNDC) characterized by LV global hypokinesia [LV ejection fraction (LVEF) < 45%] despite normal LV size. 2
Estimating the prevalence of HNDC (ranging from 0.9% to 1.9%) in general population 4 and the extent of HNDC presentation in DCM spectrum (35%) 5 underscores the necessity to investigate more clinical and echocardiographic features of this disease.
More recently, few studies have underlined not only the prognosis and long‐term survival of patients with HNDC 5 , 6 , 7 but also their genetic parameters. 8 Nevertheless, little is still known about this condition, particularly echocardiographic characteristics.
Therefore, the lack of data regarding advanced echocardiographic parameters in patients with HNDC motivated us to design this study as this knowledge would lead to a better conception of the nature of the disease and its outcomes as against DCM patients.
Methods
Study population and study design
Hypokinetic non‐dilated cardiomyopathy defined as patients with (i) LVEF < 45% confirmed either by using both three‐dimensional transthoracic echocardiography (3D‐TTE) and cardiac magnetic resonance (CMR) imaging or by 3D‐TTE alone on two distinct occasions and (ii) LV end‐diastolic volume index (LVEDVI) of no more than two standard deviations above the mean in normal population, determined by LVEDVI ≤ 75 mL/m2 for men and LVEDVI ≤ 68 mL/m2 in women obtained from Iranian subpopulation according to the results of the World Alliance of Societies of Echocardiography Normal Values Study. 9 Ischaemic cardiomyopathy had been excluded in all patients using coronary angiography or coronary computed tomography angiography beforehand.
In this study, individuals with LV dysfunction arising from any abnormal loading conditions (i.e. history of severe hypertension, valvular heart disease, or congenital heart disease) were excluded. Other exclusion criteria involved patients with a history of tachycardia‐induced cardiomyopathy, atrial fibrillation rhythm, drug‐induced cardiomyopathy, LV non‐compaction cardiomyopathy, pacemaker or cardiac resynchronization therapy implantation that may interfere with echocardiographic data, and patients with CMR‐proven myocarditis or clinical suspicion of myocarditis.
Ultimately from among heart failure (HF) patients referred to Shahid Rajaie Cardiovascular, Medical & Research Center, Tehran, Iran, from March 2018 to March 2019, for their routine follow‐up appointments, 31 patients who met the HNDC criteria were enrolled in the study consecutively. For comparative purposes, 23 DCM patients with LV dilation were also included.
The investigation conforms with the principles outlined in the Declaration of Helsinki. 10 Our study was approved by Rajaie Center institutional review board, and all patients voluntarily signed the informed consent form.
Echocardiography
All the 54 patients underwent comprehensive two‐dimensional (2D) TTE and 3D‐TTE by a single fellow of echocardiography using a Philips EPIQ7 ultrasound system for cardiology (Philips Ultrasound, Bothell, WA, USA) equipped with xMATRIX probe.
Echocardiographic clips were recorded at three consecutive cardiac cycles. Afterwards, analyses were performed offline using QLab, Version 10 (Philips Ultrasound), by two cardiologists separately who were both fellows of advanced echocardiography.
Conventional two‐dimensional and speckle tracking echocardiography
Left ventricular end‐diastolic diameter measurement was performed in the basal portion of the left ventricle in the parasternal long‐axis view. Also, LV end‐diastolic volume (LVEDV), LV end‐systolic volume, LVEF, and left atrial (LA) volume were calculated by biplane Simpson's method using apical four‐chamber (A4C) and two‐chamber views. LV volumes and dimensions and also LA volume were all indexed to body surface area.
Positioning pulsed wave Doppler at the tip of mitral valve leaflets in the left ventricle during diastole, mitral inflow velocities were recorded from A4C view. E/A ratio was calculated using the measured peak early diastole (E) and late diastole (A) velocities. On the other hand, by activating pulsed wave tissue Doppler, isovolumetric contraction time (ICT), isovolumetric relaxation time (IRT), and ejection time (ET) were obtained to evaluate myocardial performance index (MPI) by applying formula. Pulsed wave tissue Doppler (PWTD) velocities of medial and lateral mitral annulus (LV S′, septal and lateral e′ velocities), as well as tricuspid lateral annulus (reduced vertical separation minima) were recorded to obtain E/e′ ratio, dividing E by averaged e′. Evaluation of LV diastolic dysfunction was conducted based on the latest American Society of Echocardiography LV diastolic function guideline. 11
Two‐dimensional speckle tracking was performed semi‐automatically in the A4C, apical three‐chamber, and apical two‐chamber views by manual positioning of two mitral annular points and one apical point in the end‐systolic frame at frame rate between 50 and 70 frames per second. Region of interest was subsequently adjusted to cover the entire myocardial thickening. Myocardial segments affected by shadow or artefact, if existed, were excluded from the analyses.
Peak systolic longitudinal strain values were recorded for each segment in the form of 18‐segment bull's eye and global longitudinal strain (GLS) was obtained as the mean value of three apical projections. To measure mechanical dispersion, which shows heterogeneity of myocardial contraction, standard deviation of the 18 different time intervals to maximum myocardial shortenings in longitudinal strain curves was used.
In the following, global circumferential strain (GCS) was calculated from LV short‐axis views at three different levels (i.e. basal, mid, and apical) (Figure 1 ). Basal and apical rotations were consecutively measured from the angular displacement of basal and apical segments along the central axis. Conventionally, counterclockwise rotation is considered as positive, while clockwise rotation shows negative degrees. LV twist was computed from the net difference between apical and basal rotation values.
Figure 1.
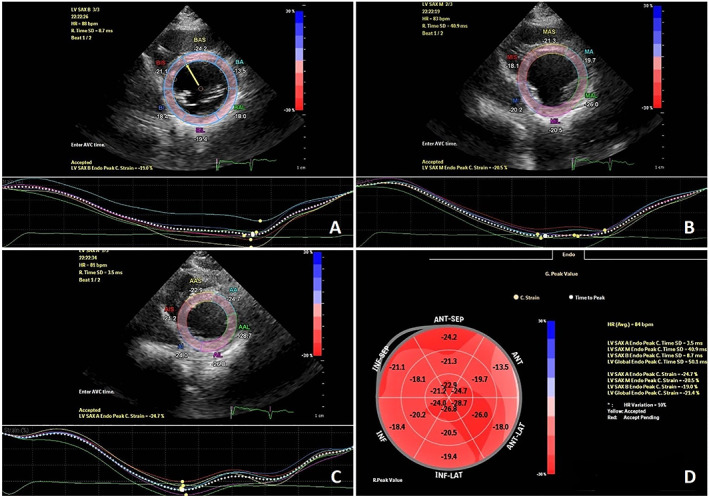
Global circumferential strain measuring from three standard short‐axis views in a patient affected by hypokinetic non‐dilated cardiomyopathy. (A)–(C) show circumferential strain at basal, mid, and apical levels of left ventricle, respectively (D) represents the circumferential strain bullseye plot with respect to the 18‐segment left ventricular model.
Three‐dimensional echocardiography
Image was acquired in A4C view using HeartModel application to have a 3D volume with the left ventricle and the left atrium at the centre of the display. LV borders were detected automatically by the HeartModel segmentation algorithm at both end‐systolic and end‐diastolic frames, whereas LA volume was measured at end‐systolic frame. Border locations were corrected in all apical views, using regional edit option, leading to accurate estimation of LVEDV, LV end‐systolic volume, LA volume, and LVEF (Figure 2 ).
Figure 2.
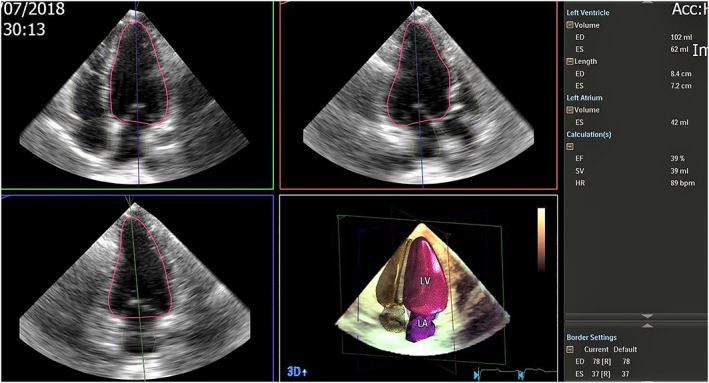
Accurate measurement of left ventricular volumes and left ventricular ejection fraction using three‐dimensional (3D) HeartModel echocardiography. ED. end‐diastolic; ES, end‐systolic; HR, heart rate.
Statistical analysis
Statistical analyses were performed using IBM SPSS Statistics® for Windows 20 (IBM Inc., Armonk, NY, USA). One‐sample Kolmogorov–Smirnov test was used to evaluate normal distribution of interval variables. Categorical variables were presented as count (percentage). Continuous data were described as median and inter‐quartile range. Categorical data were compared between two groups using χ 2 test, and for continuous data, Mann–Whitney U test was applied for comparison between two groups. The Spearman correlation coefficient was applied to measure the linear correlation between strain parameters and LVEF in both groups. Interclass correlation coefficient was used to measure the agreement of the two echocardiographic methods (2D and 3D). Multiple linear regression models were applied to evaluate whether there are constant predictors between the two cardiomyopathy groups after adjustment for LVEF, hospital admissions, and left bundle branch block (LBBB). Interclass correlation coefficient (ICC) was measured to obtain interobserver and intraobserver reliability. P‐values less than 0.05 were considered statistically significant.
Results
Fifty‐four patients (31 HNDC and 23 DCM patients) who fulfilled the study criteria were enrolled in the study. Baseline clinical characteristics of all patients are summarized in Table 1 . The majority of HNDC patients were in New York Heart Association (NYHA) Class I or II (83.8%) with median age of diagnosis 43 years and inter‐quartile range of 32 to 54 years old and male predominance (58.1%). Respectively, 19.4% and 30.4% of HNDC and DCM patients reported a positive family history of the disease (P‐value = 0.34). Furthermore, 61.3% of the patients with HNDC vs. 43.5% of the DCM patients had undergone CMR during the course of their disease (P‐value = 0.19).
Table 1.
Baseline clinical characteristics for HNDC and DCM patients
| Characteristics | HNDC (n = 31) | DCM (n = 23) | All patients (N = 54) | P‐value |
|---|---|---|---|---|
| Male | 18 (58.1) | 8 (34.8) | 26 (48.1) | 0.09 |
| Age (years) | 47 (33, 57) | 49 (41, 55) | 47 (36, 55) | 0.80 |
| Age of diagnosis (years) | 43 (32, 54) | 45 (37, 50) | 43 (33, 51) | 0.80 |
| NYHA class | 0.97 | |||
| I | 9 (29.0) | 7 (30.4) | 16 (29.6) | |
| II | 17 (54.8) | 12 (52.2) | 29 (53.7) | |
| III | 5 (16.1) | 3 (13.0) | 8 (14.8) | |
| IV | 0 (0.0) | 1 (4.3) | 1 (1.9) | |
| Positive family history | 6 (19.4) | 7 (30.4) | 13 (24.1) | 0.34 |
| Heart medication | ||||
| Beta‐blocker | 24 (77.4) | 21 (91.3) | 45 (83.3) | 0.17 |
| RAS blockade | 25 (80.0) | 19 (86.3) | 44 (81.4) | 0.83 |
| Loop diuretics | 9 (29.0) | 10 (43.5) | 19 (35.2) | 0.27 |
| Aldosterone receptor antagonists | 18 (58.1) | 17 (73.9) | 35 (64.8) | 0.22 |
| HF‐associated hospitalization | 0.03 | |||
| 0 | 28 (90.3) | 15 (65.2) | 43 (79.6) | |
| 1 | 2 (6.5) | 7 (30.4) | 9 (16.7) | |
| 2 | 1 (3.2) | 1 (4.3) | 2 (3.7) | |
| ECG | ||||
| LBBB | 5 (16.1) | 10 (43.5) | 15 (27.8) | 0.06 |
| Incomplete LBBB | 2 (6.5) | 2 (8.7) | 4 (7.4) | |
| RBBB | 1 (3.2) | 1 (4.3) | 2 (3.7) | 0.82 |
| CMR | 19 (61.3) | 10 (43.5) | 29 (53.7) | 0.19 |
| ICD | 2 (6.5) | 2 (8.7) | 4 (7.4) | 0.75 |
CMR, cardiac magnetic resonance; DCM, dilated cardiomyopathy; ECG, electrocardiogram; HF, heart failure; HNDC, hypokinetic non‐dilated cardiomyopathy; ICD, implantable cardioverter defibrillator; LBBB, left bundle branch block; NYHA, New York Heart Association; RAS, renin–angiotensin system; RBBB, right bundle branch block.
Values are median (P 25, P 75) or n (%).
HNDC and DCM patient groups were not statistically different in terms of sex, age, NYHA class, or heart medications, except in cases of hospitalization that DCM patients, compared with the HNDC group, needed more hospital admissions (34.7% vs. 9.7%, P‐value = 0.03).
The median time since diagnosis in study population was 46 months, and inter‐quartile range of 32 to 58 months was obtained from their datasheet. We have made sure that patients had not shown any substantial changes in LV size in both groups during the course of the disease, not evolving from one group to another.
Concerning echocardiographic data, LVEF, E/e′ average, LV S′, LVMPI, and LA volume index as well as GCS, GLS, LV twist, LV apical rotation, and LV mechanical dispersion from among speckle tracking parameters demonstrated significant statistical difference between two groups such that DCM cases manifested worse findings regarding to mentioned parameters (Tables 2 and 3 ). Interestingly, we found no HNDC patient with an LVEF below 30%, and all were in mild or moderate HF categories.
Table 2.
Univariate and multivariate results of conventional echocardiography and 3D echocardiographic parameters of HNDC and DCM patients
| Echocardiographic parameters | HNDC | DCM | P‐value | Coefficient ± SE | P‐value |
|---|---|---|---|---|---|
| LVEF by 3DHM (%) | 39 (34, 43) | 35 (24, 39) | 0.008 | ||
| LVEF by 2D Simpson method (%) | 40 (35, 42) | 36 (26, 39) | 0.01 | ||
| LVEDDI (cm/m2) | 2.7 (2.59, 2.9) | 3.35 (3.0, 3.8) | <0.001 | ||
| LVEDVI by 3DHM (mL/m2) | 60.0 (56.0, 66.3) | 85.1 (75.0, 120.1) | <0.001 | ||
| LVEDVI by 2D Simpson method (mL/m2) | 58.8 (53.0, 64.0) | 83.2 (74.0, 109.9) | <0.001 | ||
| LVESVI by 3DHM (mL/m2) | 37.2 (33.3, 41.0) | 53.6 (48.9, 87.5) | <0.001 | ||
| LVESVI by 2D Simpson method (mL/m2) | 35.8 (30.8, 38.5) | 53.3 (46.4, 84.2) | <0.001 | ||
| LAVI by 3DHM (mL/m2) | 22.7 (18.2, 24.8) | 25.9 (19.4, 34.3) | 0.01 | 3.97 ± 2.10 | 0.06 |
| LAVI by 2D Simpson method (mL/m2) | 19.9 (16.9, 22.9) | 26.6 (20.0, 34.8) | 0.007 | 4.32 ± 1.90 | 0.02 |
| LVOT VTI (cm) | 16.0 (13.8, 17.2) | 15.4 (12.9, 18.2) | 0.88 | ||
| RVOT VTI (cm) | 13.3 (11.8, 15.0) | 12.7 (11.0, 14.7) | 0.39 | ||
| SPAP (mmHg) | 25.0 (20.0, 30.0) | 25.5 (20.7, 30.2) | 0.25 | ||
| E/A | 1.0 (0.7, 1.2) | 1.0 (0.7, 1.6) | 0.44 | ||
| E/e′ avg. | 6.5 (4.9, 8.4) | 9.6 (6.7, 13.0) | 0.005 | 1.41 ± 0.83 | 0.09 |
| Diastolic dysfunction ≥GII | 3 (9.7) | 3 (15.8) | 0.5 | ||
| LV S′ (cm/s) | 6.3 (5.5, 7.0) | 5.4 (4.6, 6.3) | 0.007 | −0.60 ± 0.36 | 0.10 |
| LVMPI | 0.72 (0.54, 0.88) | 0.9 (0.61, 1.1) | 0.05 | 0.08 ± 0.08 | 0.27 |
| RVMPI | 0.57 (0.46, 0.7) | 0.64 (0.42, 0.74) | 0.58 | ||
| TAPSE (mm) | 18.0 (15.0, 21.0) | 18.0 (16.0, 23.0) | 0.48 | ||
| RV S′ (cm/s) | 11.0 (10.0, 12.2) | 11.0 (9.2, 12.0) | 0.96 | ||
| FAC (%) | 40.0 (33.0, 45.0) | 43.3 (28.0, 47.5) | 0.88 | ||
| RVD (cm) | 3.0 (2.6, 3.3) | 3.0 (2.6, 3.3) | 0.99 |
2D, two‐dimensional; 3D, three‐dimensional; 3DHM, three‐dimensional heart model; DCM, dilated cardiomyopathy; E/A, peak transmitral early diastolic inflow velocity/peak transmitral late diastolic inflow velocity; e′ avg., average peak early diastolic mitral annular velocity; FAC, fractional area change; HNDC, hypokinetic non‐dilated cardiomyopathy; LAVI, left atrial volume index; LV S′, peak systolic mitral annular velocity; LVEDDI, left ventricular end‐diastolic diameter index; LVEDVI, left ventricular end‐diastolic volume index; LVEF, left ventricular ejection fraction; LVESVI, left ventricular end‐systolic volume index; LVMPI, left ventricular myocardial performance index; LVOT VTI, left ventricular outflow tract velocity time integral; RV S′, right ventricular peak systolic myocardial velocity; RVD, right ventricular diameter; RVMPI, right ventricular myocardial performance index; RVOT VTI, right ventricular outflow tract velocity time integral; SE, standard error; SPAP, systolic pulmonary arterial pressure; TAPSE, tricuspid annular plane systolic excursion.
Values are median (P 25, P 75) or n (%).
Table 3.
Univariate and multivariate results of speckle tracking echocardiographic parameters for HNDC and DCM patients
| Echocardiographic parameters | HNDC | DCM | P‐value | Coefficient ± SE | P‐value |
|---|---|---|---|---|---|
| GCS (%) | −22.0 (−20.7, −24.1) | −17.0 (−10.9, −21.3) | <0.001 | 3.59 ± 0.94 | <0.001 |
| CS_base (%) | −19.8 (−17.1, −21.9) | −14.6 (−10.4, −18.2) | <0.001 | 3.45 ± 1.09 | 0.003 |
| CS_mid (%) | −20.3 (−18.3, −22.1) | −15.6 (−9.8, −20.9) | 0.002 | 3.27 ± 1.11 | 0.005 |
| CS_apex (%) | −25.4 (−22.5, −31.0) | −21.1 (−15.6, −26.3) | 0.003 | 3.38 ± 1.55 | 0.03 |
| LV basal rotation (°) | −4.1 (−2.5, −6.3) | −4.1 (−2.8, −5.2) | 0.72 | ||
| LV apical rotation (°) | 1.9 (0.18, 5.5) | 0.1 (−1.9, 1.8) | 0.01 | −1.85 ± 1.04 | 0.08 |
| Twist (°) | 6.2 (2.7, 9.4) | 3.0 (1.1, 6.8) | 0.03 | −1.90 ± 1.16 | 0.10 |
| GLS (%) | −14.8 (−12.3, −16.5) | −13.0 (−7.3, −15.2) | 0.03 | 0.51 ± 0.47 | 0.28 |
| LV mechanical dispersion (ms) | 16.9 (5.9, 46.5) | 42.8 (22.5, 64.0) | 0.001 | 16.46 ± 7.09 | 0.02 |
CS, circumferential strain; DCM, dilated cardiomyopathy; GCS, global circumferential strain; GLS, global longitudinal strain; HNDC, hypokinetic non‐dilated cardiomyopathy; LV, left ventricular; SE, standard error.
Values are median (P 25, P 75) or n (%).
However, after excluding patients with LBBB on the electrocardiogram who have higher MPI, 12 LVMPI lost its difference between the study groups. In addition, subanalysis depicted clockwise (negative) LV apical rotation in 7 (23.3%) cases of HNDC group against 11 (47.8%) DCM patients with no significant difference (P‐value = 0.32).
As shown in Tables 2 and 3 , regression model analysis was performed in order to identify whether echocardiographic features remain different between the two study populations after adjusting for confounders. Interestingly, we found that GCS, as well as circumferential strain at basal, mid, and apical slices of the left ventricle, remained significantly lower in DCM individuals compared with HNDC group after adjusting for LVEF and HF‐associated hospital admissions.
Similarly, these analyses demonstrated statistically different values for LV mechanical dispersion between the two patient groups after controlling LVEF, HF‐associated hospitalization, and LBBB, because the latter leads to greater mechanical dispersion in DCM patients. 13 Whereas controlling the LVEF effect obviated the diversity of longitudinal strain, twist, and LV apical rotation in the two groups.
Of note, statistical evaluations showed a high agreement between 2D Simpson and 3D HeartModel methods in terms of measuring LVEF, LVEDVI, LVESVI, and LA volume index in both the study groups (Table 4 ).
Table 4.
Agreement between two‐dimensional Simpson method and three‐dimensional heart model in two patient groups
| HNDC | DCM | ||
|---|---|---|---|
| Variable | ICC (95% CI) | Variable | ICC (95% CI) |
| LVEF (%) | 0.90 (0.80–0.95) | LVEF (%) | 0.96 (0.92–0.98) |
| LVEDVI (mL/m2) | 0.90 (0.79–0.95) | LVEDVI (mL/m2) | 0.99 (0.97–0.99) |
| LVESVI (mL/m2) | 0.92 (0.84–0.96) | LVESVI (mL/m2) | 0.99 (0.98–0.99) |
| LAVI (mL/m2) | 0.86 (0.71–0.93) | LAVI (mL/m2) | 0.97 (0.93–0.98) |
CI, confidence interval; DCM, dilated cardiomyopathy; HNDC, hypokinetic non‐dilated cardiomyopathy; ICC, interclass correlation coefficient; LAVI, left atrial volume index; LVEDVI, left ventricular end‐diastolic volume index; LVEF, left ventricular ejection fraction; LVESVI, left ventricular end‐systolic volume index.
In addition, we sought to evaluate whether there is a relationship between LVEF and deformation parameters. Correlation analysis showed a strong positive linear correlation between LVEF and GCS as well as GLS in the DCM group, while a moderate positive correlation was detected between LVEF and twist. In the HNDC patients, LVEF represented a strong positive correlation with GLS and a moderate correlation with GCS. Twist and mechanical dispersion failed to have a remarkable correlation with LVEF in the HNDC group similar to mechanical dispersion in the DCM patients. Correlation coefficient and P‐values are summarized in Table 5 .
Table 5.
Correlation between left ventricular ejection fraction and strain parameters
| Variable | HNDC | DCM | ||
|---|---|---|---|---|
| Correlation coefficient | P‐value | Correlation coefficient | P‐value | |
| GCS | +0.526 | 0.003 | +0.784 | <0.001 |
| GLS | +0.734 | <0.001 | +0.914 | <0.001 |
| Twist | −0.149 | 0.43 | +0.542 | 0.008 |
| Mechanical dispersion | −0.268 | 0.14 | −0.021 | 0.92 |
DCM, dilated cardiomyopathy; GCS, global circumferential strain; GLS, global longitudinal strain; HNDC, hypokinetic non‐dilated cardiomyopathy.
Finally, reproducibility of measurement of advanced echocardiographic parameters was evaluated in 20 randomly patients. The ICC of intraobserver reliability was 0.94, 0.91, 0.79, and 0.84 for GLS, GCS, twist, and mechanical dispersion, respectively, while the ICC of interobserver reliability for these parameters was 0.86, 0.84, 0.78, and 0.78, respectively, demonstrating both good interobserver and intraobserver agreement for all indices.
Discussion
This study is the first to demonstrate 2D strain echocardiographic parameters in HNDC category, the early stage of idiopathic DCM. Herein, we documented more positive circumferential strain, regardless of LVEF, in dilated LV patients rather than non‐dilated patients. In contrast, longitudinal strain and LV twist failed to provide significant statistical difference after controlling for LVEF.
Left ventricular systolic function derives from the synergy of longitudinal and circumferential function. In this manner, GLS evaluates the shortening of longitudinal fibres located in the subendocardium and subepicardium, while GCS assesses circumferential fibres arranged in the mid‐wall. As with the previous documents, Onishi et al. 14 emphasized the power of myocardial strain to assess LV function and predict patient outcomes. They also determined the linear correlation of GLS and GCS as measured by both CMR and speckle tracking echocardiography with CMR EF. Stokke et al. 15 ascribed that GCS has more than twice as much effect on LVEF as GLS does. Thus, circumferential fibres, which are less vulnerable to myocardial diseases, could compensate for some loss of longitudinal function to maintain LVEF.
The substantial reduction in fibre shortening and mid‐wall fibrosis detected by CMR, as a prognostic factor in patients affected by idiopathic DCM, 16 , 17 increases our awareness of the prognostic implications of circumferential strain.
Cho et al. 18 reported GCS, but not LVEF or GLS, as an independent predictor of cardiac outcome in non‐ischaemic HF patients. On the other hand, Choi et al. 19 showed the predictive value of GCS for incident HF in asymptomatic individuals. They also found more positive GCS in subjects with greater LVEDV.
Moreover, no or mild myofibrillar loss in endomyocardial biopsies of MDCM patients underscores the role of myofibrils in LV size preservation. 7 We believe that the aforementioned finding may be in line with the more negative GCS in HNDC patients.
After the description of the clinical spectrum of DCM by the European Society of Cardiology, 2 Gigli et al. 5 found lower rate of all‐cause mortality/heart transplantation in patients with MDCM compared with others in a retrospective analysis of a group of DCM patients.
Incorporation of worse prognosis in DCM patients compared with HNDC population alongside the prognostic value of GCS in HF patients suggests more positive GCS value typically arising from myofibrillar loss and reduced fibre shortening, an underlying cause of poor outcome in dilated hearts. Consistent with this hypothesis, our study demonstrated more positive GCS in DCM patients. Given that impaired GCS as a sign of more advanced intrinsic myocardial systolic dysfunction is related to a poor prognosis, we recommend more intensive medical therapy in HF patients with more positive GCS, which is usually found in dilated left ventricles.
Several studies proved that mechanical dispersion of myocardial contraction measured by strain echocardiography is a predictive marker of arrhythmia in post‐myocardial infarction patients, 20 , 21 as well as various cardiac diseases such as HCM population. 22 In parallel with these results, Haugaa et al. 23 found LV mechanical dispersion to be an excellent predictor of ventricular arrhythmia in patients with DCM. Besides, they reported that greater mechanical dispersion may serve as a beneficial criterion to make a decision regarding ICD implantation.
Demonstrating greater mechanical dispersion in DCM patients in this study highlights a higher likelihood of arrhythmic events in HF patients with dilated left ventricle compared with others with normal LV size. Given that only a few HNDC patients in this study had LVEF lower than 35%, lower mechanical dispersion compared with DCM patients could not necessarily be generalized to the mentioned subgroup who are most likely to need ICD implantation. Still, if future researches prove this manner of mechanical dispersion in lower LVEF ranges, it may raise hypotheses for lower LVEF threshold for ICD implantation in HNDC group who tend to have less mechanical dispersion compared with patients with dilated left ventricle.
The last to be noted is the three DCM patients out of 21 (prevalence of 15.8%) who had increased LV filling pressure assessed by echocardiography. Looking for an explanation, we found two of them classified as NYHA Class III and another one as NYHA Class IV, implying decompensated condition and more advanced disease, which is in accordance with documents that emphasized diastolic dysfunction development in more symptomatic, end‐stage patients with DCM. 24
Limitations
The power of this study seems limited because of the small sample size failing to detect probable significant difference in other echocardiographic parameters between groups. Although we did our best not to include patients suspected of having myocarditis, our study did not account for CMR, as a reference non‐invasive tool for the diagnosis of myocarditis, in all patients but about half of them. Furthermore, our study applies to outpatient HNDC population with mild to moderate LV systolic dysfunction and should not be necessarily generalized to all HF patients such as hospitalized patients or who with severe LV systolic dysfunction.
Conclusions
Consistent with the outcome studies on HF patients with different LV sizes, the results of this study manifest that HNDC patients share less impaired echocardiographic features than DCM ones. Furthermore, irrespective of LVEF, DCM patients tend to have more positive circumferential strain and greater mechanical dispersion than HNDC patients. Thus, GCS measured by 2D speckle tracking echocardiography is superior to GLS or twist for discrimination between the two distinct phenotypes in DCM spectrum. Also, more mechanical dispersion could have arrhythmic consequences for DCM patients. Our study may serve as a base to layout future comparative research in terms of myocardial deformation findings in parallel with cardiac events in DCM vs. HNDC patients.
Conflict of interest
None declared.
Funding
This work was supported by Echocardiography Research Center, Shahid Rajaie Cardiovascular, Medical & Research Center (93089).
Acknowledgements
We are grateful to all the staff in echocardiography laboratory and heart failure clinics of Rajaie heart centre for their support during the course of this research.
Mombeini, H. , Parsaee, M. , and Amin, A. (2020) Speckle tracking echocardiography in hypokinetic non‐dilated cardiomyopathy: comparison with dilated cardiomyopathy. ESC Heart Failure, 7: 1909–1916. 10.1002/ehf2.12764.
References
- 1. Gulati A, Ismail TF, Jabbour A, Alpendurada F, Guha K, Ismail NA, Raza S, Khwaja J, Brown TD, Morarji K, Liodakis E, Roughton M, Wage R, Pakrashi TC, Sharma R, Carpenter JP, Cook SA, Cowie MR, Assomull RG, Pennell DJ, Prasad SK. The prevalence and prognostic significance of right ventricular systolic dysfunction in nonischemic dilated cardiomyopathy. Circulation 2013; 128: 1623–1633. [DOI] [PubMed] [Google Scholar]
- 2. Pinto YM, Elliott PM, Arbustini E, Adler Y, Anastasakis A, Boehm M, Duboc D, Gimeno J, De Groote P, Imazio M, Heymans S. Proposal for a revised definition of dilated cardiomyopathy, hypokinetic non‐dilated cardiomyopathy, and its implications for clinical practice: a position statement of the ESC working group on myocardial and pericardial diseases. Eur Heart J 2016; 37: 1850–1858. [DOI] [PubMed] [Google Scholar]
- 3. Keren A, Billingham M, Weintraub D, Stinson E, Popp R. Mildly dilated congestive cardiomyopathy. Circulation 1985; 72: 302–309. [DOI] [PubMed] [Google Scholar]
- 4. Guo X, Li Z, Guo L, Yu S, Li T, Zheng L, Pan G, Yang J, Sun Y, Hui R, Pletcher MJ. Prevalence of hypokinetic non‐dilated cardiomyopathy in a large general Chinese population. Int J Cardiol 2016; 223: 708–710. [DOI] [PubMed] [Google Scholar]
- 5. Gigli M, Stolfo D, Merlo M, Barbati G, Ramani F, Brun F, Pinamonti B, Sinagra G. Insights into mildly dilated cardiomyopathy: temporal evolution and long‐term prognosis. Eur J Heart Fail 2017; 19: 531–539. [DOI] [PubMed] [Google Scholar]
- 6. Gayazzi A, De Maria R, Renosto G, Moro A, Borgia M, Caroli A, Castelli G, Ciaccheri M, Pavan D, De Vita C, Baroldi G. The spectrum of left ventricular size in dilated cardiomyopathy: clinical correlates and prognostic implications. Am Heart J 1993; 125: 410–422. [DOI] [PubMed] [Google Scholar]
- 7. Keren A, Gottlieb S, Tzivoni D, Stern S, Yarom R, Billingham M, Popp RL. Mildly dilated congestive cardiomyopathy. Use of prospective diagnostic criteria and description of the clinical course without heart transplantation. Circulation 1990; 81: 506–517. [DOI] [PubMed] [Google Scholar]
- 8. Verdonschot JA, Hazebroek MR, Wang P, Sanders‐van Wijk S, Merken JJ, Adriaansen YA, van den Wijngaard A, Krapels IPC, Brunner‐la Rocca HP, Brunner HG, Heymans SRB. Clinical phenotype and genotype associations with improvement in left ventricular function in dilated cardiomyopathy. Circ Heart Fail 2018; 11: e005220. [DOI] [PubMed] [Google Scholar]
- 9. Asch FM, Banchs J, Price R, Rigolin V, Thomas JD, Weissman NJ, Lang RM. Need for a global definition of normative echo values—rationale and design of the World Alliance of Societies of Echocardiography Normal Values Study (WASE). J Am Soc Echocardiogr 2019; 32: 157–162 e2. [DOI] [PubMed] [Google Scholar]
- 10. Rickham P. Human experimentation. Code of ethics of the World Medical Association. Declaration of Helsinki. British Med J 1964; 2: 177. [DOI] [PMC free article] [PubMed] [Google Scholar]
- 11. Nagueh SF, Smiseth OA, Appleton CP, Byrd BF, Dokainish H, Edvardsen T, Flachskampf FA, Gillebert TC, Klein AL, Lancellotti P, Marino P. Recommendations for the evaluation of left ventricular diastolic function by echocardiography: an update from the American Society of Echocardiography and the European Association of Cardiovascular Imaging. Eur J Echocardiogr 2016; 17: 1321–1360. [DOI] [PubMed] [Google Scholar]
- 12. Özdemir K, Altunkeser BB, Daniş G, Özdemir A, Uluca Y, Tokaç M, Telli HH, Gök H. Effect of the isolated left bundle branch block on systolic and diastolic functions of left ventricle. J Am Soc Echocardiogr 2001; 14: 1075–1079. [DOI] [PubMed] [Google Scholar]
- 13. Stankovic I, Janicijevic A, Dimic A, Stefanovic M, Vidakovic R, Putnikovic B, Neskovic AN. Mechanical dispersion is associated with poor outcome in heart failure with a severely depressed left ventricular function and bundle branch blocks. Ann Med 2018; 50: 128–138. [DOI] [PubMed] [Google Scholar]
- 14. Onishi T, Saha SK, Delgado‐Montero A, Ludwig DR, Onishi T, Schelbert EB, Schwartzman D, Gorcsan J III. Global longitudinal strain and global circumferential strain by speckle‐tracking echocardiography and feature‐tracking cardiac magnetic resonance imaging: comparison with left ventricular ejection fraction. J Am Soc Echocardiogr 2015; 28: 587–596. [DOI] [PubMed] [Google Scholar]
- 15. Stokke TM, Hasselberg NE, Smedsrud MK, Sarvari SI, Haugaa KH, Smiseth OA, Edvardsen T, Remme EW. Geometry as a confounder when assessing ventricular systolic function: comparison between ejection fraction and strain. J Am Coll Cardiol 2017; 70: 942–954. [DOI] [PubMed] [Google Scholar]
- 16. MacGowan GA, Shapiro EP, Azhari H, Siu CO, Hees PS, Hutchins GM, Weiss JL, Rademakers FE. Noninvasive measurement of shortening in the fiber and cross‐fiber directions in the normal human left ventricle and in idiopathic dilated cardiomyopathy. Circulation 1997; 96: 535–541. [DOI] [PubMed] [Google Scholar]
- 17. Assomull RG, Prasad SK, Lyne J, Smith G, Burman ED, Khan M, Sheppard MN, Poole‐Wilson PA, Pennell DJ. Cardiovascular magnetic resonance, fibrosis, and prognosis in dilated cardiomyopathy. J Am Coll Cardiol 2006; 48: 1977–1985. [DOI] [PubMed] [Google Scholar]
- 18. Cho G‐Y, Marwick TH, Kim H‐S, Kim M‐K, Hong K‐S, Oh D‐J. Global 2‐dimensional strain as a new prognosticator in patients with heart failure. J Am Coll Cardiol 2009; 54: 618–624. [DOI] [PubMed] [Google Scholar]
- 19. Choi E‐Y, Rosen BD, Fernandes VR, Yan RT, Yoneyama K, Donekal S, Opdahl A, Almeida AL, Wu CO, Gomes AS, Bluemke DA, Lima JA. Prognostic value of myocardial circumferential strain for incident heart failure and cardiovascular events in asymptomatic individuals: the Multi‐Ethnic Study of Atherosclerosis. Eur Heart J 2013; 34: 2354–2361. [DOI] [PMC free article] [PubMed] [Google Scholar]
- 20. Haugaa KH, Smedsrud MK, Steen T, Kongsgaard E, Loennechen JP, Skjaerpe T, Voigt JU, Willems R, Smith G, Smiseth OA, Amlie JP, Edvardsen T. Mechanical dispersion assessed by myocardial strain in patients after myocardial infarction for risk prediction of ventricular arrhythmia. JACC Cardiovasc Imaging 2010; 3: 247–256. [DOI] [PubMed] [Google Scholar]
- 21. Haugaa KH, Grenne BL, Eek CH, Ersbøll M, Valeur N, Svendsen JH, Florian A, Sjøli B, Brunvand H, Køber L, Voigt JU, Desmet W, Smiseth OA, Edvardsen T. Strain echocardiography improves risk prediction of ventricular arrhythmias after myocardial infarction. JACC Cardiovasc Imaging 2013; 6: 841–850. [DOI] [PubMed] [Google Scholar]
- 22. Haland TF, Almaas VM, Hasselberg NE, Saberniak J, Leren IS, Hopp E, Edvardsen T, Haugaa KH. Strain echocardiography is related to fibrosis and ventricular arrhythmias in hypertrophic cardiomyopathy. European Heart Journal–Cardiovascular Imaging 2016; 17: 613–621. [DOI] [PMC free article] [PubMed] [Google Scholar]
- 23. Haugaa KH, Goebel B, Dahlslett T, Meyer K, Jung C, Lauten A, Figulla HR, Poerner TC, Edvardsen T. Risk assessment of ventricular arrhythmias in patients with nonischemic dilated cardiomyopathy by strain echocardiography. J Am Soc Echocardiogr 2012; 25: 667–673. [DOI] [PubMed] [Google Scholar]
- 24. Goar FGS, Masuyama T, Alderman EL, Popp RL. Left ventricular diastolic dysfanction in end‐stage dilated cardiomyopathy: simultaneous Doppler echocardiography and hemodynamic evaluation. J Am Soc Echocardiogr 1991; 4: 349–360. [DOI] [PubMed] [Google Scholar]