Abstract
We used harmonic-content frequency-domain fluorometry to determine the anisotropy decays of a variety of single tryptophan peptides and proteins. Resolution of the rapid and complex anisotropy decays was enhanced by global analysis of the data measured in the presence of quenching by either oxygen or acrylamide. For each protein, and for each quencher, data were obtained at four to six quencher concentrations, and the data analyzed globally to recover the anisotropy decay. The decrease in decay times produced by quenching allows measurements to an upper frequency limit of 2 GHz The chosen proteins provided a range of exposures of the tryptophan residues to the aqueous phase, these being ACTH, monellin, Staphylococcus nuclease and ribonuclease T1, in order of decreasing exposure. Examination of indole and several small peptides demonstrates the resolution limitations of the measurements; a correlation time of 12 ps was measured for indole in methanol at 40°C. Comparison of the anisotropy decays of gly-trp-gly with leu-trp-leu revealed stearic effects of the larger leucine side chains on the indole ring. The anisotropy decay of gly-trp-gly revealed a 40 ps component for the indole side chain, which was resolved from the overall 150 ps correlation time of the tripeptide. Only the longer correlation time was observed for leu-trp-leu. With the exception of ribonuclease T1, each of the proteins displayed a subnanosecond component in the anisotropy decay which we assign to independent motions of the tryptophan residues. For example, Staphylococcus nuclease and monellin displayed segmental tryptophan motions with correlation times of 80 and 275 ps, respectively. The amplitudes of the rapid components increased with increasing exposure to the aqueous phase. These highly resolved anisotropy decays for proteins of known structure are suitable for comparison with molecular dynamic simulations.
Keywords: Protein dynamics, Anisotropy, Fluorescence, Proteins, Frequency-domain fluorescence, Quenching, Fluorescence quenching
Introduction
The dynamics of proteins have been the subject of numerous simulations and experiments (Welch 1986; Karplus 1986; Gurd and Rothberg 1979;Hirs and Timasheff 1986; Clementi et al, 1985; Kouyama et al 1989; Ludescher et al. 1988; MacKerell et al. 1989). Time-resolved fluorescence spectroscopy has been particularly valuable for studies of protein dynamics because of its natural window on the nanosecond timescale and because of the increasing availability of picosecond resolution (Visser 1985; Nordlund et al. 1986; Nordlund and Podolski 1983; Ludescher et al. 1985; Albani et al. 1985; Libertini and Small 1985; Desie et al. 1986; Gillbro et al 1985). Nonetheless, comparison of molecular dynamics calculations and experiments has not been possible, This is because the time resolution of fluorescence spectroscopy was not quite adequate for comparison with the calculated ps motions (Lakowicz et al. 1983; Lakowicz and Maliwal 1983; Munro et al. 1979). Secondly, much of the presently available data with ps resolution is for the time-resolved intensity decays. At present it is difficult to correlate the components in the intensity decays with dynamic properties of the proteins. The anisotropy decays are easier to interpret because they are determined by angular displacements of the fluorescent residue during the time between excitation and emission. Finally, trajectories have been calculated for proteins like BPTI (Levy and Szabo 1982) and lysozyme (Ichyic and Karplus 1983) each of which contains multiple fluorescent residues. Consequently, rapid components in the anisotropy decays could be doe either to motions of the residues or to energy transfer between the residues (Kasprzak and Weber 1982; Lakowicz et al 1987 a).
In the present report we attempt to provide experimental data on proteins which may be used for comparison with the dynamics calculations. We selected a series of proteins each with a known crystal structure and containing a single tryptophan residue. Additionally, the proteins were chosen to provide a range of environments for the residue, from fully exposed to fully shielded from the aqueous phase. In order of decreasing tryptophan exposure to the aqueous phase (Eftink and Ghiron 1976) these proteins are ACTH, monellin (Tomlinson et al. 1983), S. nuclease (Arnone et al. 1971) and RNase T1, (Heinemann and Saenger 1982). These proteins have been the subject of previous studies using fluorescence spectroscopy (Ross et al. 1981; Brand and Cogan 1977; Brochon et al. 1974; James et al. 1985; Lakowicz et al. 1986a; Eftink et al. 1989; Eftink and Ghiron 1987a), and in the case of RNase T1 the subject of molecular dynamics simulations (Axelsen and Prendergast 1989; Mackerell et al. 1989).
We used several new techniques to obtain ps resolution of the anisotropy decays. The measurements were in the frequency-domain (Gratton and Limkeman 1983; Lakowicz and Maliwal 1985), which is now known to provide good resolution of rapid and/or complex decays (Lakowicz et al. 1986b. 1987a; Maliwal and Lakowicz 1986). Secondly, we used the harmonic content of a laser pulse train to an upper frequency of 2 GHz (Lakowicz et al. 1986c). These high frequencies were detected with a microchannel plate photomultiplier. Resolution of the anisotropy decays was further enhanced by simultaneous (global) analysis of data obtained in the presence of the dynamic quenchers, acrylamide or oxygen. Global analysis of multiple data sets has been suggested by Brand and co-workers for other types of measurements (Knutson et al. 1983; Beechem et al. 1983). In our case the data obtained in the absence of quencher contain information predominantly on overall rotational diffusion of the protein. In the presence of quenching the data contain more information on local motion of the residues. Global analysis of a series of data measured at various concentrations of quencher provide enhanced resolution of both the local motions and the overall rate of rotational diffusion (Gryczynski et al. 1987; Lakowicz et al. 1987b). In fact, measurements of a quenched fluorophore allowed the first resolution of three correlation times for an asymmetric rigid molecule (Gryczynski et al. 1988a). This technique of measuring quenched samples is also valuable for measurements of rapid anisotropy decays. By examination of iodide-quenched indole in a fluid solvent, we demonstrated that correlation times as short as 8 ps can be measured (Lakowicz et al. 1988). Additionally, the enhanced resolution provided by quenching allowed resolution of double exponential anisotropy decays, even with correlation times of 40 and 140 ps (Gryczynski et al. 1988b). We believe these highly resolved anisotropy decays are suitable for comparison with molecular dynamics calculations on these same peptides anti proteins. We note that the frequency range of the instrumentation has recently been extended to 10 GHz (Laczko et al. 1990) which will allow measurement of still shorter correlation times.
The intensity decays of the tryptophan residues were all found to become more heterogeneous in the presence of quenching. We attribute the increased heterogeneity to transient effects in quenching (Lakowicz et al. 1986d), and these effects are the subject of a separate publication (Lakowicz et al. 1987c, d). Acrylamide is known to have little if any effect on protein structure, and does not appear to bind to or interact with the proteins (Eftink and Ghiron 1987b). Additionally, oxygen does not appear to perturb the structure or activity of most proteins (Lakowicz and Weber 1973a, b).
Theory
We determine (he anisotropy decays from the frequency-response of the emission when the excitation is modulated and polarized. The frequency-response of the polarized emission can be predicted from the time-response (Weber 1977). Suppose a sample is excited with a pulse of vertically polarized light. If the fundamental (time-zero) anisotropy is greater than zero (r0>0) the excitation results in a larger population of molecules whose emission is aligned more nearly parallel (‖) than perpendicular (⊥) to the excitation. Following excitation, the initial difference between the parallel and perpendicular components of the emission decays due both to rotational motions of the fluorophore and to decay of the total emission . The decays of the individual polarized components at each quencher concentration [Q] are given by
| (1) |
| (2) |
where the total emission is
| (3) |
Information about the rotational motions is contained in the anisotropy decay law, which can be described as a sum of exponentials
| (4) |
where the sum is over all correlation times.
We are interested in determining r(t) with the highest possible resolution because the correlation times (Θi) and the associated amplitudes (r0gi) are determined by the size, shape and flexibility of the molecule. For instance, if the tryptophan is bound rigidly to the protein then one expects a single exponential anisotropy decay with a correlation time (Θ) which is characteristic of overall rotational diffusion of the protein. For example, RNase T1 has a molecular weight of 11 100. In aqueous solution at 25°C its correlation time is expected to be near 8 ns. If the tryptophan residue has segmental freedom in addition to overall relation, then one expects a multi-exponential anisotropy decay. The correlation time and partial amplitude (r0gi) of the faster motion is characteristic of the segmental motion of the residue. We note that the value of r0 for a given fluorophore is dependent upon the relative orientation of the absorption and emission transition moments within the molecular axes (Belford et al. 1972; Chuang and Eisenthal 1972; Ehrenberg and Rigler 1972).
Our approach to improving resolution is to vary the intensity decay by collisional quenching. We assume that collisional quenching does not alter the anisotropy decay, which seems to be reasonable as many quenchers do not appear to interact with the fluorophores or the proteins. We note that if the quencher altered the anisotropy decay this effect would be revealed by an inability to simultaneously fit the data measured at several quencher concentrations to a single anisotropy decay law. Additionally, we examined the anisotropy decays in the presence of acrylamide quenching, and then in the presence of oxygen quenching (Lakowicz and Weber 1973a, b). Since the same anisotropy decays were observed for each quencher, perturbation of the anisotropy decay by quenching is not likely, even if there are weak interactions between the protein and the quencher (Blatt et al. 1986).
In the frequency-domain the measured quantities are the phase angle difference between the parallel and perpendicular components of the emission and the ratio of the modulated components of the polarized emission , each measured over a range of modulation frequencies (ω). The anisotropy decay parameters are obtained by the best non-linear least squares fit to the data using calculated (c) values of and (Lakowicz et al 1985, 1986a). The calculated values are obtained using
| (5) |
| (6) |
where
| (7) |
| (8) |
The goodness-of-fit is estimated from the value of reduced chi-squared
| (9) |
where v is the number of degrees of freedom (number of data points minus the number of floating parameters) and δΔ and δΛ are the experimental uncertainties in the differential phase angles and modulation ratios, respectively. If the data are available for several quencher concentrations, the data can be analyzed simultaneously to obtain the anisotropy decay (4). Alternatively, data at a single quencher concentration can be used to determine r(t).
It should be noted that the assignment of Θ1 and Θ2 to the overall correlation time of the protein (ΘP) and to the local tryptophan motion (ΘT) is approximate. More properly, the anisotropy decay is approximated by
| (10) |
Hence, the two apparent correlation times are related to the correlation times of interest by
| (11) |
| (12) |
If ΘP⪢ΘT, then the shorter correlation time can be equated with the timescale of the fast motion, This condition is true for all the results in this paper, except for gly-trp-gly, where the two correlation times differ by only three-fold, Here we have reported the experimentally recovered values of the apparent correlation times correlation times (Θ1 and Θ2).
For presentation of the data we prefer a modified form for the modulation ratio Λ∞. We define the frequency-dependent or modulated anisotropy as
| (13) |
The values of rω are comparable to those of the steady state anisotropy (r) and the fundamental anisotropy (r0), At low modulation frequencies rω is nearly equal to r. At high modulation frequencies rω approaches r0.
The anisotropy data were fit to expressions like (4) but two variations are possible. In all cases (except indole in methanol) the total anisotropy was considered to be an unknown parameter, so the variable terms in (4) were the values of Θi and of r0 gi. For the shortest correlation time (indole in methanol), we assumed the fundamental anisotropy was known, and this value was held constant for the analysis. This additional constraint improves the resolution of the anisotropy decay, especially for rapid anisotropy decays, for which limited time resolution can result in a decrease in the apparent value of r0 (Papen-huyzen and Visser 1983; Visser et al 1985). Nonetheless, the same correlation time was recovered for indole using either a fixed or tree value for r0 in the fitting procedure.
To perform the analysis described above if is necessary to know the form of the intensity decay at each quencher concentration. In The presence of quenching these decays become more heterogeneous due to transient effects in quenching (Lakowicz et al. 1987c, d). Al each quencher concentration the intensity decays were fit to
| (14) |
where αi are the pre-exponential factors and τi are the apparent decay times. The fractional intensity of each component to the steady slate emission is given by . The parameters in (14) were obtained by least-square analysis, analogous to that described above for the anisotropy decays (Lakowicz et al. 1987a), Because of the transient effects it is probable that the decays are not precisely described by (14). This is not important for the anisotropy analysis, the only requirements are that the parametrized form of the intensity decay closely describes the actual decay and that all the components in the intensity decay sire associated with all those in the anisotropy decay. We used the best two or three exponential fit for for analysis of the anisotropy decays. Some of these intensity decays are summarized at the end of the paper, in Tables 3 and 4.
Table 3.
Selected intensity decays for peptides or proteins with acrylamide quenching
| Protein | [Acrylamide] | τi (ns) | αi | fi | |
|---|---|---|---|---|---|
| RNase T1 | 0.0 | 3.85 | 1.0 | 1.0 | 0.97 |
| 1.0 M | 2.13 | 1.0 | 1.0 | 19.2 | |
| 1.0 | 0.30 | 0.11 | 0.02 | ||
| 2.23 | 0.89 | 0.98 | 2.3 | ||
| S. Nuclease | 0.0 | 5.46 | 1.0 | 1.0 | 8.0 |
| 0.0 | 4.60 | 0.68 | 0.57 | ||
| 7.31 | 0.32 | 0.43 | 1.2 | ||
| 0.83 | 1.33 | 1.0 | 1.0 | 219.2 | |
| 0.83 | 0.42 | 0.44 | 0.16 | ||
| 1.79 | 0.56 | 0.84 | 2.45 | ||
| Monellin | 0.0 | 2.41 | 1.0 | 1.0 | 185.3 |
| 0.0 | 1.04 | 0.47 | 0.21 | ||
| 3.37 | 0.53 | 0.79 | 1.3 | ||
| 0.5 | 1.31 | 1.0 | 1.0 | 245.4 | |
| 0.5 | 0.21 | 0.59 | 0.20 | ||
| 1.19 | 0.41 | 0.80 | 15.1 | ||
| 0.5 | 0.07 | 0.60 | 0.09 | ||
| 0.82 | 0.36 | 0.68 | |||
| 2.41 | 0.04 | 0.23 | 1.1 | ||
| ACTH | 0.0 | 2.43 | 1.0 | 1.0 | 212.7 |
| 1.14 | 0.53 | 0.23 | |||
| 3.62 | 0.47 | 0.74 | 0.9 | ||
| 0.6 | 0.32 | 1.0 | 1.0 | 1020. | |
| 0.6 | 0.10 | 0.74 | 0.29 | ||
| 0.68 | 0.26 | 0.71 | 36.6 | ||
| 0.6 | 0.04 | 0.65 | 0.14 | ||
| 0.35 | 0.30 | 0.53 | |||
| 1.24 | 0.05 | 0.33 | 0.9 | ||
| Leu-trp-leu | 0.0 | 2.04 | 1.0 | 1.0 | 300.3 |
| 0.0 | 0.59 | 0.47 | 0.16 | ||
| 2.77 | 0.53 | 0.84 | 1.6 | ||
| 0.5 | 0.18 | 1.0 | 1.0 | 871.6 | |
| 0.5 | 0.05 | 0.81 | 0.33 | ||
| 0.42 | 0.19 | 0.67 | 9.6 | ||
| 0.5 | 0.01 | 0.90 | 0.21 | ||
| 0.25 | 0.08 | 0.51 | |||
| 0.66 | 0.02 | 0.28 | 1.7 | ||
| Gly-trp-gly | 0.0 | 1.12 | 1.0 | 1.0 | 649.1 |
| 0.0 | 0.41 | 0.66 | 0.28 | ||
| 2.03 | 0.34 | 0.72 | 1.6 | ||
| 0.0 | 0.36 | 0.62 | 0.24 | ||
| 1.64 | 0.30 | 0.54 | |||
| 2.82 | 0.08 | 0.24 | 1.0 | ||
| 0.7 | 0.13 | 1.0 | 1.0 | 538 | |
| 0.7 | 0.05 | 0.84 | 0.45 | ||
| 0.33 | 0.16 | 0.55 | 20.4 | ||
| 0.7 | 0.02 | 0.83 | 0.25 | ||
| 0.19 | 0.16 | 0.61 | |||
| 0.91 | 0.01 | 0.14 | 1.7 | ||
| NATA | 0.0 | 2.87 | 1.0 | 1.0 | 0.8 |
| 0.0 | 0.43 | 0.01 | 0.00 | ||
| 2.89 | 0.99 | 1.00 | 0.7 | ||
| 0.5 | 0.20 | 1.0 | 1.0 | 420.9 | |
| 0.5 | 0.07 | 0.63 | 0.25 | ||
| 0.35 | 0.37 | 0.75 | 2.2 |
Table 4.
Selected intensity decays for peptides and proteins with oxygen quenching
| Protein | [Oxygen] | τi (ns) | αi | fi | |
|---|---|---|---|---|---|
| RNase T1 | 0.0 | 3.83 | 1.0 | 1.0 | 0.8 |
| 0.144 M | 1.91 | 1.0 | 1.0 | 39.0 | |
| 0.144 | 0.37 | 0.15 | 0.03 | ||
| 2.06 | 0.85 | 0.97 | 1.8 | ||
| S. Nuclease | 0.0 | 5.42 | 1.0 | 1.0 | 5.9 |
| 0.0 | 4.89 | 0.84 | 0.76 | ||
| 8.34 | 0.16 | 0.24 | 1.1 | ||
| 0.143 | 1.70 | 1.0 | 1.0 | 265.2 | |
| 0.143 | 0.29 | 0.36 | 0.07 | ||
| 20.8 | 0.64 | 0.93 | 1.6 | ||
| Monellin | 0.0 | 2.49 | 1.0 | 1.0 | 152.4 |
| 0.0 | 1.01 | 0.43 | 0.19 | ||
| 3.33 | 0.57 | 0.81 | 1.0 | ||
| 0.144 | 0.56 | 1.0 | 1.0 | 1336.0 | |
| 0.144 | 0.11 | 0.67 | 0.18 | ||
| 1.06 | 0.33 | 0.82 | 3.1 | ||
| 0.144 | 0.10 | 0.66 | 0.16 | ||
| 0.97 | 0.32 | 0.75 | |||
| 2.30 | 0.01 | 0.09 | 1.4 | ||
| ACTH | 0.0 | 2.71 | 1.0 | 1.0 | 109.3 |
| 0.0 | 1.31 | 0.45 | 0.23 | ||
| 3.67 | 0.55 | 0.77 | 1.3 | ||
| 0.144 | 0.62 | 1.0 | 1.0 | 491.5 | |
| 0.144 | 0.10 | 0.49 | 0.10 | ||
| 0.86 | 0.51 | 0.90 | 2.9 | ||
| Leu-trp-leu | 0.0 | 2.39 | 1.0 | 1.0 | 26.0 |
| 0.0 | 1.21 | 0.28 | 0.14 | ||
| 2.76 | 0.72 | 0.86 | 0.9 | ||
| 0.144 | 0.54 | 1.0 | 1.0 | 75.9 | |
| 0.144 | 0.13 | 0.24 | 0.06 | ||
| 0.62 | 0.76 | 0.94 | 1.4 | ||
| Gly-trp-gly | 0.0 | 1.46 | 1.0 | 1.0 | 214.3 |
| 0.0 | 0.57 | 0.49 | 0.21 | ||
| 2.07 | 0.51 | 0.79 | 1.7 | ||
| 0.145 | 0.30 | 1.0 | 1.0 | 1159.0 | |
| 0.145 | 0.07 | 0.68 | 0.20 | ||
| 0.59 | 0.59 | 0.80 | 18.4 | ||
| 0.145 | 0.01 | 0.89 | 0.08 | ||
| 0.23 | 0.07 | 0.33 | |||
| 0.74 | 0.04 | 0.59 | 2.2 | ||
| NATA | 0.0 | 2.95 | 1.0 | 1.0 | 1.0 |
| 0.144 | 0.51 | 1.0 | 1.0 | 174.9 | |
| 0.144 | 0.05 | 0.37 | 0.05 | ||
| 0.59 | 0.63 | 0.95 | 1.6 |
Materials and methods
Frequency-domain measurements were performed using a recently constructed instrument with a upper frequency limit of 2 GHz (Lakowicz et al. 1986c), The improved frequency-range was obtained by two modifications of our previous instrument (Lakowicz and Maliwal 1985). The CW laser source was replaced with a cavity-dumped dye laser delivering 5 ps pulses at 3.7931 MHz. This source provides harmonic content at each integer multiple of the pulse rate to many GHz. Detection of the high frequency components was accomplished with a micro-channel plate PMT with external cross-correlation. The data are collected using a dedicated Mine 11/23 computer. and then transferred to a Dec 11/73 for analysis. For all analyses the uncertainties (δΛ and δΛ) were taken as 0.2 degrees in the phase angle and 0.005 in the modulation ratio, respectively. We note that there is presently no general method to determine the actual experimental uncertainties in the frequency-domain data. We found the stated values to be characteristic of our instrument, as observed from years of experience. Moreover, except at the limits of resolution, the recovered parameters are not dependent upon the precise values chosen for δΛ and δΛ. (Gratton et al. 1984: Lakowicz et al. 1984), The probabilities of values for different degrees of freedom were obtained from a program called STATS supplied by Edinburgh Instruments, Scotland.
NATA was from Aldrich, ACTH (1–24) was a gift from Ciba-Geigy, and monellin was from Worthington (54D463). and all were used without further purification, Acrylamide was from Bio-Rad, electrophoresis grade, greater than 99.9% pure, lot 27965. RNase T1 was a gift from M. Eftink (University of Mississippi) and S. nuclease was a gift from L. Brand (The Johns Hopkins University).
The samples were excited at 300 nm for acrylamide quenching, and at 298 nm for oxygen quenching. For NATA in propylene glycol at −60°C the fundamental anisotropies are 0.317 and 0.311, For 300 and 298 nm excitation, respectively. Thus, the anisotropy decays are expected to be similar for these two closely spaced wave-lengths. The emission was observed through a Schott WG320 filter. Emission spectra were taken of all the quenched and unquenched samples, and were found to agree with the expected spectra. For measurement of the intensity decay the observation polarizer was set at the magic-angle orientation and the excitation polarizer was vertical. Oxygen quenching measurements were carried out as described previously (Lakowicz and Weber 1973a; Lakowicz et al. 1983). The observed anisotropies are about 8% smaller in the oxygen pressure cell than in the usual 1 cm2 cuvette holder. At 300 and 298 nm these values for NATA in the pressure cell are 0.291 and 0.286, respectively. We did not correct for this effect, which is probably due to imperfections or strains in the quartz windows of the cell, which are 0.25 inches thick. Unless indicated otherwise all measurements were made at 20°C.
Results
Simulations of frequemy-domain data for quenched samples with segmental mobility
Frequency-domain measurements of anisotropy decays are relatively unfamiliar, especially when combined with measurements of quenched samples. Hence, it is of interest to examine simulated data which illustrate the general features of the data observed for proteins. Figure 1 shows simulated differential phase and modulation data for a double exponential anisotropy decay, with assumed correlation times of 10 ns and 100 ps. These values are assigned to overall protein rotation and local motions of a tryptophanyl residue, respectively. To be comparable with the data found for the proteins the fundamental anisotropy (r0) was 0.30, the fractional amplitude of the segmental motion was taken as 0.07, and the unquenched lifetime was 4,0 ns. We assume the lifetime was reduced to 2 ns or to 0.5 ns by quenching. In practice the decays become more heterogeneous in the presence of quenching, but this is not important for the simulations.
Fig. 1.
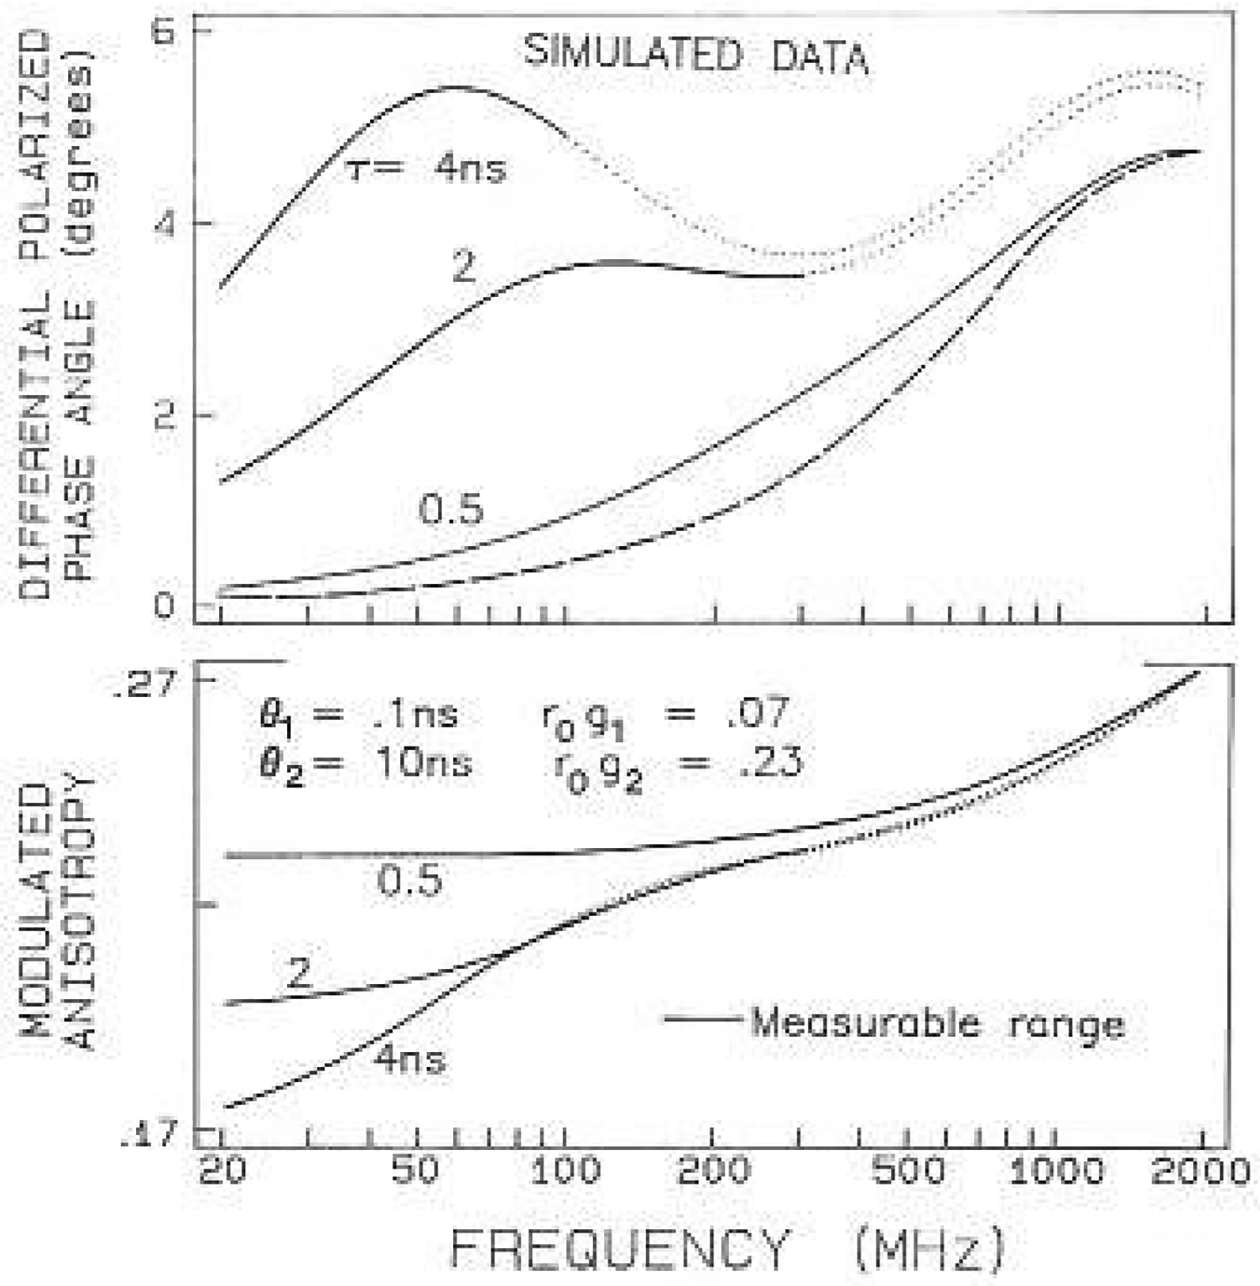
Simulated frequency-domain anisotropy data. The simulated correlation times were assumed to be 0.10 and 10.0 ns. with amplitudes of 0.07 and 0.23, respectively. Simulated data are shown for decay times of 4. 2 and 0.5 ns. The solid regions of the curves indicate the measurable frequency range, where the modulation is 0.2 or larger Tor the intensity decay. The dashed line shows the phase values expected for the 0.1 ns correlation time, with the smaller amplitude (0.07)
The existence of two rotational motions is easily visible in the frequency-response of the polarized emission. These motions are evident from the two peaks in the differential phase angles, which are due to the individual motions of 10 and 0.1 ns, The assignment of the 100 ps motion to the peak at higher frequencies is demonstrated by the dashed line, which shows the phase angles for the 0.1 ns component alone, with a maximum near 2 GHz. There are a two features of the data from the quenched samples which provide increased resolution of the anisotropy decay. First, the data can be obtained to higher frequencies for the samples with shorter decay times. This is because the emission with the shorter lifetimes is less demodulated. The solid regions of the curves show the measurable frequency range when the modulation of the emission is 20% or larger, relative to the modulation of the incident light. Using this criterion the upper frequency limit in the absence of quenching (τ0 = 4ns) is only 300 MHz. If the lifetime is reduced 8-fold to 0.5 nscc then the upper frequency limit is increased to 2 GHz, which provides more data at frequencies characteristic of the faster motion.
Quenching also increases the information content of the modulated anisotropies (lower panel, Fig. 1). At low frequencies this value is equal to the steady-state anisotropy. which is increased by quenching. Once again, the measurable range is extended to 2 GHz by reasonable degrees of quenching. The values of rω for the unquenehed sample increase over the frequency range from 20 to 100 MHz, which is the portion of rω which depends upon overall rotation of the protein. For the quenched sample the higher frequency data begin to show a contribution from the fasler motion. Evidently, still higher frequency measurements would be desirable to reach rω=r0=0.3, which have recently become available (Lakowicz et al. 1990).
The phase and modulation data (Δω and Λω) are both used to recover the anisotropy decay (5)–(9). We believe that inclusion of the modulated polarization ratio Λω (9) in the analysis contributes significantly to improved resolution and to stability of the least-squares minimization, but to date we have not performed adequate simulations to provide a quantitative statement of the advantages of using both Δω, and Λω.
An advantage of measuring a series of progressively quenched samples is that the data are determined to different extents by the two motions. As the decay time is decreased by quenching, the data is shifted towards higher frequencies, and the contribution of overall diffusion is decreased (Fig. 1). The same motions determine the values of Δω and Λω in the quenched and the unquenehed samples. However, the proportions each motion contributes are different. Hence, we expect increased resolution by simultaneous analysis of the data from a series of progressively quenched samples. This approach is an extension of the global methods described by Brand and co-workers (Knutson et al. 1983), which has been extended to the frequency-domain data for analysis of intensity decays (Beechem et al. 1983; Gratton et al. 1984; Lakowicz et al. 1984) and for anisotropy decays (Gryczynski et al. 1987, 1988a, b; Lakowicz et al. 1987 b).
It should he noted that we have previously obtained resolution of local and global motions of tryptophan residues in proteins without the use of quenching. and with an instrument-limited frequency range of 200 MHz (Lakowicz et al. 1986a), This was possible because of another favorable feature of the differential phase data, which is the near Lorentzian distribution of the phase singles. Because of this distribution, each motion contributes significantly to the data across even this limited frequency range, This can be seen from the dashed line in Fig. 1. Because of the line shape the phase angle of the 0.1 ps component with r0 gi = 0.07 is near 2 deg at 200 MHz. Hence, the differential phase method provides a rather robust estimation of the anisotropy decay, even when the frequency range is limited.
Finally, the simulations indicate that it should be possible lo measure correlation times which are near 10 ps (not shown). With a decay time near 0.2 ns a 10 ps motion would result in a phase angle of 6 deg at 2 GHz, which is 30-fold in excess of our noise level of 0.2 deg. Even if the noise level increases to 0.5°, which sometimes occurs due to the low intensity of a quenched sample, the correlation time would still be measurable with an uncertainty of about ± 2 ps. Additional information on the resolvability of anisotropy decays from the frequency-domain data have been published elsewhere (Maliwal and Lakowicz 1986).
Anisotropy decays of single tryptophan proteins
Anisotropy decay data are presented in Figs. 2–6 for four single tryptophan proteins, RNase Tt, S. nuclease, monellin and ACTH. For each protein we measured the frequency-domain anisotropy data in the presence of up to six different concentrations of acrylamide ranging from 0 to 1.5 M and four different concentrations of oxygen, ranging from 0 to 0.14 M. The data for each protein were analyzed to recover a single anisotropy decay law, which are reported in Tables 1 and 2 for acrylamide and oxygen quenching, respectively. We found very good agreement between these two series of measurements. which indicates the basic correctness of our assumption that the anisotropy decay is not altered by quenching. In all cases the total amplitude of the anisotropy decays are about 5% lower for oxygen than for acrylamide. We believe this effect is due to depolarization of the emission due to the windows used in the oxygen pressure cell, Such effects have been observed, but to a larger extent, in kilo-bar pressure cells which have thicker optical windows (Paladini and Weber 1981 a, b; Lakowicz and Thompson 1983; Chong and Weber 1983).
Fig. 2.
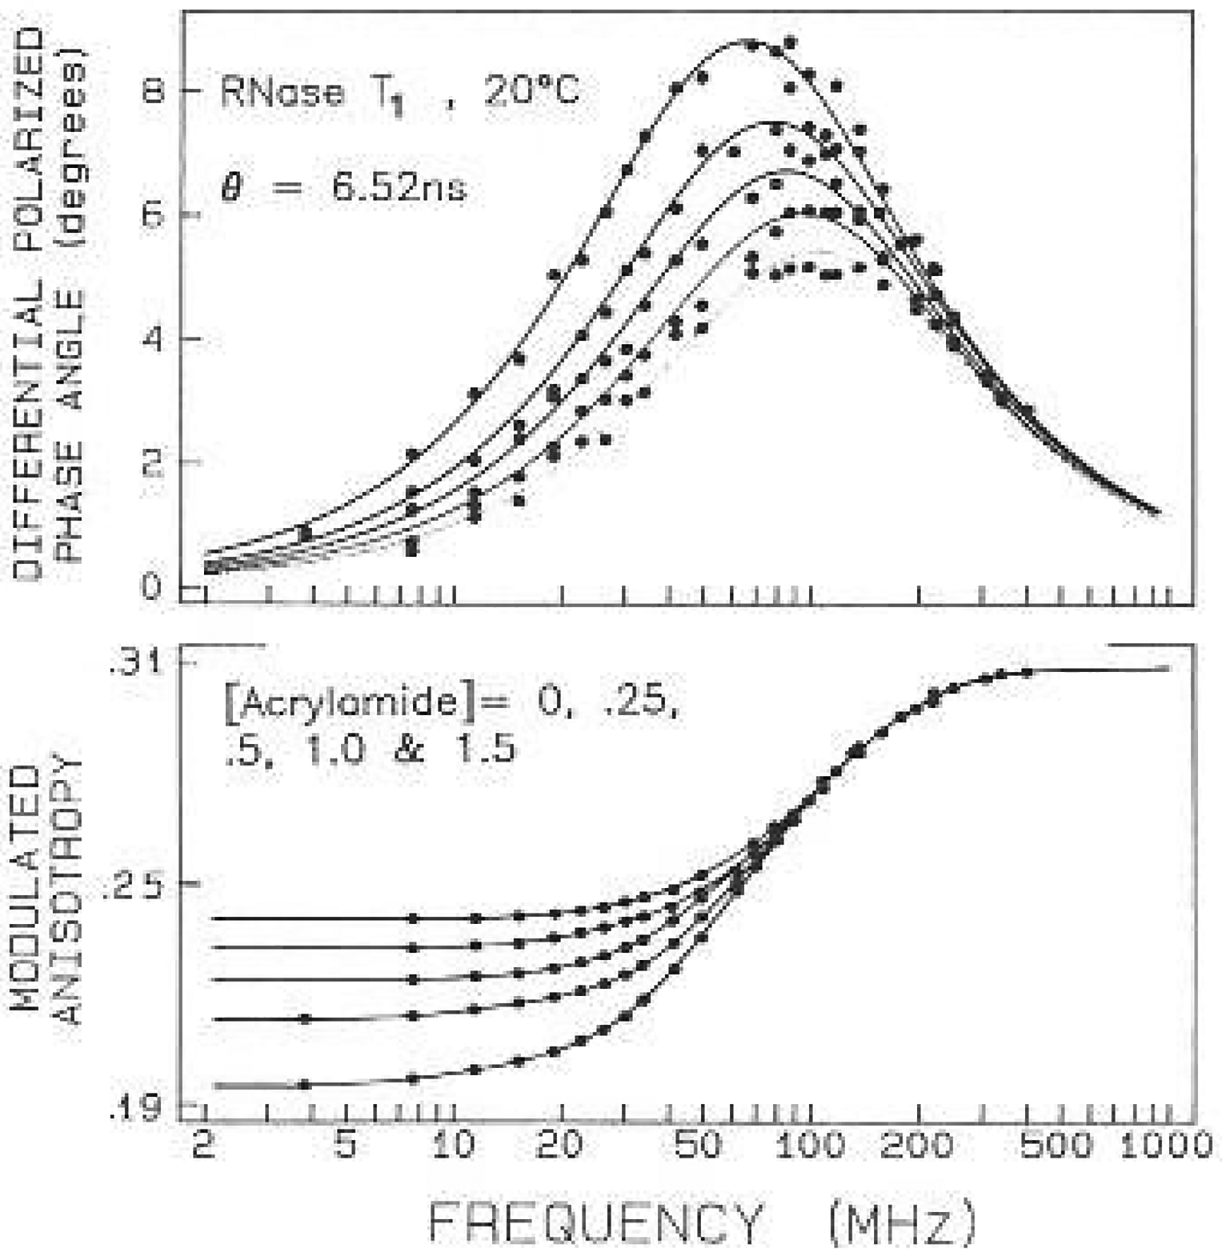
Frequency-domain anisotropy data for RNase with acryl- amide quenching. Data are shown for acrylamide concentrations of 0, 0.25, 0.5, 1.0 and 1.5 M, In lhe tipper panel the smaller phase angles correspond to increasing concentrations of acrylamide. In the lower panel the larger modulated anisotropies correspond to increasing concentrations of acrylamide. The intensity decay parameters for selected samples are given in Table 3. In Figs. 2–6 the solid lines represent the best global fits to the data using one or two correlation times, and the dots represent the measured values
Fig. 6.
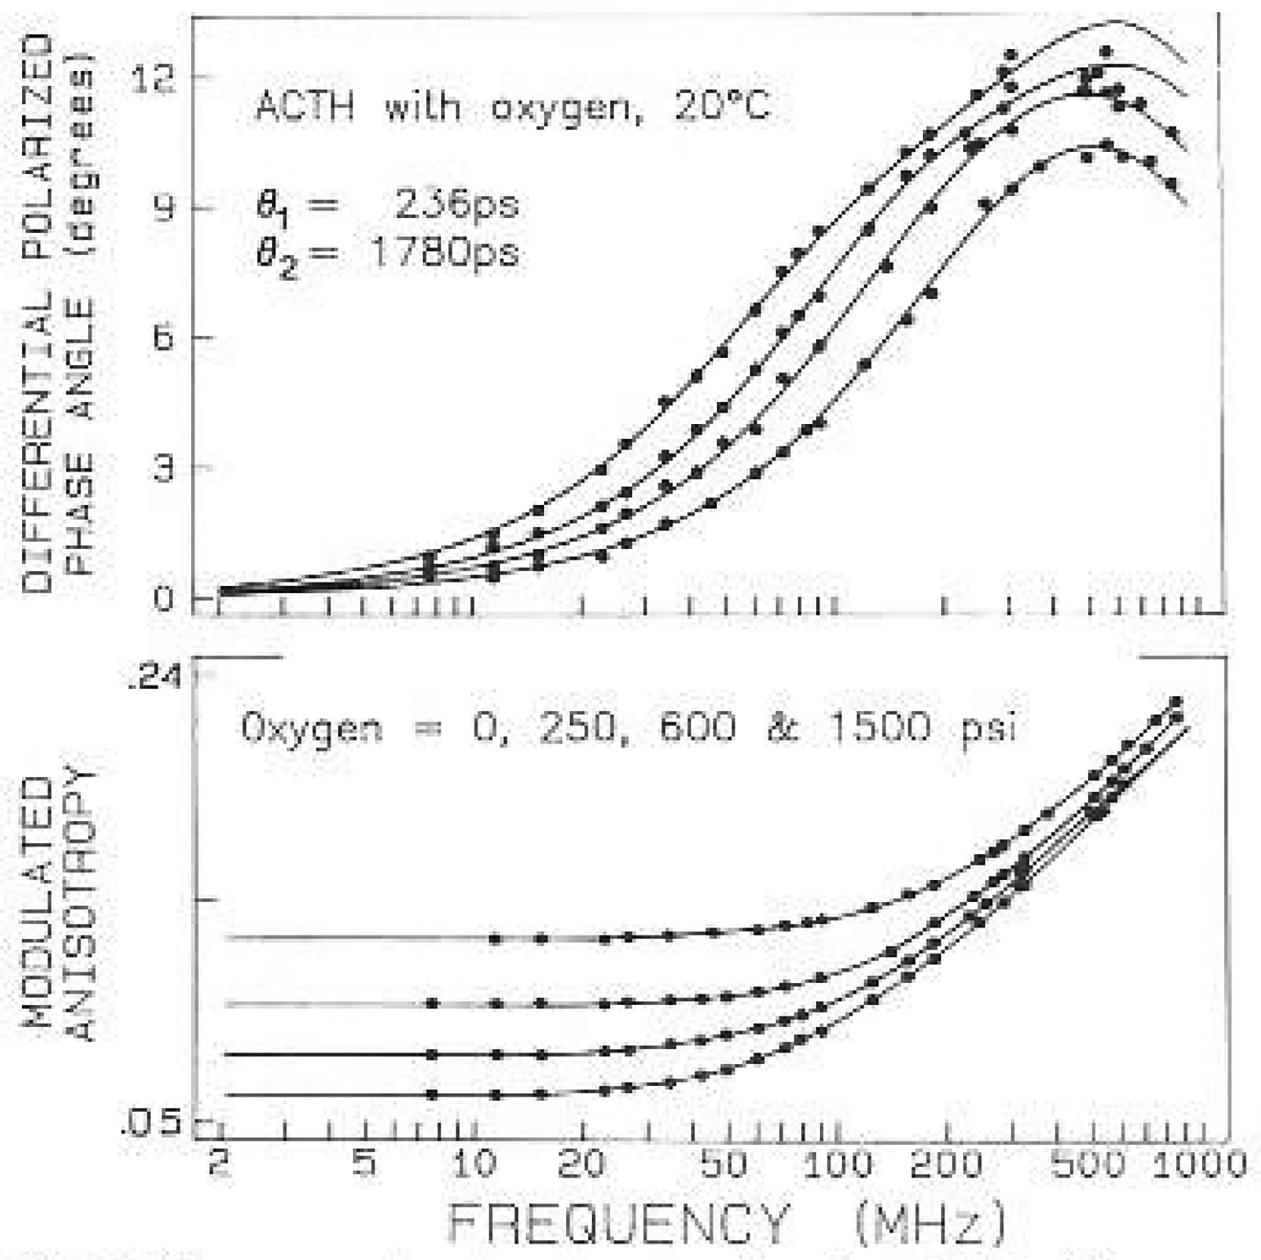
Frequency-domain anisotropy data for ACTH with oxygen quenching. Data are shown for oxygen pressures of 0, 250, 600 and 1500 psi
Table 1.
Anisotropy decays of single tryptophan proteins and peptides. obtained from global analysis with acrylamide quenching
| Sample | Θi (ps) | r0 gi | |
|---|---|---|---|
| RNase T1a | 6 520 | 0.310 | 1.76 |
| 2 110 | 0.022 | ||
| 7 140 | 0.290 | 1.45 | |
| S. Nucleaseb | 9 890 | 0.303 | 1.99 |
| 91 | 0.018 | ||
| 10 160 | 0.301 | 0.97 | |
| Monellinc | 3 750 | 0.282 | 44.0 |
| 360 | 0.073 | ||
| 6 000 | 0.240 | 1.57 | |
| ACTHd | 625 | 0.260 | 85.3 |
| 200 | 0.189 | ||
| 1 800 | 0.119 | 2.00 | |
| Leu-try-leue | 157 | 0.319 | 1.71 |
| 4 | 0.033 | ||
| 162 | 0.331 | 1.56 | |
| Gly-trp-glye | 73 | 0.296 | 2.00 |
| 39 | 0.220 | ||
| 135 | 0.105 | 0.83 | |
| NATAe | 56 | 0.323 | 1.06 |
| Indole in MeOH, 40°C | 12 | 0.290f | 2.29 |
| 12 | 0.226g | 2.20 |
Unless indicated otherwise, all measurements are in aqueous buffer at 20°C
100 mM Na acetate. pH 5.5
25 mM tris with 100 mM NaCl. pH = 7.0
100 mM Na acetate, pH = 3.6
10mM phosphate, pH =7
25 mM tris, pH =7.5
r0 was fixed at 0.29
r0 was a floating parameter
Table 2.
Anisotropy decays of single tryptophan proteins and peptides from global analysis with oxygen quenching
| Samplea | Θi (ps) | r0 gi | |
|---|---|---|---|
| RNase T1 | 6 470 | 0.285 | 1.25 |
| 4 370 | 0 | ||
| 6 430 | 0.289 | 1.27 | |
| S. Nuclease | 10 560 | 0.278 | 2.59 |
| 80 | 0.030 | ||
| 10 930 | 0.276 | 1.04 | |
| Monellin | 3 540 | 0.270 | 62.8 |
| 275 | 0.075 | ||
| 6 020 | 0.227 | 0.96 | |
| ACTH | 749 | 0.236 | 47.3 |
| 236 | 0.158 | ||
| 1 780 | 0.120 | 0.72 | |
| Leu-try-leu | 151 | 0.274 | 1.33 |
| 0 | 0 | ||
| 149 | 0.279 | 1.33 | |
| Gly-trp-gly | 92 | 0.241 | 2.17 |
| 48 | 0.213 | ||
| 177 | 0.075 | 1.65 | |
| NATA | 55 | 0.271 | 1.01 |
See Table 1 for additional details
The polarized frequency responses (Figs. 2–6) depend upon quencher concentration because these dynamic quenchers decrease the decay time of the tryptophans. In general, it is desirable to obtain the widest possible range of decay times. In practice, one is limited by the decay lime of the unquenched sample and the amount of quenching obtainable for each of the tryptophan residues. The extent of quenching varied among the proteins and was different for each quencher. For instance, the average decay lime of the buried residue in RNase T1 could be decreased about 50% by either 1 M acrylamide (Table 3) or 0.144 M oxygen (Table 4). In contrast, the decay time of the exposed tryptophan residue, was decreased nearly 8-fold by 0.6 M acrylamide and 4-fold by oxygen. Still higher degrees of quenching were obtained for NATA and the tripeptides, where the decay times were decreased about 10-fold by acrylamide quenching and 5-fold by oxygen quenching.
The effects of quenching on the intensity decays is complex, and beyond the scope of the present paper The results cannot be characterized by the Sten-Volmer equation, which describes the system by an unquenched lifetime and a Stern-Volmer quenching constant. this is because the decay laws, except for RNase T1 and NATA, are more complex than a single exponential, even without quenching. More importantly, the intensity decays become increasingly heterogeneous as the concentration of quencher is increased. This is shown for RNase T1 in Fig. 7. In the absence of quenching (●) the intensity decay is closely fit by the single exponential model (–––), in agreement with James et al. (1985) and of Eftink and Ghiron (1987a). In the presence of 1.5 M acrylamide the single exponential model fails, as can be seen from the mismatch between the data (○) and the single exponential model, the systematic deviations, and the increase in from 0.97 ti 52.8. The increase in is progressive with increasing quencher concentration for both quenchers. The extern of quenching-induced heterogeneity for RNase T1 is the least found among the proteins and peptides described In this report. Some of these data are summarized in Tables 3 and 4. We attribute the increased heterogeneity to transient effects in quenching, or equivalently, the so-called “time-dependent” quenching constants.
Fig. 7.
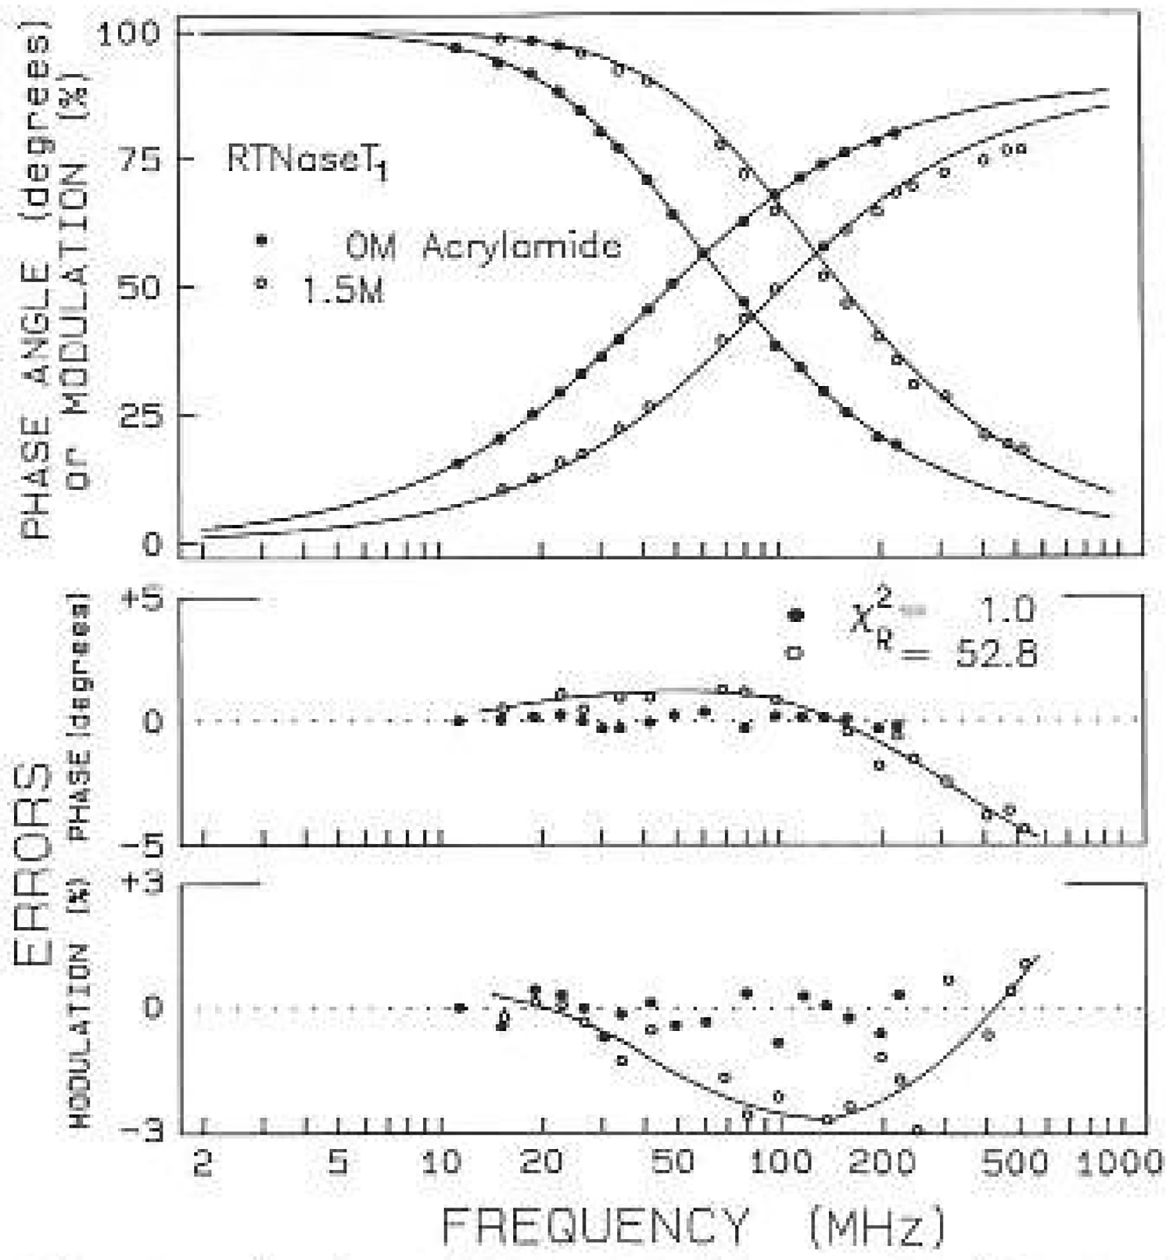
Intensity decay of RNase T1 without acrylamide (●) and with 1.5 M acrylamide (○). The solid lines show the best single exponential fit to the data. The lower panels show the deviations between the data and the best single exponential fit
For RNase T1 the differential phase data are distributed nearly as a Lorentzian on the log-frequcncy scale Fig. 2). Quenching by acrylamide results in a monotonic decrease in the amplitude of the phase angles, but does not alter the shape of the curve. One notices that the frequency of the differential phase maximum shifts to higher frequency with quenching. In this case the frequency shift is due to the change in the mean decay lime, as the differential phase maximum depends on the lifetime, as well as the correlation time, of the molecule, It should also ho remembered that the intensity decays become more heterogeneous with quenching, in which case a perfect Lorentzian shape is not expected for Δω (or more correctly log Λω) versus log-frequency. The decreasing phase angles on the high-frequency side of the curve indicate the absence of tryptophan motions: other than overall protein rotation.
Also shown in Fig. 2 are the frequency-dependent values of the modulated anisotropy (lower panels). At low frequency these values are equivalent to the steady-state anisotropies, which are seen to increase as the lifetime is decreased by quenching- In the case of RNuse T1, the tryptophan residue is highly shielded from the aqueous phase, and the lifetime is decreased only 2-fold in the presence of 1.5 M acrylamide, As expected, the decreased lifetime results in increased values of rω at low frequencies. At high frequencies rω is expected to become equal to the value of r0, which is not expected to depend on quencher concentration. These expectations were satisfied by the data, and the high frequency value of r0 was found to be 0.31, is in good agreement with the value of 0.31 measured for NATA in propylene glycol at −60°C, which should correspond closely to r0. The simulations (Fig. 1) indicated that motions on the 100 ps timescale or faster result in the high frequency (up to 2 GHz) values of rω considerably less than r0. Hence, the rω data also indicate the absence of rapid motions of the tryptophan residue in RNase T1.
The data for all five acrylamide concentrations were analyzed globally to recover the anisotropy decay. This decay appears to be best described as a single exponential with a correlation time near 6.5 ns (Table 1), An essentially identical anisotropy decay was obtained with oxygen quenching (Table 2). The agreement between the results obtained with two different quenchers, and the ability to fit the data at all quencher concentrations to a single anisotropy decay, strongly supports our assumption that the anisotropy decay is not altered by the quencher. The data for RNase T1 do not support a two correlation time model We only observed a modest 20% decrease in for the acrylamide series (Table 1), and no decrease in for the oxygen series (Table 2). While the probability of a 20% increase in , with our approximate 150 deg of freedom is small (i.e. 5%), we have found from experience that such modest decreases in generally do not result in reliable Fits. Moreover, for analysis of either series of data, the second correlation time was also on the ns timescale, i.e. is long compared to the correlation times characteristic of independent motions of the tryptophan residues. Also, the amplitude of this motion was small. Hence, it appears that this residue does not display detectable rapid motion on top of the overall rotational diffusion of the protein, which is in agreement with the recent observations of James et al. (1985) using a picosecond laser and time-correlated single-photon counting.
Similar data for the S. nuclease are shown in Figs. 3 and 4. The profiles are similar to those of RNase T1, in that the distribution is nearly Lorentzian. However, the phase angles for the nuclease are distributed asymmetrically, with higher values on the high-frequency side of the curves. This effect was observed for both acrylamide (fig. 3) and oxygen quenching of nuclease (Fig.4). The elevation in the high frequency phase angles is consistent with some degree of tryptophan segmental motion. The extent of this motion is not very large, as is indicated by the high frequency values of rω, which approach the expected value of r0.
Fig. 3.
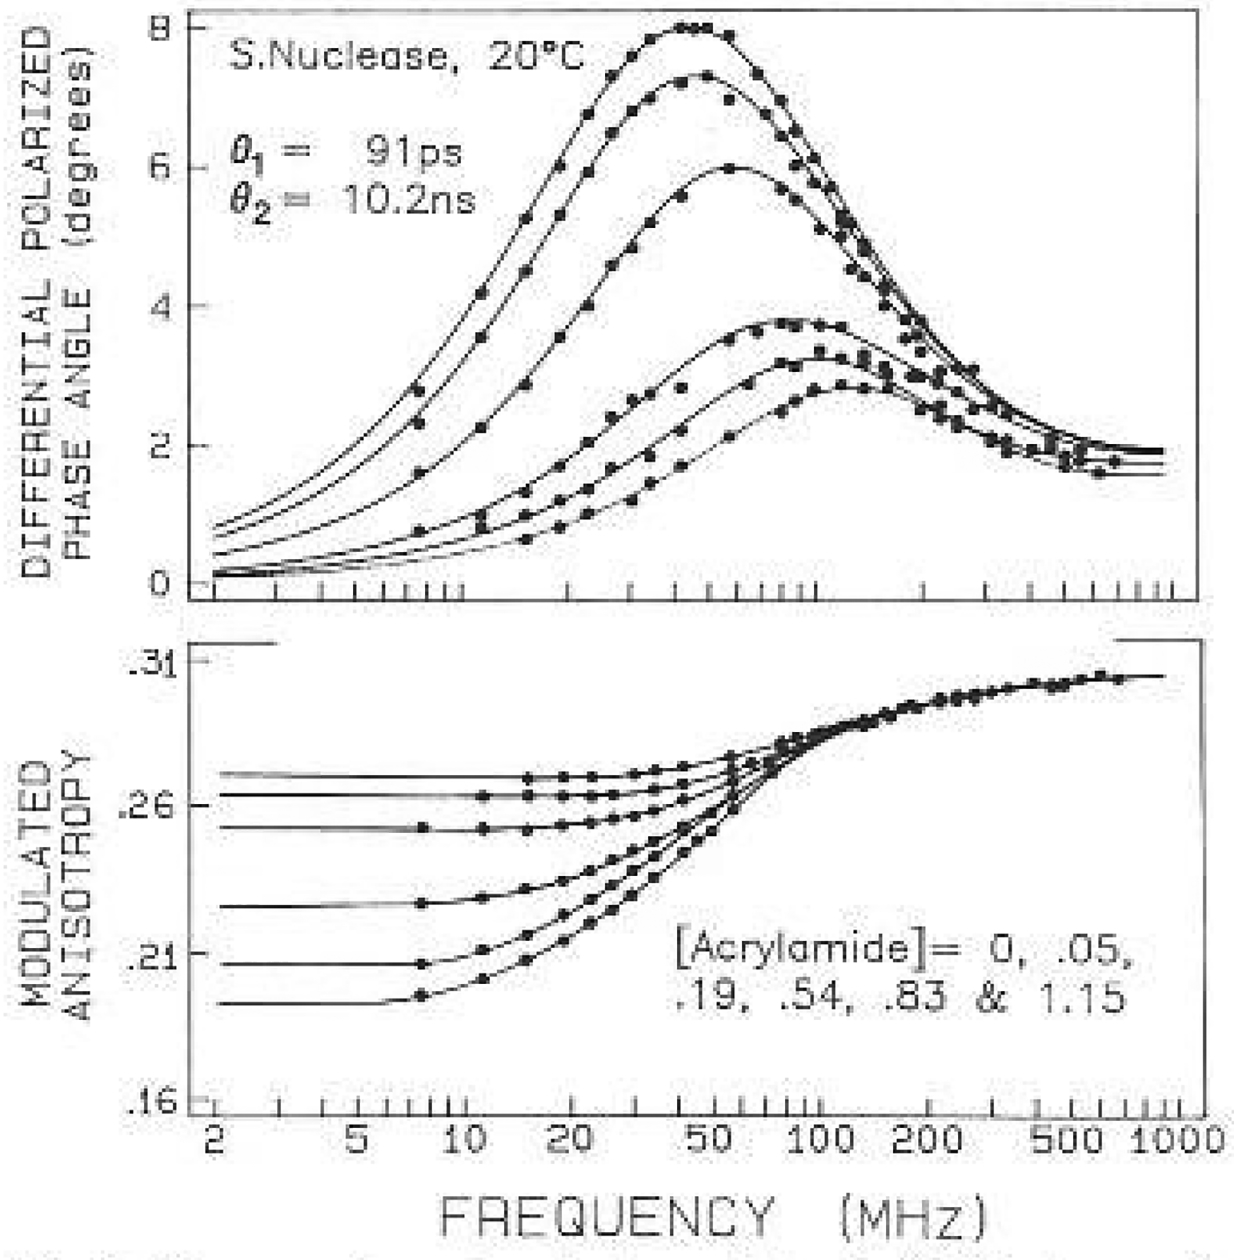
Frequency-domain anisotropy data for S. Nuclease with acrylamide quenching. The acrylamide concentrations are 0, 0.05, 0.19, 0.54, 0.83 and 1.15 M. The intensity decay parameters for 0 and 0.83 M acrylamide are given in Table 3
Fig. 4.
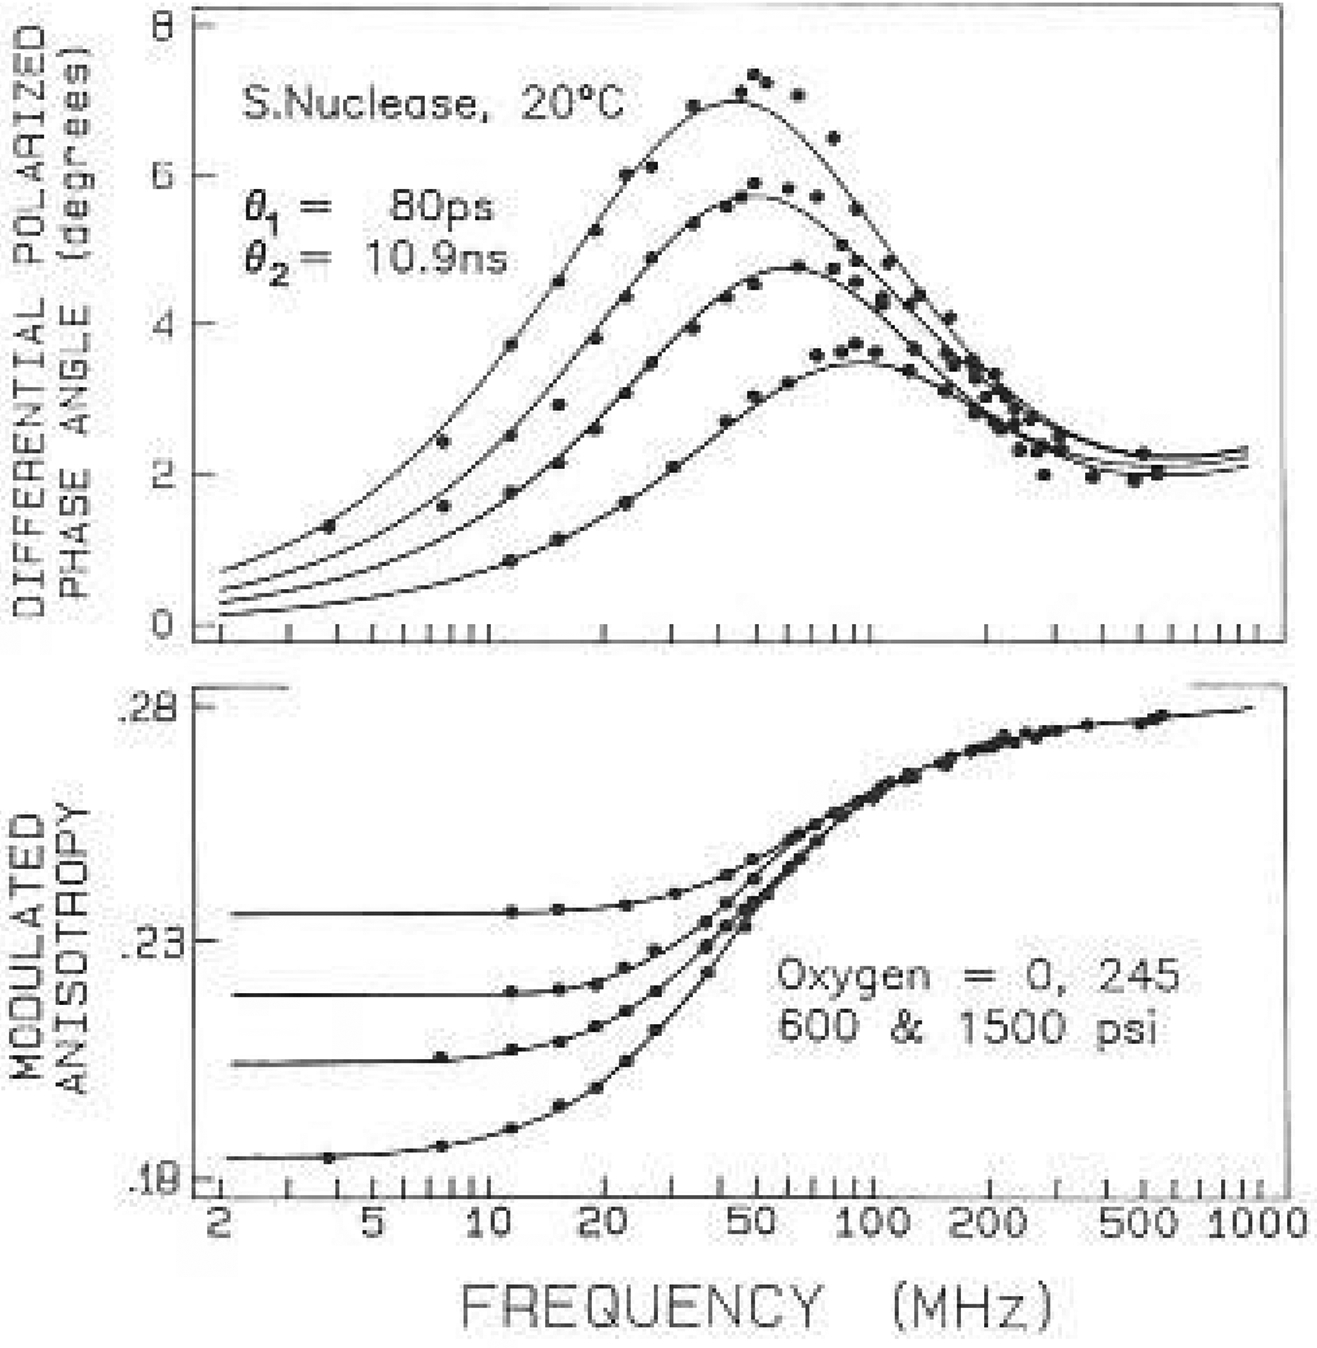
Frequency-domain anisotropy data for S. Nuclease with oxygen quenching. The oxygen concentrations were 0, 0.0247, 0.0588 and 0.1428 which are equivalent to equilibration with oxygen pressures of 0.245, 600 and 1485 psi at 20°C. respectively. The intensity decay parameters for 0 and 1485 psi oxygen (0.143 M) are given in Table 4
The anisotropy decay of the nuclease displays two correlation times, 90 and 10 200 ps. The latter is clearly due to overall rotation, while the shorter is the result of segmental motion of the tryptophan. The amplitude of this motion was rather small, contributing only about 6% to the total zero-point anisotropy. Nonetheless, the presence of the 90 ps motion is clearly required by the data. Attempts to fit the data to a single correlation time resulted in a two-fold increase in . For our experiments, with about 150 deg of freedom, a model yielding 2-fold increase in can be rejected with a certainty of 99.9% More precisely, such an increase in can occur with only a 0.1% probability as a result of random sampling the data (Bevington 1969). The similar values of the correlation times and the amplitudes obtained with the two quenchers increases our confidence in the bi-exponential analysis.
The most dramatic feature of the anisotropy data is the wide variation of the form of the frequency responses. This variation is seen by comparing the data for monellin (Fig. 5) or ACTH (Fig. 6) with the data from RNase T1 or S. nucleasc (Figs. 2–4). Much greater asymmetry was seen for monellin, which shows evidence for two maxima in the differential phase profiles (Fig. 5). These differences are due to the larger amplitude of the tryptophanyl segmental motions, which increase the high frequency phase angles. For monellin the maximum centered near 80 MHz is due to the 6 ns correlation time. As the emission is quenched, the overall protein rotation contributes less to the data, resulting, in a single maximum near 300 MHz. The phase angles at higher frequencies are due predominantly to the 275 ps tryptophan motion. This is seen from the dashed line, which represents phase angles expected for a 275 ps motion, r0 gi = 0.075, and with the intensity given by the three-component decay in Table 4. In the case of monellin the tryptophan residue shows substantial local motions, with an amplitude accounting for 25% of the total zero-point anisotropy. The larger amplitude of the tryptophan motions is also evident from the modulated anisotropies, which show evidence of a shoulder in the absence of quenching, but not with quenching (lower panel, Fig. 5). The longer timescale (275 ps) of this larger amplitude motion suggests that it results from concerted motions of several amino acid residues, whereas the more rapid motion found for the nuclease may represent local oscillations of the indole ring. Alternatively, the longer apparent correlation time for the larger amplitude motions may be the result of “wobbling in a cone”, as described by Kinosita et al. (1977). At this time we cannot stale whether the observed correelation times reflect this one model, or the apparent viscosity of the protein which surrounds the tryptophan residues.
Fig. 5.
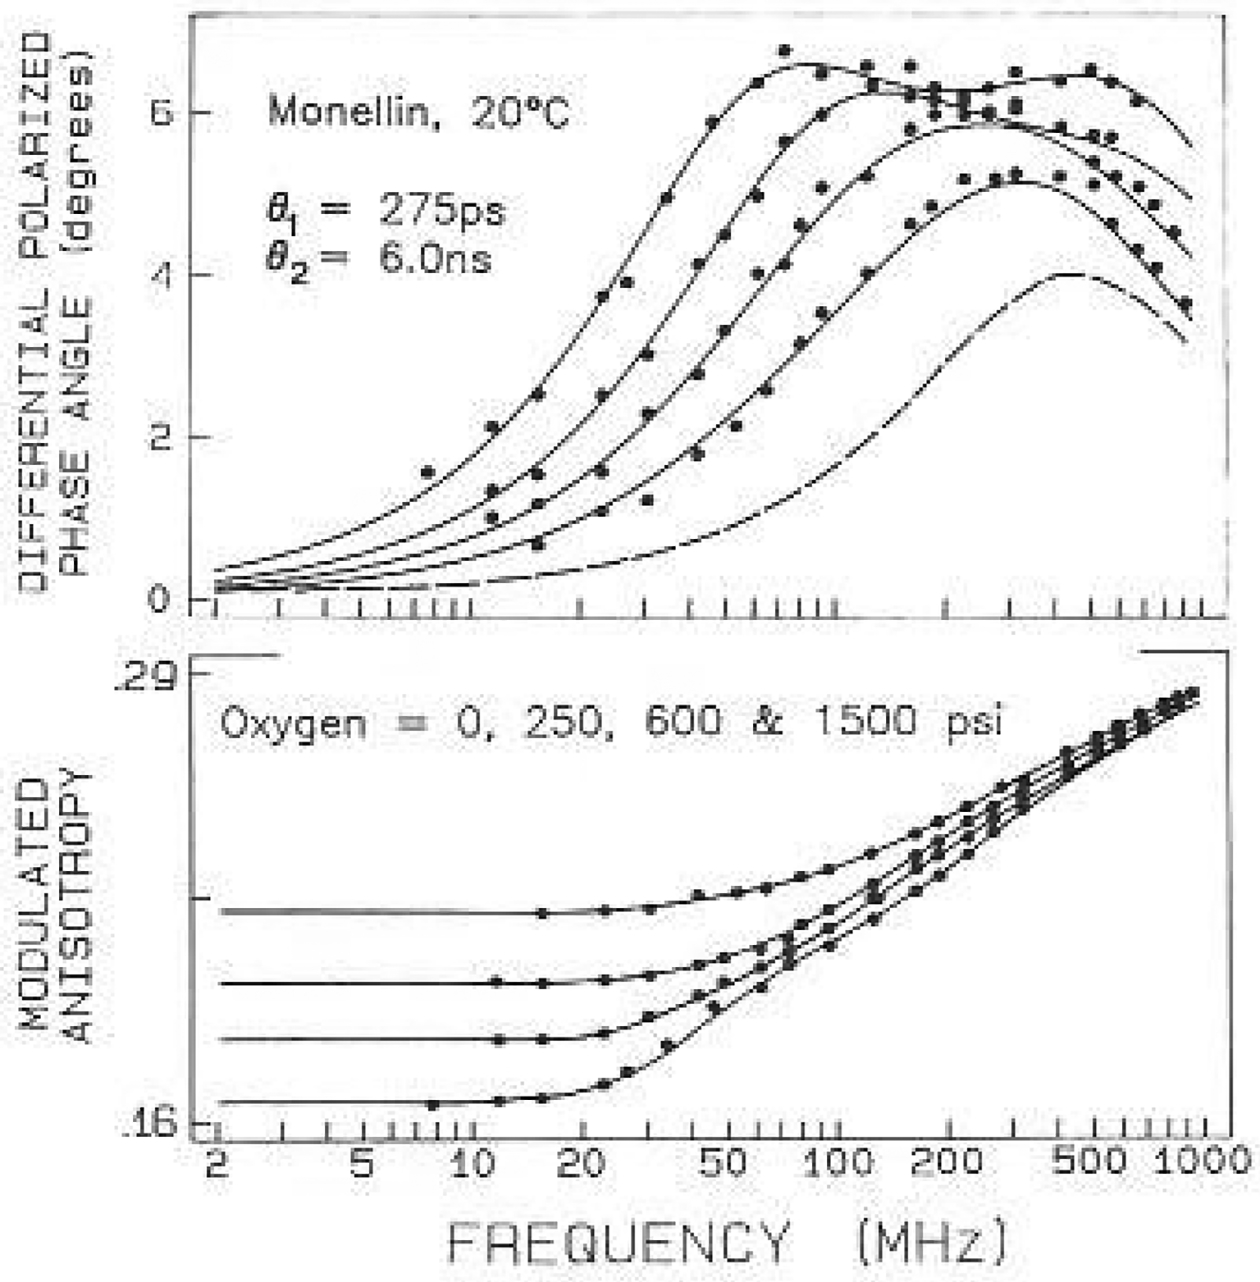
Frequency-domain anisotropy data for monellin with oxygen quenching. Data are shown for oxygen pressures of 0, 250, 600 and 1500 psi. The dashed lines show the values expected for a correlation time of 275 ps, with an amplitude of 0.075, and the three-component intensity decay for quenched monellin (Table 4, 0.144 M oxygen)
The last protein studied was ACTH (1 24), which behaves as a random coil in aqueous solution. The single tryptophan residue is located at position 8, and is thought to be fully exposed to the aqueous phase (Eftink and Ghiron 1976). There is only slight evidence of the overall ACTH rotation in the phase data (Fig. 6), which is seen as a shoulder near 100 MHz. After quenching the phase data is more characteristic of a single correlation time on the sub-nanosecond timescale. It is interesting to notice that the timescale of the local motion (200 ps) appears to be slower than that found for the nuclease (90 ps).
Uncertainties in the correlation times
It is important to know the uncertainties of the correlation times summarized in Tables 1 and 2. While the uncertainties can be estimated from the feast-squares analysis (Bevington 1969), these estimates are suspect because they do not consider correlation between the parameters (Johnson 1983: Johnson and Frasier 1985). We analyzed the data in a manner which is time-consuming, but which accounts for all possible correlation among the parameters. The data sets were analyzed with a fixed value for one of the correlation times, with the other correlation time and two amplitudes (r0 g1, and r0 g2) as floating parameters. The least-squares fits were recalculated to determine the new minimum value of with the floating parameters adjusted to compensate for the fixed correlation time. This procedure has been used previously for fluorescence intensity decays (Lakowicz et al. 1984) and for decays of fluorescence anisotropy (Maliwal and Latowicz 1986; Lakowicz et al. 1987b; Gryczynski et al. 1988a, b). We stress that our procedure of recalculating the surface for each parameter, with the remaining parameters varied, is more rigorous than the search along parameters or eigenvector axes (Beechem et al. 1985).
The correlation time surface is shown in Fig. 8 for the S. nuclease data. Determination of the experimental uncertainties requires a selection of the probability that random fluctuations could account for the elevated value of We determined the range of correlation times consistent with the data by choosing the range of values, over the minimum value of , which would occur 67% of the time for random fluctuations in the data. For instance, a typical frequency-domain data set might contain data at 20 frequencies, resulting in 40 data points (phase and modulation) at each quencher concentration. At four quencher concentrations there are about 160 data points, and hence nearly 160 deg of freedom. An elevation of by 1.05-fold over the minimum value is expected to Occur 33% of the time for random errors. Hence, this range of values may be regarded as defining the range of correlation times consistent with the data. A 1.2-fold elevation in is adequate to reject the fixed value of the correlation time with a probability of 95%.
Fig. 8.
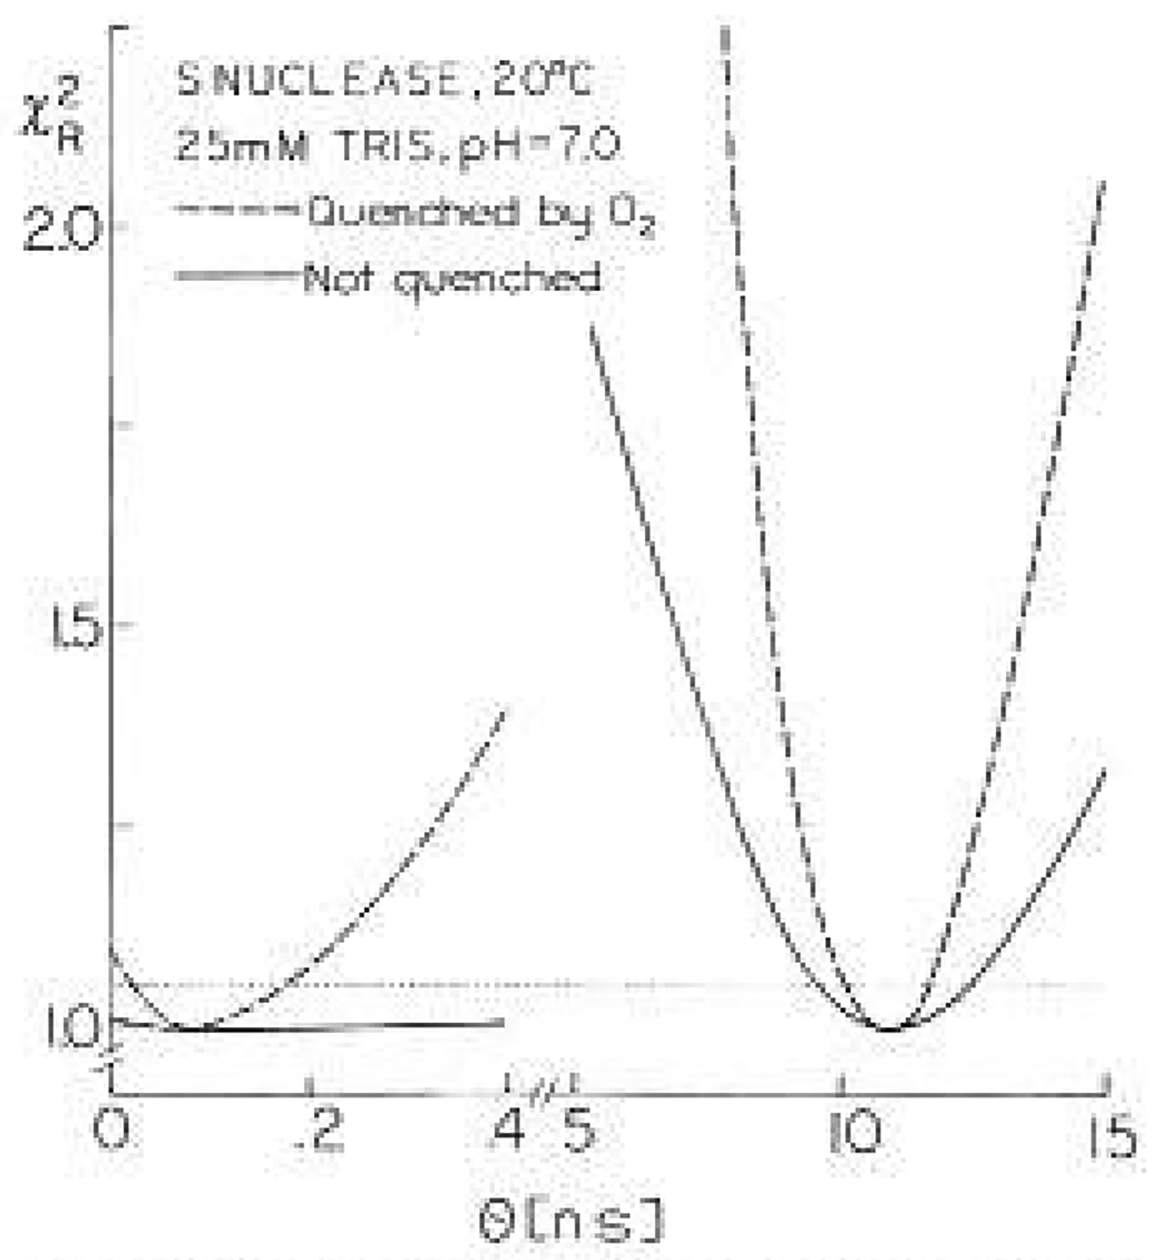
surface for the correlation rimes of nuclease using the frequency-domain data. The solid lines are for analysis of the data from the unquenched sample. The dashed line is for global analysis of the data at four oxygen concentrations (Fig. 4). We estimate the uncertainty in the correlation times from the range of values which should occur 2/3 of the time due to random errors (≈67% confidence interval). Values of above the horizontal dotted line should occur 33% of the time for repetitive measurements with random errors
Examination of the surfaces from this procedure reveals the resolution of the measurements as well as the uncertainties in the correlation times. It is important to understand how the uncertainties estimated from the surfaces compare with other estimates of the uncertainties. This comparison will be described elsewhere (Lakowicz et al. 1990). Briefly, this method probably overestimates the uncertainties by several-fold, depending upon the specific data in question. The uncertainties recovered from the least-squares analysis (Bevington 1969) are typically two- 10 ten-fold smaller that those found from the surface. Also, the agreement between the oxygen and aerylamide experiments is closer than might be expected from the 67% limits on the surfaces. Finally, we used repetitive simulations and analyses to recover the range of correlation times expected from random errors (Lakowicz et al. 1990), and this range is two to eight-fold smaller than found from the surface. For instance, the repetitive simulations indicate an uncertainty of 36 ps for the short correlation time of nuclease, as compared to 65 ps from the surface. For the 10.9 ns correlation time the repetitive analysis indicates as uncertainty of 0.09 ns, whereas the surface indicates a range of 0.8 ns. Comparison of the independent measurements on S. nuclease in Tables 1 and 2 indicates that the smaller uncertainty estimates are adequate to account for the variation between the measurements. Hence, the uncertainties in the correlation times described in the following paragraphs are overestimates of the actual uncertainties. However, irrespective of this probable overestimate of the uncertainties, we believe it is preferable to use the surfaces described above. If the parameter values are closely spaced, then parameter correlation is the dominant determinant of the uncertainties. Under these conditions the normal uncertainties for the least-squares error matrix will underestimated the uncertainties.
The surface for nuclease illustrates the enhanced resolution of the anisotropy decay which results from global analysis (Fig. 8). If only the data from the unquenched sample is analyzed, then there is little resolution of the faster motion. This is seen from the lack of sensitivity of to the value of this correlation time (solid line). However, even this weak dependence of adequate to obtain reasonable estimates of the short correlation time, In contrast is strongly dependent on the value of this correlation time (dashed line) when the quenched and unquenched data are globally analyzed. It should be noted that the value of increases as the short correlation time is decreased towards zero. The 10% increase in found at ϕ1 = 2 ps indicates that this correlation time can be rejected with 75% certainty. The surface for the acrylamide-quenched samples of the nuclease display a similar dependence of on the short correlation time (not shown). As was discussed above, these are probably conservative estimates of the range of correlation times consistent with the data. Repetitive simulation and analysis indicates she range of the 90 ps correlation time is ±30ps. Hence, the data for nuclease do not appear to be consistent with a correlation time near 2 ps. There is less uncertainty in the short correlation times found for monellin or ACTH because these correlation times are longer and of larger amplitude.
Sub-nanosecond anisotropy decays
We examined the anisotropy decays of NATA, and of two tripeptides, leu-trp-leu and gly-trp-gly. We felt that data on these tripeptides and NATA might be useful for comparison with molecular dynamics calculations, possibly in the presence of solvent. We expected the correlation time of NATA to be characteristic of tryptophan motions in proteins, and that of the tripeptides lo be typical of concerted motions of several amino acid residues. In tripeptides, the central tryptophan residue is adjacent to either gly or leu, in anticipation of possible effects of the larger leucyl side chains on the indole motions.
The anisotropy data for leu-trp-leu and gly-trp-gly are shown in Figs. 9 and 10, respectively. In each case the upper frequency limit of the measurements was increased about 5-fold by quenching. The two tripeptides showed distinct anisotropy decays. The decay of leu-trp-leu was characterized by a single exponential with a correlation time of 160 ps. The leucine-containing tripeptide shows a maximum in the differential phase profile near 800 MHz (Fig. 9). The maximum near 800 MHz is probably the result of the indole motions being hindered by the adjacent leucyl side chains, resulting in the anisotropy decay being due predominantly to overall rotational diffusion of the tripeptide. If such a maximum exists for gly-trp-gly it occurs near 2 GHz or higher (Fig. 10). The anisotropy decay of gly-trp-gly displayed two correlation times with values of 39 and 135 ps. Apparently, the leucyl side chains suppress the 39 ps component which was seen in gly-trp-gly. Using (11) and (12) this faster motion (Θ1) has a true correlation (ΘT) time of 55 ps, which we believe is due to motions of the indole ring relative to the tripeptide. For the still smaller molecule NATA, there is no evidence of a differential phase maximum even at 2 GHz (Fig. 11). This is, of course, due to the faster overa11 rotation of NATA as compared to the tripeptides. The correlation time (ΘT) of 56 ps for NATA is close to the correlation time (ΘT) of the indole motion for gly-trp-gly. In this tripeptide the motion is large in amplitude, accounting for 70% of the zero-point anisotropy. For NATA the 55 ps motion accounts for the entire anisotropy decay, at least within the currently available resolution.
Fig. 9.
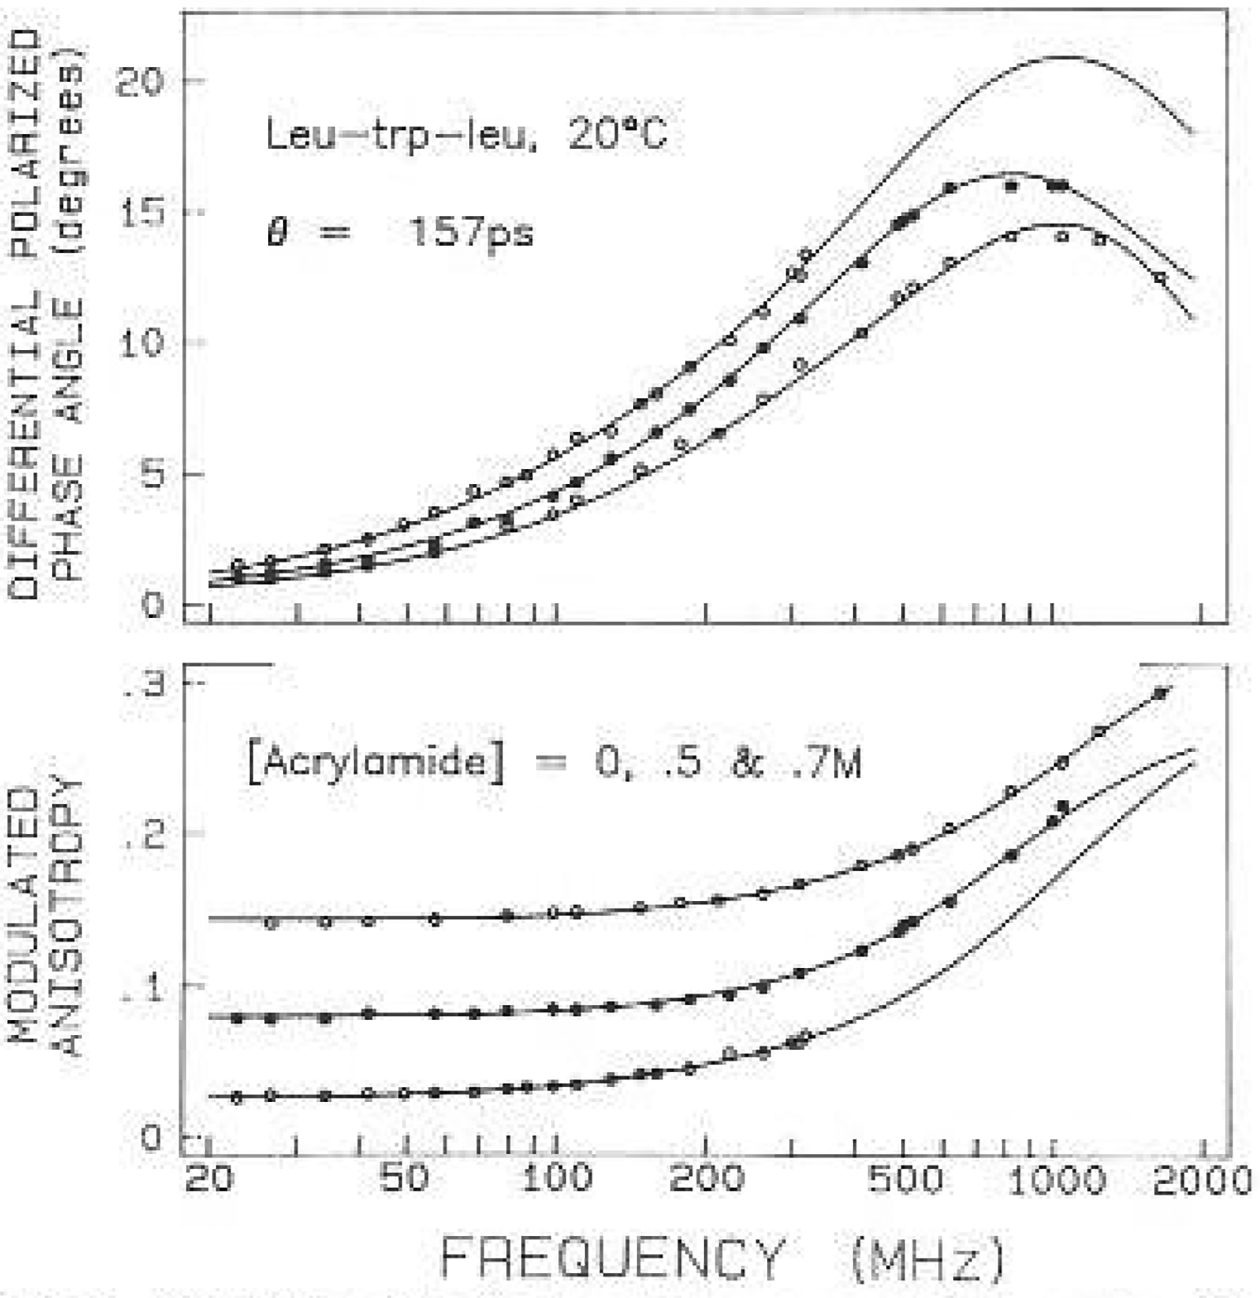
Anisotropy data for Leu-tip-leu quenched by acrylamide. Data are shown for acrylamide concentrations of 0 (○). 0.5 (●) and 0.7 M (○)
Fig. 10.
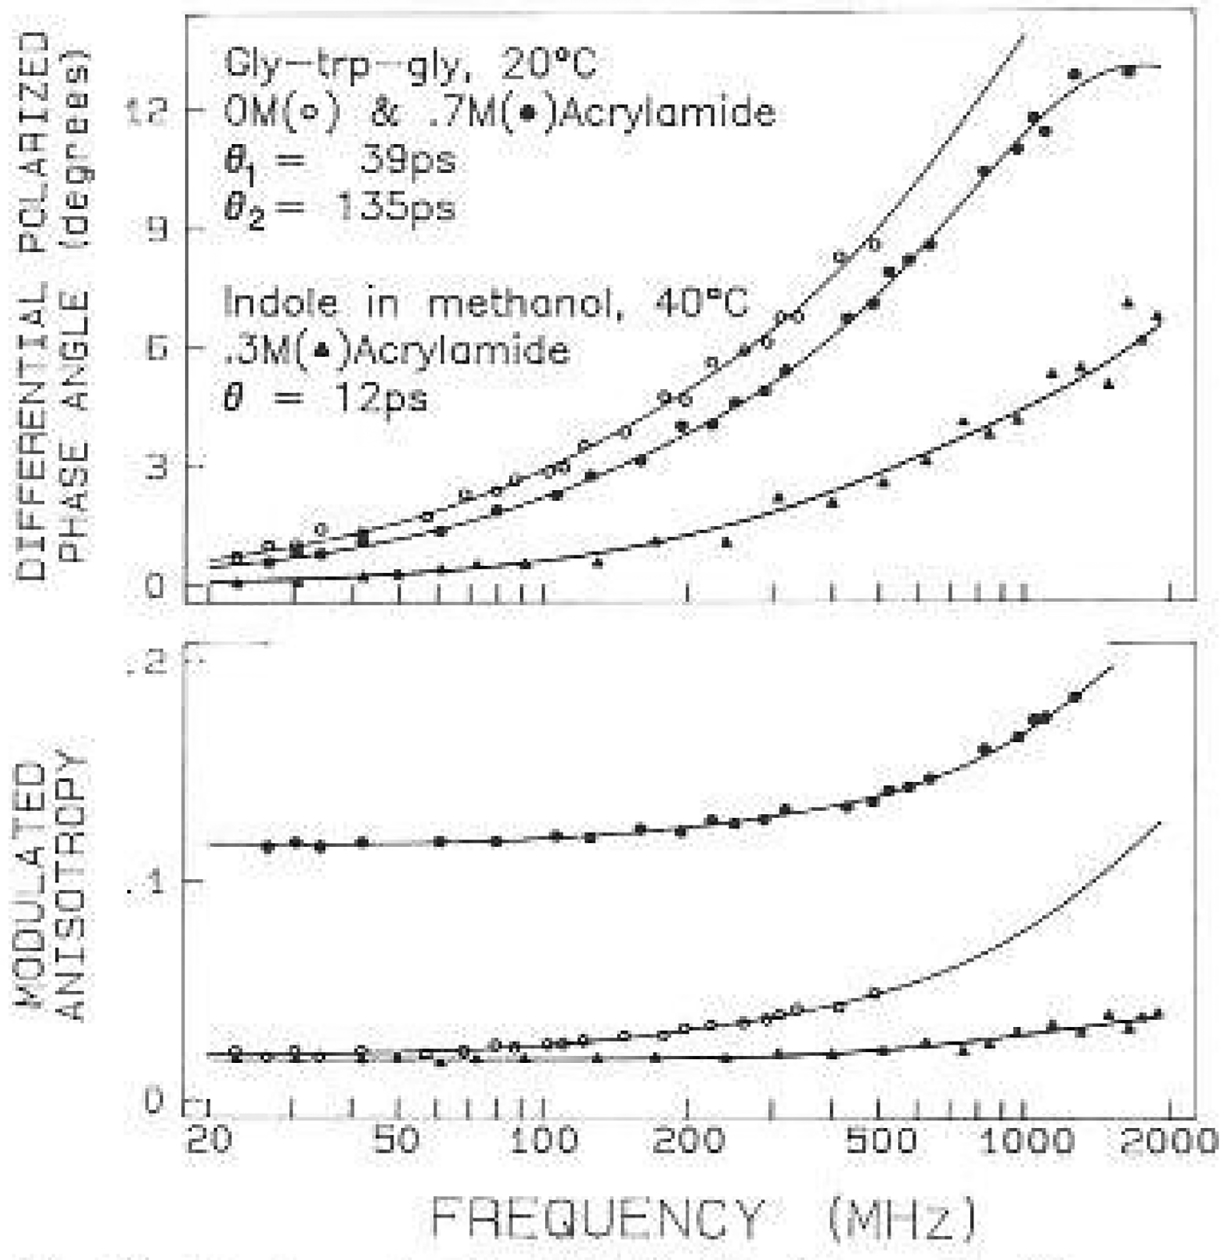
Anisotropy data for Gly-Trp-CJIy. The acrylamide concen-trations are 0 (○) and 0.7 M (●). Also shown are data for indole in methanol at 40°C. quenched by 0.3 M acrylamide (Λ)
Fig. 11.
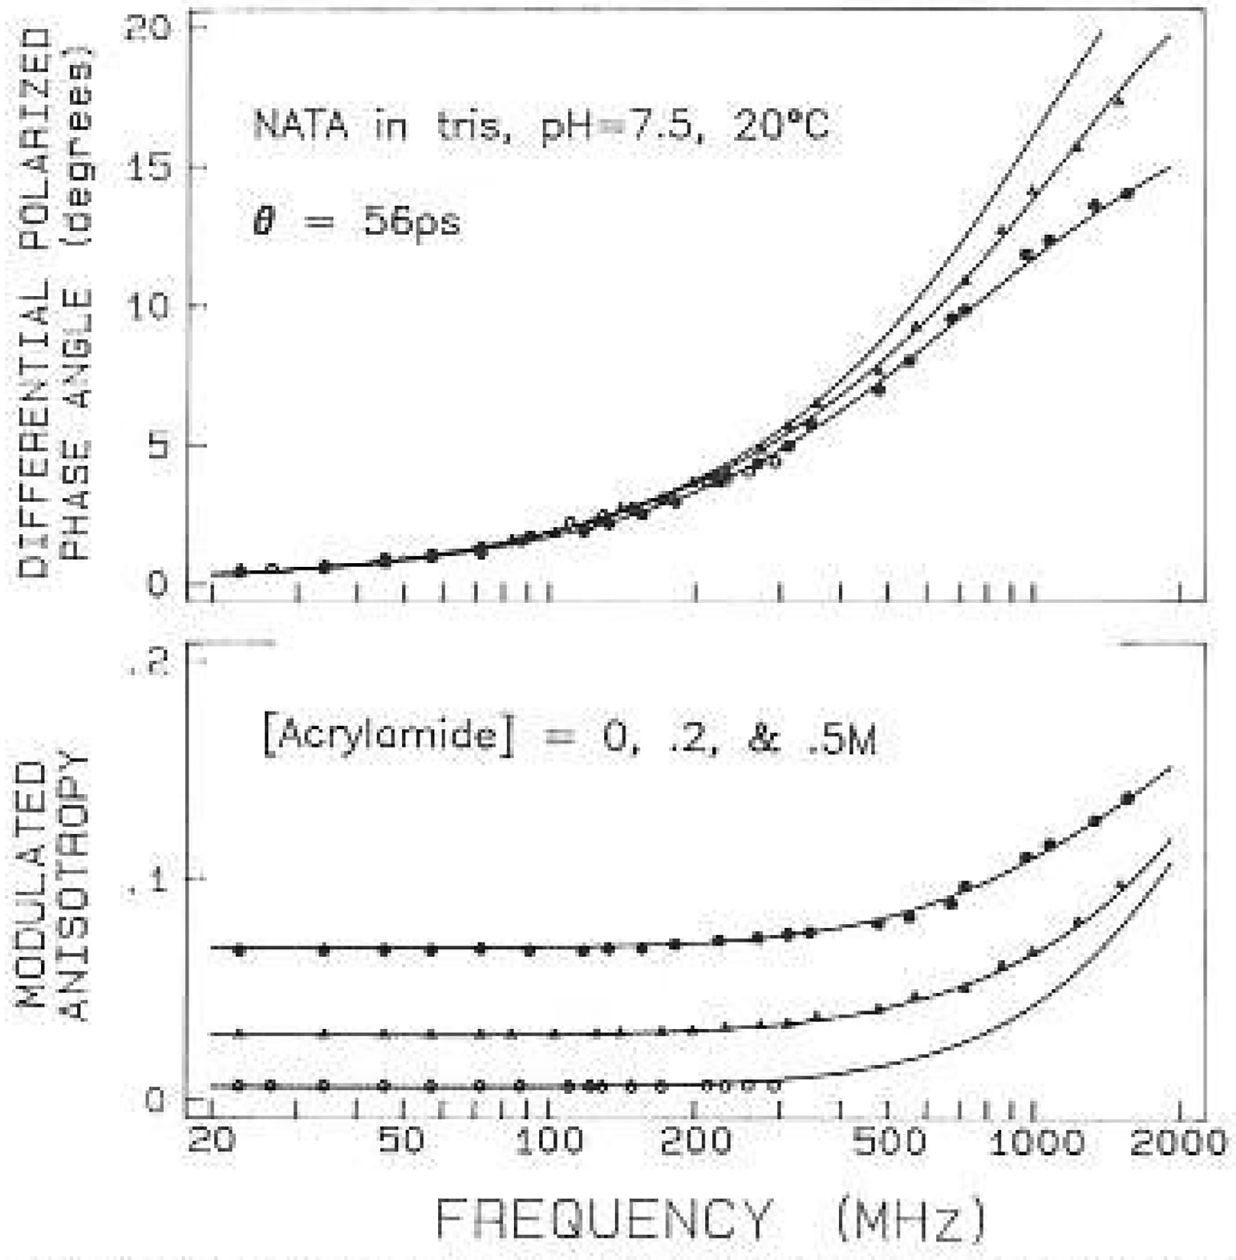
Anisotropy data lor NATA quenched by acrylamide. The acrylamide concentrations are 0 (○), 0.2 (Λ) and 0.5 M (●)
Remarkably, there is relatively little uncertainly in these values, as can be judged from the surfaces for these correlation times (Fig. 12). Using the criteria described above, the 39 ps value is known to within ±20 ps and the 135 ps value lo within ±55 ps. Repetitive simulation and analysis indicates somewhat smaller uncertainties, these values being ±11 ps for the 39 ps correlation lime and ±34 ps for the 135 ps correlation time. The usefulness of obtaining data front quenched samples is immediately evident from Fig. 12. Without this data the value of is insensitive to the precise values of the correlation times, and it might even be difficult to determine that the anisotropy decay of gly-trp-gly is a double exponential, For NATA we recovered a single correlation time of 56 ps. Examination of its surface indicates the 67% probability range is from 54 to 58 ps. There appears to be little uncertainly in this 56 ps correlation time. This value could also be recovered by analysis of the data from only the unquenched sample. However, the 67% range increased lo 1 lo 100 ps, as indicated by a 1.1-fold increase in with 45 deg of freedom. It should be noted that these ranges were calculated with r0 as a variable parameter. If r0, is held fixed at the known value then the uncertainly is ±0.8 ps and ±2 ps, for the quenched and the unquenehed samples, respectively. This illustrates the values of fixing r0 whenever its value is known.
Fig. 12.
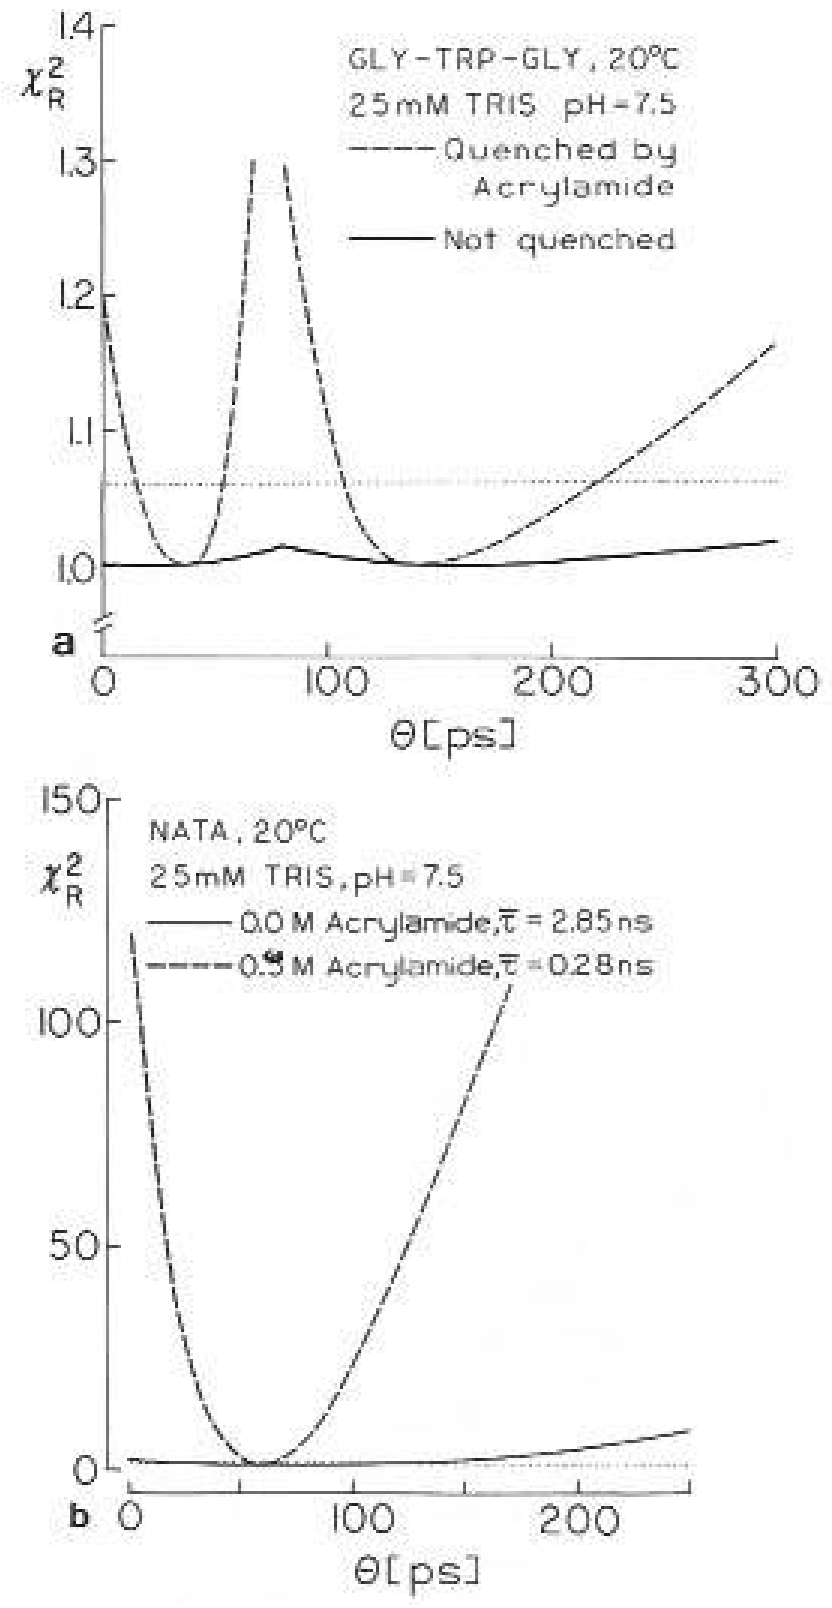
surface for the correlation times of Gly-tyr-gly (a) and of NATA (b) in aqueous solution at 20°C. The solid lines are for the unquenched samples, For gly-trp-gly (a) dashed lines are the values for global analysis of data for 0.0, 0.3 and 0.7 M acrylamide. For NATA (b) the dashed line is for 0.5 M acrylamide. The horizontal dotted lines are the 67% confidence levels for for the quenched samples
A 12 picosecond correlation time
The phase angles for NATA were as large as 16 deg for a frequency of 2 GHz (Fig. 11). Since the random error in the differential phase angles is 0.2 to 0.5 deg it was of interest to identify a molecule which would rotate more rapidly and thereby test the fastest motions which could be measured by our technique. We chose indole because it lacks the side chain of NATA, and, we used methanol at 40°C as a solvent because we expected the low viscosity (0.456 cp) to ensure a short rotational correlation time. Indole was quenched with 0.3 M acrylamide to shorten its lifetime and to allow measurements to the 2 GHz limit. In the presence of acrylamide its decay time was near 0.2 ns. Even in this highly fluid solvent the differential phase angles are as high as 7 deg at 2 GHz (Fig. 10). A correlation time of 12 ps was recovered, irrespective of whether the value of r0 was held fixed or floating (Table 1). The uncertainty in this 12 ps correlation time is quite small. If r0 is held fixed in the analysis then the surface indicates an uncertainty of less than 1 ps. If r0 is left free, then the range is ±3 ps.
Discussion
The frequency-domain measurements do not provide a direct visualization of the time-dependent anisotropy decays, Hence, some of the decays are reconstructed in Fig. 13. The figures show only the initial portions of the decay, as they become linear at longer times due to domination by overall rotation of the proteins. There are wide variations among the proteins and peptides. The buried residue in RNase T1 shows no evidence of segmental tryptophan mobility, and the decay is characterized by a single correlation time (not shown). A small fast component is seen for nuclease, and a larger initial component is seen for monellin. For ACTH only the initial fast component is visible on this timescale. The anisotropy decay for leutrp-leu is a single exponential, and that of gly-trp-gly reveals both the local ring motions as well as overall peptide rotation. The anisotropy values can be interpreted in terms of the time-dependent angular displacements of the tryptophan residue, using either the classical inter-pretation of the average angle (Weber 1952), or specific models such as “wobbling in a cone” (Kinosita et al. 1977). In either case it should be possible to compare these experimentally determined anisotropy decays with theoretical calculations for these same peptides or proteins.
Fig. 13a, b.
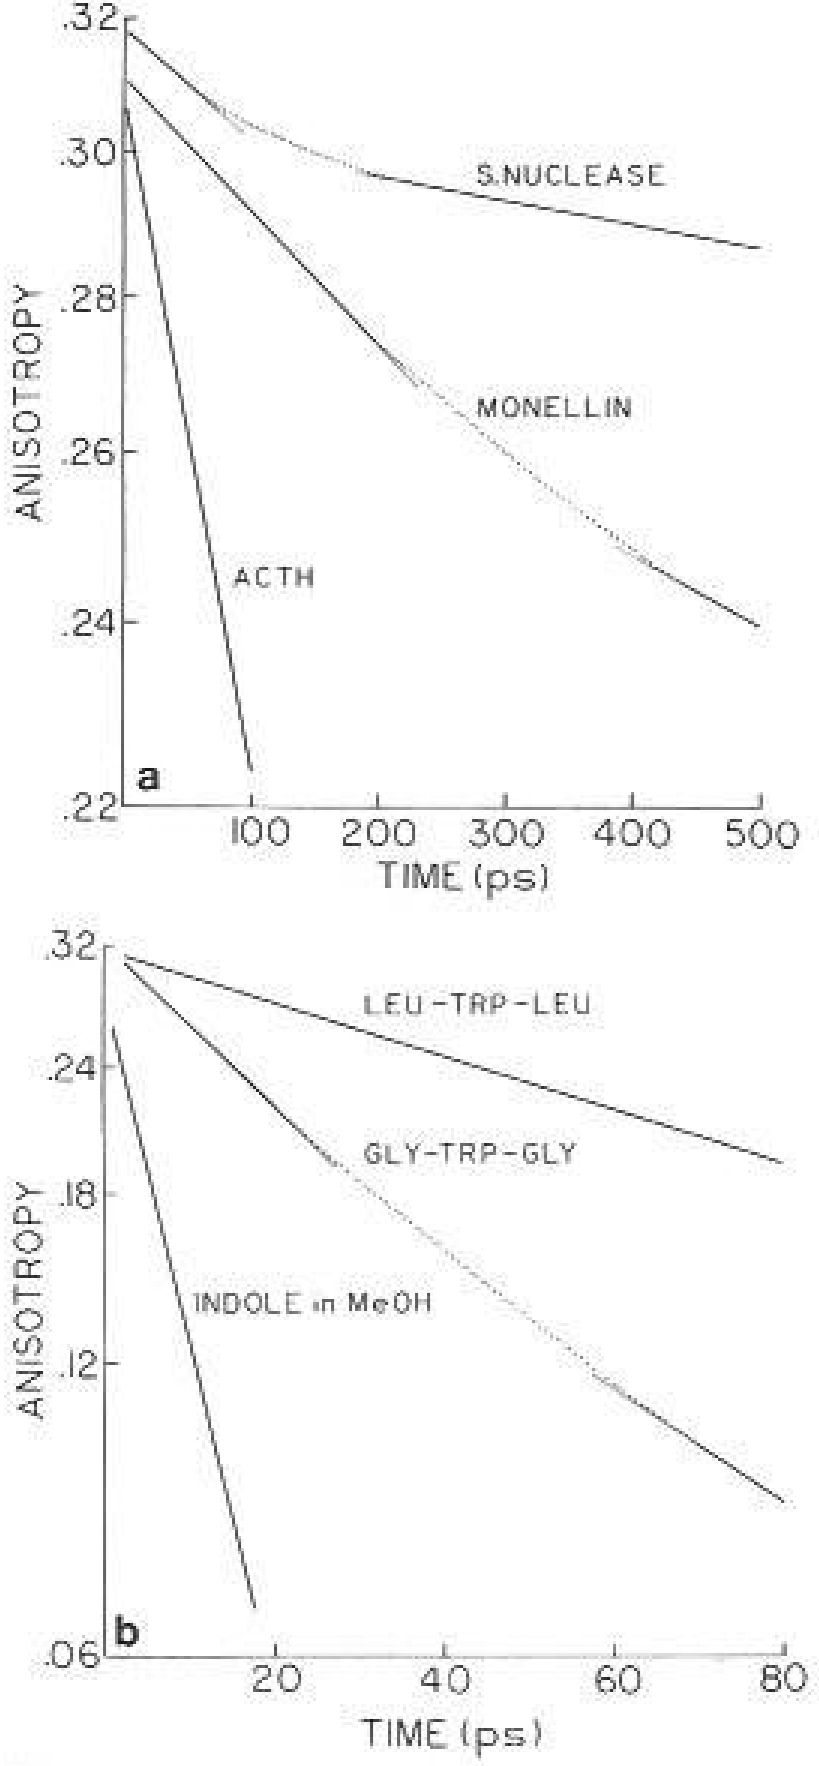
Time-dependent anisotropy decays of proteins and peptides, from the impulse response functions in Table 1
It would be useful to know whether the results of molecular dynamics calculations are consistent with the experimentally recovered anisotropy decays. Unfortu nalely. such calculations have not been performed for these proteins or peptides (Tables 1 and 2). Hence we examined the consistency of the calculations on other proteins with our data. Motions with characteristic times of 2 ps have been predicted for tyrosine in BPTI (Levy and Szabo 1982: Karplus and McCammon 1981), and for some tryptophan residues in lysozyme (Ichiye and Karplus 1983; Olejniczak et al. 1984). A 15 ps correlation time was predicted for tryptophan 62 in lysozyme (Ichiye and Karplus 1983). Hence, we attempted to fit the data to various anisotropy decay models which contained a fixed correlation time of (Θ1 or ΘT) 2 or 15 ps (Table 5), We used the two correlation time model with the total anisotropy (r0) free or fixed at the measured value of 0.317, We found that the data were not consistent with correlation times of 2 or 15 ps, as seen from elevated values of and/or unreasonable values for the amplitudes (r0 gi) For instance, if Θ1 (here close to ΘT) is held constant at 2 ps for either nuclease, monellin or RNase T1 then the amplitude of this motion is unacceptable high. For monellin the value of is easily adequate to reject a model with a 2 ps correlation time. If r0 is held fixed in the two correlation time analysis, along with a fixed 2 or 15 ps correlation time, then is substantially elevated for nuclease and monellin. For RNase T1 the value of is not elevated, but the amplitude of the motion is small. In all eases the amplitudes of the 2 ps motions are found to be small, 0.014, 0.035 and 0.007 for nuclease, monellin and RNase T1, respectively, The agreement is not sub-stantially improved if the short correlation time is increased lo 15 ps. With r0 variable for nuclease the total anisotropy (0.393) is unacceptably high and for monellin the value of is substantially elevated. With r0 fixed and Θr = 15 ps the values are both elevated. We also tried to fit the data to a three correlation time model. In this case it was necessary to fix r0 in order to obtain convergent analyses. This analysis tended to yield insignificant amplitudes for the 2 or 15 ps motion. with the intermediate correlation time tending towards those listed in Tables 1 and 2. From these analyses we conclude that significant indole motions with correlation times for 2 to 15 ps are not consistent with the present data. Recently. two divergent reports appeared on simulated molecular dynamics or the trp residue in RNase T1 (Axelsen and Prendergast 1989; MacKerrel et al. 1988). Our experi-mental results on RNase T1 are not in agreement with the 100 ps-22 degree motion found by MacKerrel et al. (1988). but are consistent with the simulated anisotropy plateau of 0.279 found by Axelsen and Prendergast (1989). It should be emphasized that a rigorous comparison of experiment results and calculations requires that results be compared for the same proteins.
Table 5.
Analysis of data for S. Nuclease, Monellin and RNase T1 with fixed ps correlation times
| Protein | Θi (ps) | r0 gi | |
|---|---|---|---|
| Monellin | <2>a | 2.35 | |
| r0 variable | 4 474 | 0.268 | 11.1 |
| r0 variable | <15> | 0.361 | |
| 4 536 | 0.266 | 9.9 | |
| r0=0.317 | <2> | 0.035 | |
| 3 796 | 0.282 | 37.9 | |
| r0=0.317 | <15> | 0.036 | |
| 3 888 | 0.281 | 32.3 | |
| r0=0.317 | <2> | 0.005 | |
| 361 | 0.073 | ||
| 6 004 | 0.239 | 1.57 | |
| <15> | 0.006 | ||
| 370 | 0.072 | ||
| 6028 | 0.239 | 1.55 | |
| Nuclease | <2> | 0.652 | |
| r0 variable | 10 091 | 0.320 | 1.03 |
| r0 variable | <15> | 0.091 | |
| 10 104 | 0.302 | 1.01 | |
| r0=0.317 | <2> | 0.014 | |
| 9 890 | 0.302 | 1.95 | |
| r0=0.317 | <15> | 0.014 | |
| 9 932 | 0.303 | 1.72 | |
| r0=0.317 | <15> | 0.012 | |
| 89 | 0.061 | ||
| 10 160 | 0.951 | 0.97 | |
| RNase T1 | <2> | 0.276 | |
| r0 variable | 6 550 | 0.310 | 1.72 |
| <15> | 0.039 | ||
| 6 550 | 0.309 | 1.71 | |
| r0=0.317 | <2> | 0.007 | |
| 6 520 | 0.310 | 1.76 | |
| r0=0.317 | <15> | 0.007 | |
| 6 520 | 0.310 | 1.75 | |
| r0=0.317 | <2> | 0.005 | |
| 2 530 | 0.032 | ||
| 7 350 | 0.280 | 1.44 | |
| r0=0.317 | <2> | 0.006 | |
| 3 060 | 0.048 | ||
| 7 640 | 0.263 | 1.45 |
The angular bracket indicates that the correlation time was held constant at the indicated values
Acknowledgement.
The authors thank M. I., Johnson. University of Virginia, for valuable discussions concerning error analysis, and the National Science Foundation for supporting development of the frequency-domain method.
Supported by grants DMB-8804931 and DIR-8710401 from the National Science Foundation. and GM-39617 from the National Institutes of Health. J. R. Lakowicz acknowledges support from the Medical Biotechnology Center at the University of Maryland. I, Gryczynki was on leave from University of Gdansk, Institute of Experimental Physics, Gdansk, Poland, with partial support from CPBP 01.06.2.01 (Poland). H, Cherek was on leave from Nicholas Copernicus University, Torun. Poland, with partial support from CPBP 01.06.2.03
Abbreviations:
- Ac
acrylamide
- ACTH
adrenocorticotropic hormone (1–24)
- BPTl
bovine pancreatic trypsin inhibitor
- NATA
N-acetyl-l-tryptophanamide
- RNase T1
ribonuclease T1
- S. Nuclease
staphylococcus aureus nuclease
References
- Albani J, AiperL R, Krajearski DT, Szabo AG (1985) A fluorescence decay time study of tryptophan in isolated hemoglobin subunits. FEBS Lett 182:302–304 [DOI] [PubMed] [Google Scholar]
- Arnone A, Bier CJ, Cotton FA, Day VW, Hazen EF, Richardson DC, Richardson JS, Yonath A (1971) A high resolution structuer of an inhibitor complex of the extracellular nuclease of Staphylo-coccus aureus. J. Biol Chem 256:2302–2316 [PubMed] [Google Scholar]
- Axelsen PH, Prendergast FG (1989) Molecular dynamics of tryptophan in ribonuclease T1 II. Correlations with fluorescence. Biophys J 56:43–66 [DOI] [PMC free article] [PubMed] [Google Scholar]
- Beechem JM, Knutson JR, Ross JBA, Turner BJ, Brand L (1983) Global resolution of heterogeneous decay by phase/modulation fluorometry. Biochemistry 22:6054–6058 [Google Scholar]
- Beechem JM, Ameloot M, Brand L (1985) Global and target analysis of complex decay phenomena. Anal Instrum 14:379–402 [Google Scholar]
- Belford GG, Belford RL, Weber G (1972) Dynamics of fluorescence polarization in macromolecules. Proc Natl Acad Sci 69:1392–1393 [DOI] [PMC free article] [PubMed] [Google Scholar]
- Bevington PR (1969) Data reduction and error analysis for the physical sciences. McGraw Hill, New York [Google Scholar]
- Blatt E, Husain A, Sawyer HW (1986) The association of acrylamide with proteins. The interpretation of fluorescence quenching experiments. Biochim Biophys Acta 871:6–13 [DOI] [PubMed] [Google Scholar]
- Brand JD, Cogan RH (1977) Fluorescence characteristics of native and denatured monellin. Biochim Biophys Acta 493:178–187 [DOI] [PubMed] [Google Scholar]
- Brochon JC, Wahl P, Auchet JC (1974) Fluorescence time-resolved spectroscopy and fluorescence anisotropy of the Staphylococcus aureus endonuclease. Eur J Biochem 41:577–583 [DOI] [PubMed] [Google Scholar]
- Chong PL-G, Weber G (1983) Pressure dependence of 1,6-Diphenyl-1,3,5-hexatriene fluorescence in single-component phosphatidylcholine liposomes. Biochemistry 22:5544–5550 [Google Scholar]
- Chuang TJ, Fisenthal KB (1972) Theory of fluorescence depolarization by anisotropic rotational diffusion. J Chem Phys 57:5094–5097 [Google Scholar]
- Clementi E, Corongiu G, Sarma MH, Sarma RH (1985) Structure and motion; membranes, nucleic acids and proteins. Adenine Press, Guilderland. NY [Google Scholar]
- Desie G, Boens N, DeSehryver FC (1986) Study of the time-resolved tryptophan fluorescence of crystalline α-chymotrypsin. Bio-chemistry 25:8301–8308 [DOI] [PubMed] [Google Scholar]
- Eftink MR, Ghiron CA (1976) Exposure of tryptophanyl residues in proteins. Quantitative determination by fluorescence quenching studies. Biochemistry 15:672–680 [DOI] [PubMed] [Google Scholar]
- Eftink MR, Ghiron CA (1987a) Frequency domain measurements of the fluorescence lifetime of ribonuclea.se T1. Biophys J 52: 467–473 [DOI] [PMC free article] [PubMed] [Google Scholar]
- Eftink MR, Ghiron CA (1987b) Does the fluorescence quencher acrylamide bind to proteins? Biochim Biophys Acta 916:343–349 [DOI] [PubMed] [Google Scholar]
- Eflink MR, Ghiron CA, Kautz RA, Fox RO (1989) Fluorescence lifetime studies with staphylococcal nuclease and its site-directed mutant. Biophys J 55:575–579 [DOI] [PMC free article] [PubMed] [Google Scholar]
- Ehrenberg M, Rigler R (1972) Polarized fluorescence and rotational Brownian rotation. Chem Phys Lett 14:539–544 [Google Scholar]
- Gillbro T, Sandstrom A, Sundstrom V, Wendler J, Holzwarth AR (1985) Picosecond study of energy transfer kinetics in phycobil-isomes of Synechococcus 6301 and the mutant AN 112. Biochim Biophys Acta 808:52–65 [Google Scholar]
- Gratton E, Limkeman M (1983) A continuously variable frequency cross-correlation phase fluorometer with picosecond resolution Biophys J 44:315–324 [DOI] [PMC free article] [PubMed] [Google Scholar]
- Gratton E, Limkeman M, Lakowicz JR, Maliwal BP, Cherek H, Laczko G (1984) Resolution of mixtures of fluorophores using variable-frequeney phase and modulation data. Biophys J 46:479–486 [DOI] [PMC free article] [PubMed] [Google Scholar]
- Gryczynski I, Cherek H, Laczko G, Lakowicz JR (1987) Enhanced resolution of anisotropic rotational diffusion by multi-wave-length frequency domain fluorometry and global analysis. Chem Phys Lett 135:193–195 [Google Scholar]
- Gryczynski I, Cherek H, Lakowicz JR (1988a) Detection of three rotational correlation times for a rigid asymmetric molecule using frequency-domain fluorometry. Biophys Chem 30:271–277 [DOI] [PubMed] [Google Scholar]
- Gryczynski I, Wiczk W, Johnson ML, Lakowicz JR (1988b) Life-time distributions and anisotropy decays of indole fluorescence in cyclohexane/ethanol mixtures by frequency-domain fluorometry. Biophys Chem 32:173–185 [DOI] [PubMed] [Google Scholar]
- Gurd FRN, Rothberg TM (1979) Motions in proteins. Adv Protein Chem 33:73–165 [DOI] [PubMed] [Google Scholar]
- Hcinemann H, Saenger W (1982) Specific protein-nucleic acid recognition in ribomicleasc T1–2′-guanylic acid complex: An x-ray study. Nature 299:27–31 [DOI] [PubMed] [Google Scholar]
- Hirs CHW, Timasheff SN (eds) (1986) Methods in enzymology vol 131: Enzyme structure, part 1., Sect. 11. Academic Press, Orlando, FL, pp 281–607 [Google Scholar]
- Ichiye T, Karpius M (1983) Fluorescence depolarization of tryptophan residues in proteins: a molecular dynamics study. Biochemistry 22:2884–2893 [DOI] [PubMed] [Google Scholar]
- James DR, Dreminer DR, Steer RP, Verral RE (1985) Fluorescence lifetime quenching and anisotopy studies of ribonuclease T1-Biochemistry 24:5517–5526 [DOI] [PubMed] [Google Scholar]
- Johnson ML (1983) Evaluation and propagation of confidence intervals in nonlinear, asymmetrical variance spaces: analysis of ligand binding data. Biophys J 44:101–106 [DOI] [PMC free article] [PubMed] [Google Scholar]
- Johnson ML, Frasier SG (1985) Nonlinear least-squares analysis In: Timasheff SN, Hirs CHW (eds) Methods in enzymology, vol 117 Academic Press; New York, pp 301–342 [Google Scholar]
- Karplus M (1986) Internal dynamics of proteins Methods in Enzy-mology, vol 131 Academic Press; Orlando. FL, pp283–307 [DOI] [PubMed] [Google Scholar]
- Karplus M, McCammon JA (1981) The internal dynamics of globular proteins. CRC Crit Rev Biochem 9:293–349 [DOI] [PubMed] [Google Scholar]
- Kasprzak A, Weber G (1982) Fluorescence depolarization and rotational modes or tyrosine in bovine pancreatic trypsin inhibitor. Biochemistry 21:5924–5927 [DOI] [PubMed] [Google Scholar]
- Kinosita K Jr, Kawato S, Ikegami A (1977) A theory of fluorescence polarization decay in membranes. Biophys J 20:289–305 [DOI] [PMC free article] [PubMed] [Google Scholar]
- Knutson JR, Beechem JM, Brand L (1983) Simultaneous analysis of multiple fluorescence decay curves: A global approach. Chem Phys Lett 102:501–507 [Google Scholar]
- Kouyama T, Kinosita K Jr, Ikegami A (1989) Correlation between internal motion and emission kinetics of tryptophan residues in proteins, bur J Biochem 182:517–521 [DOI] [PubMed] [Google Scholar]
- Laczko G, Gryczynski I, Gryczynski Z, Wiczk W, Malak H, Lakowicz JR (1990) A 10GHz frequency-domain fluorometcr, Rev Sci Instrum 61:2331–2337 [Google Scholar]
- Lakowicz JR, Maliwal BP (1983) Oxygen quenching and fluorescence depolarization of tyrosine residues in protein, J Biol Chem 258:4794–4801 [PubMed] [Google Scholar]
- Lakowicz JR, Maliwal BP (1985) Construction and performance of a variable-frequency phase-modulation fluorometer. Biophys Chem 21:61–78 [DOI] [PubMed] [Google Scholar]
- Lakowicz JR, Thompson RB (1983) Differential polarized phase fluorometric studies of phospholipid bilayers under high hydrostatic pressure. Biochem Biophys Acta 732:359–371 [DOI] [PubMed] [Google Scholar]
- Lakowicz JR, Weher G (1973a) Quenching of fluorescence by oxygen - a probe for structural fluctuations in macromolecules. Biochemistry 12:4161–4170 [DOI] [PMC free article] [PubMed] [Google Scholar]
- Lakowicz JR, Weber G (1973b) Quenching of protein fluorescence by oxygen–detection of structural fluctuations in proteins on the nanosecond timescale. Biochemistry 12:4171–4179 [DOI] [PMC free article] [PubMed] [Google Scholar]
- Lakowicz JR, Maliwal BP, Cherek H, Balter A (1983) Rotational freedom of tryptophan residues in proteins and peptides quantified by lifetime-resolved fluorescence anisotropies. Biochemistry 22:1741–1752 [DOI] [PMC free article] [PubMed] [Google Scholar]
- Lakowicz JR, Laczko G, Cherek H, Limkeman M, Gratton E (1984) Analysis of fluorescence decay kinetics from variable-frequency phase shift and modulation data Biophys J 46:463–477 [DOI] [PMC free article] [PubMed] [Google Scholar]
- Lakowicz JR, Cherek H, Maliwal BP, Gratton E (1985) Time-resolved fluorescence anisotropies of fluorophores in solvents and lipid bilayers obtained from frequency-domain phasc-modulation fluorometry. Biochemistry 24:376–383 [DOI] [PMC free article] [PubMed] [Google Scholar]
- Lakowicz JR, Laczko G, Gryczynski I, Chcrek H (1986a) Measurement of subnanosecond anisotropy decays of protein fluorescence using frequency-domain fluorometry. J Biol Chem 261:2240–2245 [PubMed] [Google Scholar]
- Lakowicz JR, Laczko G, Gryczynski I, (1986b) Picosecond resolution of oxytocin tyrosyl fluorescence by 2 GHZ frequency-domain fluorometry. Biophys Chem 24:97–100 [DOI] [PubMed] [Google Scholar]
- Lakowicz JR, Laczko G, Gryczynski I (1986c) A 2 GHz frequency-domain fluorometer. Rev Sci Instrum 57:2499–2506 [Google Scholar]
- Lakowicz JR, Johnson ML, Joshi N, Gryczynski I, Laczko G (1986d) transient effects in quenching detected by harmonic content frequency domain fluorometry. Chem Phys Lett 1131:343–348 [Google Scholar]
- Lakowicz JR, Laczko G, Grvezynski I (1987a) Picosecond resolution of tyrosine fluorescence and anisotropy decays by 2 GHz frequency-domain fluoromeiry. Biochemistry 26:82–90 [DOI] [PMC free article] [PubMed] [Google Scholar]
- Lakowicz JR, Cherek H, Gryczynski I, Joshi N, Johnson ML (1987b) Enhanced resolution of fluorescence anisotropy decays by simultaneous analysis of progressively quenched samples: applications to anisotropic rotations and protein dynamics. Biophys J 51:755–768 [DOI] [PMC free article] [PubMed] [Google Scholar]
- Lakowicz JR, Johnson ML, Gryczynski I, Joshi N, Szmacinski H (1987c) Diffusion coefficients of quenchers in proteins from transient effects in the intensity decays. J Biol Chem 262:10907–10910 [PubMed] [Google Scholar]
- Lakowicz JR, Johnson ML, Gryczynski I, Joshi N, Laczko G (1987d)Transient effects in fluorescence quenching measured by 2 GHz frequency-domain fluorometry. J Phys Chem 91:3277–3285 [DOI] [PMC free article] [PubMed] [Google Scholar]
- Lakowicz JR, Szmacinski H, Gryczynski I (1988) Picosecond resolution of indole anisotropy decays and spectral relaxation by 2 GHz. frequency-domain fluorometry. Photochem Photobiol 47:31–41 [DOI] [PubMed] [Google Scholar]
- Lakowicz JR, Johnson ML, Jayaweera R, Szmacinski H, Gryczynski I (1990): unpublished observation
- Levy RM, Szabo A (1982) Initial fluorescence depolarization of tyrosine in proteins. J Am Chem Soc 194:2073–2075 [Google Scholar]
- Libertini LJ, Small EW (1985) The intrinsie tyrosine fluorescence of histone H1, Biophys J 47:765–772 [DOI] [PMC free article] [PubMed] [Google Scholar]
- Ludescher RD, Volwerk JJ, deHaas CH,Hudson BS (1985) Complex photophysics of the single tryptophan of porcine pancreatic phosphoiipase A2, its zymogen and an enzyme/micelle complex. Biochemistry 24:7240–7249 [DOI] [PubMed] [Google Scholar]
- Ludescher RD, Johnson ID, Volwerk JJ, deHaas GH, Jost PC, Hudson BS (1988) Rotational dynamics of the single tryptophan of porcine pancreatic phospholipase A2, its zymogen, and an cnzyme/micelle complex. A steady-state and time-Resolved anisotropy study. Biochemistry 27:6618–6628 [DOI] [PubMed] [Google Scholar]
- MacKerrell R Jr, Nilsson AD, Rigler R, Saenger W (1988) Molecular dynamics simulations of ribonuclease-T1: analysis of the effect of solvent on the structure, fluctuations, and active site of the free enzyme. Biochemistry 27:4547–4556 [DOI] [PubMed] [Google Scholar]
- MacKerell AD Jr, Nilsson L, Rigler R, Heinemann U, Saenger W (1989) Molecular dynamics simulations of ribonuclease T1: comparison of the free enzyme and the 2′ GMP-enztme complex. Proteins: struct Funct Genet 6:20–31 [DOI] [PubMed] [Google Scholar]
- Maliwal BP, LaKowicz JR (1986) Resolution of complex anisotropy decays by variable frequency phase moulation fluorometry: a Simulation study. Biochem Biophys Acta 873:161–172 [DOI] [PubMed] [Google Scholar]
- Munro I, Pecht I, Stryer L (1979) Subnanosecond motions of tryptophan residues in proteins, Proc Natl Acad Sci USA 76:56–60 [DOI] [PMC free article] [PubMed] [Google Scholar]
- Nordlund TM, Podolski DA (1983) Streak camera measurement of tryptophan and rhodamine motions with picosecond time resolution. Photochem Photobiol 38:665–669 [Google Scholar]
- Nordlund TM, Liu YY, Sommer JH (1986) Fluorescence polarization decay of tyrosine in lima bean trypsin inhibitor. proc Natl Acad Sci USA 83:8977–8981 [DOI] [PMC free article] [PubMed] [Google Scholar]
- Olejniczak ET, Dobson CM, Karplus M, Levy RM (1984) Motional averaging of proton nuclear Overhauser effect in proteins. Predictions from a molecular dynamics simulation of lysozyme. J Am Chem Soc 196:1923–1930 [Google Scholar]
- Paladini AA, Weber G (1981a) Absolute measurements of fluorescence polarization at high pressures. Rev Sci Instrum 52:419–427 [Google Scholar]
- Paladini A Jr, Weber G (1981b) Pressure-induced revecrsible dissociation of enolase. Biochemistry 20:2587–2593 [DOI] [PubMed] [Google Scholar]
- Papenhuiyzen J, Visser AJWG (1983) Simulation of convoluted and exact anisotropy decay profiles. Biophys Chem 17:57–65 [DOI] [PubMed] [Google Scholar]
- Ross JBA, Rousslan KW, Brand L (1981) Time-resolved fluorescence and anisotropy decay of the tryptophan in adrenocorticotropin (1–24). Biochemistry 20:4361–4369 [DOI] [PubMed] [Google Scholar]
- Tomlinson G, Ogata G, shin WC, Kim SH (1983) Crystal structure of a sweet protein, monellin, at 5.5 Å resolution. Biochemistry 22:5772–5774 [Google Scholar]
- Visser AJWG (ed) (1985) Special Symposium on time-resolved fluorescence spectroscopy Anal lnstrum 14:193–566 [Google Scholar]
- visser AJWG, Ykema T, Van Hoek A, O’Kane DJ, Lee J (1985) Determination of rotational correlation times from deconvoluted fluorescence anisotropy decay curves. Demonstration with 6,7-dimethyl-8-ribityllumazine and lumazine protein from photobacterium leiograthi as fluorescent indicators. Biochemistry 24:1489–1496 [DOI] [PubMed] [Google Scholar]
- Weber G (1952) Polarization of the fluorescence of macromolecules 2, Fluorescent conjugates of ovalbumin and bovine serum albumin. Biochem J 51:145–155 [DOI] [PMC free article] [PubMed] [Google Scholar]
- Weber G (1977) Theory of fluorescence depolarization by anisotropic Brownian Phys 66:4081–4091 [Google Scholar]
- Weleh GR (ed) (1986) The fluctuating enzyme Wile, New York [Google Scholar]


