

Abstract
Indian fenugreek cultivars were characterized for their antioxidant properties and bioactive compounds were quantified using high performance liquid chromatography (HPLC). The extraction efficiencies were compared for two extraction solvents [aqueous ethanol (50%) and methanol]. The bioactive properties studied were total phenolic content (TPC), total flavonoids content (TFC), condensed tannin content (CTC), 2,2′-Azino-bis (3-ethylbenzothiazoline-6-sulfonate) (ABTS+), 1, 1-diphenyl-2-picrylhydrazyl (DPPH) radical scavenging activity, total antioxidant capacity (TAC), and reducing power activity (RPA). Aqueous ethanol extracts showed higher TPC, TFC, ABTS+, TAC and RPA as compared to methanol. However, methanolic extracts showed higher CTC and DPPH activity. Higher TPC [45.3 and 45.4 mg gallic acid equivalents (GAE)/g dry weight basis (dwb)], DPPH (93.0 and 93.2%), ABTS+ (98.3 and 98.5%), RPA [40.9 and 44.9 mg quercetin equivalents (QE)/g dwb], were observed for cv.RMT-143 and cv.RMT-365, respectively. TFC (20.5 mg catechin equivalents (CE)/g dwb) and CTC (9.3 mg CE/g dwb) were found the highest for cv. Kasoori methi. Quantification of phenolic compounds using HPLC revealed higher amount of gallic acid (in Kasoori methi), ascorbic and p-coumaric acid (HM-57), benzoic and cinnamic acid (RMT-143) and catechol (only in RMT-365). Significant (p < 0.05) protection against in vitro plasmid deoxyribonucleic acid (DNA) (pBR322) oxidative damage was observed for fenugreek extracts.
Keywords: Fenugreek, Total phenolic content, Total flavonoids content, Condensed tannin content, In vitro DNA damage protection
Introduction
Fenugreek (Trigonella foenum-graecum) belongs to legume family, believed to be originated from Western Asia and South Eastern Europe, but now grown mainly in India as well as many parts of the world including Northern Africa and USA (Altuntaş et al. 2005). Fenugreek seeds are extensively used as spice in Indian cuisine for flavoring while its leaves, germinated seeds and tender shoots are used as vegetables. The seeds are aromatic, pleasantly bitter and slightly sweet with antidiabetic (Tavakoly et al. 2018) and hypo-cholesterolaemic (Belguith-Hadriche et al. 2013), antimicrobial, carminative, galactogogue, anti-carcinogenic and anti-inflammatory properties (Pandey and Awasthi 2015; Wani and Kumar 2018). Fenugreek seeds have been described as good source of protein (27.5%), soluble (30.6%) and insoluble (20.6%) dietary fiber, crude fat (6.71%) and minerals such as calcium, iron and β-carotene (Naidu et al. 2011).
Free radicals and some other potential toxic compounds are generated due to oxidative stress and autoxidation of human lipids and lipoproteins, causing various health problems (Yen et al. 2018). To solve these health issues, day by day interest is increasing in use of natural antioxidants from plants such as flavonoids, phenolic, and alkaloid compounds (da Silva et al. 2018; Ghasemi et al. 2018). These polyphenolic compounds have ability to quench free radicals, chelate catalytic metals, and scavenge oxygen (Kumari et al. 2019; Kaur et al. 2018) and proven promising in preventing oxidative stress, various diseases, maintaining health and delaying aging processes (Belguith-Hadriche et al. 2013; Tavakoly et al. 2018). Studies using in vitro spectrophotometric analysis revealed high oxygen radical scavenging activity of fenugreek extract with ethyl acetate (Kenny et al. 2013) and alcohol (Naidu et al. 2011).
Quantification analysis by high performance liquid chromatography (HPLC) already identified several compounds such as coumarin, quercetin, p-coumaric acid, rutin, chlorogenic acid, gallic acid, trans-ferulic acid, caffeic, catechin, apigenin, quercitin glycosides and kaempferol (Dixit et al. 2005; Benayad et al. 2014) along with flavonoids such as vitexin, quercetin, naringenin, 7-O-β-D-glucopyranoside and tricin in fenugreek seeds. However, studies report that phenolic compounds and antioxidant activity of crops significantly differ with genetic diversity, seed color, climatic and soil conditions and crop time (Cho et al. 2013).
Although maximum extraction yield of phenolic compounds is necessary to fulfill the needs of the functional food and pharmaceutical industries, but selection of an extraction solvent considering health and environmental risks is also important. In this context, solvents such as water and ethanol, regarded as green extraction solvents (Chemat et al. 2012), are considered more desirable over acetone, methanol and acetonitrile. However, high level of impurities such as sugars, organic acids and soluble proteins are extracted when water as solvent is used, which restricts its usage for characterization of phenolics (Chirinos et al. 2007). Fathordoobady et al. (2016) reported improved recovery of phenolic compounds with increasing the ratio of water to ethanol up to 50%. This could be attributed to the hydrophilic properties of phenolics and flavonoids, thus contributing to the total phenolic content (Tenore et al. 2012). Ethanol, because of the lower toxicity, was preferred mostly for the extraction of different bioactive constituents (Kumari et al. 2019).
To date, more than 1287 accessions of fenugreek have been deposited at National Gene Bank in India. Despite abundant germplasm resource, their diversity of antioxidant potential is widely unknown. Fenugreek is an underutilized crop and to improve its utilization in food products, more information about its bioactive constituents and antioxidant properties of its commercially available cultivars is required. Therefore, the study was planned with the objective to characterize the fenugreek cultivars of commercial importance for their antioxidant properties. HPLC analysis was performed to quantify various bioactive compounds present in these cultivars. Further, two solvents [aqueous ethanol (50%) and methanol] were used for extract preparation and the extraction efficiencies from these were studied and compared.
Materials and methods
Materials
Depending on the favorable soil and climatic conditions for fenugreek production, three major states of India i.e. Rajasthan, Haryana, and Punjab were selected for sample collections. Six commonly grown fenugreek cultivars (cv.) namely AFG-1 (National Research Centre on Seed Spices, Ajmer, Rajasthan), RMT-143, RMT-365 (Sri Karan Narendra Agricultural University, Jobner, Rajasthan), HM-57, HM-103 (Chaudhary Charan Singh Haryana Agricultural University, Hisar, Haryana) and Kasoori methi (Punjab Agricultural University, Ludhiana, Punjab) were collected. The seeds samples were cleaned and stored under refrigeration till further evaluation.
Chemicals
Solvents and chemicals of HPLC grade [i.e. ethanol, methanol, hydrochloric acid, formic acid, ammonium hydroxide (NH4OH)] were procured from Merck Co. (Darmstadt, Germany). Gallic acid, ascorbic acid, Folin and Ciocalteu’s phenol reagent, 1, 1-diphenyl-2-picrylhydrazyl (DPPH), 2,2′-Azino-bis [3-ethylbenzothiazoline-6-sulfonate (ABTS+)], catechin were purchased from Sigma Aldrich Co. (St. Louis, USA). Other chemicals used were of analytical grade.
Preparation of extracts
Fenugreek seeds from different cultivars were milled to fine flour using an electric grinder (Sujata, India). The flour was passed through 80 mesh sieve to obtain the particle size of 0.0070′′. The flour samples were defatted at ambient temperature by mixing and shaking with petroleum ether (1:5 w/v, 5 min, thrice) by following the method of Bhanja et al. (2009). The defatted samples were extracted (thrice) separately using aqueous ethanol (50%) and methanol (1:20 w/v) and stored at −4 °C till further use.
Total phenolic content (TPC)
Determination of TPC of sample extracts dissolved in aqueous ethanol (50%) and methanol was performed by Folin–Ciocalteu (FC) method (Yu et al. 2005). Gallic acid was used as standard to prepare a calibration curve and the results were reported as mg gallic acid equivalents (GAE)/g on dry weight basis (dwb) of flour. The determinations for all samples were performed in triplicates.
Total flavonoids content (TFC)
A spectrophotometric method described by Zhishen et al. (1999) was followed for estimation of TFC in extracts. Absorbance was recorded at 510 nm against a blank. The amount of TFC present in extract was expressed as mg catechin equivalents (CE)/g dwb. All samples were analyzed in triplicate.
Condensed tannin content (CTC)
CTC was calculated following the method of Julkunen-Tiitto (1985) with slight modifications. The absorbance of tested samples was recorded against blank at 500 nm. All samples analysis was performed in three replications. The results calculated from standard catechin curve (0.05-1 mg/ml) were reported as mg CE/g dwb.
Identification and quantification of phenolic compounds
Qualitative analysis to detect the presence of different bioactive constituents in fenugreek samples was done using HPLC (Shimadzu 10 AVP) following the method of Dhull et al. (2016).The injection volume of tested sample during experiment was 10 μl while detection of the analytes was recorded at 280 nm. Ascorbic acid, p-coumaric acid, gallic acid, benzoic acid, cinnamic acid and catechol were used as standard phenolic acids.
For the quantification profile, four different mobile phases (Dhull et al. 2016) were used. The wavelength of UV Detector was maintained to 275 nm while the column temperature was fixed to 30 °C. From the standard graphs, the R2 values generated were used for quantification of the bioactive constituent.
Determination of antioxidant potential
DPPH radical scavenging assay
The sample extracts were subjected for DPPH radical scavenging capacity assessment using the method reported by Yen and Chen (1995). The percent inhibition of radical (I%) was calculated from absorbance of control (AC) and extracts (AE) as follows:
ABTS+ depolarization assay
Phenolic extracts of test samples were assessed for their radicals scavenging activity against radical cation (ABTS+) using the method reported by Re et al. (1999). The percent de-colorization activity (DA%) was derived from absorbance of control (AC) and extracts (AE) as follows:
Total antioxidant capacity (TAC)
TAC of fenugreek extracts were measured according to Prieto et al. (1999). The antioxidant capacity was measured from the standard ascorbic acid calibration curve and the absorbance was read at 695 nm. The results are reported as mg ascorbic acid equivalents (AAE)/g dwb of flour.
Reducing power assay (RPA)
The RPA of the phenolic extracts was evaluated according the assay reported by Oyaizu (1986). Quercetin was used as a standard and the results are reported as mg quercetin equivalents (QE)/g dwb of flour. The absorbance was read at 700 nm.
DNA damage protection activity (DDPA)
The plasmid DNA (pBR-322) protection activity of fenugreek extracts from oxidative damage of Fenton’s reagent was determined following the assay reported by Kumar et al. (2013). Hydrogen peroxide (30 mM), ascorbic acid (500 μM) and ferric chloride (800 μM) were mixed in equal ration (1:1:1) to prepare Fenton’s reagent. Extract (5 μl) was added to DNA (2.5 μl), followed by addition of Fenton’s reagent (10 μl) in an Eppendorf tube and these were mixed well. Then nuclease free double distilled water (2.5 μl) was added and incubated (37 °C, 30 min).
After incubation period, loading buffer (2.5 μL) containing mixture of bromophenol blue (0.25%) and glycerol (50%) was mixed with the reaction solution. On 1% agarose gel stained with ethidium bromide (10 mg/ml aqueous solution; 4 μl), the results were recorded using quercetin (mg/mL dissolved in ethanol) as a positive control. Using a gel documentation system (Gel Doc™ XR + Imaging system, BIO-RAD, Japan) specific bands were visualized under trans-illumination of UV light.
Statistical analysis
An average of triplicate observation was reported as results in all the tables. Further, the results were subjected to one way analysis of variance (ANOVA) using Minitab statistical software version 14 (Minitab Inc, USA).
Results and discussion
Total phenolic content
Phenolic compounds are considered as major compounds contributing to total antioxidant activities of grains. TPC of six commercial Indian fenugreek cultivars is presented in Table 1. The phenolic content differed significantly (p < 0.05) among cultivars (except for cv.RMT-143 and cv.RMT-365 for aqueous ethanol extracts) with values ranging from 38.9 ± 0.11 to 45.4 ± 0.19 mg GAE/g dwb for aqueous ethanol and 13.4 ± 0.19–21.8 ± 0.12 mg GAE/g dwb for methanol extracts. For ethanol extracts, cv.RMT-143 and cv.RMT-365 showed higher TPC in comparison to others while for methanol extracts; the highest value was recorded in cv.RMT-365. The lowest value of TPC, however, was observed in cv.AFG-1, for both the extracts. The variation in phenolic content could possibly be attributed to genetic variations, maturity stage and environmental factors (Salar et al. 2017). The results are comparable with the previous studies reported by Pandey and Awasthi (2015) (45.4 mg GAE/g dwb for ethanol extract) and Kenny et al. (2013) (22.8 mg GAE/g dwb for hydrophilic methanol extract). The results also revealed that phenolic content extracted in aqueous ethanol was significantly (p < 0.05) higher than that of methanol extract for all the cultivars which agree with the previous findings of Bukhari et al. (2008). Phenolic acids and flavonoids owing hydrophilic properties mainly contribute to TPC analysis (Tenore et al. 2012), explaining the higher TPC in more aqueous ethanolic solvent. Fenugreek has a high level of phenolic content, which agrees with the results reported by Marathe et al. (2011). They categorized fenugreek in a group with phenolic activity (> 2.0 mg GAE/g) among thirty different legumes varieties commonly consumed in India.
Table 1.
TPC, TFC and CTC in different fenugreek cultivars
| Cultivars | Total phenolic content (mg GAE/g dwb) | Total flavonoids content (mg CE/g dwb) | Condensed tannin content (mg CE/g dwb) | |||
|---|---|---|---|---|---|---|
| Aq. ethanol (50%) | Methanol | Aq. ethanol (50%) | Methanol | Aq. ethanol (50%) | Methanol | |
| HM-57 | 44.0 ± 0.31dq | 18.1 ± 0.14dp | 18.5 ± 0.05cq | 16.7 ± 0.13bp | 3.9 ± 0.06dp | 5.9 ± 0.15aq |
| HM-103 | 43.2 ± 0.24cq | 17.1 ± 0.18cp | 17.4 ± 0.12bq | 15.9 ± 0.15abp | 3.2 ± 0.09ap | 8.1 ± 0.10cq |
| RMT-143 | 45.3 ± 0.21eq | 19.0 ± 0.09ep | 18.8 ± 0.08cq | 17.5 ± 0.07cp | 4.3 ± 0.04ep | 7.8 ± 0.11bq |
| RMT-365 | 45.4 ± 0.19eq | 21.8 ± 0.12fp | 19.1 ± 0.03cdq | 18.0 ± 0.05dp | 4.3 ± 0.05ep | 7.5 ± 0.20bq |
| AFG-1 | 38.9 ± 0.11aq | 13.4 ± 0.19ap | 16.7 ± 0.11aq | 15.2 ± 0.10ap | 3.6 ± 0.02cp | 9.0 ± 0.16dq |
| Kasoori methi | 40.2 ± 0.26bq | 14.3 ± 0.20bp | 20.5 ± 0.14eq | 19.0 ± 0.06ep | 3.4 ± 0.07bp | 9.3 ± 0.19dq |
Means followed by different superscripts in a column differ significantly (p < 0.05). Superscripts p and q in a row show variation among aqueous ethanol (50%) and methanol extracts
TPC total phenolic content; TFC total flavonoids content; CTC condensed tannin content; GAE gallic acid equivalents; CE catechin equivalents
Total flavonoids content and condensed tannin content
Flavonoids including flavones, flavanols and condensed tannins, are widespread plants secondary metabolites. The interest is generated in these compounds because of their various health promoting effects attributed to their antioxidant potential and interactive effects with other antioxidants. TFC and CTC values of flour from different cultivars are presented in Table 1. The values of TFC in extracts prepared in aqueous ethanol ranged from 16.7 ± 0.11 to 20.5 ± 0.14 mg CE/g dwb while for methanol extract it ranged from 15.2 0.10 to 19.0 ± 0.06 mg CE/g dwb; the highest for cv. Kasoori methi and the lowest for cv. AFG-1, for both the extracts were observed. For aqueous ethanol extract, TFC of flour from cv. HM-57 and cv. RMT-143 do not differ significantly (p < 0.05). However, for methanol extract, TPC values of fenugreek cultivars showed significant (p < 0.05) differences. Belguith-Hadriche et al. (2013) reported TFC of the methanol extract of fenugreek in terms of catechin equivalents (20.08 mg CE/g) while Salem et al. (2014) recorded in terms of quercetin equivalents (657.78 mg QE/100 g). Significant (p < 0.05) difference between flavonoids content of aqueous ethanol extract and the methanol extracts was observed; the higher being observed for aqueous ethanol extract. The higher TFC for aqueous ethanol (mixture of water and organic solvent) extract may be due to extraction of all compounds which were soluble in both water and organic solvents. In comparison with other organic solvents, ethanol has also been reported to be more effective for extracting flavonoids from fenugreek seeds (Bukhari et al. 2008).
CTC of fenugreek extracts has been shown in Table 1. The extracts from cultivars differed significantly (p < 0.05) in their CTC. The cultivars had values ranging from 3.2 ± 0.09 to 4.3 ± 0.05 mg CE/g dwb for aqueous ethanol extracts and 5.9 ± 0.15–9.3 ± 0.19 mg CE/g dwb for extracts prepared in methanol. In contrast to TFC, the CTC of methanol extracts was significantly (p < 0.05) higher than their counterpart aqueous ethanol extracts. The low CTC in aqueous ethanol extract may be due to the higher amount of water present in solvent. Makkar and Becker (1993) also suggested that presence of water had adverse effect on this assay. Further, for aqueous ethanol extract, cv.RMT-143 and cv.RMT-365 did not differ significantly (p < 0.05), both had the highest CTC value (4.3 mg CE/g dwb) as compared to others. However, for methanol extract, cv.Kasoori methi (9.3 mg CE/g dwb) and cv.AFG-1 (9.0 mg CE/g dwb) showed higher CTC values. The tannin content in plant can be governed by several factors such as cultivar, plant type, development stage, plant or plant parts age and environmental conditions (Chavan et al. 2001).
HPLC analysis of phenolic compounds
For detection and quantitative estimation of various phenolic compounds, the aqueous ethanolic extracts of defatted flour from different cultivars were assessed using HPLC. Six standard compounds were selected for the identification of phenolics in the extracts. The HPLC chromatograms (Fig. 1a–f) showing the phenolic compounds distribution in different cultivars, clearly indicate the inter-cultivar variation in phenolic compounds. A chromatogram of standards is shown in Fig. 2. The retention time of the selected standards was used in the identification of peaks for the phenolic compounds in the samples. The number of peaks and corresponding peak area in chromatograms gave the number of phenolic compounds and their quantities present in the sample, respectively. It was found that ascorbic acid, gallic acid, benzoic acid, cinnamic acid and p-coumaric acid were the major phenolic compounds among the extracts from different cultivars (Table 2).
Fig. 1.

HPLC chromatograms of extracts of different fenugreek cultivars, a cv.HM-57; b cv.HM-103; c cv.RMT-143; d cv.RMT-365; e cv.AFG-1; f cv.Kasoori methi
Fig. 2.

HPLC chromatograms of standards, a Ascorbic acid, b Benzoic acid, c Catechol, d Cinnamic acid, e p-Coumaric acid, f Gallic acid
Table 2.
Quantification profile of bioactive compounds from aqueous ethanolic extract in different fenugreek cultivars
| Phenolic compounds | Cultivars | |||||
|---|---|---|---|---|---|---|
| HM-57 | HM-103 | RMT-143 | RMT-365 | AFG-1 | Kasoori methi | |
| Ascorbic acid (mg/g dwb) | 11.02 ± 0.18e | 9.85 ± 0.10d | 8.81 ± 0.16c | 8.05 ± 0.09b | 5.59 ± 0.17a | 5.84 ± 0.09a |
| Gallic acid (mg/g dwb) | 0.54 ± 0.03a | 4.73 ± 0.07b | 6.06 ± 0.05c | 4.54 ± 0.11b | 4.82 ± 0.20b | 7.24 ± 0.20d |
| Benzoic acid (mg/g dwb) | 2.59 ± 0.14b | ND | 5.56 ± 0.14d | 2.67 ± 0.08b | 2.79 ± 0.11c | 2.33 ± 0.05a |
| Cinnamic acid (mg/g dwb) | 0.63 ± 0.09b | 0.68 ± 0.02b | 0.81 ± 0.05bc | 0.24 ± 0.03a | 0.98 ± 0.14c | 0.27 ± 0.02a |
| p-coumaric acid (mg/g dwb) | 9.20 ± 0.06f | 7.44 ± 0.04e | 6.73 ± 0.21d | 4.71 ± 0.15c | 3.11 ± 0.07b | 2.22 ± 0.13a |
| Catechol (mg/g dwb) | ND | ND | ND | 3.97 ± 0.06 | ND | ND |
Means followed by different superscripts in a row differ significantly (p < 0.05)
ND not detected
The amount of ascorbic acid in different cultivars varied from 5.59 ± 0.17 mg/g dwb (cv.AFG-1) to 11.02 ± 0.18 mg/g dwb (cv.HM-57). Gallic acid ranged from 4.54 ± 0.11 to 7.24 ± 0.20 mg/g dwb, the highest and the lowest values were observed in cv.Kasoori methi and cv.RMT-365, respectively. The highest benzoic acid content was observed in cv.RMT-143 (5.56 ± 0.14 mg/g dwb) whereas cv.Kasoori methi (2.33 ± 0.05 mg/g dwb) had the lowest value. Significant (p < 0.05) variations were observed for cinnamic acid and p-coumaric acid among cultivars and the values ranged between 0.24 ± 0.03 and 0.98 ± 0.14 mg/g dwb and 2.22 ± 0.13–9.20 ± 0.06 mg/g dwb, respectively. For both these phenolic compounds, cv.Kasoori methi had the lowest values. Catechol was found only in cv.RMT-365 (3.97 mg/g dwb). Belguith-Hadriche et al. (2013) also observed p-coumaric acid and gallic acid present in ethyl acetate extract of fenugreek by Liquid chromatography–mass spectrometry (LC/MS) analysis. Dixit et al. (2005) reported the presence of caffeic acid, gallic acid, p-coumaric acid, o-coumaric acid, and rutin by HPLC analysis in aqueous and boiled aqueous extracts of germinated fenugreek seeds. Salem et al. (2014) also observed presence of gallic (40 mg/100 g dry mass), catechin (184 mg/100 g dry mass) and coumarin (43 mg/100 g dry mass) during the fractionation of phenolic compound in raw fenugreek extracts.
Further, some unknown peaks were also detected during HPLC analysis in different cultivars confirming presence of more closely related phenolic compounds. The unidentified peaks might be contributing significantly in the antioxidant potential of aqueous ethanolic extract. A mixture of some other unknown bioactive compounds attributing antioxidant potential may be present in the extract. Also, comparison of HPLC results of present study and earlier published data is difficult as different extraction methods have been used.
Antioxidant potential of the extracts
The phytochemicals reactions are very complex in nature and to establish authenticity of results, therefore, assessment by multiple methods is preferred. The assays with different mechanism of reactions such as DPPH, ABTS+, reducing power and TAC were used to evaluate the antioxidant potential of different extracts.
DPPH radical scavenging activity
Free radical scavenging activities of different phenolic compounds determines their different biological as well as pharmacological properties. In the present study, the scavenging activities of phenolic extracts from defatted flours were expressed in terms of percent (%) inhibition against DPPH radical (Table 3). The extracts possessed DPPH radical scavenging activities ranging from 81.8 ± 0.25 to 87.6 ± 0.27% for aqueous ethanol which was significantly (p < 0.05) lower than methanol extracts (82.2 ± 0.20–93.2 ± 0.17%). Bukhari et al. (2008) reported lower DPPH scavenging activity of methanol as compared to ethanol. The activity of aqueous ethanol varied significantly (p < 0.05) among cultivars, except for cv.HM-57 and cv.RMT-143. Likewise, no significant difference in the antioxidant activity (AOA) of methanol extract for cv.HM-57, cv.HM-103 and cv.RMT-143 was observed. The highest value of AOA was observed for cv.RMT-365 while cv.AFG-1 showed the lowest activity for both aqueous ethanol and methanol extracts. Differences observed in AOA of extracts could be attributed to the different quality and quantity of phenolic compounds extracted in the different extracts. Salem et al. (2014) observed 90.6% antioxidant activity in raw fenugreek seeds. Marathe et al. (2011) grouped fenugreek with crops having high radical scavenging activity (> 400 DPPH units/g legume).
Table 3.
Antioxidant activity (DPPH, ABTS+, RPA and TAC) of different fenugreek cultivars
| Cultivars | Percent (%) inhibition against DPPH radical | Percent (%) inhibition against ABTS+ | Reducing power activity (mg QE/g dwb) | Total antioxidant capacity (mg AAE/g dwb) | ||||
|---|---|---|---|---|---|---|---|---|
| Aq. ethanol (50%) | Methanol | Aq. ethanol (50%) | Methanol | Aq. ethanol (50%) | Methanol | Aq. ethanol (50%) | Methanol | |
| HM-57 | 86.0 ± 0.26dp | 92.8 ± 0.19cq | 98.2 ± 0.05bq | 72.9 ± 0.10bp | 39.0 ± 0.13cq | 23.6 ± 0.16 bp | 19.5 ± 0.20cdq | 14.7 ± 0.10cp |
| HM-103 | 84.9 ± 0.30cp | 92.4 ± 0.21cq | 98.0 ± 0.15bq | 97.3 ± 0.19ep | 38.8 ± 0.06cq | 37.6 ± 0.10ep | 18.6 ± 0.19bcq | 16.4 ± 0.09dep |
| RMT-143 | 86.2 ± 0.33dp | 93.0 ± 0.25dq | 98.3 ± 0.08bq | 91.3 ± 0.15cp | 40.9 ± 0.05dq | 30.2 ± 0.11cp | 19.6 ± 0.15dq | 16.1 ± 0.05dp |
| RMT-365 | 87.6 ± 0.27ep | 93.2 ± 0.17dq | 98.5 ± 0.10bq | 97.7 ± 0.08ep | 44.9 ± 0.11eq | 43.5 ± 0.08fp | 19.3 ± 0.17cq | 16.7 ± 0.11ep |
| AFG-1 | 81.8 ± 0.25ap | 82.2 ± 0.20aq | 98.1 ± 0.11bq | 69.2 ± 0.14ap | 37.8 ± 0.18bq | 15.9 ± 0.05ap | 18.3 ± 0.14bq | 13.7 ± 0.05bp |
| Kasoori methi | 83.3 ± 0.21 bp | 84.4 ± 0.15bq | 97.7 ± 0.07aq | 96.4 ± 0.06dp | 36.0 ± 0.14aq | 35.9 ± 0.12dp | 18.2 ± 0.12aq | 12.8 ± 0.03ap |
Means followed by different superscripts in a column differ significantly (p < 0.05). Superscripts p and q in a row show variation among aqueous ethanol (50%) and methanol extracts
QE quercetin equivalents; AAE ascorbic acid equivalents
ABTS+ assay
The percent inhibition against ABTS+ do not varied significantly (p < 0.05) for aqueous ethanol extracts except for cv.Kasoori methi. However, methanol extracts among cultivars differed significantly (p < 0.05) and the values ranged from 69.2 ± 0.14 to 97.7 ± 0.08%. The highest percent inhibition against ABTS+ was observed for cv.RMT-365 (98.5 ± 0.10% and 97.7 ± 0.07% in aqueous ethanol and methanol extract, respectively) while cv.Kasoori methi (97.7%) and cv.AFG-1 (69.2%) showed the lowest activity for aqueous ethanol and methanol extracts, respectively. Marathe et al. (2011) also reported high ABTS+ inhibition activity of 20.21 µmol trolox equivalent antioxidant capacity (TEAC)/g in fenugreek. Since aqueous ethanol was the solvent showing the higher antioxidant potential (ABTS+) as well as TPC yield, simultaneously, it is concluded that higher molecular weight phenolic compounds having low polarity contribute efficiently to the total antioxidant activity of fenugreek extracts (Mokrani and Madani 2016).
Reducing power assay
The presence of biologically active compounds having antioxidant potential can be detected using RPA as the antioxidant activity is related with the reducing power of bioactive compounds. Thus, RPA explains the relationship between antioxidant effects of phenolic compounds and their reducing power. In the presence of suitable reductant, Fe3+ is reduced into Fe2+ form. RPA of aqueous ethanol extracts and methanol extract are shown in Table 3. RPA values for aqueous ethanol extracts were observed to be significantly (p < 0.05) higher than that of methanol extracts. The values for ethanolic and methanolic extracts ranged from 36.0 ± 0.14 to 44.9 ± 0.11 mg QE/g dwb and 15.9 ± 0.05 to 43.5 ± 0.08 mg QE/g dwb, respectively. cv.RMT-365 showed the highest values for both the extracts. Bukhari et al. (2008) also reported higher RPA for ethanol extract of fenugreek.
Total antioxidant capacity
A typical characteristic of TAC assay is that Mo (VI) is reduced to Mo (V) under acidic conditions forming Mo (V) complex which has dark bluish-green color. Both water and fat soluble phenolic compounds could be analyzed using this assay. The results of TAC for different cultivars are shown in Table 3. For aqueous ethanol extract, TAC values differed significantly (p < 0.05) among cultivars and the values ranged from 18.2 ± 0.12 to 19.6 ± 0.15 mg AAE/g dwb, the highest was of cv.RMT-143. For methanol extract, TAC values in the range from 12.8 ± 0.03 to 16.7 ± 0.11 mg AAE/g dwb was observed, with cv.RMT-365 (16.7 mg AAE/g) showing the highest value. The lowest value for TAC was observed for cv.Kasoori methi for both aqueous ethanol and methanol extracts.
DNA damage protection activity
The extracts of fenugreek cultivars in aqueous ethanol were analyzed for DDPA against a model DNA pBR322. Being capable of degrading DNA, Fenton’s reagent (FR) is used largely to evaluate the DDPA in different extracts of natural sources (Salar et al. 2017; Kumar et al. 2013). The bands are not observed during agarose gel electrophoresis which confirms the DNA degradation. As presented in Fig. 3, DDPA was shown by all fenugreek extracts against FR used during electrophoresis. Fenton’s reagent produces hydroxyl radical that damage the DNA in natural system. The protecting effect of fenugreek extracts towards FR is demonstrated by the presence of bands (Lane 4–9). The sharp bands indicate the maximum DDPA whereas the minimum protection activity was shown by dull bands. In lane 3, the absence of bands clearly indicates the FR effect on sample DNA in the absence of any antioxidant or extract. Among cultivars, slightly higher DDPA was observed in cv.HM-57 (lane 6). The percent DDPA is shown in Fig. 4. Earlier published studies also indicated the presence of DDPA in natural extracts from plants (Salar et al. 2017; Kumar et al. 2013). But no published data is available till date on DDPA in fenugreek extracts. This is first report clearly indicating the presence of DDPA in fenugreek cultivars.
Fig. 3.

DNA damage protecting activity in fenugreek extracts against hydroxyl radicals induced DNA damage of pBR322. Lane 1 native pBR 322 plasmid DNA; Lane 2 DNA + Fenton’s reagent + Quercetin (mg/ml positive control); Lane 3 DNA + Fenton’s reagent; Lane 4 DNA + Fenton’s reagent + RMT-365 extract; Lane 5 DNA + Fenton’s reagent + RMT-143 extract; Lane 6 DNA + Fenton’s reagent + HM-57 extract; Lane 7 DNA + Fenton’s reagent + HM-103 extract; Lane 8 DNA + Fenton’s reagent + KM extract; Lane 9 DNA + Fenton’s reagent + AFG1 extract
Fig. 4.
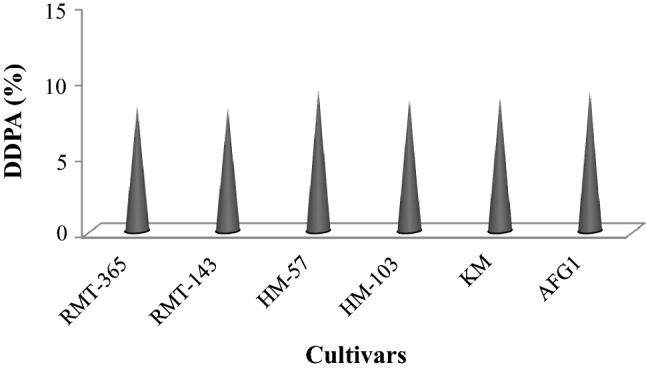
DNA damage protection activities in different fenugreek cultivars
Conclusion
Comparison of aqueous ethanol and methanol in terms of extraction efficiency of antioxidants in fenugreek cultivars showed better results for aqueous ethanol. It showed higher TPC, TFC, ABTS+, TAC and RPA as compared to those from methanol. On the basis of our results cv.RMT-365 and cv.RMT-143 with higher TPC and antioxidant properties (DPPH, ABTS+, RPA and TAC) are recommended for cultivation and preparation of functional food products. HPLC analysis also revealed good amount of specific bioactive constituents such as ascorbic acid, gallic acid, p-coumaric acid, benzoic acid and cinnamic acid in studied fenugreek cultivars. All extract of fenugreek cultivars protected sample plasmid DNA from oxidative damaging effect of Fenton’s reagent. Therefore, from the results of present study, a scientific basis may be provided to the conventional use of fenugreek as a natural antioxidant extenuating DNA damage.
Compliance with ethical standards
Conflict of interest
The authors declare no conflict of interest.
Human and animal rights
This article does not contain any studies with human and animal subjects.
Footnotes
Publisher's Note
Springer Nature remains neutral with regard to jurisdictional claims in published maps and institutional affiliations.
References
- Altuntaş E, Özgöz E, Taşer ÖF. Some physical properties of fenugreek (Trigonella foenum-graceum L.) seeds. J Food Eng. 2005;71:37–43. doi: 10.1016/j.jfoodeng.2004.10.015. [DOI] [Google Scholar]
- Belguith-Hadriche O, Bouaziz M, Jamoussi K, Simmonds MS, El Feki A, Makni-Ayedi F. Comparative study on hypocholesterolemic and antioxidant activities of various extracts of fenugreek seeds. Food Chem. 2013;138:1448–1453. doi: 10.1016/j.foodchem.2012.11.003. [DOI] [PubMed] [Google Scholar]
- Benayad Z, Gomez-Cordovez C, Es-Safi NE. Characterization of flavonoid glycosides from fenugreek (Trigonella foenum-graecum L.) crude seeds by HPLC-DAD ESI/MS analysis. J Food Compost Anal. 2014;35:21–29. doi: 10.1016/j.jfca.2014.04.002. [DOI] [PMC free article] [PubMed] [Google Scholar]
- Bhanja T, Kumari A, Banerjee R. Enrichment of phenolics and free radical scavenging property of wheat koji prepared with two filamentous fungi. Bioresour Technol. 2009;100:2861–2866. doi: 10.1016/j.biortech.2008.12.055. [DOI] [PubMed] [Google Scholar]
- Bukhari SB, Bhanger MI, Memon S. Antioxidative activity of extracts from fenugreek seeds (Trigonella foenum-graecum) Pak J Anal Environ Chem. 2008;9:78–83. [Google Scholar]
- Chavan U, Shahidi F, Naczk M. Extraction of condensed tannins from beach pea (Lathyrus maritimus L.) as affected by different solvents. Food Chem. 2001;75:509–512. doi: 10.1016/S0308-8146(01)00234-5. [DOI] [Google Scholar]
- Chemat F, Vian MA, Cravotto G. Green extraction of natural products: concept and principles. Int J Mol Sci. 2012;13:8615–8627. doi: 10.3390/ijms13078615. [DOI] [PMC free article] [PubMed] [Google Scholar]
- Chirinos R, Rogez H, Campos D, Pedreschi R, Larondelle Y. Optimization of extraction conditions of antioxidant phenolic compounds from mashua (Tropaeolum tuberosum Ruíz & Pavón) tubers. Sep Purif Technol. 2007;55:217–225. doi: 10.1016/j.seppur.2006.12.005. [DOI] [Google Scholar]
- Cho KM, Ha TJ, Lee YB, Seo WD, Kim JY, Ryu HW, Jeong SH, Kang YM, Lee JH. Soluble phenolics and antioxidant properties of soybean (Glycine max L.) cultivars with varying seed coat colours. J Funct Foods. 2013;5:1065–1076. doi: 10.1016/j.jff.2013.03.002. [DOI] [Google Scholar]
- da Silva DF, Itoda C, Rosa CILF, Vital ACP, Yamamoto LN, Yamamoto LY, Botelho RV, Matumoto-Pintro PT. Effects of blackberries (Rupus sp.; cv. Xavante) processing on its physicochemical properties, phenolic contents and antioxidant activity. J Food Sci Technol. 2018;55(11):4642–4649. doi: 10.1007/s13197-018-3405-6. [DOI] [PMC free article] [PubMed] [Google Scholar]
- Dhull SB, Kaur P, Purewal SS. Phytochemical analysis, phenolic compounds, condensed tannin content and antioxidant potential in Marwa (Origanum majorana) seed extracts. Resour Technol. 2016;2:168–174. doi: 10.1016/j.reffit.2016.09.003. [DOI] [Google Scholar]
- Dixit P, Ghaskadbi S, Mohan H, Devasagayam TPA. Antioxidant properties of germinated fenugreek seeds. Phyther Res. 2005;19:977–983. doi: 10.1002/ptr.1769. [DOI] [PubMed] [Google Scholar]
- Fathordoobady F, Mirhosseini H, Selamat J, Manap MYA. Effect of solvent type and ratio on betacyanins and antioxidant activity of extracts from Hylocereus polyrhizus flesh and peel by supercritical fluid extraction and solvent extraction. Food Chem. 2016;202:70–80. doi: 10.1016/j.foodchem.2016.01.121. [DOI] [PubMed] [Google Scholar]
- Ghasemi S, Koohi DE, Emmamzadehhashemi MSB, Khamas SS, Moazen M, Hashemi AK, Amin G, Golfakhrabadi F, Yousefi Z, Yousefbeyk F. Investigation of phenolic compounds and antioxidant activity of leaves extracts from seventeen cultivars of Iranian olive (Olea europaea L.) J Food Sci Technol. 2018;55(11):4600–4607. doi: 10.1007/s13197-018-3398-1. [DOI] [PMC free article] [PubMed] [Google Scholar]
- Julkunen-Tiitto R. Phenolic constituents in the leaves of Nothern willows: methods for the analysis of certain phenolics. J Agric Food Chem. 1985;33:213–217. doi: 10.1021/jf00062a013. [DOI] [Google Scholar]
- Kaur P, Dhull SB, Sandhu KS, Salar RK, Purewal SS. Tulsi (Ocimum tenuiflorum) seeds: in vitro DNA damage protection, bioactive compounds and antioxidant potential. J Food Meas Charact. 2018;12:1530–1538. doi: 10.1007/s11694-018-9768-6. [DOI] [Google Scholar]
- Kenny O, Smyth TJ, Hewage CM, Brunton NP. Antioxidant properties and quantitative UPLC-MS analysis of phenolic compounds from extracts of fenugreek (Trigonella foenum-graecum) seeds and bitter melon (Momordica charantia) fruit. Food Chem. 2013;141:4295–4302. doi: 10.1016/j.foodchem.2013.07.016. [DOI] [PubMed] [Google Scholar]
- Kumar V, Lemos M, Sharma M, Shriram V. Antioxidant and DNA damage protection activities of Eulophia nuda Lindl. Free Radicals Antiox. 2013;3:55–60. doi: 10.1016/j.fra.2013.07.001. [DOI] [Google Scholar]
- Kumari P, Khatkar BS, Duhan A. Aonla phytochemicals: extraction, identification and quantification. J Food Sci Technol. 2019;56(4):2278–2286. doi: 10.1007/s13197-019-03716-7. [DOI] [PMC free article] [PubMed] [Google Scholar]
- Makkar HPS, Becker K. Vanillin–HCl method for condensed tannins: effect of organic solvents used for extraction of tannins. J Chem Ecol. 1993;19:613–621. doi: 10.1007/BF00984996. [DOI] [PubMed] [Google Scholar]
- Marathe SA, Rajalakshmi V, Jamdar SN, Sharma A. Comparative study on antioxidant activity of different varieties of commonly consumed legumes in India. Food Chem Toxicol. 2011;49:2005–2012. doi: 10.1016/j.fct.2011.04.039. [DOI] [PubMed] [Google Scholar]
- Mokrani A, Madani K. Effect of solvent, time and temperature on the extraction of phenolic compounds and antioxidant capacity of peach (Prunus persica L.) fruit. Sep Purif Technol. 2016;162:68–76. doi: 10.1016/j.seppur.2016.01.043. [DOI] [Google Scholar]
- Naidu MM, Shyamala BN, Pura Naik J, Sulochanamma G, Srinivas P. Chemical composition and antioxidant activity of the husk and endosperm of fenugreek seeds. LWT Food Sci Technol. 2011;44:451–456. doi: 10.1016/j.lwt.2010.08.013. [DOI] [Google Scholar]
- Oyaizu M. Studies on products of browning reaction. Antioxidative activities of products of browning reaction prepared from glucosamine. Jpn J Nutr Diet. 1986;44:307–315. doi: 10.5264/eiyogakuzashi.44.307. [DOI] [Google Scholar]
- Pandey H, Awasthi P. Effect of processing techniques on nutritional composition and antioxidant activity of fenugreek (Trigonella foenum-graecum) seed flour. J Food Sci Technol. 2015;52:1054–1060. doi: 10.1007/s13197-013-1057-0. [DOI] [PMC free article] [PubMed] [Google Scholar]
- Prieto P, Pineda M, Aguilar M. Spectrophotometric quantitation of antioxidant capacity through the formation of a phosphomolybdenum complex: specific application to the determination of vitamin E. Anal Biochem. 1999;269:337–341. doi: 10.1006/abio.1999.4019. [DOI] [PubMed] [Google Scholar]
- Re R, Pellegrini N, Proteggente A, Pannala A, Yang M, Rice-Evans C. Antioxidant activity applying an improved ABTS radical cation decolorization assay. Free Radical Biol Med. 1999;26:1231–1237. doi: 10.1016/S0891-5849(98)00315-3. [DOI] [PubMed] [Google Scholar]
- Salar RK, Purewal SS, Sandhu KS. Bioactive profile, free-radical scavenging potential, DNA damage protection activity, and mycochemicals in Aspergillus awamori (MTCC 548) extracts: a novel report on filamentous fungi. 3 Biotech. 2017;7:164–172. doi: 10.1007/s13205-017-0834-2. [DOI] [PMC free article] [PubMed] [Google Scholar]
- Salem AA, Nahla A, Al-askalany SA, Thabet HA. Effect of domestic processing methods of some legumes on phytochemicals content and bioavailability of some minerals. J Am Sci. 2014;10:276–288. [Google Scholar]
- Tavakoly R, Maracy MR, Karimifar M, Entezari MH. Does fenugreek (Trigonella foenum-graecum) seed improve inflammation, and oxidative stress in patients with type 2 diabetes mellitus? A parallel group randomized clinical trial. Eurp J Integr Med. 2018;18:13–17. doi: 10.1016/j.eujim.2018.01.005. [DOI] [Google Scholar]
- Tenore GC, Novellino E, Basile A. Nutraceutical potential and antioxidant benefits of red pitaya (Hylocereus polyrhizus) extracts. J Funct Foods. 2012;4:129–136. doi: 10.1016/j.jff.2011.09.003. [DOI] [Google Scholar]
- Wani SA, Kumar P. Fenugreek: a review on its nutraceutical properties and utilization in various food products. Saudi Soc J Agric Sci. 2018;17:97–106. doi: 10.1016/j.jssas.2016.01.007. [DOI] [Google Scholar]
- Yen GC, Chen HY. Antioxidant activity of various tea extracts in relation to their antimutagenicity. J Agric Food Chem. 1995;43:27–32. doi: 10.1021/jf00049a007. [DOI] [Google Scholar]
- Yen GC, Chen CS, Chang WT, Wu MF, Cheng FT, Shiau DK, Hsu CL. Antioxidant activity and anticancer effect of ethanolic and aqueous extracts of the roots of Ficus beecheyana and their phenolic components. J Food Drug Anal. 2018;26:182–192. doi: 10.1016/j.jfda.2017.02.002. [DOI] [PMC free article] [PubMed] [Google Scholar]
- Yu J, Ahmedna M, Goktepe I. Effects of processing methods and extraction solvents on concentration and antioxidant activity of peanut skin phenolics. Food Chem. 2005;90:199–206. doi: 10.1016/j.foodchem.2004.03.048. [DOI] [Google Scholar]
- Zhishen J, Mengcheng T, Jianming W. The determination of flavonoid contents in mulberry and their scavenging effects on superoxide radicals. Food Chem. 1999;64:555–559. doi: 10.1016/S0308-8146(98)00102-2. [DOI] [Google Scholar]