Abstract
Human insulin and its current therapeutic analogs all show propensity, albeit varyingly, to self-associate into dimers and hexamers, which delays their onset of action and makes blood glucose management difficult for people with diabetes. Recently, we described a monomeric, insulin-like peptide in cone snail venom with moderate human-insulin-like bioactivity. Here, with insights from structural biology studies, we report the development of mini-Ins—a human des-octapeptide insulin analog—as a structurally minimal, full-potency insulin. Mini-Ins is monomeric and, despite the lack of the canonical B-chain C-terminal octapeptide, has similar receptor binding affinity to human insulin. Four mutations compensate for the lack of contacts normally made by the octapeptide. Mini-Ins also has similar in vitro insulin signaling and in vivo bioactivities to human insulin. The full bioactivity of mini-Ins demonstrates the dispensability of the PheB24-PheB25-TyrB26 aromatic triplet and opens a novel direction for therapeutic insulin development.
INTRODUCTION
Our recent discovery of specialized venom insulins in the fish-hunting cone snail Conus geographus provides a unique opportunity to investigate the pharmacological potential of these fast-acting natural proteins that evolved to affect prey glucose homeostasis1. One of these insulins—Con-Ins G1—binds to human insulin receptor (hIR) with moderate affinity, and activates the insulin signaling pathway2. Intriguingly, Con-Ins G1 lacks the final nine residues (B22-B30) of the canonical insulin B chain and is monomeric1,2. By contrast, the human insulin equivalent—des-octapeptide(B23-B30)-insulin (DOI)—though monomeric, has extremely weak biological activity3. Con-Ins G1 is thus an insulin that is both structurally minimized and capable of activating hIR.
As monomeric formulation of insulin leads to faster absorption upon subcutaneous injection into patients4,5, a key question is whether the structural features that enable Con-Ins G1’s activity against hIR can be transferred to a monomeric human insulin backbone to produce fast-acting, therapeutic insulin analogs6. Here, we show that structural biology insights allow generation of an active human insulin analog that incorporates the structural features of Con-Ins G1. In particular, we (a) determine the crystal structure of Con-Ins G1 in complex with the insulin “micro-receptor” (a domain-minimized receptor construct comprising receptor residues 1–310 combined with an exogenous peptide spanning the C-terminal region of the receptor α chain7), (b) compare that structure to a structure of human insulin bound to the same receptor elements, and (c) model Con-Ins G1’s interaction with the membrane-distal loops of the receptor’s first type-III fibronectin domain, based on recent cryo-electron microscopy (cryoEM) structures of human insulin bound to hIR8–11. This model elucidates the likely mode of Con-Ins G1 interaction with holo-hIR. In parallel, we also (d) perform a series of structure-activity relationship studies that lead to the identification of a fully active human insulin analog (“mini-Ins”) that has four Con-Ins-G1-derived mutations lying outside of those involved in the μIR interaction. Mini-Ins is the smallest, fully active insulin analog identified to date and, as such, is a novel starting template for the development of a new generation of fast-acting prandial insulins.
RESULTS
Interaction of Con-Ins G1 with the primary insulin-binding site of hIR
The primary insulin-binding site of hIR can be reconstituted from a construct spanning receptor domains L1 (the first leucine-rich-repeat domain) and CR (the cysteine-rich region) combined with a peptide (αCT) spanning the C-terminal region of the receptor α chain7. This two-component system, termed the insulin micro-receptor or “μIR”, has proved invaluable for the crystallographic analysis of the interaction of human insulin with the receptor’s primary insulin-binding site13. How precisely the insulin binding sites observed in the crystallographic12,13 and cryoEM8–11,14 studies of hIR map to sites 1, 1’, 2 and 2’ of the prior kinetic models of insulin binding15,16 is, however, currently not fully understood. Here—for convenience alone—the binding surface formed by the first leucine-rich domain of one α chain and the C-terminal segment of the alternate α chain of the receptor will be denoted as the “primary binding site”, the binding surface formed by the membrane-distal loops of the first type-III fibronectin domain (“FnIII-1’“) of the alternate α chain of the receptor as the “secondary binding site”, and that seen under insulin-saturated conditions on the surface of the canonical ABE β-sheet of domain FnIII-1’ of the alternate α chain of the receptor as the “transient binding site”. The role of the latter in ligand binding and receptor activation is as yet unclear.
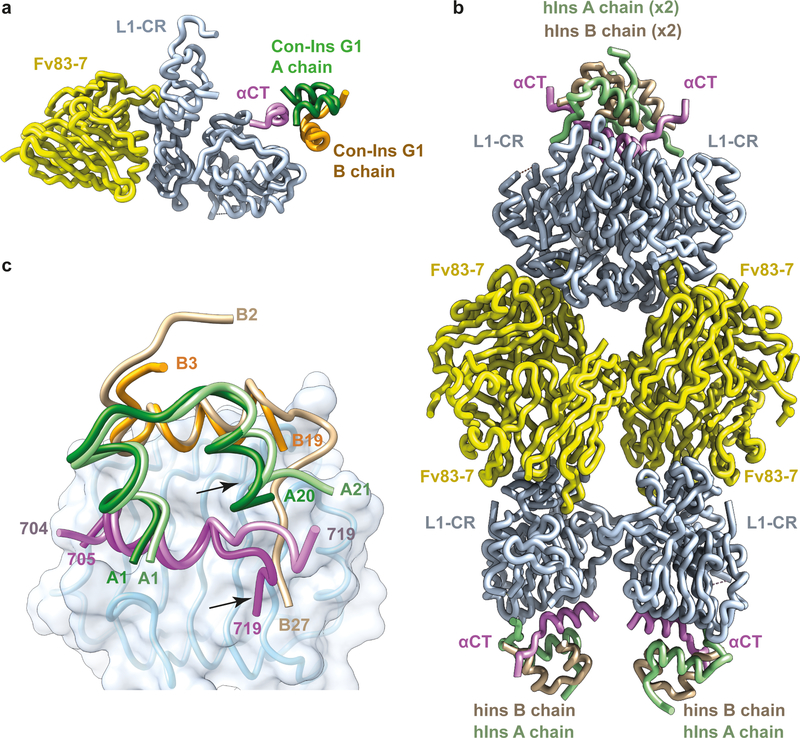
Critically, μIR lacks the greater conformational flexibility and extensive glycosylation of the intact ectodomain that severely hinder the latter’s ability to crystallize. A crystal structure of Con-Ins G1 bound to μIR as well as an improved crystal structure of human insulin bound to μIR are presented here, determined using diffraction data to 3.25 Å and 2.90 Å resolution limits, respectively (see Table 1 for statistics and Extended Data Fig. 1a,b for sample electron density). Both structures are co-complexes with the crystallization chaperone Fv 83–7, an engineered, antibody-variable-domain fragment17. The crystal structure of Con-Ins-G1-bound μIR has two copies of the co-complex within the crystallographic asymmetric unit (Fig. 1a), whereas its human-insulin-bound counterpart has four copies assembled with pseudo-222 point-group symmetry (Fig. 1b).
Table 1.
Data collection and refinement statistics
| Con-Ins-G1-bound Fv-83-7-bound μIR PDB 6VEQ) | Human-insulin-bound Fv-83-7-bound μIR (PDB 6VEP) | Mini-Ins (PDB 6VET) | |
|---|---|---|---|
| Data collection | |||
| Space group | I222 | P21 | P212121 |
| Cell dimensions | |||
| a, b, c (Å) | 106.16, 227.12, 228.70 | 100.03, 130.12, 148.18 | 28.37, 52.12, 80.50 |
| α, β, γ (°) | 90, 90, 90 | 90, 90.27, 90 | 90, 90, 90 |
| Resolution (Å) | 48.15–3.25 (3.35–3.25)a | 48.89–2.90 (2.95–2.90) | 43.75–1.46 (1.48–1.46) |
| Rmerge | 0.259 (2.75) | 0.263 (3.64) | 0.143 (4.47) |
| I/σ(I) | 6.4 (0.59) | 5.7 (0.44) | 9.7 (0.6) |
| CC1/2 | 0.992 (0.163) | 0.984 (0.112) | 0.999 (0.380) |
| Completeness (%) | 99.8 (99.9) | 99.0 (97.9) | 99.5 (90.4) |
| Redundancy | 5.8 (6.0) | 3.8 (3.6) | 13.0 (12.5) |
| Refinement | |||
| Resolution (Å) | 48.15–3.25 | 48.89–2.90 | 43.75–1.46 |
| No. reflections | 43845 | 82572 | 21302 |
| Rwork / Rfree | 0.228 / 0.277 | 0.193 / 0.225 | 0.201 / 0.238 |
| No. atoms | |||
| Protein | 9247 | 19300 | 1953 |
| Ions | 20 | 0 | 0 |
| Water | 0 | 18 | 119 |
| B factors | |||
| Protein | 124 | 102 | 32 |
| Ions | 127 | - | - |
| Water | - | 66 | 38 |
| R.m.s. deviations | |||
| Bond lengths (Å) | 0.002 | 0.010 | 0.006 |
| Bond angles (°) | 0.5 | 1.2 | 0.6 |
Values in parentheses are for highest-resolution shell. All diffraction data sets were collected from a single respective crystal
Figure 1. Overview of crystal structures of Con-Ins-G1-bound Fv-83–7-bound μIR and of human-insulin-bound Fv-83–7-bound μIR.
(a) Structure of monomer 1 of Con-Ins-G1-bound Fv-83–7-bound μIR. (b) Pseudo-222-symmetric assembly of the four human-insulin-bound Fv-83–7-bound μIR moieties within the crystallographic asymmetric unit. (c) Overlay of monomer 1 of Con-Ins-G1-bound μIR with monomer 1 of human-insulin-bound μIR, based on the common domain L1 (light blue). The displaced A-chain C-terminal helix of Con-Ins G1 and the displaced C-terminal region of αCT within the complex are indicated with arrows. A chains are colored green and B chains orange, with those of human insulin in lighter shades than those of Con-Ins G1.
Our new structure of the human-insulin-bound μIR is of significantly higher resolution than the extant structure of human-insulin-bound μIR (3.5 Å; Supplementary Table 1, PDB entry 4OGA), and is of somewhat better resolution than the cryoEM structures of the insulin-bound hIR ectodomain8–11,14. We thus chose to use this new structure as the starting point for comparison of Con-Ins G1’s association with receptor with that of human insulin. As the four human insulin molecules within the crystallographic asymmetric unit display somewhat varying disposition with respect to their associated domain L1 (up to 1.6 Å root-mean-square difference (r.m.s.d.) across Cα atoms; Supplementary Table 2) we decided to select one as the reference. To do this, we compared each in turn to its counterpart within the cryoEM structure of human insulin in complex with a leucine-zippered form of the intact IR ectodomain10 (resolution 3.2 Å; PDB entry 6HN5). Such comparison indicates that monomer 1 of the human-insulin-bound μIR (defined as chains A to F of that structure) has the least r.m.s.d. (0.8 Å) to the cryoEM structure in terms of its insulin disposition on domain L1 (Supplementary Tables 2 and 3). Monomer 1 of human-insulin-bound μIR was thus selected as the “reference monomer” for cross-comparison with its Con-Ins G1 counterpart. For Con-Ins-G1-bound μIR itself, we in turn selected monomer 1 (defined as chains A to F of that structure (defined as chains A to F of that structure), as that monomer showed lower r.m.s.d. (1.3 Å) with respect to the reference monomer of the human-insulin-bound μIR than did the alternate monomer of the Con-Ins-G1-bound μIR (Supplementary Tables 2 and 3).
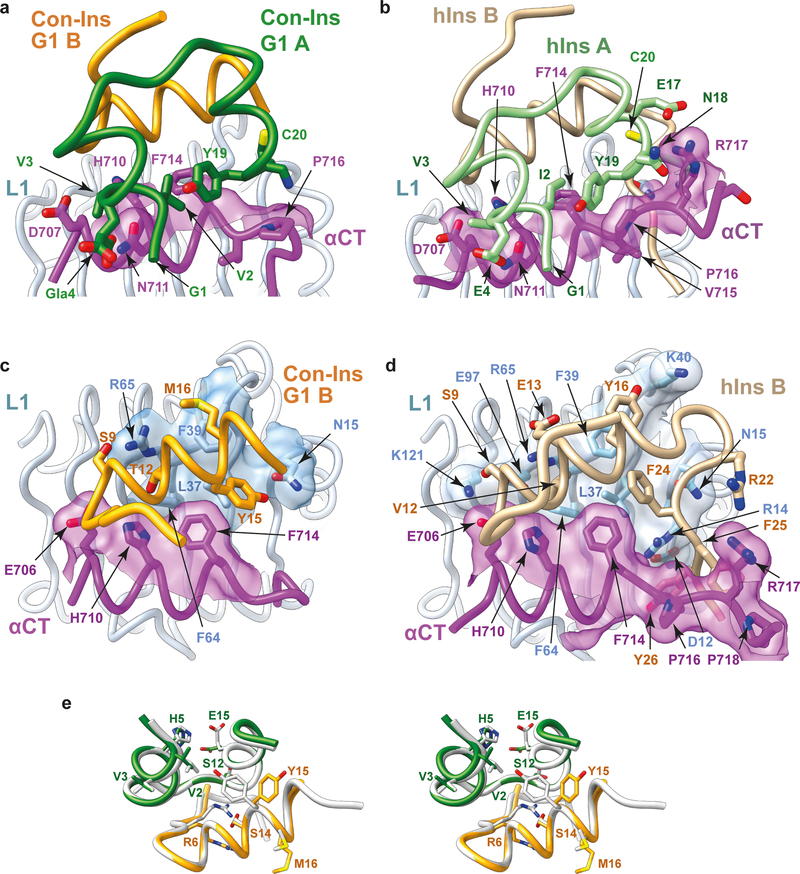
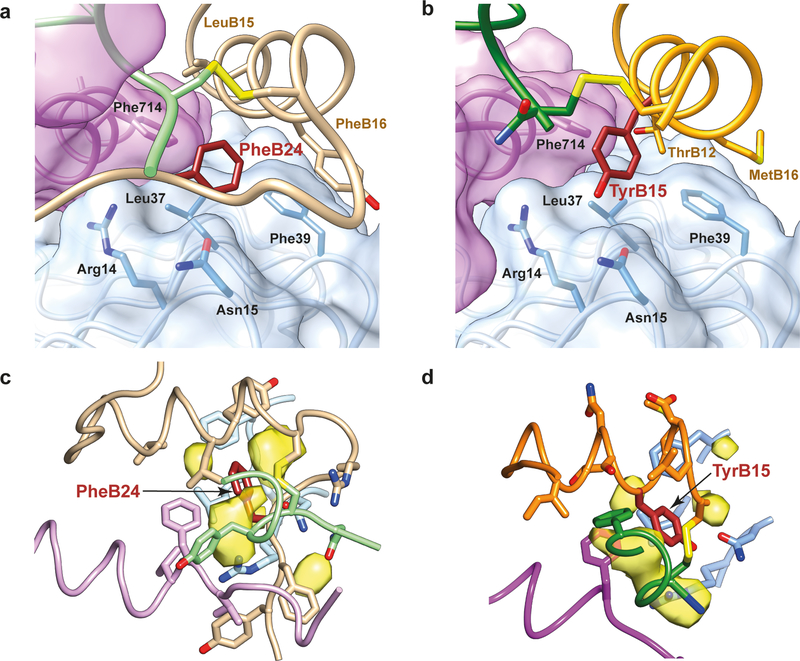
Overlay of monomer 1 of the Con-Ins-G1-bound μIR onto the reference monomer then reveals the following. (a) The A-chain C-terminal helix of Con-Ins G1 is packed closer to the core of Con-Ins G1 than is the corresponding element within human insulin (Fig. 1c). (b) As a consequence, the C-terminal region of the αCT peptide in the Con-Ins G1 complex is displaced away from the venom peptide, as it is sterically prevented from adopting the conformation it adopts in the human insulin complex (Fig. 1c). (c) The interaction of Con-Ins G1 with μIR is considerably more sparse than that of human insulin with μIR (Fig. 2a–d). Indeed, analysis reveals that the interaction of A and B chains of Con-Ins G1 with the μIR bury respective totals of 221 Å2 and 314 Å2 of molecular surface from solvent, compared to 314 Å2 and 711 Å2 for the A and B chains of human insulin, respectively. (d) At the individual residue level, the most marked difference between the complexes is that the side chain of Con-Ins G1 TyrB15 (larger than that of its human-insulin equivalent LeuB15) is accommodated in the volume that is occupied by the side chain of human insulin PheB24 in the human-insulin-bound μIR (Fig. 2c,d), aligning with our prior prediction2. Such “mimicking” of human insulin PheB24 by Con-Ins G1 TyrB15 is discussed in more detail below. (e) Both TyrB20 and ArgB21 are disordered within the Con-Ins-G1-bound μIR (see Supplementary Table 3), in contrast to their human-insulin equivalents GlyB20 and GluB21, which form part of a structurally well-defined region of the human-insulin B chain. We had earlier suggested that Con-Ins G1 TyrB20 may play a role in primary binding site engagement, but the structure presented here implies that it either is not involved in primary binding site engagement or requires the holo-receptor environment for primary binding site engagement. (f) Despite these differences, the character of the individual pair-wise interactions between the respective insulins and the μIR is otherwise largely conserved; in particular, one of the two carboxylates of the side chain of the post-translationally-modified Con-InsG1 residue GlaA4 (γ-carboxyl glutamate) interacts with αCT residue Asn711 in an equivalent fashion to that of human insulin GluA4 (Fig. 2a,b).
Figure 2 . Structural biology of Con-Ins G1 and human insulin within their respective μIR co-complexes.
(a) Interaction of Con-Ins G1 A chain with the μIR. (b) Interaction of human insulin A chain with the μIR. (c) Interaction of Con-Ins G1 B chain with the μIR . (d) Interaction of human insulin B chain with the μIR. Molecular surfaces in panels (a) to (d) are those associated with residues buried or partly buried within the respective interaction; the respective A chains are omitted for clarity in panels (c) and (d). (e) Stereo view of an overlay of Con-Ins G1 in its μIR-bound form (monomer 1) and its receptor-free form (PDB entry 5JYQ), viewed from the surface of domain L1 outwards. Green: Con-Ins G1 A chain, receptor-bound; orange: Con-Ins G1 B chain, receptor bound; grey: Con-Ins G1, receptor-free (PDB entry 5JYQ). Selected residues showing major rotameric differences are labelled.
Taken together, the above observations lead us to conclude that, despite hIR not being the biological target of Con-Ins G1, the mode of Con-Ins G1’s engagement with human μIR seen here in all likelihood mimics that of its engagement with the same elements of prey (fish) insulin receptor, as the receptor residues involved in the engagement are highly conserved across the two species (Supplementary Table 4). The backbone conformations of receptor-bound and receptor-free Con-Ins G1 are also closely similar (r.m.s.d. ≈ 0.45 Å across common Cα atoms; Fig. 2e), with only a few pair-wise differences in side-chain rotameric conformation, notably at ArgB6, TyrB15, MetB16 and GluA15 (Fig. 2e).
As mentioned above, the side chain of Con-Ins G1 TyrB15 in its complex with μIR occupies the same volume as that of human insulin PheB24 in its complex (Fig. 3a,b). Human insulin PheB24 and PheB25 are both critical for receptor affinity (based on the observations that des-pentapeptide(B26-B30)-[PheB25-α-carboxamide]insulin displays native-like affinity, des-hexapeptide(B25-B30)-[PheB24-α-carboxamide]insulin displays ~20-fold lower affinity than native, and des-heptapeptide(B24-B30)-[GlyB23-α-carboxamide]insulin displays ~500-fold lower affinity than native18). The environment of the side chain of human insulin PheB24 in human-insulin-bound μIR is overwhelmingly hydrophobic (Fig. 3a), being made up of the side chains of hIR residues Leu37, Phe39 and Phe714 and insulin residues LeuB15, PheB16, CysB19 and CysA20. Analysis also reveals the existence of a number of cavities surrounding the PheB24 side chain (Fig. 3c), suggesting that PheB24 may be replaceable by other hydrophobic residues if these are of similar size and/or shape. Indeed, human insulin B24 is tolerant to substitution by leucine, valine, methionine and cyclohexylalanine, less tolerant to substitution by (the larger) tyrosine and tryptophan or (the smaller) alanine and valine, and intolerant to substitution by proline, serine, threonine, asparagine, aspartic acid, glutamine, glutamic acid, histidine or orthinine19. Similar cavities surround Con-Ins G1 TyrB15 (Fig. 3d), again suggesting tolerance to substitution.
Figure 3. Side-chain substitution of human insulin PheB24 by Con-Ins G1 TyrB15.
(a) Packing of human insulin PheB24 within the human-insulin-bound μIR. (b) Packing of Con-Ins G1 TyrB15 within the Con-Ins G1-bound μIR. (c) Cavities surrounding human insulin PheB24 within the human-insulin-bound μIR. (d) Cavities surrounding Con-InsG1 PheB15 within Con-Ins G1-bound μIR. Within all panels, colors are as follows: human insulin A chain light green, human insulin B chain tan, Con-InsG1 A chain orange, Con-Ins B chain green, αCT magenta (violet in human insulin complex) and L1 light blue. Human insulin PheB24 and Con-Ins G1 TyrB15 are in brown and their surrounding cavities in transparent yellow. Cavities computed using SURFNET33 within CHIMERA34.
TyrB15 and TyrB20 substitutions within DOI
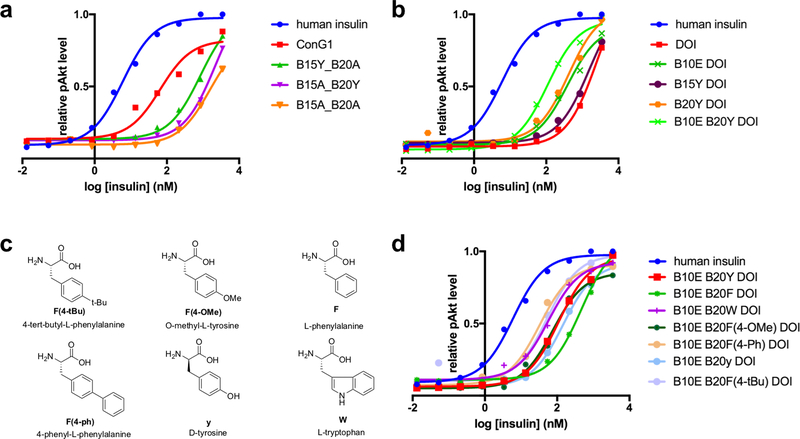
We first investigated the roles of TyrB15 and TyrB20 within Con-Ins G1, synthesizing Con-Ins G1 analogs with alanine mutations at one or both these sites. We found that both AlaB15 and dual mutation led to a significant reduction in potency in Akt activation, whereas AlaB20 led to a lesser reduction (Fig. 4a), broadly aligning with the above observations that Con-Ins G1 TyrB15 engages the μIR and Con-Ins G1 TyrB20 does not.
Figure 4. Structure-activity studies on Con-Ins G1 and DOI.
(a) Alanine scanning studies of Con-Ins G1 TyrB15 and TyrB20. (b) Mutation studies of DOI LeuB15 and GlyB20 wherein these residues were replaced by tyrosine residues. (c,d) Exploration of B20 mutations on DOI. For all analogs, each data point represents the mean of four assays. Error bars (s.e.m.) are smaller than the marker size. Source data for panels a, b and d are available with the paper online.
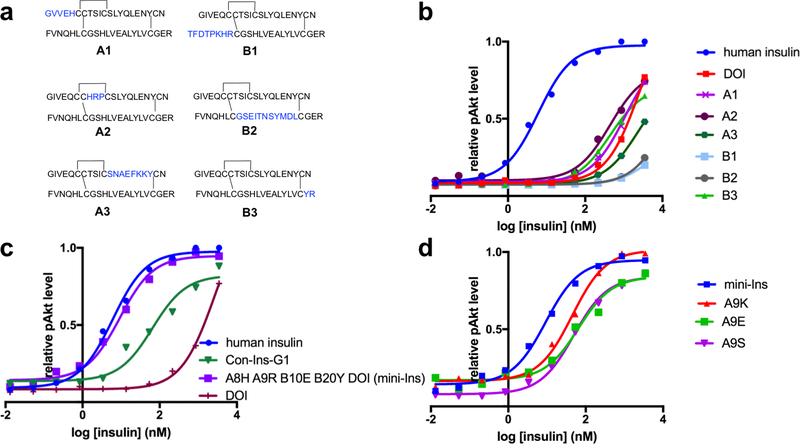
We then explored the effects of inclusion of Con-Ins G1 TyrB15 and TyrB20 within human DOI, a monomeric, inactive insulin analog (500-fold potency reduction with respect to human insulin)20. Surprisingly, we observed that TyrB20 substitution led to a five-fold increase in bioactivity, whereas TyrB15 did not (Fig. 4b). We also found that large, unnatural aromatic residues—such as those with biphenyl or 4-tBu-phenyl groups (Fig. 4c)—led to a further two-fold increase in potency over the TyrB20 substitution (Fig. 4d), suggesting that TyrB20 may be involved in a hydrophobic interaction with the receptor that can be maximized by a larger, aromatic substituent.
Substitution of DOI HisB10 by glutamic acid, the non-post-translationally modified version of Con-Ins G1 GlaB10, also led to a five-fold increase in bioactivity, consistent with previous reports on the effect of negatively charged amino acids in this position21. Combined GluB10 and TyrB20 substitutions in DOI resulted in an analog only twenty-fold weaker in potency than human insulin (Fig. 4b).
Further Con-Ins G1 substitutions within DOI and identification of mini-Ins
We next searched, by introducing Con-Ins G1 fragments into DOI sequences, for other Con-Ins G1 residues that could be responsible for Con-Ins G1’s potency. Both the Con-Ins G1 A and B chains were then divided into three fragments, each using Cys residues as dividers. Substitution these fragments into DOI led to six hybrid peptides denoted A1, A2, A3, B1, B2 and B3 (Fig. 5a). Peptides A2 and B3 had increased bioactivity with respect to DOI, whereas peptides B1, B2 and A3 had much reduced potency, and the bioactivity of peptide A1 was similar to DOI (Fig. 5b). The high potency of peptide B3 is expected, given the role of TyrB20 elucidated above. On the other hand, the high potency of peptide A2 (six-fold higher than DOI) was worthy of further investigation. Substitution of human insulin ThrA8 by histidine has been reported to increase potency three-fold22, suggesting that the ArgA9 and/or ProA10 substitutions within peptide A2 may be responsible for the additional increase. Further investigation of these substitutions led to the identification of [HisA8, ArgA9, GluB10, TyrB20]-DOI, which we term “mini-Ins” as it is the smallest reported human insulin analog with potency comparable to human insulin (Fig. 5c). We note that previous reports suggested that SerA9 does not interact with hIR23, whereas we observe that positively-charged residues at position A9 within mini-Ins increase bioactivity above that of a serine substitution (Fig. 5d).
Figure 5. Structure-activity studies on DOI.
(a,b) Exploration of Con-Ins G1-DOI hybrid peptides created by inserting Con-Ins G1 segments into the DOI skeleton. (c) Identification of mini-Ins, [HisA8, ArgA9, GluB10, TyrB20]-DOI, by incorporating four mutations from Con-Ins G1 into DOI. (d) Mutational studies of DOI at SerA9. For all analogs, each data point represents the mean of four assays. Error bars (s.e.m.) are smaller than the marker size. Source data for panels b, c and d are available with the paper online.
In vitro characterization of mini-Ins
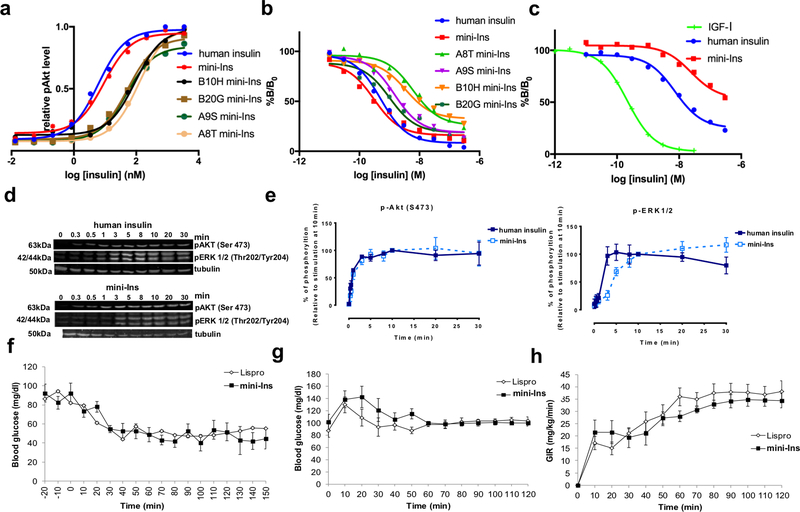
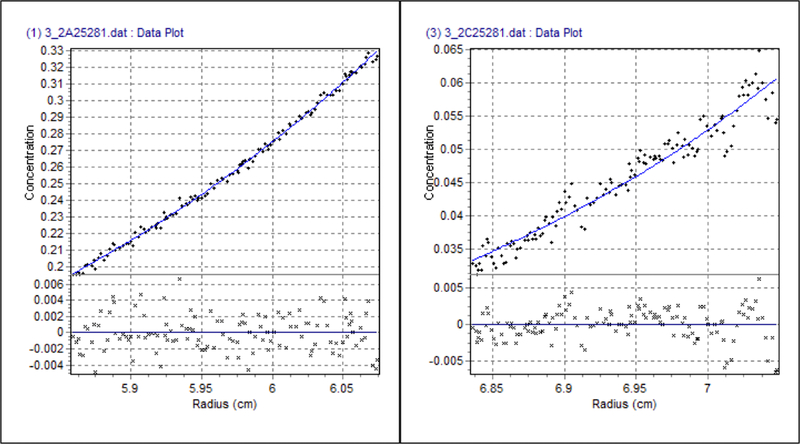
We confirmed using analytical ultracentrifugation, that mini-Ins, like DOI, does not form dimers (Extended Data Fig. 2). We then explored whether all four mini-Ins substitutions (i.e., HisA8, ArgA9, GluB10, TyrB20) are required for its bioactivity. Four mini-Ins analogs—which in turn lack one of the four substitutions—were each found to have a five- to twenty-fold reduction in bioactivity compared to the parent mini-Ins, suggesting that none of the four substitutions is dispensable (Fig. 6a). Similarly, all four substitutions appear required for mini-Ins’ binding affinity toward hIR (Fig. 6b). While insulin is already a weaker binder to the type 1 insulin-like growth factor receptor (IGF-1R) than to hIR, mini-Ins is an even weaker binder to IGF-1R, suggesting that there is low risk of mini-Ins cross-reactivity in vivo (Fig. 6c). We further examined the activation of Akt and ERK1/2 upon insulin binding and measured similar potencies between mini-Ins and insulin (Fig. 6d,e).
Figure 6. Biochemical, in vitro and in vivo characterization of mini-Ins.
(a) Insulin receptor activation of mini-Ins and analogs. Each data point represents the mean of four assays for all analogs. (b) Insulin receptor (B isoform) affinity assay of mini-Ins, human insulin and analogs. For all analogs, each data point represents the mean of three assays (except for four for human insulin and two for SerA9 mini-Ins), with n = 3 technical replicates for each assay. Error bars (s.e.m.) are smaller than the marker size. (c) Comparison of IGF-1R affinity for IGF-I, human insulin and mini-Ins. Each data point represents the mean of three assays for all analogs. Error bars (s.e.m.) are smaller than the marker size. Results in (b) and (c) are expressed as a percentage of binding in the absence of competing ligand. (d,e) Evaluation of Akt and ERK1/2 signaling activation by human insulin and mini-Ins. Data points in panel (e) represent the average of three independent experiments and error bars the standard deviation of the data. (f) Intraperitoneal administration of mini-Ins and insulin lispro in healthy rats. (g,h) Euglycemic-hyperinsulinemic clamp studies to evaluate the in vivo insulin action of mini-Ins and insulin lispro in rats. Source data for panels a-c and e-h are available with the paper online.
In vivo properties of mini-Ins
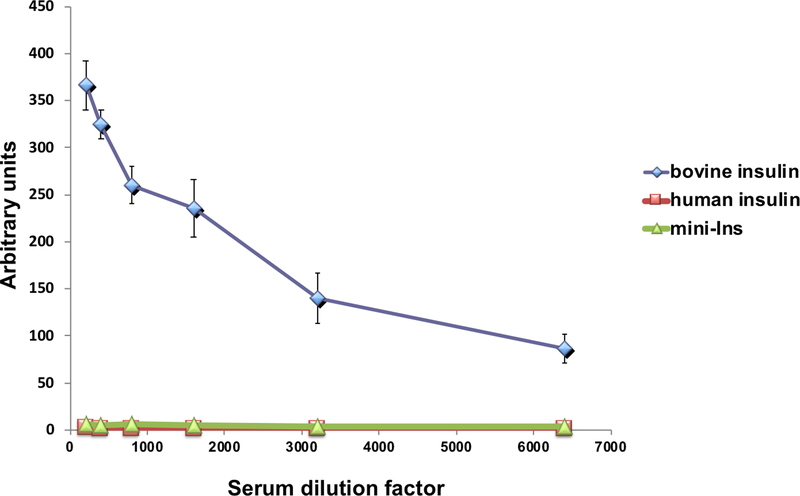
The in vivo performance of mini-Ins was then evaluated in animal models. Intraperitoneal administration of insulin lispro, a therapeutic insulin analog with faster dissociation rates of hexamers and dimers into monomers than native insulin, or mini-Ins (0.014 mg kg−1) in rats lowered blood glucose levels and reached similar nadir levels (~50 mg dL−1) in mice (Fig. 6f). To confirm equal efficacy of lispro and mini-Ins, hyperinsulinemic-euglycemic clamp experiments were performed in rats. Blood glucose levels were well matched across lispro- and mini-Ins-treated rats (Fig. 6g). The amount of exogenous glucose infusion necessary to maintain euglycemia (an index of insulin sensitivity) was equal for the lispro- and mini-Ins-treated rats (Fig. 6h), indicating that these analogs are equipotent. We further evaluated the immunogenicity of mini-Ins in B6 (H-2b) mice after a 21-day immunization period. Consistent with reports, bovine insulin-immunized mice produce a high titer of antibody to bovine insulin, whereas human insulin does not generate an antibody response in mice (Extended Data Fig. 3)24. Mini-Ins also did not generate an antibody response (Extended Data Fig. 4), indicating that the four mutations do not significantly change its immunogenicity in mice from that of human insulin.
Affinity of mini-Ins and DOI for the primary binding site of hIR
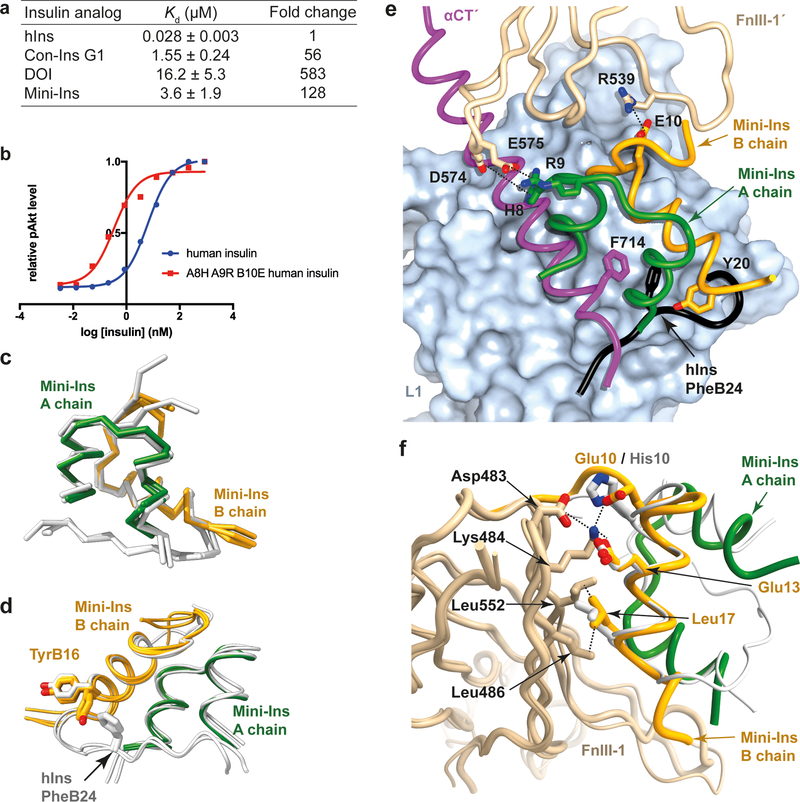
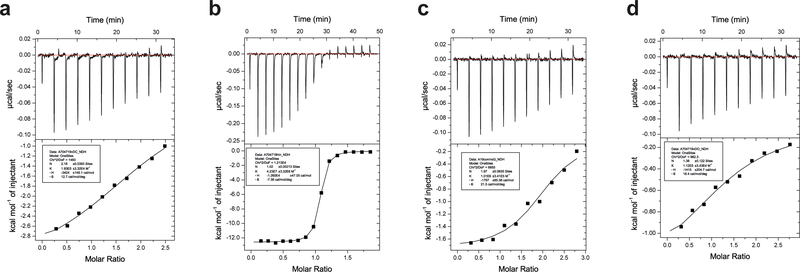
Isothermal titration calorimetry was used to investigate the affinity of DOI and mini-Ins for the primary binding site of the hIR as assembled from IR485 (a construct comprising IR domains L1, CR and L225) in combination with the IR-A αCT peptide 704–719. Analysis reveals a respective 128-, 56- and 583-fold decrease in Kd for mini-Ins, Con-Ins G1 and DOI with respect to human insulin (Fig. 7a; for detail, see Extended Data Fig. 4). The affinity of mini-Ins for the primary binding site is thus significantly weaker than that of the native hormone, suggesting that the greater-than-native-like affinity of mini-Ins for the holo-receptor (Fig. 6b) derives from its enhanced affinity for receptor elements lying outside domains L1, CR, L2 and αCT. Consistent with this result, human insulin with HisA8, ArgA9 and GluB10 substitutions has twenty-fold increased bioactivity compared to human insulin (Fig. 7b), indicating that these three substitutions provide additional interactions with the receptor. Noted, a minimized human insulin with a positive charged residue at A8 and a negatively charged residue at B10 (insulin X92: A8H, B10D, B25Y-amide) had a 12-fold-increased affinity for hIR and 77-fold increased affinity for the IGF-1R, which is consistent with our current result26.
Figure 7. Probing the interaction of mini-Ins with hIR.
(a) Isothermal titration calorimetry studies of various insulin analogs binding to the primary binding site of hIR. Reported Kd values are the weighted mean of the Kd values of individual technical replicates, plus the standard error of that mean (see Methods for further detail). (b) Positive effects of mutations on human insulin. (c) Superposition of the three monomers of mini-Ins (colored) within the asymmetric unit of its crystal structure compared with those within the asymmetric unit of the human insulin crystal structure (white; PDB entry 1MSO). (d) Rotameric variation between TyrB16 within the mini-ins and human insulin crystal structures. Monomers overlaid as in panel (c). (e) Model of mini-Ins in complex with primary and secondary binding site elements of hIR. Domain L1 is shown as surface (powder blue), with ribbon representations of the αCT segment (magenta), mini-Ins A chain (green), mini-Ins B chain (orange) and domain FnIII-1’ (tan). The C-terminal segment of the human insulin B chain (obtained by superimposition of hIns.μIR.Fv83–7) is shown in black, highlighting how TyrB20 of mini-Ins approaches the key hydrophobic pocket occupied by human insulin PheB24. Specific interactions between mini-Ins with FnIII-1’ are highlighted. (f) Model of mini-Ins in complex with transient binding site on domain FnIII-1 of hIR, overlaid human insulin (white) as visualized in PDB entry 6PXV8. Mini-Ins and FnIII-1 colors are as in panel (e). Source data for panels a and b are available with the paper online.
Crystal structure of mini-Ins
Crystals of mini-Ins were obtained serendipitously in attempts to co-crystallize it with μIR plus Fv 83–7; the mini-Ins structure was then determined by x-ray diffraction (see Table 1 for statistics and Extended Data Fig. 1c for sample electron density). Three copies of mini-Ins are present in the crystallographic asymmetric unit, each of which allowed modelling of residues A1 to A20 and B1 to B22, i.e., of all mini-Ins residues except A21. Overlay of the structure onto that of human insulin (PDB entry 1MSO27) revealed that mini-Ins retains the canonical insulin secondary structure (Fig. 7c), the disorder of residue AsnA21 likely being a consequence of the absent B-chain C-terminal residues against which AsnA21 packs in human insulin. In mini-Ins, residues B20-B22 adopt an extended conformation directed away from the analog core in a direction approximately parallel to the axis of the B-chain helix (Fig. 7c). Their conformation differs from that in human insulin, wherein residues B20-B23 adopt a β-turn conformation that directs the remaining seven B-chain C-terminal residues in an extended conformation anti-parallel to the axis of the B-chain helix (Fig. 7c). This difference most likely correlates with the absence in mini-Ins of human insulin PheB24 and TyrB26, the side chains of which tether the B-chain C-terminal strand to the hormone’s hydrophobic core. Differences at the individual residue rotamer level are assessed as minor—the most salient difference is that in one asymmetric unit copy of mini-Ins, the side chain of TyrB16 is rotated from its outward-facing conformation in human insulin to an inward-facing conformation (Fig. 7d). The inward-facing conformation is precluded in human insulin by the presence of PheB24. Inward rotation of the side chain in mini-Ins results in interaction of the aromatic ring of TyrB16 with the otherwise-exposed hydrophobic side chains of the analog core.
Molecular dynamics investigation of mini-Ins binding to hIR
To gain insight into how mini-Ins achieves high receptor affinity despite the absence of B-chain residues previously defined as integral to hIR binding13, we used the above mini-Ins crystal structure to create an in silico model of the analog in complex with isolated elements of hIR that together form the primary and secondary binding sites—namely, domain L1 (residues 1–159), the αCT’ segment (residues 689–718, IR A-isoform numbering) and the first fibronectin type III domain (domain FnIII-1’; residues 471–591). The relative configuration of these receptor elements is based on that observed in the recent cryoEM structure of human insulin bound to a leucine-zippered form of the receptor ectodomain10. A second model, containing only the L1 and αCT’ elements in complex with mini-Ins, was stable over a 100 ns molecular dynamics (MD) simulation and reproduced most of the interactions observed for the common residues in the co-crystal structure of human insulin and μIR12.
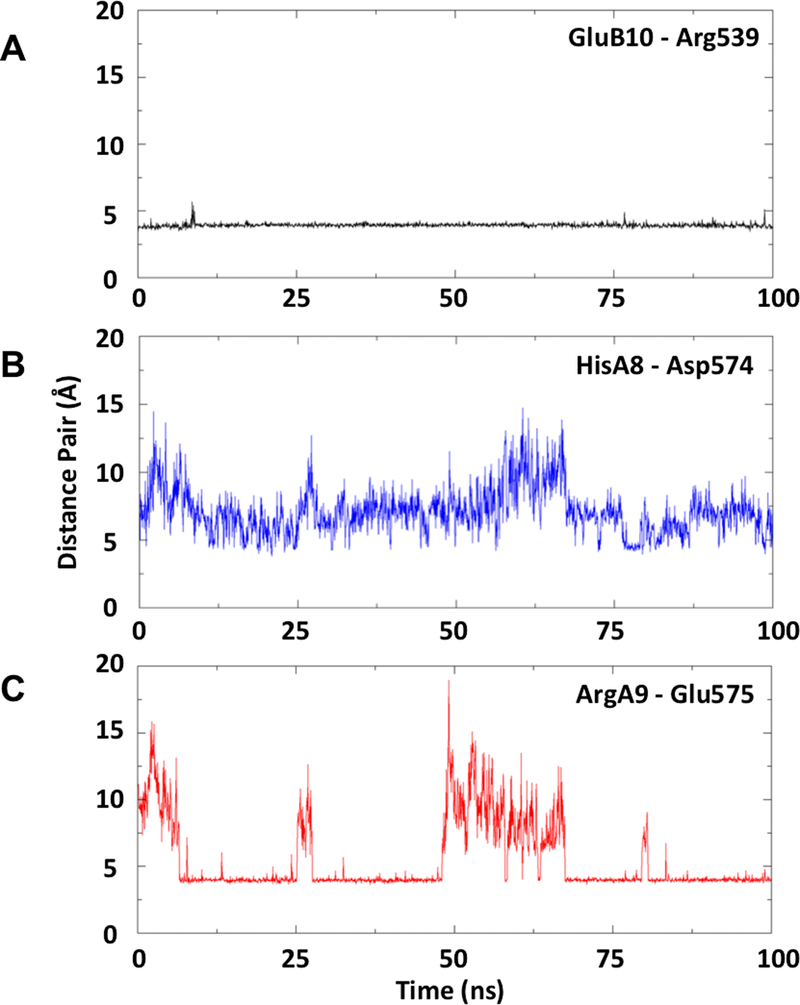
In all three replicate simulations of mini-Ins in complex with domain L1, the αCT’ segment and domain FnIII-1’, TyrB20 was observed to approach—but not fully occupy—the hydrophobic cavity formed by mini-Ins residues ValB12, LeuB15, TyrB16 and CysB19 and hIR residues Asn15, Leu37, Phe39 and Phe714 that would otherwise be occupied by the side chain of human insulin PheB24 (Fig. 7e). The side chain of mini-Ins TyrB20 thus only partially recapitulates the hydrophobic core interactions characteristic of the primary binding site interaction. The conformation of TyrB20 was stable (and was adopted rapidly) during the MD simulations, and was reproduced in simulations of the complex with the primary binding site alone, and with primary and secondary binding sites together, suggesting that the stability of the complex of mini-Ins with the primary binding site is not an artefact of the restrained FnIII-1’ domain employed in the simulation. During the simulation of the interaction of mini-Ins with the combined primary and secondary binding-site elements, stable inter-molecular salt bridges were observed to form between mini-Ins residue ArgA9 and domain FnIII-1’ residue Glu575 and between mini-Ins residue GluB10 and domain FnIII-1’ residue Arg539. (Fig. 7e, Extended Data Fig. 5). The FnIII-1’ domain loop Phe572-to-Tyr579 showed significant flexibility throughout the simulations, although its mobility was substantially reduced when HisA8 was protonated; the latter residue then forming a transient salt bridge with Asp574 that in turn permits formation of the ArgA9-to-Glu575 and GluB10-to-Arg539 salt bridge (Fig. 7e).
Simulations of mini-Ins in complex with the transient binding site (as formed by the canonical ABE β sheet of domain FnIII-128), indicated a small shift in the disposition of the A chain on the surface of FnIII-1 compared to that of human insulin on the same surface (r.m.s.d. of 3.3 ± 0.8 Å with respect to the human insulin A chain in the cryo-EM structure [PDB entry 6PXV28]). This shift may originate from (i) the reduced interaction of mini-Ins with FnIII-1 compared to that of human insulin and (ii) the absence of the salt bridge present in the human insulin complex between the terminal cap of the human insulin A-chain N-terminal helix and residue Glu154 of the adjacent domain L1 within the alternate monomer to that contributing domain FnIII-1. However, comparative simulations of the interaction of human insulin and domain FnIII-1 indicate that human insulin undergoes a similar global shift within these simulations (r.m.s.d. of 3.0 ± 0.7 Å based on the A chain compared to that of the mini-Ins simulations). Nevertheless, simulations of the complex of mini-Ins with the transient binding site were stable and indicated a high degree of similarity to the simulations with human insulin (Fig. 7f). In contrast to their primary binding-site interactions, the transient binding-site interactions of both human insulin or mini-Ins are characterised by few specific or persistent interactions, with hydrophobic interactions between LeuB17, Leu486 and Leu552, and electrostatic interactions between Asp483, Lys484, GluB13 and GluB10 being the most prominent in the case of mini-Ins. In the simulations of human insulin binding, HisB10 Nε acts as a stable hydrogen-bond acceptor to domain FnIII-1 residue Lys484, the latter also forming salt bridges to both Asp483 and GluB13. The simulations of mini-Ins binding also demonstrate salt bridges between Lys484 and both Asp483 and GluB13, as well as a further salt bridge between Lys484 and GluB10 (Fig. 7f).
DISCUSSION
Con-Ins G1 is an outlier among known natural insulin-like molecules, having four post-translational modifications that enhance its interaction with hIR and lacking the C-terminal residues of the canonical insulin B chain2. The relatively high potency of Con-Ins G1 and several other cone snail insulin-like peptides28 with respect to hIR is unexpected, as the B-chain C-terminal octapeptide (inclusive, especially, of the aromatic triplet PheB24-PheB25-TyrB26) is critical for high-affinity binding of human insulin to hIR20,28. In this work, we confirmed, by determining the crystal structure of the Con-Ins-G1-bound μIR, that Con-Ins G1 TyrB15 interacts with a critical hydrophobic pocket within μIR as was previously predicted2. Although TyrB20 is disordered in this structure, we had also previously predicted that TyrB20 may also be involved in hIR binding2. In fact, both TyrB15 and TyrB20 in Con-Ins G1 are individually critical for hIR binding, though TyrB15 is seen here to play a greater role than TyrB20 (Fig. 4a). Given that Con-Ins G1 and human insulin have near-identical backbone conformations, our findings taken collectively suggest that the B15 and B20 tyrosine substitutions substantially compensate for the loss of the aromatic triplet and restore significant binding affinity to DOI.
Despite both TyrB15 and TyrB20 being critical for Con-Ins G1’s activity, only TyrB20 substitution enhances DOI’s binding of hIR (Fig. 4b), indicating different roles of these residues in Con-Ins G1 and DOI. Our further structure-activity relationship studies then identified mini-Ins, a human DOI analog with the four substitutions HisA8, ArgA9, GluB10 and TyrB20. HisA8 and GluB10 substitutions are known already to enhance affinity in human insulin21,22, but the effect of arginine substitution at A9 is unexpected, as human insulin SerA929 is not seen to engage the hIR primary, secondary or transient binding sites within the extant cryoEM structures11. These findings suggest that ArgA9 in Con-Ins G1 and mini-Ins is most likely involved in a charge-charge interaction with hIR, as both arginine and lysine substitutions lead to enhanced activity (Fig. 5d).
We then investigated further the molecular rationale for the surprisingly high affinity of mini-Ins for hIR. Using an L1-CR-L2 module plus an exogenous αCT peptide segment as a surrogate for the primary binding site of hIR7,25, we found that the affinity of human insulin for the primary binding site is 127-fold higher than that of mini-Ins. Considering the similar affinities of human insulin and mini-Ins for full-length hIR, mini-Ins must utilize additional binding interactions to achieve its high affinity. We hence suspected that mini-Ins has enhanced affinity (with respect to human insulin) for hIR’s secondary binding site, as (i) previous studies suggest that human insulin residues A8 and B10 both interact with the hIR secondary binding site29 and (ii) their mutation within mini-Ins to threonine and histidine, respectively, leads to reduced affinity (Fig. 6b). Our molecular dynamics modeling of the mini-Ins complex indicates a possible molecular mechanism for these enhancements. The orientation of TyrB20 towards the PheB24 binding site of human insulin suggests that this residue may compensate for loss of PheB24 and stabilize the primary binding site interaction. Also indicated is how the further mini-Ins mutations likely contribute to its interaction with both the secondary and transient binding sites of hIR: residues HisA8, ArgA9 and GluB10 are all likely to contribute to the stability of the receptor complex by forming stable interactions with residues present within the Phe572-to-Tyr579 loop of hIR domain FnIII-1’ (Fig. 6). Indeed, human insulin with the above three mutations led to an analog with a twenty-fold increased activity above that of human insulin (Fig. 7b). Taken together, these results offer further support for residues A8, A9 and B10 interacting with the secondary binding site. The above findings further emphasize the exceptional molecular diversity of cone snail venom, leading to the discovery of a novel gain-of-affinity mutation.
As an aside, we note that the binding of human to holo-IR also results in an intra-receptor engagement of receptor domain L2 with receptor domain L1 and the αCT’ segment8–11. As, this L2-derived engagement is distal to insulin’s engagement with receptor domain L1 and the αCT’ segment, we speculate that it is preserved upon mini-Ins binding to holo-IR. Further modelling and/or structural studies would be required to test this hypothesis.
It should be noted that both HisA8 and GluB10 mutations can also lead to increased affinity towards IGF-1R, an undesired outcome for therapeutic development owing to mitogenic concerns26,30. However, such an adverse effect is not observed for mini-Ins, which has twenty-fold weaker affinity for IGF-1R compared to human insulin. Although DOI has a weak affinity toward hIR, it is also 100-fold weaker than human insulin in its binding to IGF-1R, suggesting that the C-terminal B-chain fragment is critical also for IGF-1R binding31. Mini-Ins therefore has the highest IR/IGF-1R binding ratio among all known insulin analogs30,32. Furthermore, we observed that mini-Ins induces similar signaling transduction via Akt and ERK1/2 to human insulin. Both insulin tolerance and hyperinsulinemic-euglycemic clamp studies demonstrate that mini-Ins has equal potency to insulin lispro.
In summary, our results indicate that an alternative binding mode to the insulin receptor (characterized by weaker primary binding site interaction and stronger secondary binding site interaction) is achieved by mini-Ins, a minimal human insulin analog inspired by a cone snail insulin-like peptide. Given its monomeric properties, mini-Ins represents a new platform for therapeutic development of prandial insulins.
METHODS
Production and purification of IR310.T and Fv 83–7
The two-domain L1-CR fragment of hIR (“IR310.T”) and the Fv module of mAb 83–7 were produced and purified as previously described12,17.
Deglycosylation of IR310.T in complex with Fv 83–7
IR310.T was combined with a 1.25-fold mole ratio of Fv 83–7 and incubated with endoglycosidase H (EH; NEB catalogue no. P0702) in G3 buffer (as recommended by NEB) for approximately 30 h at 37ºC at a ratio of 1 mg IR310.T to 10,000 U EH with each 1 mg protein deglycosylated in 0.3 ml batches28. Sample pH was immediately thereafter adjusted by addition of 1/20th volume of 3 M Tris-HCl, pH 8.5. Size-exclusion chromatography on a GE Superdex S200 column equilibrated with TBSA buffer (25 mM Tris-HCl, 137 mM NaCl, 2.7 mM KCl, pH 8.0 + 0.02 % sodium azide) was used to separate monomeric from aggregated IR310.T and to remove EH and excess Fv 83–7.
Crystal structure of the Con-Ins G1 – μIR – Fv 83–7 complex
Con-Ins G1 (inclusive of post-translational modifications) was synthesized as described previously2. The IR-A704−719 αCT peptide of the A isoform of hIR (IR-A) was synthesized by Genscript (USA). A mixture of (i) 1 part EndoH-treated IR310.T – Fv 83.7 complex at 3 mg mL−1 in 10 mM HEPES-NaOH buffer pH 7.5 plus 0.02 % sodium azide, (ii) 3 mole equivalent of 10 mg mL−1 αCT704−719 in 10 mM HCl at and (iii) Con-Ins G1 in 10 mM HCl at 3 mole equivalent was prepared and subjected to a 576-condition sparse matrix crystallization screen at the CSIRO C3 crystallization facility (Parkville, Australia) in sitting-drop format (1:1 well:protein drop volume ratio). Hit crystallization conditions detected included 1.8 to 2.0 M ammonium sulfate with no buffer or buffers 0.1 M Tris-HCl, pH 7.5; MOPS-NaOH pH 7.0 or MES-NaOH, pH 6.5. Single crystals of the complex were then optimized in Linbro 24-well hanging drop format in several conditions consisting of 1.8 to 2.0 M ammonium sulfate, no buffer or 0.1 M Tris-HCl, pH 7.5. Other buffers, e.g., MOPS-NaOH pH 7.0 and MES-NaOH, pH 6.5, were also used and all conditions produced similarly diffracting crystals. A single crystal grown in a solution of 1.7 M ammonium sulfate, 50 mM MOPS-NaOH pH 7.0 gave the best diffraction data set.
The single crystal of Con-Ins G1 in co-complex with the IR-A704−719 αCT peptide and the EH-treated IR310.T – Fv 83–7 complex was cryo-protected by transfer serially through solutions consisting of crystallization well solution plus 10 to 30 % glycerol and extracted with a cryo-loop. The loop was then plunged directly into a bath of liquid nitrogen. Diffraction data were collected at 100 K with an Eiger 16M detector at beamline MX2 (λ = 0.9536 Å) at the Australian Synchrotron (Melbourne, Australia)35. Data were integrated and merged using the XDS package36, with diffraction data being included to the limit at which the CC1/2 statistic remained significant at the P = 0.001 level of significance (see Table 1).
The structure was solved by molecular replacement using PHASER37, employing as a search model a single IR310.T – Fv 83–7 component of entry 4OGA13 in the Protein Data Bank. Two copies of the IR310.T – Fv 83–7 complex were located in the asymmetric unit. Electron density corresponding to two copies of Con-InsG1 (bound separately to the two respective domain L1 plus IR-A (residues 704–709) αCT peptide fragments of hIR) were then apparent in the resultant difference electron density map and these two copies were then built directly into the difference electron density. X-ray crystallographic refinement employed PHENIX38 iterated with interactive model building within COOT39. Final stages of refinement included TLS refinement40, restrained individual B-factor refinement and torsional NCS restraints. Final refinement statistics are presented in Table 1 and sample electron density in Extended Data Figure 1. The final model included the residues detailed in Supplementary Table 3. Ramachandran statistics (as reported by COOT) are favoured region 92.0 %, allowed region 6.7 %, outlier region 1.3 %.
Crystal structure of the human insulin – μIR – Fv 83–7 complex
Human insulin (Sigma-Aldrich) was re-purified by reversed-phase chromatography using two Resource RPC columns (GE Healthcare) and a gradient of 0.1 % trifluoroacetic acid (TFA) in 2 % acetonitrile (ACN) to 0.1 % TFA in 80 % ACN, monitored at 280 nm with an AKTA Basic; solvent was removed by freeze-drying. The quality of the re-purified hormone was confirmed by isothermal titration calorimetry against a three-domain L1-CR-L2 (“IR485”) construct of hIR25 in the presence of the IR-A (residues 704–709) αCT peptide (data not shown). The EH-treated IR310.T – Fv83–7 complex (4.5 mg mL−1 in 10 mM HEPES pH 7.5) was combined with 3 mole equivalents of the peptide αCT (residues 704–709) (Genscript; USA) and 1.8 mole equivalents of the re-purified human insulin. The protein mixture was then used to grow crystals in hanging-drop format over a well solution containing 16 % PEG 3350, 0.2 M sodium thiocyanate (a condition pre-determined in a larger, sparse matrix screen for a related complex at the CSIRO C3 crystallization facility, Parkville, Australia; detail not shown). Drop ratios were 1 μL protein : 1 μL well solution and the resultant crystals had a rod-shaped morphology, ~100 μm x 25 μm.
For cryo-protection, a single crystal was soaked in a progressive series of 0.3 μL drops containing 10 %, 20 % and 30 % glycerol in 18 % PEG 3350 plus 0.2 M sodium thiocyanate for ~10–20 s in each drop, followed by direct plunging in a loop into a liquid nitrogen bath. Diffraction data were collected at 100 K with an ADSC Q315R CCD detector at beam line MX2 (λ = 0.9537 Å) of the Australian Synchrotron (Melbourne, Australia). Data were integrated and merged using the XDS package36, with diffraction data being included to the limit at which the CC1/2 statistic remained significant at the P = 0.001 level of significance (see Table 1).
Structure solution was by molecular replacement using a single copy of the earlier structure of the human-insulin-bound Fab-83–7-bound μIR minus the constant domain module of the Fab as a search object within PHASER37. PHASER succeeded in progressively locating four copies of the search object within the crystallographic asymmetric unit, these being arranged with approximate 222 point group non-crystallographic symmetry (NCS). Refinement was initially undertaken with PHENIX38 and then finalized using autoBUSTER41. Refinements steps were iterated with interactive model building within COOT 39. The final stages of refinement included (i) partitioning of the structure into a total of twenty TLS groups40, (ii) automatic local structure similarity restraints across the four copies in the asymmetric unit, and (iii) local structure similarity restraints to the higher-resolution structures of (i) the domain L1-CR-L2 of hIR (PDB entry 2HR742, both chains), (ii) the light chain variable domains of mAb G3–519 and of the chimeric antibody X836 (PDB entries 1IL143 and 3MBX44, respectively), and (iii) the heavy chain variable domain of the Fab NMC4 (PDB entry 1FNS45). Restraints (ii) and (iii) were selected on the basis of sequence similarity with the respective chains of Fv 83–7. Final refinement statistics are presented in Table 1 and sample electron density in Extended Data Figure 1. The amino acid and N-linked sugar residues included in the final model are summarized in Supplementary Table 3. Ramachandran statistics (as reported by COOT) are favoured region 94.1 %, allowed region 4.2 %, outlier region 1.7 %. These latter statistics represent a significant improvement on those for the original structure (PDB entry 4OGA; Supplementary Table 1), namely 92.0 %, 4.6 % and 3.4 %, respectively.
Isothermal titration calorimetry (ITC)
ITC experiments were performed using a MicroCal iTC200 instrument (Malvern Instruments) with the cell held at 25ºC and analysis undertaken with the manufacturer’s software within Origin7 (version 7.0).
For the titration of DOI against IR485 plus IR-A (residues 704–709) αCT peptide, DOI was prepared at a concentration of 200 μM in 10 mM HCl plus TBSA, with IR485 being prepared separately in TBSA at a concentration of 15 μM in co-solution with 150 μM IR-A (residues 704–709) αCT peptide. The total number of injections in each titration was eleven at 180 s intervals, with the first injection being 1 μl and subsequent injections being 2.54 μl. Five technical replicates of the measurement were undertaken.
For the titration of mini-Ins against IR485 plus IR-A704−719 αCT peptide, mini-Ins was prepared at concentrations of (i) 150 μM, (ii) 120 μM, and (iii) 100 μM for respective injection into IR485 prepared separately in TBSA at a concentration of (i) 12 μM in co-solution with 120 μM IR-A (residues 704–709) αCT peptide, (ii) 10 μM in co-solution with 100 μM IR-A (residues 704–709) αCT peptide, and (iii) 10 μM in co-solution with 100 μM IR-A (residues 704–709) αCT peptide, effectively providing three replicates.
For the titration of Con-Ins G1 against IR485 plus IR-A (residues 704–709) αCT peptide, Con-InsG1 was prepared at concentrations of either 120 μM or 150 μM for injection into IR485 prepared separately in TBSA at a concentration of 8 μM in co-solution with respective 120 μM or 80 μM IR-A704−719 αCT peptide, with the latter injection protocol being repeated once to provide a total of three replicates.
For the titration of human insulin against IR485 plus IR-A (residues 704–709) αCT peptide, human insulin was prepared at a concentration of 80 μM for injection into IR485 prepared separately in TBSA at a concentration of 8 μM in co-solution with 80 μM IR-A704−719 αCT peptide, with the protocol being repeated twice to provide a total of three replicates.
For all experiments, IR-A (residues 704–709) αCT peptide was synthesized by Genscript (USA).
Crystal structure determination of Mini-Ins
Sample solution comprising 5 mg mL−1 of Fv 83–7-bound IR310.T in 10 mM HEPES-NaOH (pH 7.5) + 0.02 % NaN3 plus three mole equivalents of the IR-A αCT peptide (residues 704–709) plus 1.8 mole equivalents of mini-Ins was subjected to sparse-matrix sitting-drop 792-condition robotic crystallization screening at the CSIRO Collaborative Crystallisation Centre (Parkville, Australia). Crystals were obtained solely with well condition 0.3 M magnesium formate plus 0.1 M Tris-HCl (pH 8.5). Subsequent analysis of the volume of the asymmetric unit led to the conclusion that these crystals contained mini-Ins alone, with no crystals being obtained of the analog-bound Fv-83–7-bound μIR (see below).
A single crystal was cryo-cooled in a loop by direct plunging into liquid nitrogen. Diffraction data were collected at 100 K on beamline MX2 (λ = 0.9537 Å) at the Australian Synchrotron using an Eiger 16M detector and then processed with AIMLESS46, with diffraction data being included to the limit at which the CC1/2 statistic remained significant at the P = 0.001 level of significance as assessed with XDS36 (see Table 1).
Molecular replacement then proceeded with PHASER using as a search model an edited version of an alternative in-house DOI analog structure (data not shown), a total of three copies being located within the asymmetric unit. The resultant atomic model was refined using PHENIX iterated with manual model-building within COOT, inclusive of both TLS refinement and restrained individual isotropic B-factor refinement. Final refinement statistics are presented in Table 1 and sample electron density in Extended Data Figure 1. Ramachandran statistics (as reported by COOT) are favoured region 98 %, allowed region 2 %, outlier region 0 %.
Modelling of mini-Ins-bound hIR
Models of mini-Ins in complex with the primary, secondary and transient binding sites, hIR domain L1 (residues His1 to Cys159), the hIR αCT segment (residues Asp689 to Pro718 of the IR-A isoform), and the first fibronectin type-3 domain (FnIII-1’, residues Glu471 to Asp591), were created independently with MODELLER (v9.19)47, using as templates the crystal structure of mini-Ins (reported here) and the cryoEM structure of the hIR ectodomain in complex with human insulin (PDB 6HN4 and 6PXV)4,28. Where applicable, models included a single N-linked N-acetyl-D-glucosamine residue at each of the hIR residues Asn16, Asn25, Asn111 and Asn51448. The models with the three lowest MODELLER objective function were used to seed three replicate MD simulations.
Independent sets of molecular dynamics (MD) simulations were conducted as previously described28, these being of (i) mini-Ins in complex with the elements forming the primary binding site of hIR, (ii) mini-Ins in co-complex with the elements forming both the primary and secondary binding sites of hIR, and (iii) both mini-Ins and human insulin in complex with the transient binding sites of hIR, allowing for additional equilibration for each simulation in (ii) and (iii). Simulations using GROMACS (v2016.3)49 with a modified version of the CHARMM36 force field50,51 were used with the models of mini-Ins in complex with the primary and secondary binding sites of the hIR obtained from comparative modelling (above). The protein complex was solvated in a cubic box of TIP3P water extending 10 Å beyond all atoms. Ionizable residues were protonated in their standard state at pH 7, except mini-Ins HisA8, which was modelled in its positively charged form. Sodium and chloride ions were included to neutralize the system and attain an ionic strength of 0.1 M.
Temperature coupling was achieved using velocity rescaling applying a coupling time of 0.1 ps with protein and water/ions coupled separately at 300 K, and Parrinello-Rahman pressure coupling with a coupling time of 2.0 ps. All simulations were performed with a single non-bonded cut-off of 12 Å. The Verlet neighbor searching cut-off scheme was applied with a neighbor-list update frequency of 25 steps (50 fs); the time step used in all the simulations was 2 fs. Periodic boundary conditions were applied with the particle-mesh Ewald method to account for long-range electrostatics. All bond lengths were constrained with the P-LINCS algorithm52.
Simulations were first energy minimized for a maximum of 50,000 steps using the steepest descent minimization prior to equilibration that was conducted in both the NVT and NPT ensembles. All protein atoms were positionally restrained for 100 ps sequentially in both ensembles prior to the system being allowed to progress unrestrained for 200 ns. During the 200 ns production MD simulations of mini-Ins in complex with primary and secondary binding sites, without positional restraints, a harmonic centre-of-mass umbrella potential was applied to the backbone atoms of domains L1 and FnIII-1’ with a force constant of 2000 kJ mol−1 nm−2 to mimic the restriction in space that would occur due to the presence of the remainder of the hIR ectodomain. Simulations of mini-Ins and human insulin in complex with secondary site were continued absent any restraints.
Buried molecular surface calculation
Buried solvent-accessible surface areas were calculated using CHIMERA34.
Competition receptor binding assay
Competition binding assays were performed with solubilized immunocaptured hIR (isoform B) or IGF-1R with europium-labeled human insulin or IGF-I and increasing concentrations of human insulin or analogs, as previously described53. Time-resolved fluorescence was measured with 340-nm excitation and 612-nm emission filters with a Polarstar Fluorimeter (BMG Labtech). Mean IC50 values were calculated with the statistical software package Prism v7.01 (GraphPad Software) after curve fitting with nonlinear regression (one-site) analysis. At least three assays were performed, each comprising three technical replicates per data point.
Insulin receptor activation assay
To determine the extent of insulin signaling induced by chicken insulin compared to human insulin, pAkt Ser473 levels were measured in a mouse fibroblast cell line, NIH 3T3, overexpressing human receptor isoform B (IR-B). The cell line was cultured in DMEM (Sigma Aldrich) with 10 % fetal bovine serum (Gibco), 100 U/mL penicillin-streptomycin (Thermo Fisher Scientific) and 2 mg mL−1 puromycin (Thermo Fisher Scientific). For each assay, 40,000 cells per well and 100 μl per well, were plated in a 96-well plates with culture media containing 1 % FBS. 20 h later, 50 μl of chicken insulin or human insulin was pipetted into each well after the removal of the original media. After a 30-min treatment, the insulin solution was removed and the HTRF pAkt Ser473 kit (Cisbio, Massachusetts, USA) was used to measure the intracellular level of pAkt Ser473. Briefly, the cells were first treated with cell lysis buffer (50 μl per well) for 1 h under mild shaking. 16 μL of cell lysate was then added to 4 μL of detecting reagent in a white 384-well plate. After 4 h incubation, the plate was read in a Synergy Neo plate reader (BioTek, Vermont, USA) and the data processed according to the manufacturer’s protocol.
Western immunoblots
Activation of the hIR was assessed by immunoblotting as previously described54. L6 myoblasts overexpressing IR-A were stimulated with 10 nM insulin or mini-Ins for different times. Cell lysates were subjected to reducing 10 % SDS-PAGE, transferred to nitrocellulose and immunoblotted with the PathScan® Multiplex Western Cocktail I (Cell Signaling Technology #5301) against pAkt (Ser473), pERK1/2 (Thr202, Tyr204) and mouse anti-β-tubulin (Invitrogen #32–2600). Total Akt and ERK1/2 levels do not change over the time course measured (not shown). The β-tubulin was used as a loading control and pAkt and pERK1/2 were normalized against this control. Quantification of the blots was achieved using the Image Studio Lite quantification software. Activation was expressed as a percentage of the response to insulin at 10 min.
Insulin tolerance test (ITT)
Insulin tolerance tests (ITT) was performed in 3–4 h fasted Sprague-Dawley rats (age: 12 weeks). Following baseline blood glucose measurements, rats were injected with either lispro (0.014 mg kg−1) or mini-Ins (0.014 mg kg−1) intraperitoneally. Tail vein samples were obtained to assess blood glucose levels every 15 min over 150 min using a glucometer (Ascensia Contour BG monitors, Bayer HealthCare, IN). Animal protocols were approved by local IACUC committee.
Vascular surgery in rats
Rat was anesthetized with an intraperitoneal injection of ketamine/xylazine (75 mg kg−1 ketamine with 5 mg kg−1 xylazine) and an incision was made on the midline of ventral side of neck after shave to implant vascular catheters under aseptic conditions. A micro-renathane catheter (MRE 025, Braintree Scientific Inc., Braintree, MA) was inserted into the right jugular vein and another catheter (MRE 033) was implanted into the left carotid artery. To maintain patency, all catheters were filled with a 40 % polyvinylpyrrolidone (Sigma, MO) in heparin (1,000 U mL−1; USP) and tunneled subcutaneously to place at the back of the neck. The animals were then allowed to recover in their home cages before being placed to the animal facility.
Euglycemic clamp
One week after vascular surgery, rats were fasted 3–4 h and the arterial and venous catheters were exteriorized under isoflurane anesthesia and extended via connector for blood sampling and to attach to the infusion pumps, respectively. After 90 min resting period, the basal glucose levels were measured from arterial blood samples obtained from awake, unrestrained rats using glucometer (Ascensia Contour BG monitors, Bayer HealthCare, IN). Following baseline blood glucose measurement, rats were subjected to constant intravenous infusion of either insulin lispro or mini-Ins (0.35 μg kg−1 min−1 at the rate of 4 μl min−1) to evaluate the insulins action. Blood glucose was measured at 10 min intervals throughout the clamp and a constant variable intravenous infusion of dextrose (40 % w/v) was used to maintain euglycemia (90–110 mg dL−1) for 2 h.
Evaluation of antibody response in mice
C57 BL/6 mice, 12 weeks of age, 4 per group, were immunized i.p. with 50 μg of beef insulin, human insulin or mini-Ins in complete Freund’s adjuvant, respectively. On day 21 post-immunization, sera were collected and total IgG specific against the immunogens measured by a europium-based ELISA assay. Animal protocols were approved by local IACUC committee.
Statistical information
The results are represented as mean ± standard error of the mean (s.e.m.). Data were analyzed by Student’s (unpaired) t test. Repeated measures ANOVA (two-way) was performed to analyze the data for glucose clamps and ITT. Post-hoc analyses were performed by Tukey’s multiple comparison tests. GraphPad Prism uses an analysis of covariance (ANCOVA) to determine statistical significance between slopes.
Extended Data
Extended Data Fig. 1: Stereo views of sample (2mFobs-DFcalc) electron density for the structures presented in the manuscript.
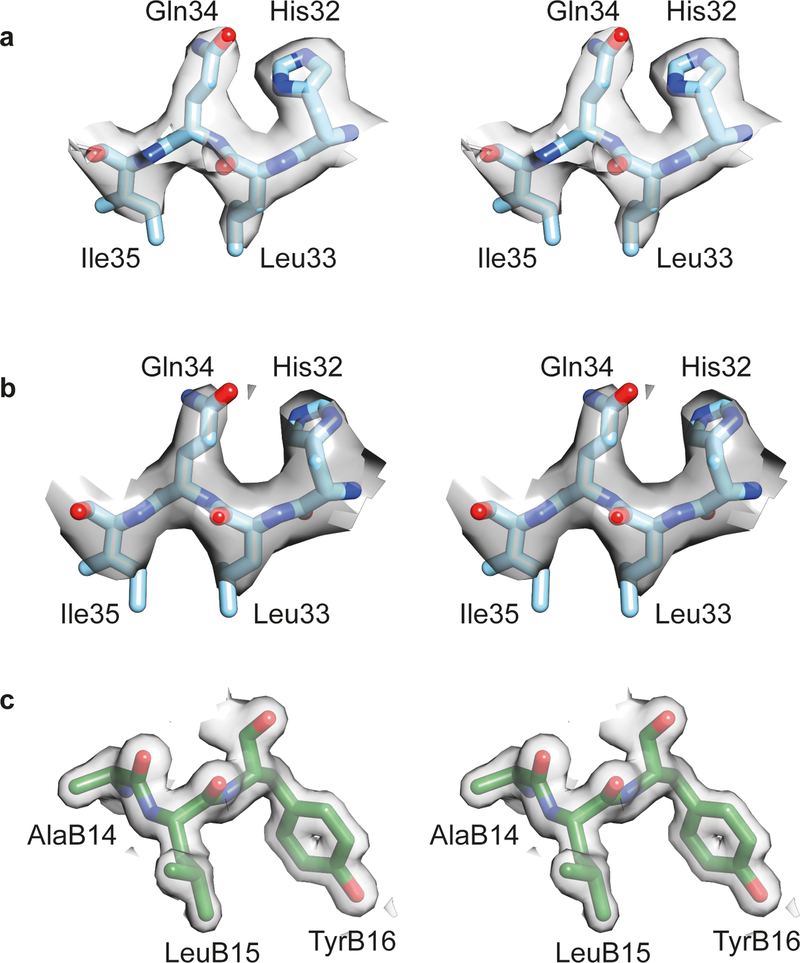
(a) L1 domain residues 32–35 within monomer 1 of the Con-Ins-G1-bound μIR + Fv 83–7 crystal structure. (b) L1 domain residues 32–35 within monomer 1 of the human-insulin- bound μIR + Fv 83–7 crystal structure. (c) B-chain residues 14–16 within monomer 1 of the mini-Ins crystal structure. All maps are contoured at the 1.0 σ level.
Extended Data Fig. 2: Sedimentation equilibrium analysis of mini-Ins.
Sedimentation equilibrium analysis of mini-Ins was performed at 35,000 rpm with the best fit (curves) to a single species of apparent mass 5080 ± 45 Da. The molecular weight of mini-Ins is 5067. Detailed procedure can be found in reference: Menting et al. (2016). A minimized human insulin-receptor-binding motif revealed in a Conus geographus venom insulin. Nature Structural & Molecular Biology, 23(10), 916. Source data are available with the paper online.
Extended Data Fig. 3: Antibody response of 21-day immunization of bovine insulin, human insulin and mini-Ins.
Data is the average of 4 independent animals. Error bar represents S.E.M. Source data are available with the paper online.
Extended Data Fig. 4: Isothermal titration calorimetry.
Representative ITC thermograms for the titration against IR485 + IR-A704−719 αCT peptide of (a) mini-Ins; (b) hIns; (c) Con-Ins G1and (d) human DOI.
Extended Data Fig. 5: Separation of insulin and IR amino acid pairs at the secondary binding site during 1 ns MD simulation.
(a) Distance between GluB10 carboxylate carbon (Cδ) and Arg539 guanyl carbon (Cζ). This salt pair remain closely associated (~4 Å) throughout the simulation. (b) Distance between HisA8 imidazole Nε2 nitrogen and Asp574 carboxylate carbon. (c) Distance between ArgA9 guanyl carbon and Glu575 carboxylate carbon (Cγ): this salt bridge forms (separation ~4 Å) following ~6ns MD. The salt bridge is observed to dissociate and reform several times throughout the simulation. Dissociation of this interaction correlates with increase in separation of the HisA8-Asp574 pair, reflecting mobility in the Phe572-to-Tyr579 loop of the FnIII-1.
Supplementary Material
Acknowledgments:
X.X. is a JDRF Postdoctoral Fellow. N.A.S. acknowledges receipt of Australian Research Training Scholarship. R.S.N acknowledges fellowship support from the Australian National Health and Medical Research Council. Part of this work was undertaken using resources from the National Computational Infrastructure, which is supported by the Australian Government and provided through Intersect Australia Ltd., and through the HPC-GPGPU Facility, which was established with the assistance of LIEF Grant LE170100200. We thank the CSIRO Protein Production Facility for the production under contract of cIR485, the precursor of IR310.T. Crystallization screening undertaken at the CSIRO Collaborative Crystallisation Centre (www.csiro.au/C3), Melbourne, Australia. This research was undertaken in part using the MX2 beamline at the Australian Synchrotron, part of ANSTO, and made use of the ACRF detector. We thank Ms Mai Margetts for production of the heavy and light chain fragments of Fv 83–7. This work is supported by NIDDK (DK120430, GM125001 to D.H.C.), JDRF (5-CDA-2018-572-A-N to D.H.C. and 1-INO-2017-441-A-N to H.S.H.), the Australian National Health and Medical Research Council (NHMRC) Project Grants APP1143546 (to M.C.L, R.S.N., B.J.S, B.E.F & D.H.C) and APP1099595 (to M.C.L.). M.C.L.’s research is also made possible at WEHI through Victorian State Government Operational Infrastructure Support and the Australian NHMRC Independent Research Institutes Infrastructure Support Scheme.
Competing interests statement: M.C.L.’s laboratory has a funded Agreement with Eli Lilly and Company (USA) to conduct research not connected to this publication. Patents associated with part of this work were licensed to Monolog LLC, which aims to develop new fast-acting insulin analogs.
Footnotes
Reporting Summary
Further information on experimental design is available in the Nature Research Reporting Summary linked to this article.
Data availability statement: Coordinates and structures factors for the structures presented here have been deposited in the Protein Data Bank as follows: Cons-Ins-G1-bound Fv-83-7-bound μIR: PDB entry 6VEQ; human-insulin bound Fv-83-7-bound μIR: PDB entry 6VEP; mini-Ins: PDB entry 6VET. Supplementary Methods and Source Data for Figures 4a,b,d; 5b–d; 6, 7a–b and Extended Data Figures 2–3 are available with the paper online.
Reference
- 1.Safavi-Hemami H et al. Specialized insulin is used for chemical warfare by fish-hunting cone snails. Proc. Natl. Acad. Sci. U. S. A 112, 1743–1748 (2015). [DOI] [PMC free article] [PubMed] [Google Scholar]
- 2.Menting JG et al. A minimized human insulin-receptor-binding motif revealed in a Conus geographus venom insulin. Nat. Struct. Mol. Biol 23, 916–920 (2016). [DOI] [PubMed] [Google Scholar]
- 3.Carpenter FH Relationship of structure to biological activity of insulin as revealed by degradative studies. Am. J. Med 40, 750–758 (1966). [DOI] [PubMed] [Google Scholar]
- 4.Gradel AKJ et al. Factors Affecting the Absorption of Subcutaneously Administered Insulin: Effect on Variability. J. Diabetes Res 2018, 1205121 (2018). [DOI] [PMC free article] [PubMed] [Google Scholar]
- 5.Maikawa CL et al. Stable Monomeric Insulin Formulations Enabled by Supramolecular PEGylation of Insulin Analogues. Adv. Ther. (Weinh) 3(2020). [DOI] [PMC free article] [PubMed] [Google Scholar]
- 6.Kang S, Brange J, Burch A, Volund A& Owens DR Subcutaneous insulin absorption explained by insulin’s physicochemical properties. Evidence from absorption studies of soluble human insulin and insulin analogues in humans. Diabetes Care 14, 942–948 (1991). [DOI] [PubMed] [Google Scholar]
- 7.Kristensen C, Andersen AS, Østergaard S, Hansen PH& Brandt J Functional reconstitution of insulin receptor binding site from non-binding receptor fragments. J. Biol. Chem 277, 18340–18345 (2002). [DOI] [PubMed] [Google Scholar]
- 8.Uchikawa E, Choi E, Shang G, Yu H& Bai X -c. Activation mechanism of the insulin receptor revealed by cryo-EM structure of the fully liganded receptor-ligand complex. eLife 8, e48630 (2019). [DOI] [PMC free article] [PubMed] [Google Scholar]
- 9.Scapin G et al. Structure of the insulin receptor–insulin complex by single-particle cryo-EM analysis. Nature 556, 122–125 (2018). [DOI] [PMC free article] [PubMed] [Google Scholar]
- 10.Weis F et al. The signalling conformation of the insulin receptor ectodomain. Nat. Commun 9, 4420 (2018). [DOI] [PMC free article] [PubMed] [Google Scholar]
- 11.Gutmann T et al. Cryo-EM structure of the complete and ligand-saturated insulin receptor ectodomain. J. Cell Biol 219, e201907210 (2020). [DOI] [PMC free article] [PubMed] [Google Scholar]
- 12.Menting JG et al. How insulin engages its primary binding site on the insulin receptor. Nature 493, 241–245 (2013). [DOI] [PMC free article] [PubMed] [Google Scholar]
- 13.Menting JG et al. Protective hinge in insulin opens to enable its receptor engagement. Proc. Natl. Acad. Sci. U. S. A 111, E3395–E3404 (2014). [DOI] [PMC free article] [PubMed] [Google Scholar]
- 14.Gutmann T et al. Cryo-EM structure of the complete and ligand-saturated insulin receptor ectodomain. bioRxiv, 679233 (2019). [DOI] [PMC free article] [PubMed] [Google Scholar]
- 15.Whittaker J, Sørensen H, Gadsbøll VL& Hinrichsen J Comparison of the functional insulin binding epitopes of the A and B isoforms of the insulin receptor. J. Biol. Chem 277, 47380–47384 (2002). [DOI] [PubMed] [Google Scholar]
- 16.Kiselyov VV, Versteyhe S, Gauguin L& De Meyts P Harmonic oscillator model of the insulin and IGF1 receptors’ allosteric binding and activation. Mol. Sys. Biol 5, 243 (2009). [DOI] [PMC free article] [PubMed] [Google Scholar]
- 17.Lawrence CF et al. Insulin Mimetic Peptide Disrupts the Primary Binding Site of the Insulin Receptor. J. Biol. Chem 291, 15473–15481 (2016). [DOI] [PMC free article] [PubMed] [Google Scholar]
- 18.Nakagawa SH& Tager HS Role of the phenylalanine B25 side chain in directing insulin interaction with its receptor. Steric and conformational effects. J. Biol. Chem 261, 7332–7341 (1986). [PubMed] [Google Scholar]
- 19.Pandyarajan V et al. Aromatic anchor at an invariant hormone-receptor interface: function of insulin residue B24 with application to protein design. J. Biol. Chem 289, 34709–34727 (2014). [DOI] [PMC free article] [PubMed] [Google Scholar]
- 20.Kikuchi K et al. Studies on the biological activity of degraded insulins and insulin fragments. J. Biol. Chem 255, 9281–9288 (1980). [PubMed] [Google Scholar]
- 21.Schwartz GP, Burke GT& Katsoyannis PG A superactive insulin: [B10-aspartic acid]insulin(human). Proc. Natl. Acad. Sci. U.S.A 84, 6408–6411 (1987). [DOI] [PMC free article] [PubMed] [Google Scholar]
- 22.Kaarsholm NC et al. Engineering stability of the insulin monomer fold with application to structure-activity relationships. Biochemistry 32, 10773–10778 (1993). [DOI] [PubMed] [Google Scholar]
- 23.Kristensen C et al. Alanine scanning mutagenesis of insulin. J. Biol. Chem 272, 12978–12983 (1997). [DOI] [PubMed] [Google Scholar]
- 24.Thayer WP, Kraft JR, Tompkins SM, Moore J.C.t.& Jensen PE Assessment of the role of determinant selection in genetic control of the immune response to insulin in H-2b mice. J. Immunol 163, 2549–2554 (1999). [PubMed] [Google Scholar]
- 25.Menting JG, Ward CW, Margetts MB& Lawrence MC A Thermodynamic Study of Ligand Binding to the First Three Domains of the Human Insulin Receptor: Relationship between the Receptor α-Chain C-Terminal Peptide and the Site 1 Insulin Mimetic Peptides. Biochemistry 48, 5492–5500 (2009). [DOI] [PubMed] [Google Scholar]
- 26.Schäffer L A model for insulin binding to the insulin receptor. Eur. J. Biochem 221, 1127–1132 (1994). [DOI] [PubMed] [Google Scholar]
- 27.Smith GD, Pangborn WA& Blessing RH The structure of T6 human insulin at 1.0 Å resolution. Acta Crystallogr. D Biol. Crystallogr 59, 474–482 (2003). [DOI] [PubMed] [Google Scholar]
- 28.Ahorukomeye P et al. Fish-hunting cone snail venoms are a rich source of minimized ligands of the vertebrate insulin receptor. Elife 8(2019). [DOI] [PMC free article] [PubMed] [Google Scholar]
- 29.De Meyts P Insulin/receptor binding: The last piece of the puzzle?: What recent progress on the structure of the insulin/ receptor complex tells us (or not) about negative cooperativity and activation. Bioessays 37, 389–397 (2015). [DOI] [PubMed] [Google Scholar]
- 30.Glendorf T et al. Systematic evaluation of the metabolic to mitogenic potency ratio for B10-substituted insulin analogues. PLoS One 7, e29198 (2012). [DOI] [PMC free article] [PubMed] [Google Scholar]
- 31.Cara JF, Mirmira RG, Nakagawa SH& Tager HS An insulin-like growth factor I/insulin hybrid exhibiting high potency for interaction with the type I insulin-like growth factor and insulin receptors of placental plasma membranes. J. Biol. Chem 265, 17820–17825 (1990). [PubMed] [Google Scholar]
- 32.Kurtzhals P et al. Correlations of receptor binding and metabolic and mitogenic potencies of insulin analogs designed for clinical use. Diabetes 49, 999–1005 (2000). [DOI] [PubMed] [Google Scholar]
- 33.Laskowski RA SURFNET: a program for visualizing molecular surfaces, cavities, and intermolecular interactions. J. Mol. Graph 13, 323–330, 307–328 (1995). [DOI] [PubMed] [Google Scholar]
- 34.Pettersen EF et al. UCSF Chimera—a visualization system for exploratory research and analysis. J. Comput. Chem 25, 1605–1612 (2004). [DOI] [PubMed] [Google Scholar]
- 35.Aragão D et al. MX2: a high-flux undulator microfocus beamline serving both the chemical and macromolecular crystallography communities at the Australian Synchrotron. J. Synchrotron Radiat 25, 885–891 (2018). [DOI] [PMC free article] [PubMed] [Google Scholar]
- 36.Kabsch W Integration, scaling, space-group assignment and post-refinement. Acta. Crystallogr. D. Biol. Crystallogr 66, 133–144 (2010). [DOI] [PMC free article] [PubMed] [Google Scholar]
- 37.McCoy AJ et al. Phaser crystallographic software. J. Appl. Crystallogr 40, 658–674 (2007). [DOI] [PMC free article] [PubMed] [Google Scholar]
- 38.Adams PD et al. PHENIX: a comprehensive Python-based system for macromolecular structure solution. Acta. Crystallogr. D Biol. Crystallogr 66, 213–221 (2010). [DOI] [PMC free article] [PubMed] [Google Scholar]
- 39.Emsley P& Cowtan K Coot: model-building tools for molecular graphics. Acta Crystallogr. D. Biol. Crystallogr 60, 2126–2132 (2004). [DOI] [PubMed] [Google Scholar]
- 40.Winn MD, Isupov MN& Murshudov GN Use of TLS parameters to model anisotropic displacements in macromolecular refinement. Acta Crystallogr. D Biol. Crystallogr 57, 122–133 (2001). [DOI] [PubMed] [Google Scholar]
- 41.Bricogne G et al. BUSTER version 2.10, Cambridge, United Kingdom: Global Phasing Ltd; (2011). [Google Scholar]
- 42.McKern NM et al. Structure of the insulin receptor ectodomain reveals a folded-over conformation. Nature 443, 218–221 (2006). [DOI] [PubMed] [Google Scholar]
- 43.Berry MB et al. Structure of an anti-HIV monoclonal Fab antibody fragment specific to a gp120 C-4 region peptide. Proteins 45, 281–282 (2001). [DOI] [PubMed] [Google Scholar]
- 44.Teplyakov A et al. On the domain pairing in chimeric antibodies. Mol. Immunol 47, 2422–2426 (2010). [DOI] [PubMed] [Google Scholar]
- 45.Celikel R, Ruggeri ZM& Varughese KI von Willebrand factor conformation and adhesive function is modulated by an internalized water molecule. Nat. Struct. Biol 7, 881–884 (2000). [DOI] [PubMed] [Google Scholar]
- 46.Evans PR& Murshudov GN How good are my data and what is the resolution? Acta Crystallogr. D Biol. Chem 69, 1204–1214 (2013). [DOI] [PMC free article] [PubMed] [Google Scholar]
- 47.Webb B& Sali A Comparative Protein Structure Modeling Using MODELLER. Curr. Protoc. Bioinformatics 47, 5.6.1–5.6.32 (2014). [DOI] [PubMed] [Google Scholar]
- 48.Sparrow LG et al. N-linked glycans of the human insulin receptor and their distribution over the crystal structure. Proteins: Struct. Funct. Bioinform 71, 426–439 (2008). [DOI] [PubMed] [Google Scholar]
- 49.Abraham MJ et al. GROMACS: High performance molecular simulations through multi-level parallelism from laptops to supercomputers. SoftwareX 1–2, 19–25 (2015). [Google Scholar]
- 50.Guvench O et al. CHARMM additive all-atom force field for carbohydrate derivatives and its utility in polysaccharide and carbohydrate-protein modeling. J. Chem. Theory Comput 7, 3162–3180 (2011). [DOI] [PMC free article] [PubMed] [Google Scholar]
- 51.Best RB et al. Optimization of the additive CHARMM all-atom protein force field targeting improved sampling of the backbone ϕ, ψ and side-chain χ1 and χ2 dihedral angles. J. Chem. Theory Comput 8, 3257–3273 (2012). [DOI] [PMC free article] [PubMed] [Google Scholar]
- 52.Hess B P-LINCS: A Parallel Linear Constraint Solver for Molecular Simulation. J. Chem. Theory Comput 4, 116–122 (2008). [DOI] [PubMed] [Google Scholar]
- 53.Denley A et al. Structural determinants for high-affinity binding of insulin-like growth factor II to insulin receptor (IR)-A, the exon 11 minus isoform of the IR. Mol. Endocrinol 18, 2502–2512 (2004). [DOI] [PubMed] [Google Scholar]
- 54.Rajapaksha H& Forbes BE Ligand-Binding Affinity at the Insulin Receptor Isoform-A and Subsequent IR-A Tyrosine Phosphorylation Kinetics are Important Determinants of Mitogenic Biological Outcomes. Front. Endocrinol. (Lausanne) 6, 107 (2015). [DOI] [PMC free article] [PubMed] [Google Scholar]
Associated Data
This section collects any data citations, data availability statements, or supplementary materials included in this article.


