

Abstract
Objective:
Rett syndrome (RTT) is a neurodevelopmental disorder caused by mutation of the X-linked MECP2 gene and characterized by developmental regression during the first few years of life. The objective of this study was to investigate if the visual evoked potential (VEP) could be used as an unbiased, quantitative biomarker to monitor brain function in RTT.
Methods:
We recorded pattern-reversal VEPs in Mecp2 heterozygous female mice and 34 girls with RTT. The amplitudes and latencies of VEP waveform components were quantified, and were related to disease stage, clinical severity, and MECP2 mutation type in patients. Visual acuity was also assessed in both mice and patients by modulating the spatial frequency of the stimuli.
Results:
Mecp2 heterozygous female mice and RTT patients exhibited a similar decrease in VEP amplitude that was most striking in the later stages of the disorder. RTT patients also displayed a slower recovery from the principal peak of the VEP response that was impacted by MECP2 mutation type. When the spatial frequency of the stimulus was increased, both patients and mice displayed a deficit in discriminating smaller patterns, indicating lower visual spatial acuity in RTT.
Interpretation:
VEP is a method that can be used to assess brain function across species and in children with severe disabilities like RTT. Our findings support the introduction of standardized VEP analysis in clinical and research settings to probe the neurobiological mechanism underlying functional impairment and to longitudinally monitor progression of the disorder and response to treatment.
Rett syndrome (RTT) is a debilitating neurodevelopmental disorder that afflicts approximately 1 in 10,000 women and children worldwide and is caused by de novo mutation of the X-linked MECP2 gene.1 MECP2 encodes a multifunctional chromatin protein that regulates gene expression by either repressing or activating transcription, or by functioning at a post-transcriptional level.2 It sculpts and maintains a proper balance of excitatory and inhibitory neuronal circuits.3 After an apparently normal early postnatal period, girls with RTT undergo regression, losing expressive language and purposeful hand use and developing gait abnormalities and hand stereotypies over the course of weeks, months, or years.4,5 The regression is accompanied by the onset of epilepsy and intellectual disabilities, reflecting excitatory–inhibitory imbalance within specific brain microcircuits.6,7 Although there are established diagnostic criteria and genetic testing, there remains a pressing need for biomarkers to noninvasively and quantitatively monitor brain function throughout progression of the disorder and in response to treatment.
Our understanding of how MECP2 disruption impairs synapse and circuit function in the brain has been recently advanced by studies in genetic mouse models of RTT using the well-characterized visual system.7 Visual evoked potential (VEP) recordings in response to alternating gratings of high contrast revealed loss of visual acuity in adult Mecp2-null male mice with the onset of RTT-like symptoms, strongly suggesting that vision may serve as a biomarker of declining cortical function.8 However, it remains largely unexplored whether RTT patients exhibit equivalent visual processing impairments and whether the VEP can track progression of the disorder.
The transient pattern-reversal VEP (henceforth referred to as simply “VEP”) reflects the summation of excitatory and inhibitory postsynaptic activity of visual cortical neurons.9 In humans, VEPs can be measured rapidly and noninvasively from the scalp by extracting and averaging evoked signals from electroencephalographic (EEG) activity recorded during a passive fixation task. The VEP is a well-conserved waveform and unlike many other evoked potentials, it is fully mature by the end of the first year of life, allowing for longitudinal studies throughout development in children.10 In addition, although motor function is severely compromised in RTT, directed eye gaze is well preserved and often used for socialization and communication.11,12 These features make the VEP an ideal translational tool for evaluating cortical function in children with RTT. Previous studies measured VEPs in individuals with RTT, but these studies predated genetic testing and the revised diagnostic criteria,13 and were limited by varied stimuli (mostly simple unpatterned flash), small sample sizes, and broad age ranges.14–17 These factors may have contributed to the inconsistency and inconclusiveness of the results.
Here, we used the VEP method to directly compare how cortical function deviated from typical development in Mecp2 heterozygous (Het) female mice and girls with MECP2 mutations and a RTT diagnosis. We chose a standard stimulus to optimally drive the visual system of each species, analyzed the components of the elicited waveform, and then modulated the spatial frequency of this stimulus to test the limits of the visual system and evaluate spatial acuity.
Materials and Methods
All mouse procedures were carried out in accordance with protocols approved by the Institutional Animal Care and Use Committee at Boston Children’s Hospital (BCH) and conducted in accordance with the US Public Health Service’s Policy on the Humane Care and Use of Laboratory Animals. All human procedures were reviewed and approved by the BCH Office of Clinical Investigation and the institutional review board, and written informed consent was obtained from each participant or her guardian prior to testing.
Mouse Model
Mecp2 Het female mice were crossed with C57BL/6 male mice to generate Mecp2 wild-type (WT) and Het female littermates (B6.129P2-Mecp2 tm1.1Bird/J).18 Immediately preceding the VEP, mice were removed from their home cages and placed on a metal laminar flow hood for observation. A blind observer assigned each mouse a phenotypic score from 0 to 12 based on mobility, gait, hindlimb clasping, tremor, breathing, and general condition, as described previously.19 To represent a range of phenotypic scores within the Mecp2 Het group, mice were recorded at different ages (5–64 weeks). A total of 14 Mecp2 WT females of matching age range were used as controls.
Mouse VEPs
VEPs were recorded from anesthetized mice (50mg/kg pentobarbital sodium [Nembutal] and 0.12mg chlorprothixene) using standard techniques described previously.8 The contralateral eye of the mouse was presented with horizontal black and white sinusoidal bars that alternated contrast (100%) at 2Hz. A tungsten electrode was inserted into the binocular visual cortex at 2.8mm from the midline where the visual receptive field was approximately 208 from the vertical meridian. VEPs were recorded by filtering the signal from 0.1 to 100Hz and amplifying 10,000 times. VEPs were measured at the cortical depth where the largest amplitude signal was obtained in response to a 0.05 cycles per degree (cpd) stimulus (400–600μm). For each different spatial frequency (SF), 3 to 4 repetitions of 20 trials each were averaged in synchrony with the abrupt contrast reversal. The signal was baseline corrected to the mean voltage of the first 50 milliseconds after stimulus onset. VEP amplitude was calculated by finding the minimum voltage (negative peak) within a 50- to 150-millisecond time window after stimulus onset. For acuity measurements, VEP amplitude was plotted against the log of the SF, and the threshold of visual acuity was determined by linear extrapolation to 0μV. Whereas 16 Mecp2 Het mice were included in the VEP waveform analysis (Fig 1A–D), 15 were included in the acuity analysis (see Fig 1E, F), because only responses to 0.05cpd stimuli were recorded in 1 mouse.
FIGURE 1:
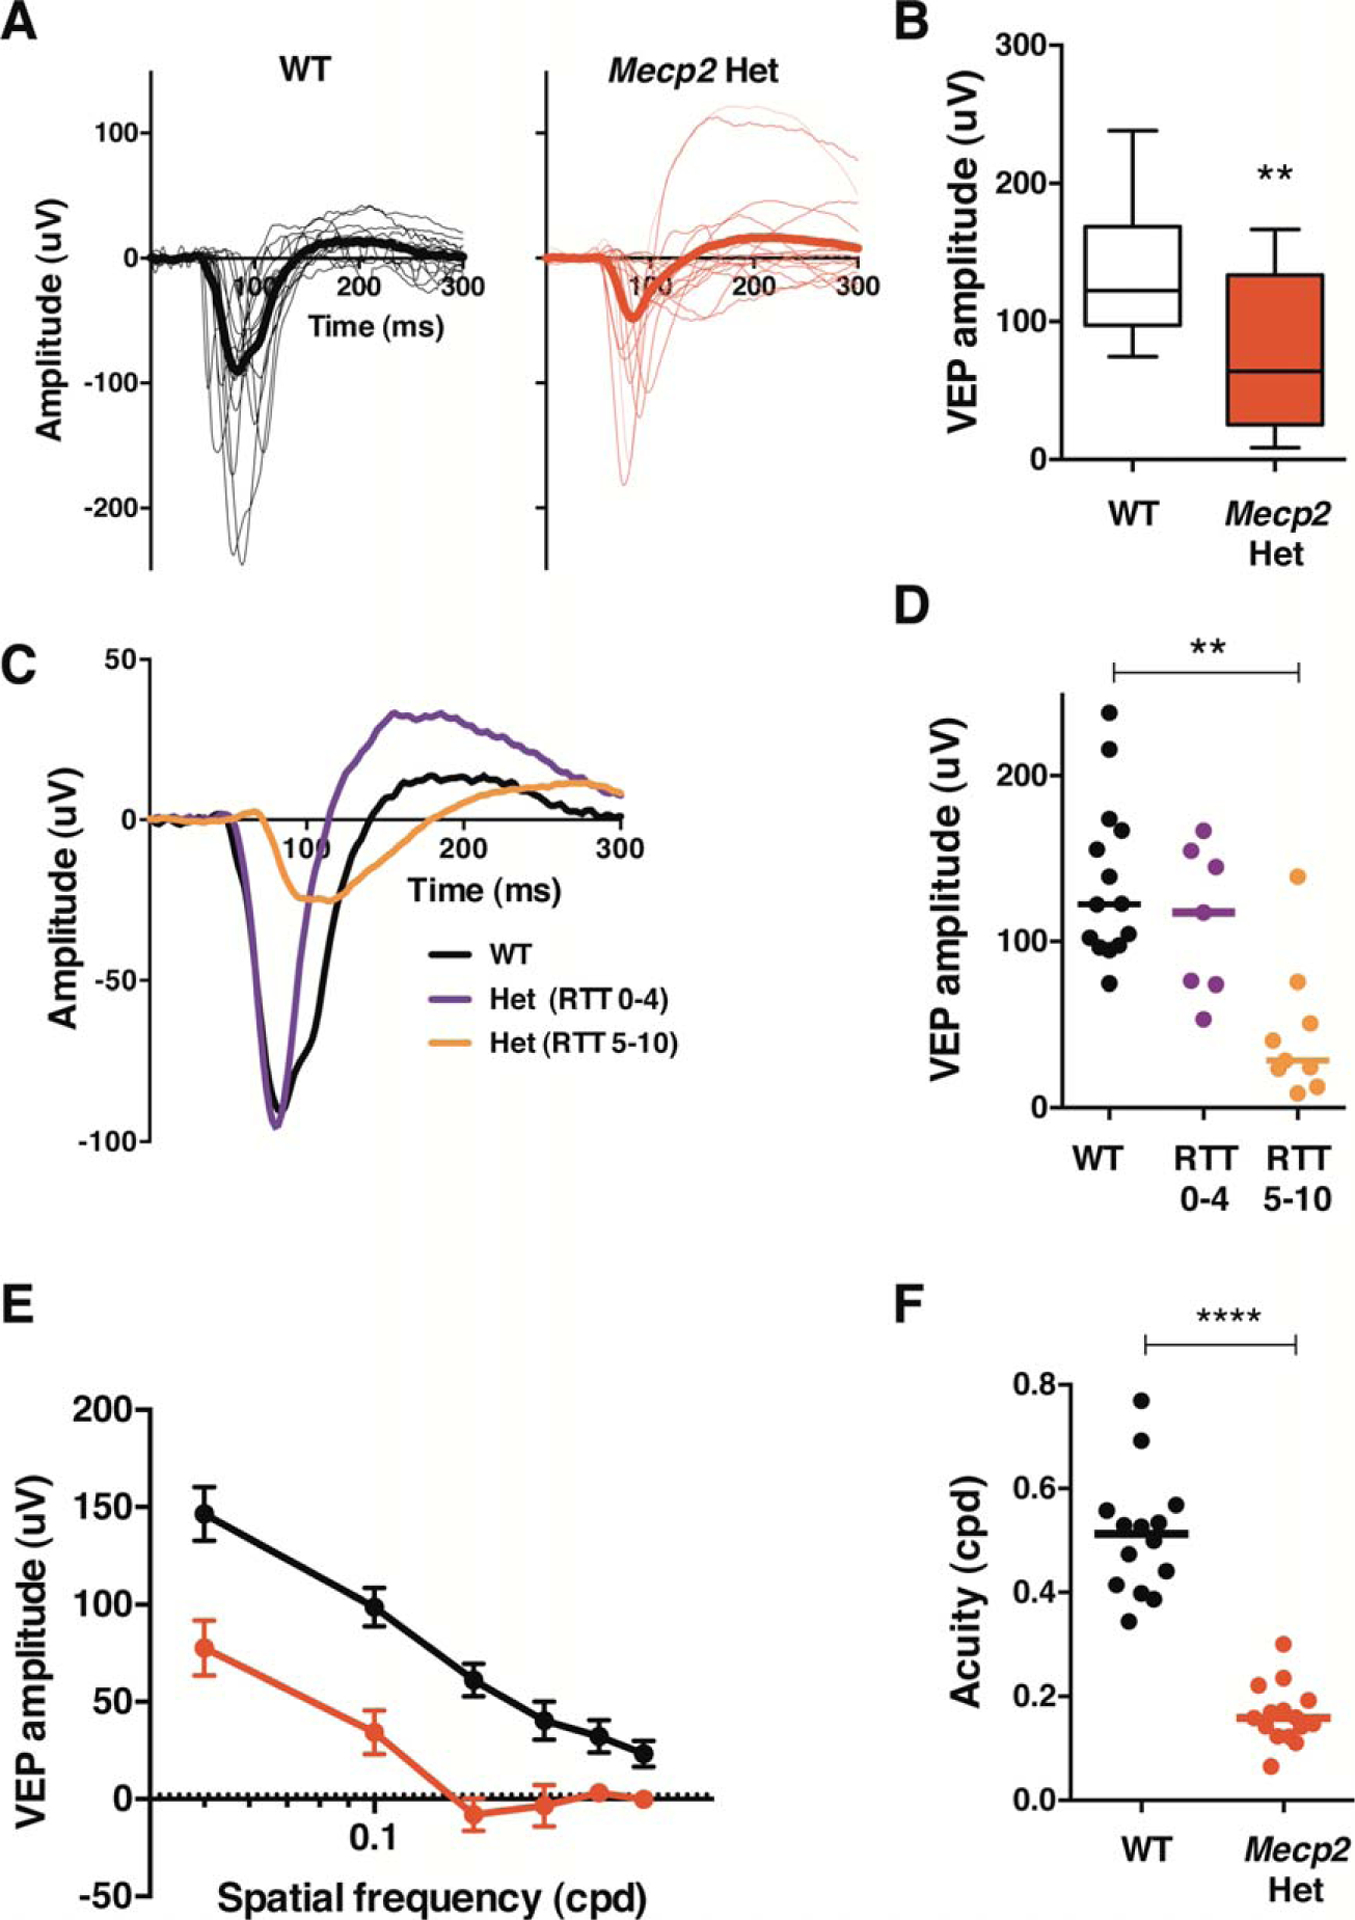
Mecp2 heterozygous mice exhibit reduced amplitude visual evoked potentials (VEPs) and diminished acuity. (A) Average VEP responses to 0.05 cycles per degree (cpd) gratings for each individual mouse (thin traces) and each group (thick traces). Wild-type (WT) mice are shown in black (n = 14), and Mecp2 heterozygous (Het) mice are shown in red (n = 16). (B) Amplitude of the main negative component of the VEP quantified from traces shown in A, displayed in a box and whiskers plot. Boxes extend from 25th to 75th percentiles, lines are at the median, and whiskers represent minimum and maximum values. (C) Average VEP responses for each group. Mecp2 Het mice are sorted into 2 groups based on phenotypic score: Rett syndrome (RTT) 0–4 = absent to mild symptoms (purple, n = 7) and RTT 5–10 = moderate to severe symptoms (orange, n = 9). Black represents WT (n = 14). (D) Amplitude of the main negative component of the VEP quantified from traces shown in C. Lines represent median. (E) Comparison of averaged VEP amplitude as a function of spatial frequency (SF; black = WT, n = 14; red = Mecp2 Het, n = 15). Only SFs for which data were collected from all mice are shown in the plot. (F) Acuity threshold for each mouse. Lines indicate median. WT, n = 14; Mecp2 Het, n = 15. **p < 0.01; ****p < 0.0001.
Human Participants
VEPs were successfully recorded from 34 girls with RTT carrying MECP2 mutations and a comparison group of 20 typically developing (TD) girls with no history of pre- or postnatal difficulties or uncorrected visual conditions. Data from several additional participants were not collected due to noncompliance (n = 1 TD and 4 RTT). Data from an additional 1 TD and 7 RTT participants were excluded from analysis after collection due to insufficient usable trials (<25) as a result of noncompliance (n = 1 RTT), seizure during session (n = 1 RTT), excessive artifact from noise or movement (n = 5 RTT), or technical issues (n = 1 TD). There was no age difference between RTT (median = 54, range = 22–103 months) and TD (median = 47, range = 24–112 months) groups (U = 332.0, z = −0.14, p = 0.886). RTT participants were recruited through the BCH Rett Syndrome Program and the Rett Syndrome Natural History Study (U54 HD061222). VEPs were recorded from some individuals participating in the phase 1 (n = 5) or phase 2 (n = 10) BCH insulinlike growth factor 1 (IGF-1) clinical trials during their baseline visit before placebo or IGF-1 treatment commenced. Diagnosis of RTT, including its types, was performed according to the 2010 guidelines.13 Of the 34 RTT participants, there were 31 typical, 1 preserved speech variant, and 2 possible RTT individuals who were <24 months of age (ie, in active regression [AR]). All RTT participants underwent a detailed phenotypic evaluation through parent surveys and interviews, medical record review, and physical examination at the time of their VEP session. Based on the latter, a neurologist from the BCH Rett Syndrome Program also determined a Clinical Severity Score (CSS) for each child.20 CSS scores in this cohort ranged from 9 to 37, with a median score of 21.
Sorting of Participants Based on Phenotypic Features
To investigate the contribution of various genotypic and phenotypic factors, individuals with RTT were grouped according to disorder stage and mutation type. Participants were sorted into 2 groups based on the timing of gross motor, fine motor, receptive language, expressive language, and adaptive skill loss. Individuals who had lost any previously acquired skill in any of these domains within the 12 months prior to VEP recording were considered to be in AR (n = 11), and those who had not were categorized as postregression (PR; n = 22). This assessment was based on information from detailed developmental and medical history questionnaires completed by parents, patient growth charts and medical records from the first 3 years of life, and a physical examination by a pediatric neurologist. Twelve months was an ideal limit within this data set to be conservative about whom to categorize as clinically stable, and to attain sufficient numbers in both groups to make meaningful comparisons. One participant with a possible RTT diagnosis was excluded from this analysis because she had not yet lost any skills in these domains.
Participants were also sorted into 2 groups on the basis of having mutations reported in the literature to be more often associated with mild clinical symptoms (n = 15 total), including R133C (n = 2), R294X (n = 1), R306C (n = 4), c-terminal truncations (n = 6), and exon 1/2 deletions (n = 2), or mutations associated with more severe clinical symptoms (n = 18 total), including R168X (n = 9), R255X (n = 3), R270X (n = 1), T158M (n = 3), and large exon 3/4 deletions (n = 2).21 One participant was excluded because her mutation had not been characterized in the literature.
VEPs
Participants were seated in a supportive chair 60cm from a Tobii T120 Eye Tracker monitor (Tobii Technology, Danderyd, Sweden) in an electrically shielded, dark room. One experimenter sat beside the child to redirect attention to the screen if necessary, and another experimenter controlled the acquisition computers in an adjacent room. ePrime software (Psychology Software Tools, Pittsburgh, PA) was used to present phase-reversing black and white checkerboard patterns on the monitor. The diagonal check size was 0.5cpd and the reversal rate was 2Hz (2 patterns in 1 second). The monitor luminance was measured across the screen using a photometer; mean luminance was 135 candela (cd)/m2 for the white checks and 0.5 cd/m2 for the black checks, and the Michelson contrast was 99%. The refresh rate of the monitor was 120Hz. The Tobii eye-tracking system monitored binocular eye gaze, and each phase reversal of the stimulus was contingent on a fixation period of 100 milliseconds to ensure the participant was looking at the screen during each trial. A total of 50 to 100 trials were presented to each participant, and VEP sessions lasted no longer than a few minutes.
During the task, continuous EEG was recorded from a 128-channel HydroCel Geodesic Sensor Net placed on the participant’s head according to the 10–20 system (Electrical Geodesics, Eugene, OR). The electrical signal was amplified with a NetAmps 300 amplifier, digitized at 500 or 1,000Hz, and analyzed offline using NetStation 4.5.4 analysis software (Electrical Geodesics). To accurately compare data collected at different sampling rates, 1,000Hz data were low pass filtered at 200Hz and then down-sampled to 500Hz using the NetStation down-sampling tool. EEG data were digitally filtered using a 0.3 to 30 band-pass elliptical filter, segmented into 300-millisecond poststimulus recording periods, and baseline-corrected against the mean voltage during the 100-millisecond prestimulus period. Temporal offsets between the stimulus trigger and appearance on the monitor and offsets due to antialiasing filters within the amplifiers were corrected for at this point in the analysis.
An automated artifact detection tool flagged channels with excessive voltage change (>150μV) based on a moving average of 80 milliseconds over the entire segment, and bad channels were replaced using spherical spline interpolation. Trials were marked as bad and eliminated from analysis if >10% of channels were flagged. In addition, trials containing eye blinks, eye movements, or excessive noise or drift were manually flagged based on visual inspection and removed from subsequent analysis. Trials were also marked as bad in which the electrode of interest, Oz, or a cluster of electrodes surrounding Oz were marked as bad. Finally, average waveforms for each participant were calculated and rereferenced to the average reference. Participants with <25 remaining trials were excluded from the data set. There was no significant difference in the number of good trials between RTT (median = 59, range = 33–144) and TD (median = 72, range = 31–96) groups (U = 272.5, z = −1.21, p = 0.226).
In keeping with traditional VEP analysis, we chose the midline electrode Oz as our channel of interest.9 N1, P1, and N2 components were identified for each participant’s average waveform (Fig 2B). These components are equivalent to the standard components described in the literature9 (N1 = N75, P1 = P100, N2 = N135). P1 was defined as the first prominent positive inflection point closest to 100 milliseconds, and occurred within 72 to 130 milliseconds after stimulus onset for all participants. N1 was the negative inflection point immediately preceding P1 and occurred within 4 to 104 milliseconds after stimulus onset for all participants. N2 was the negative inflection point immediately following P1 and occurred within 114 to 298 milliseconds after stimulus onset in all participants. Due to the frequent presence of multiple positive peaks in the RTT cohort, each individual average waveform was categorized as having multiple peaks if the following criteria were met: (1) there were 2 or more positive peaks between 75 and 200 milliseconds separated by a negative inflection point, (2) the latency difference between peaks was <90 milliseconds, and (3) the amplitude of the last peak was at least 50% of the first peak. In the case of multiple peaks, P1 was defined as the first peak and N2 was the first negative inflection point following the last peak. The amplitude and latency of each component were quantified for all individual average waveforms.
FIGURE 2:
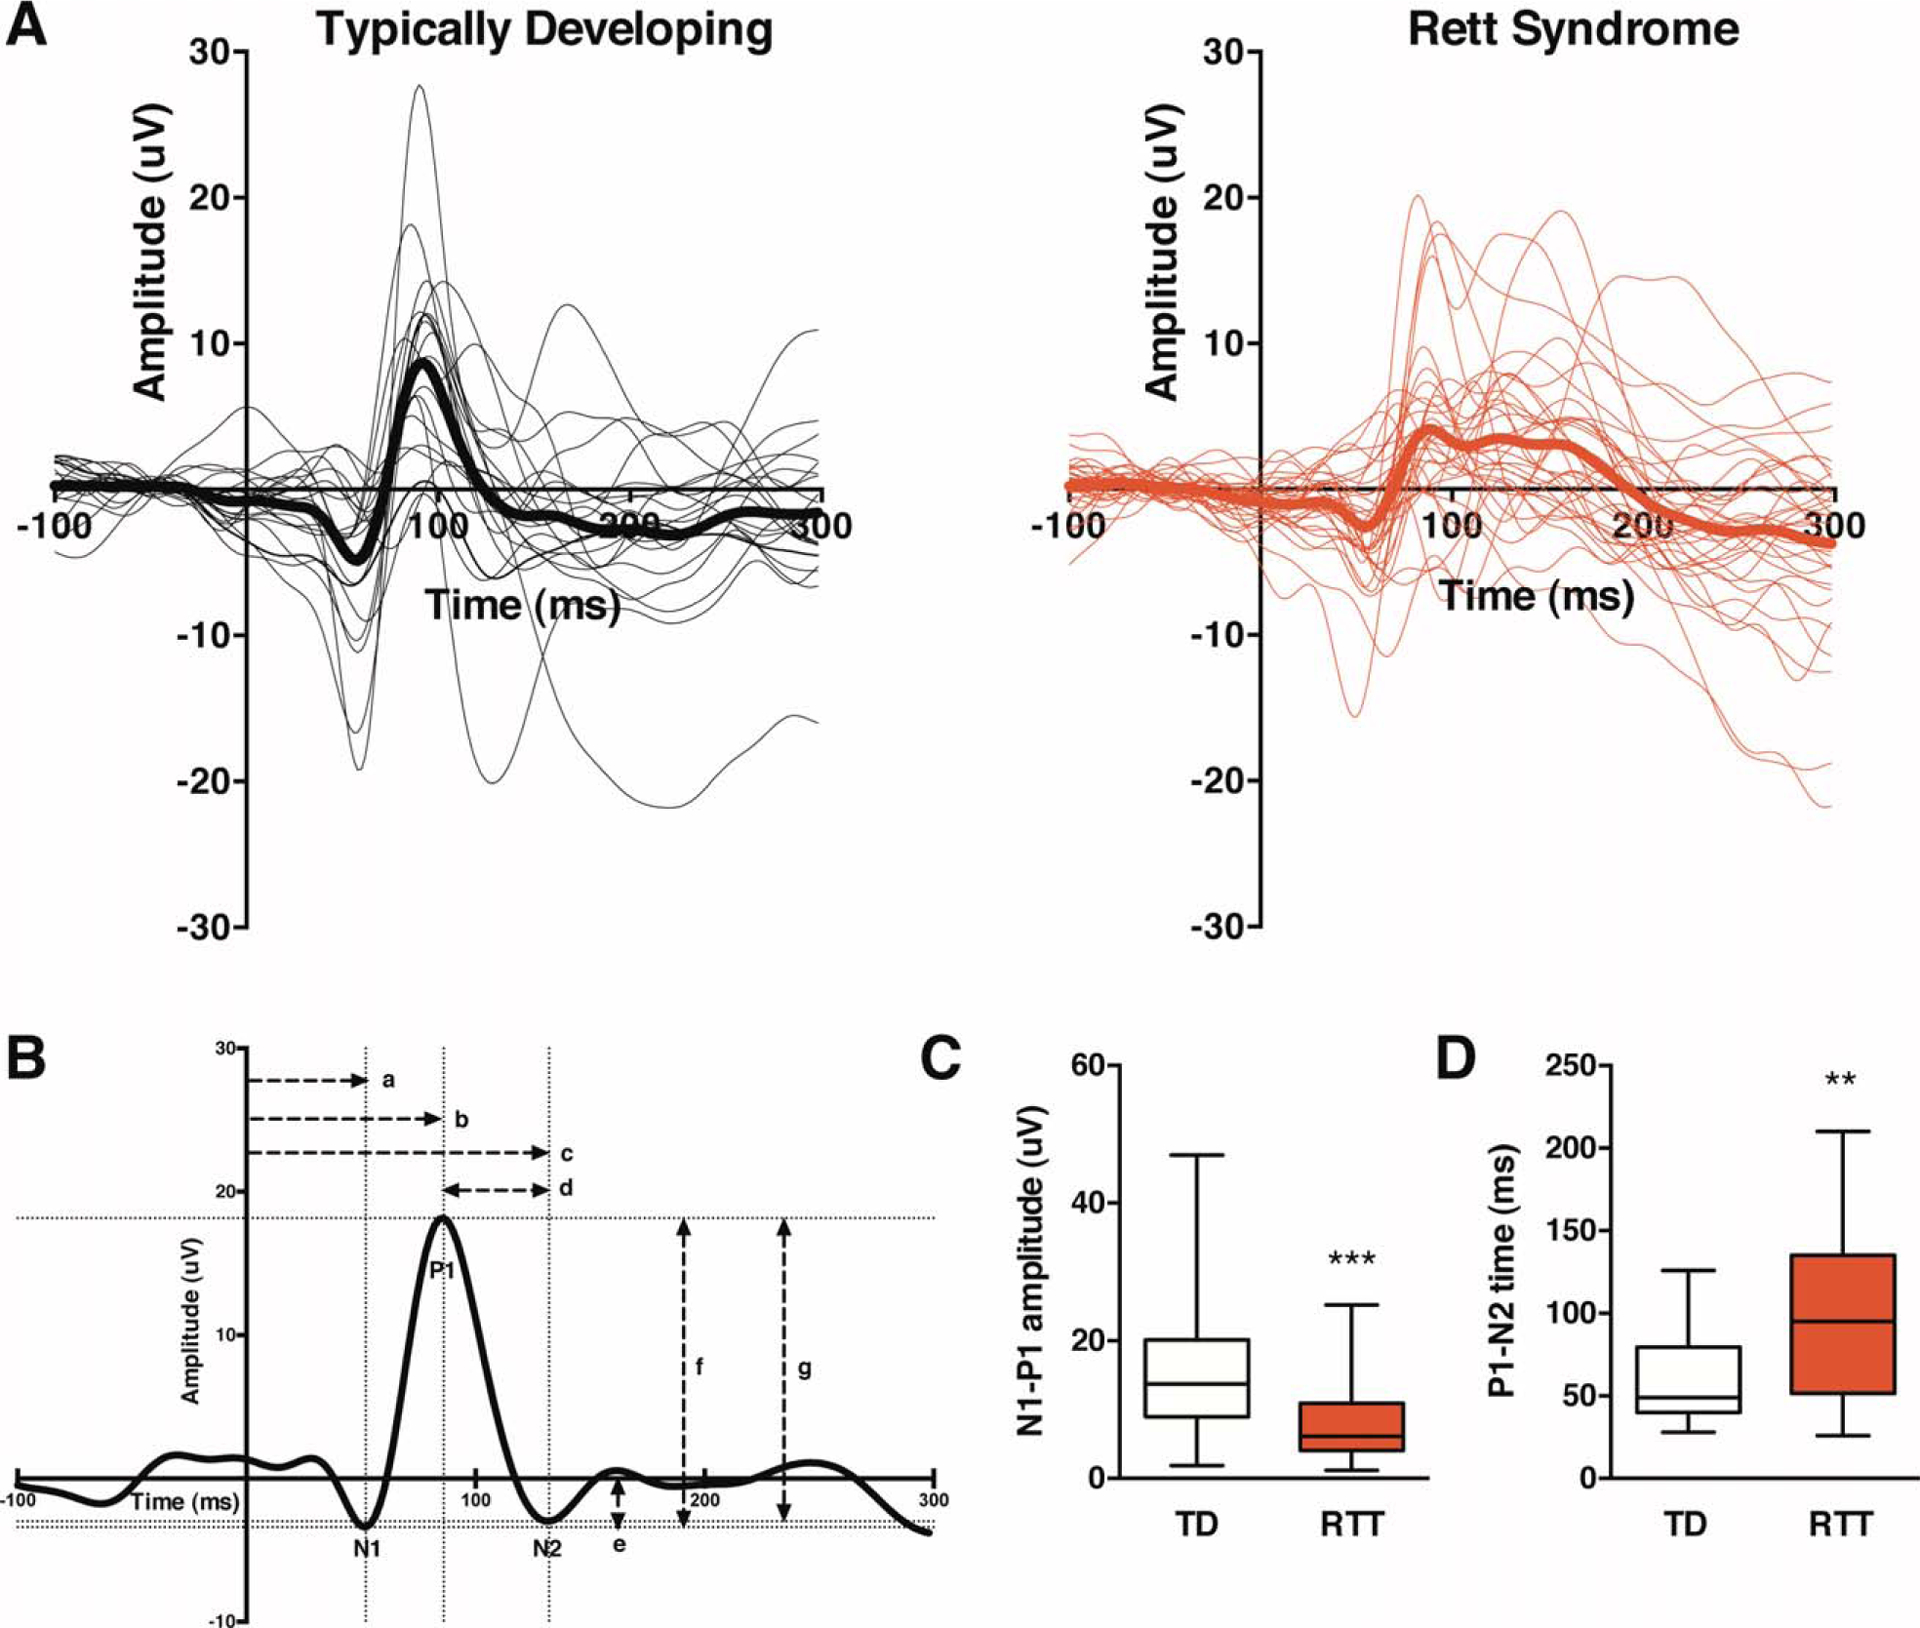
Children with Rett syndrome (RTT) exhibit reduced amplitude visual evoked potentials (VEPs) and prolonged signal recovery. (A) Average VEP responses for each individual participant (thin traces) and each group (thick traces). Typically developing (TD) subjects are shown in black (n = 20), and RTT subjects are shown in red (n = 34). (B) VEP quantification methods are shown for a representative averaged VEP waveform from a 3-year-old TD participant. The time period from −100 to 0 milliseconds represents the baseline signal prior to stimulus onset at 0 milliseconds. The dotted lines indicate the coordinates of the N1, P1, and N2 components. The horizontal dashed lines represent time measurements, and the vertical dashed lines represent amplitude measurements. Measurements: (a) N1 latency, (b) P1 latency, (c) N2 latency, (d) P1–N2 time, (e) N1 amplitude, (f) N1–P1 amplitude, (g) P1–N2 amplitude. (C) Quantified N1–P1 amplitude of VEP traces shown in A displayed in a box and whiskers plot. Box extends from 25th to 75th percentiles, lines are at the median, and whiskers represent minimum and maximum values.(D) Quantified P1–N2 time of VEP traces shown in A displayed in a box and whiskers plot. **p < 0.01; ***p < 0.001.
Acuity
A subset of the individuals described above also participated in the acuity experiment that was introduced later during the course of the project, once the feasibility of collecting VEPs in this population had been established. The final cohort that yielded usable data included 8 TD girls between 24 and 59 months old (mean = 38 months) and 11 girls with RTT between 23 and 49 months old (mean = 35 months). Within the RTT group, 8 were in AR, 3 were in PR, 4 had mild mutations, and 7 had severe mutations. The stimuli used for the acuity experiment were altered from the stimulus described above in several ways. First, the contrast was reduced to 83% to minimize strain on the eyes during the longer session. Second, the temporal frequency was increased to 4Hz to maximize the number of trials presented in the least amount of time. Third, the diagonal SF of the checks ranged from 0 to 22cpd and were presented in the following order in blocks of 50 trials each: 0.2, 11, 0.7, 23, 2.8, 0.1, 0, 1.4, 0.4, 5.6. SF was calculated according to published methods.22 The 0cpd stimulus was an equal luminance gray screen used to estimate the noise level.
Data were processed as described above with the exception of a 250-millisecond poststimulus recording period that was baseline-corrected against a 50-millisecond prestimulus period, and an automated artifact detection tool flagged channels with excessive voltage change (>150μV). Data from an individual was only included if at least 20 good trials were collected for each SF. The N1–P1 amplitude was calculated as described above. To estimate acuity, a nonlinear regression was fit to the data from the peak amplitude to the first response at or below the noise level using a least squares method, and the intersection with the x-axis determined the threshold of acuity. For 3 individuals with RTT, the response plateaued just above the noise level. In these cases the regression was performed only through the first point of this plateau to avoid inaccurate overestimation of acuity.
Statistical Analysis
Statistical analysis was conducted using SPSS Statistics v21 software (IBM, Armonk, NY). Only 2-sided tests and nonparametric statistical tests were used due to non-normal distribution of variables and/or sample size. Two groups were compared with a Mann–Whitney test. Three groups were compared with a Kruskal–Wallis test, reported as H[df] where H is the test statistic and df is the degrees of freedom, followed by paired comparisons with adjusted p-values. Spearman correlations were performed to investigate the relationship between 2 continuous variables. The significance threshold was set to p = 0.05 unless otherwise specified. All data were analyzed blind to group, and analysis was based on biological replicates (ie, each data point is from 1 mouse or human participant). There was 1 outlier in the TD group with respect to N1–P1 amplitude, but findings remained significant when this individual was excluded from analysis.
Results
VEP in Mecp2 Heterozygous Female Mice
Mecp2 female Het mice are considered an appropriate animal model of the human condition because of their mosaic expression of Mecp2. The age of onset of RTT phenotype in the Mecp2 Het female mice is variable and is usually evaluated by an RTT phenotypic score, a reliable readout of RTT condition resembling the human phenotype.19 Here, a blind observer classified mice just before in vivo recordings. Each symptom was scored as absent, present, or severe (scores of 0, 1, and 2, respectively). Overall, we recorded VEPs in 16 Mecp2 Het mice ranging in age from 30 to 430 postnatal days, with RTT phenotypic scores from 0 to 10. As expected, phenotypic scores were more severe with increasing age (r = 0.76, p = 0.001). Fourteen Mecp2 WT littermates were used as controls, and all received a phenotypic score of 0.
Mecp2 WT mice exhibited robust VEP responses (see Fig 1A). WT VEP amplitude did not correlate with age (r = −0.42, p = 0.131), supporting the notion that visual circuits are typically stable after P30. Mecp2 Het females displayed smaller VEP amplitudes in comparison with WT littermates (U = 44.0, z = −2.83, p = 0.004, r = −0.52; see Fig 1A, B). Within the Het group, VEP amplitude negatively correlated with age (r = −0.50, p = 0.047) and phenotypic score (r = −0.61, p = 0.012), and sorting the mice into high (5–10) and low (0–4) RTT-like phenotypic groups revealed a significant effect of group on VEP amplitude (H[2] = 13.57, p = 0.001; see Fig 1C, D). Pairwise comparisons with corrected p-values showed no difference between the WT and 0–4 groups (p = 1.000), a trend toward a decrease in amplitude in the 5–10 group compared to the 0–4 group (p = 0.055, r = 0.59), and a significant decrease in amplitude in the 5–10 group compared to the WT group (p = 0.001, r = −0.76). The VEP amplitude reduction was therefore driven primarily by mutants with high phenotypic scores who exhibited more severe RTT-like symptoms. This suggests that VEP amplitude reflects overall neurologic functioning and may progressively decrease with advancement of the disorder.
In addition, VEP amplitude was reduced in response to all stimuli, resulting in a shift down in the SF tuning curve (see Fig 1E) and significantly lower spatial resolution (U = 0.0, z = −4.58, p = 2.58e−8, r = −0.85; see Fig 1F). This result is consistent with reports of lower behavioral acuity measured with the optomotor task in adult Mecp2 Het mice.8 Acuity was stable across age in the WT group (r = 0.47, p = 0.091) but was negatively correlated with both age (r = −0.70, p = 0.004) and phenotypic score (r = −0.66, p = 0.008) in the RTT group. Together, our data indicate that visual cortical processing deficits worsen with disorder progression, are a common feature of different mouse models of RTT, and can be detected and quantified objectively by VEPs.
VEP Morphology in Children with RTT
Next, we recorded VEPs in children with RTT using a stimulus recommended by the International Society for Clinical Electrophysiology of Vision9 and eye-tracking technology. We tested children with RTT between 22 months and 9 years of age who were extensively characterized in terms of genotype and phenotype, and compared them with an age-matched control group. Note that there is a polarity reversal in the VEP between mice and humans due to recording location (intracortical in mice and scalp in humans) and other methodological differences.
Whereas TD girls displayed canonical VEP responses that did not change with age (see Fig 2A, black; Tables 1 and 2),9,23 gross abnormalities in waveform morphology were clearly apparent in RTT participants (see Fig 2A, red). Changes in the waveform were quantified according to the latency and amplitude of the N1, P1, and N2 components (see Fig 2B, C, D; Table 1). Importantly, N1 and P1 latency and N1 amplitude were not significantly altered in RTT, demonstrating intact visual pathways and normal arrival of visual information to the cortex.9 P1 amplitude was substantially decreased in the RTT group, as measured by N1–P1 amplitude (p = 0.005, r = −0.39) and P1–N2 ampliude (p = 0.008, r = −0.36). Responses were slower to recover due to splitting or smearing of the P1 peak. Fifty percent of RTT participants exhibited multiple positive peaks (n = 13 double, n = 4 triple), whereas only 10% of TD children exhibited double peaks. This was reflected by an increase in N2 latency (p = 0.014, r = 0.36) and P1–N2 time (p = 0.009, r = 0.36) in the RTT group. Subsequent analyses focused on elucidating these striking differences in N1–P1 amplitude and P1–N2 time between the groups.
TABLE 1.
Quantification of VEP Group Differences
| Group Comparisons | |||||
|---|---|---|---|---|---|
| Measurement | TD, n = 20 | RTT, n = 34 | U | z | P |
| N1 latency | 57.0 (10.0) | 54.0 (13.0) | 298.5 | −0.75 | 0.455 |
| P1 latency | 92.0 (6.0) | 88.0 (12.0) | 247.5 | −1.67 | 0.096 |
| N2 latency | 146.0 (40.0) | 193.0 (82.0) | 477.5 | 2.46 | 0.014a |
| P1–N2 time | 49.0 (40.0) | 95.0 (84.0) | 485.5 | 2.61 | 0.009a |
| N1 amplitude | −3.4 (6.7) | −3.1 (4.9) | 403.0 | 1.13 | 0.259 |
| N1–Pl amplitude | 13.7 (11.2) | 6.1 (6.8) | 182.0 | −2.83 | 0.005a |
| P1–N2 amplitude | 12.2 (12.2) | 5.9 (8.5) | 192.0 | −2.65 | 0.008a |
Data are presented as median (interquartile range). Latency values are in milliseconds, and amplitude values are in microvolts. U is the Mann-Whitney test statistic; z is the standardized test statistic.
Significant group differences (p < 0.05).
TABLE 2.
VEP Correlations with Age or CSS
| Correlation with Age | Correlation with CSS RTT, n = 34 | |||||
|---|---|---|---|---|---|---|
| TD, n = 20 | RTT, n = 34 | |||||
| Measurement | r | P | r | P | r | P |
| N1 latency | −0.23 | 0.326 | 0.32 | 0.069 | −0.26 | 0.136 |
| P1 latency | 0.02 | 0.935 | 0.20 | 0.263 | −0.37 | 0.031 |
| N2 latency | 0.16 | 0.513 | −0.02 | 0.933 | −0.04 | 0.845 |
| P1–N2 time | 0.17 | 0.484 | −0.05 | 0.776 | −0.04 | 0.808 |
| N1 amplitude | 0.22 | 0.349 | 0.36 | 0.036 | 0.19 | 0.276 |
| N1–P1 amplitude | 0.16 | 0.508 | −0.32 | 0.070 | −0.18 | 0.313 |
| P1–N2 amplitude | 0.20 | 0.394 | −0.31 | 0.079 | −0.07 | 0.712 |
Latency values are in milliseconds, and amplitude values are in microvolts. r indicates Spearman correlation coefficient. Significance threshold was set to p < 0.007 after correction for multiple comparisons.
CSS = Clinical Severity Score; RTT = Rett syndrome; TD = typically developing; VEP = visual evoked potential.
Impact of Clinical Stage and Severity on VEP in Children with RTT
RTT patients advance through several clinical stages over the course of the disorder, beginning with apparently normal development followed by developmental delay, loss of skills during a regression period, and a prolonged period of stabilization in most neurological domains.4,5 In both Mecp2 null8 and Het mice (see Fig 1D), visual impairment worsened as the disorder advanced. We therefore predicted that the VEP would reflect progressive cortical dysfunction in RTT patients. Because it is difficult to pinpoint the exact time when an individual transitions between stages,4 we used a conservative method and sorted individuals according to whether they had (AR) or had not (PR) experienced skill loss within the 12 months prior to VEP recording. We observed a significant effect of group on N1–P1 amplitude (H[2] = 11.62, p = 0.003). Pairwise comparisons with adjusted p-values revealed no difference between TD and AR groups (p = 0.705) or AR and PR groups (p = 0.283), but a significant decrease in N1–P1 amplitude in the PR group compared to the TD group (p = 0.002, r = 0.53).
There was also a significant effect of group on P1–N2 time (H[2] = 7.48, p = 0.024). Pairwise comparisons with adjusted p-values revealed no difference between the TD and AR groups (p = 0.350) or AR and PR groups (p = 1.000), but a significant increase in P1–N2 time in the PR group compared to the TD group (p = 0.021, r = −0.42). Visual inspection of the data indicated that N1–P1 amplitude was more impacted by stage (Fig 3A, B), whereas P1–N2 time appeared to be a more general feature of the RTT VEP response regardless of stage (see Fig 3A, C). Although VEPs were not yet measured longitudinally in the same individuals through the stages of RTT, the combined mouse and human data strongly suggest that VEP amplitude progressively decreases over the course of the disorder.
FIGURE 3:
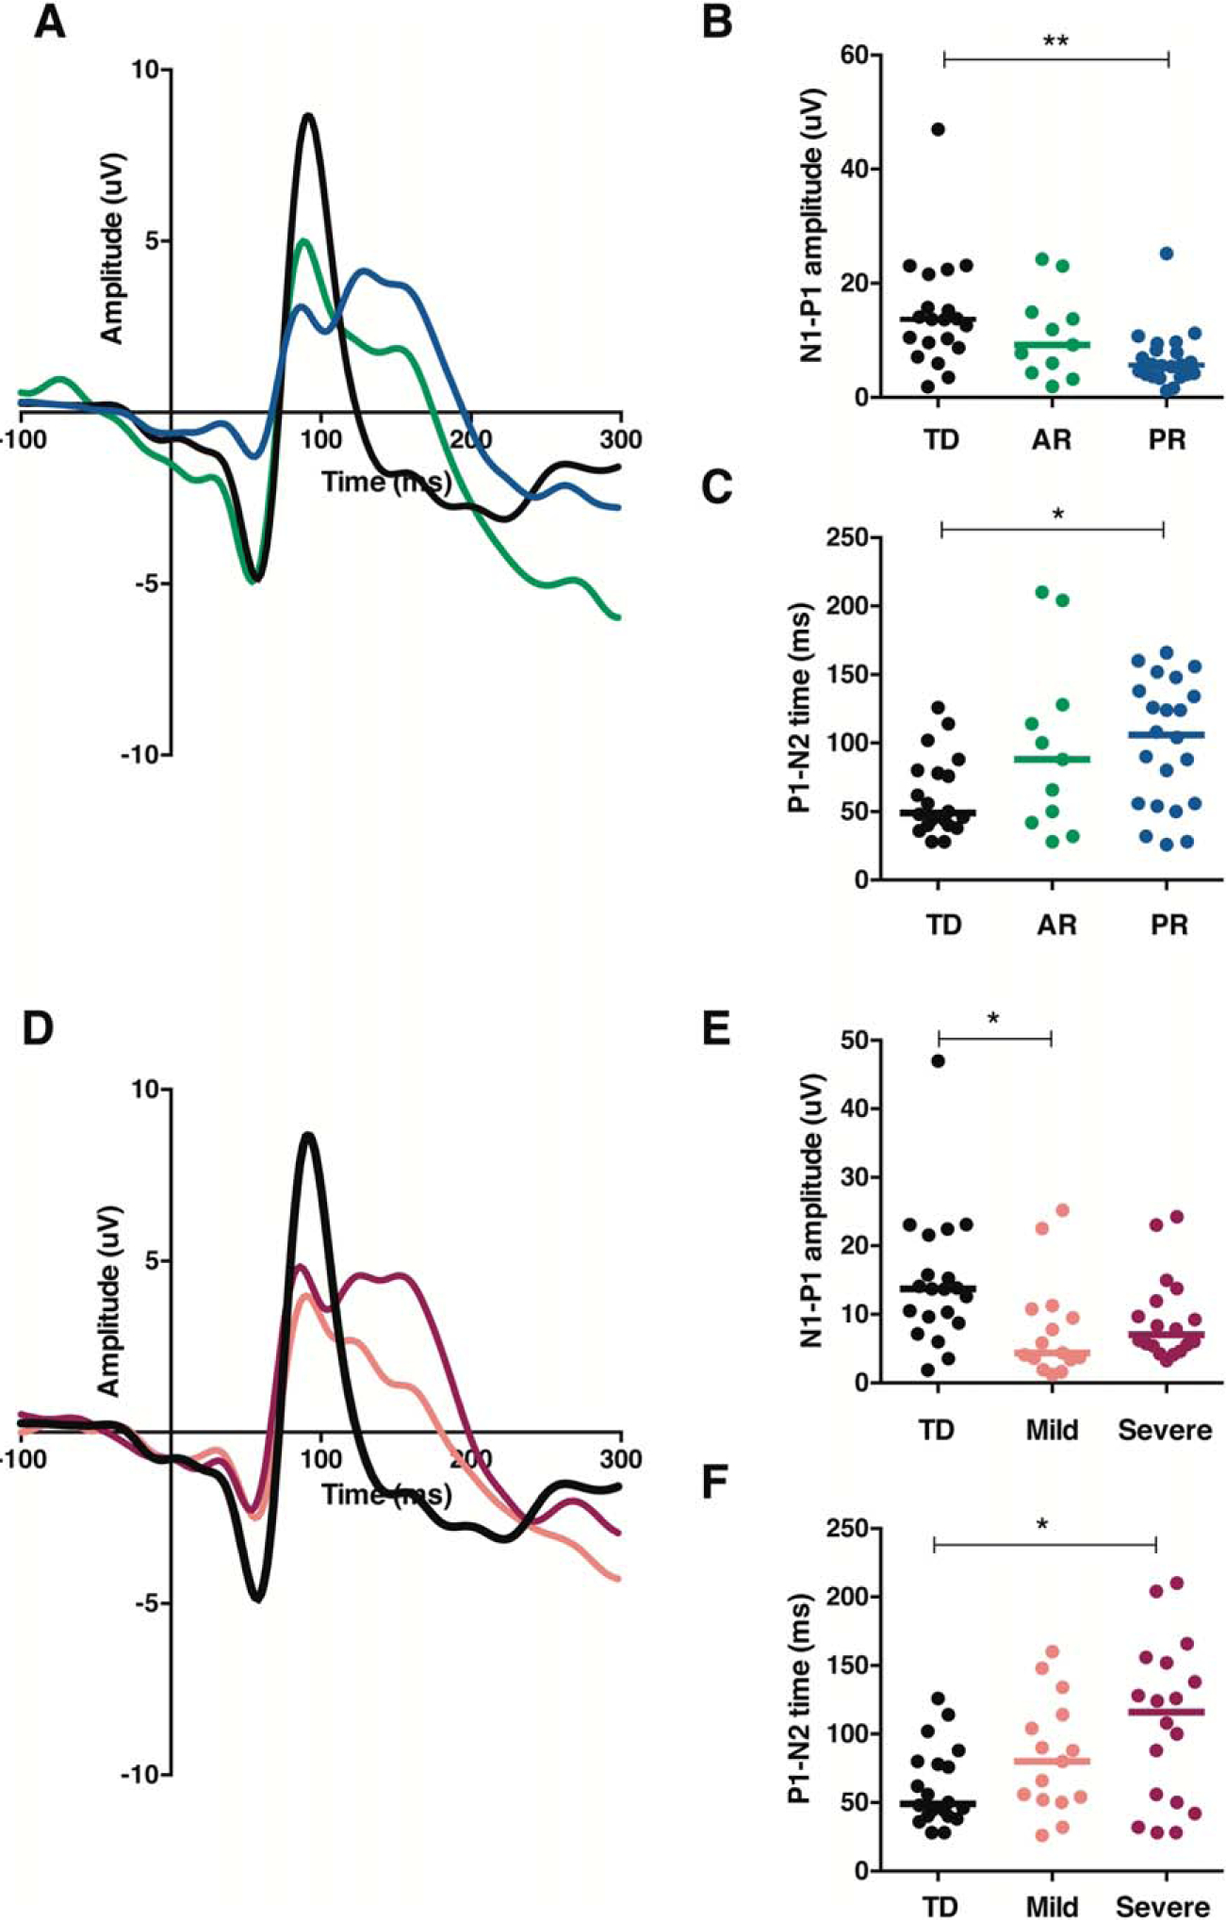
Disorder stage and MECP2 mutation type differentially shape visual evoked potential (VEP) waveform morphology in children with Rett syndrome. (A) Average VEP responses for each group according to disorder stage (black 5 typically developing [TD], n = 20; green = active regression [AR], n = 11; blue = postregression [PR], n= 22). (B) Quantified N1–P1 amplitude of VEP traces shown in A. Lines represent median. (C) Quantified P1–N2 time of VEP traces shown in A. Lines represent median. (D) Average VEP responses for each group according to mutation type (black = TD, n = 20; salmon = mild mutations, n = 15; magenta 5 severe mutations, n= 18). (E) Quantified N1–P1 amplitude of VEP traces shown in D. Lines represent median. (F) Quantified P1–N2 time of VEP traces shown in D. Lines represent median. *p < 0.05; **p < 0.01.
Many individuals with RTT develop seizures, particularly as the disorder advances, and manage them with antiepileptic drugs (AEDs).24 In our PR group, 10 of 22 girls had a history of seizures and were taking AEDs at the time of the VEP recording, and we were concerned that this might contribute to the differences we were seeing between the stages. The most commonly used AED in this cohort, levetiracetam (Keppra), has not been reported to have any measurable effect on VEPs or vision, and effects of other AEDs on VEPs are generally on P1 latency,25 a parameter that did not change in our RTT group. Accordingly, we found no statistically significant differences in any parameter between girls in PR who were taking or not taking AEDs, including N1–P1 amplitude (AED−, median =6.0; AED+, median = 4.4; U = 45.0, z = −0.99, p = 0.346) and P1–N2 time (AED−, median = 107.0; AED+, median = 106; U = 54.5, z = −0.36, p = 0.722).
Given the impact of phenotypic score on VEP amplitude in the Mecp2 Het mice, we also investigated the relationship of CSS20 with all VEP parameters within the RTT group. The CSS is based on characteristic clinical features of RTT that include growth, communication skills, motor skills, hand stereotypies, seizures, autonomic function, and scoliosis; higher scores reflect poorer overall function. There were no significant relationships between CSS and any VEP parameter (see Table 2), indicating that other factors must account for the variability between individuals.
Impact of MECP2 Mutation on VEP in Children with RTT
De novo mutations in MECP2 account for the majority of RTT cases, and there are consistent genotype–phenotype correlations.21 Several common MECP2 mutations likely conserve some protein function and are often associated with milder RTT symptoms. Other mutations, particularly those that interfere with the nuclear localization of MeCP2 protein, are associated with severe RTT symptoms. We investigated whether MECP2 mutation type (mild, n = 15 or severe, n = 18) impacted N1–P1 amplitude and P1–N2 time in our cohort of RTT patients (see Fig 3D–F). There was a significant effect of group on N1–P1 amplitude (H[2] = 8.88, p = 0.012). Pairwise comparisons with corrected p-values revealed no difference between the TD and severe groups (p = 0.180) or mild and severe groups (p = 0.821), but a significant decrease in N1–P1 amplitude in the mild group compared to the TD group (p = 0.011, r = 0.49).
There was also a significant effect of group on P1–N2 time (H[2] = 7.00, p = 0.030). Pairwise comparisons with corrected p-values revealed no difference between the TD and mild groups (p = 0.326) or mild and severe groups (p = 1.000), but a significant increase in P1–N2 time in the severe group compared to the TD group (p = 0.028, r = −0.42). Visual inspection of the data indicated that N1–P1 amplitude was more comparably diminished between the mild and severe groups (see Fig 3D, E), whereas P1–N2 time tended to be most prolonged in the severe group (see Fig 3D, F). This impact of mutation type on P1–N2 time merits further investigation to understand how each mutation affects cortical processing, both by sorting based on individual mutations within a larger sample of RTT patients and by generating mouse models carrying these specific mutations.
Spatial Frequency Processing and Visual Acuity in Children with RTT
Considering the significant loss of spatial acuity found in mutant mice, we next asked whether stimulus SF impacts VEP waveform morphology in RTT patients and whether any evidence of reduced visual acuity could be detected using VEP. To test this, we presented 9 different SF stimuli to a subset of the individuals described above. The VEP waveform in RTT patients appeared relatively normal at 0.4cpd and lower SF, with no change in amplitude and only a slight broadening of the response following the P1 (Fig 4A, B). However, the response became progressively more abnormal in both respects at higher SFs.
FIGURE 4:
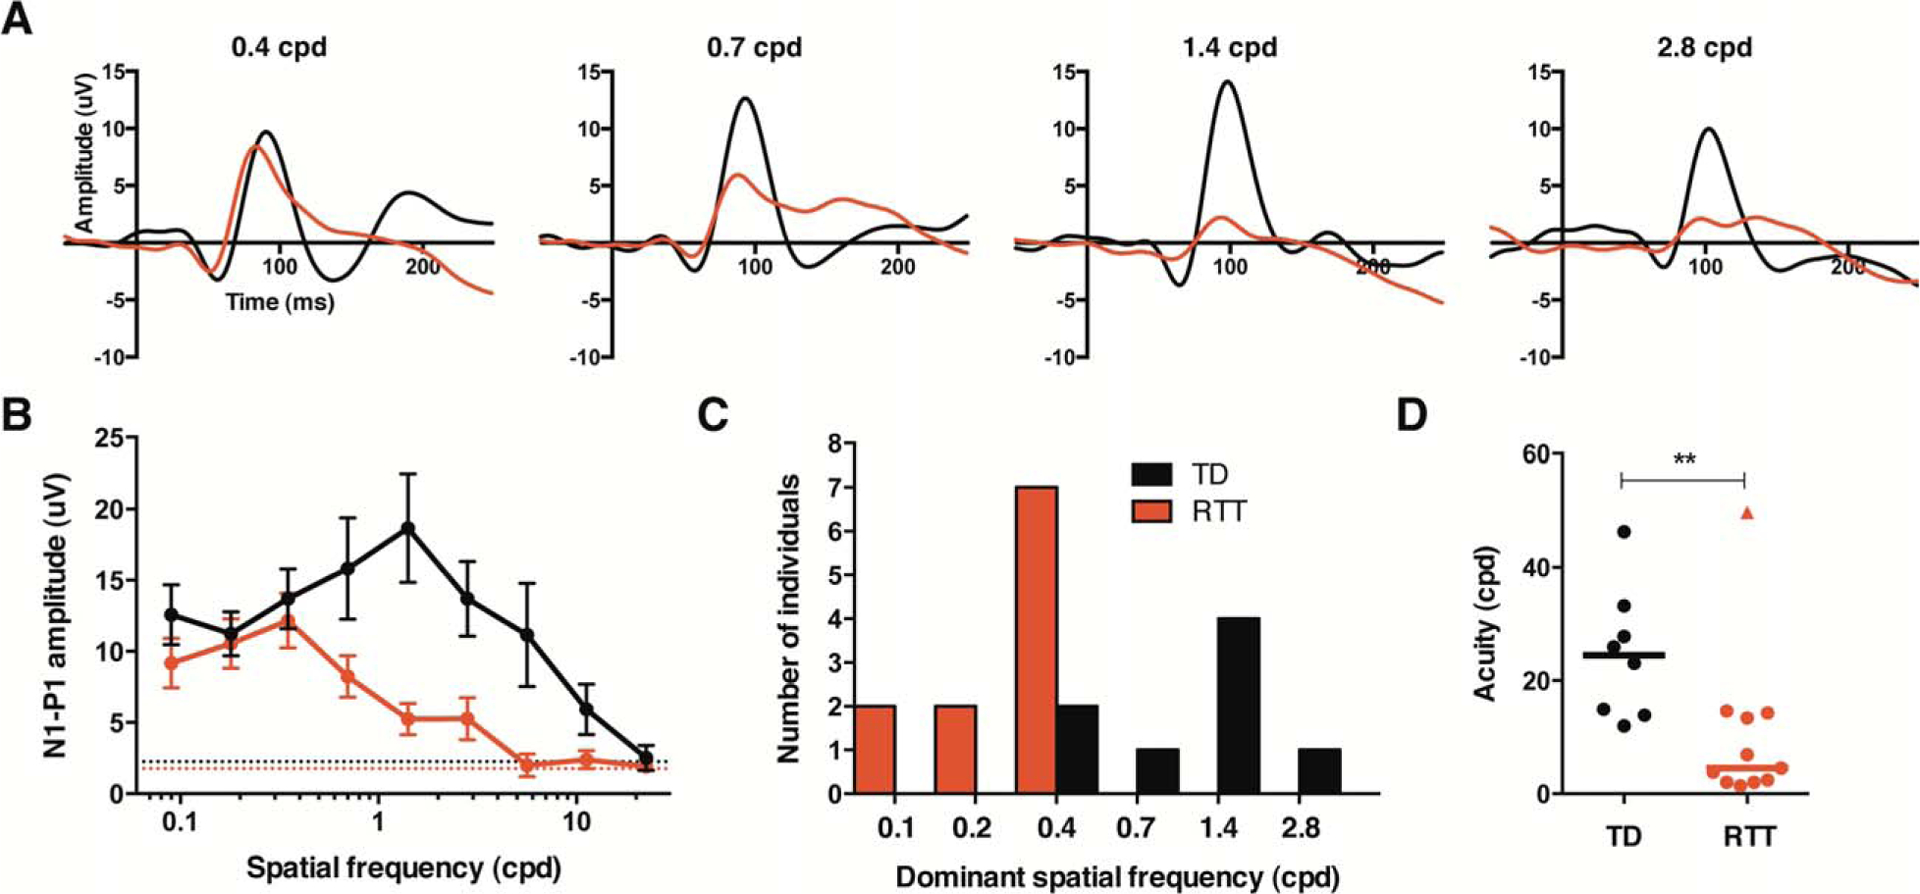
Children with Rett syndrome (RTT) exhibit reduced spatial frequency (SF) sensitivity and diminished acuity. (A) Group average visual evoked potential waveforms to several different SF stimuli (black = typically developing [TD], n = 8; red = RTT, n = 11). (B) SF tuning plot graphing mean N1–P1 amplitude for each group at each SF stimulus (black = TD; red = RTT). (C) Histogram of number of individuals who displayed a peak response to each SF (black, TD; red, RTT). (D) Acuity threshold for each participant. Lines are at median. The RTT data point designated as a triangle represents an outlier that is described in the text. cpd = cycles per degree. **p < 0.01.
Spatial frequency tuning curves in typically developing participants peaked in response amplitude around 1.4cpd and then decreased with increasing SF toward zero (see Fig 4B).22 The mean spatial resolution of the group was 24.6cpd, which is roughly equivalent to 20/25 Snellen chart acuity.22 Acuity did not correlate with age (r = −0.12, p = 0.778), consistent with reports that VEP acuity has fully matured by 5 to 12 months of age.10 The RTT group demonstrated a normally shaped SF tuning curve, but with the dominant SF shifted to lower values compared with controls (see Fig 4B, C).
Acuity values were also significantly decreased (see Fig 4D), and there was no correlation with age (r = 0.04, p = 0.915). One individual within the RTT group exhibited an abnormal SF tuning curve, with a loss of response at 1.4cpd, and then a potential peak present again at 2.8cpd. Analysis was performed in 2 ways: first, by assuming that the aberrant peak at 2.8cpd was a real response and should be included in the regression (acuity = 49.7cpd, as shown in Fig 4D), and second by assuming that the peak was not real and should not be included (acuity = 6.7cpd). In both cases, the group acuity difference was highly significant (U = 13.0, z = −2.56, p = 0.009, r = −0.59 and U = 5.0, z = −3.22, p = 0.001, r = −0.74, respectively).
Altogether, our data indicate a cortical deficit in processing higher SFs that results in lower visual acuity in RTT. As our sample happened to over-represent the AR stage (8 of 11 girls), it remains to be determined whether this impairment is transitory or if it worsens with progression of the disorder.
Discussion
Understanding and treating RTT has been impeded by the challenge of repeatedly and noninvasively testing neuronal function in patients over the course of the disorder. Here, we use the VEP as a common quantitative method to directly compare cortical function in RTT patients and the corresponding mouse model. We found remarkably analogous changes in the waveform and functional impairments of vision in both patients and mice.
Several previous studies measured VEPs in RTT patients, but 4 of these 5 studies used a flash of light rather than a patterned stimulus.14–16,26 The phase-reversing checkerboard stimulus used in our study is preferred for eliciting VEPs in humans because the waveform shape matures early and is least variable within and between individuals compared to any other stimulus, including flash.9,10 To our knowledge, only 1 previous study measured pattern VEPs in RTT; they only found trend-level changes due to a small sample size (n = 11) and broad age range (4–24 years).17 Nevertheless, the trends they found support our results: reduced P1 amplitude and some evidence of reduced visual acuity thresholds. These findings beg for a more comprehensive and systematic analysis of VEPs in RTT patients, which our study provides.
Growing evidence implicates the disruption of excitatory and inhibitory synaptic cortical circuits as key cellular substrates of the pathogenesis in neurodevelopmental disorders, including RTT and other disorders associated with intellectual disability or autism spectrum disorder.27,28 Excitatory/inhibitory balance critically regulates cortical network function, neural network activity (ie, gamma oscillations), and behaviors associated with the expression of cognitive function.29 The dampening of visual cortical responsiveness that we observed in our study may result from a decrease of excitatory drive in favor of inhibition based on substantial evidence in both mice and humans that dendritic growth and arborization and spine density in pyramidal cells are reduced, whereas parvalbumin-positive inhibitory circuits are hyperconnected in mouse models of RTT.6,8,30,33 Because the VEP reflects the summation of postsynaptic potentials in visual cortical circuits, we cannot yet parse out the subcircuits responsible for altering the VEP waveform in RTT. Systematic investigation of the contribution of specific cell types and circuits to VEP using mouse models will provide valuable insight into the cellular and molecular mechanism underlying cortical processing deficiencies in RTT and other disorders.
One of the most well-documented consequences of MECP2 disruption is a reduction in brain-derived neurotrophic factor (BDNF) levels,34 a finding that has inspired clinical trials using IGF-1 (NCT01253317, NCT01777542, NCT01703533) because of the similar effects of IGF-1 and BDNF-1 on several phenotypes associated with MeCP2 deficit. More specifically, there is evidence that MECP2 mutation prevents activity-dependent increases in BDNF, which are related to impaired dendritic growth and spine maturation.35 Notably, BDNF also modulates visual acuity,36–39 supporting our findings that responses to higher spatial frequencies are selectively impaired and acuity is reduced. Reports of altered auditory and somatosensory processing in mouse models of RTT40,41 and RTT patients15,16,26,42,43 suggest that our findings represent a global cortical deficit.
Two limitations of our study are the cross-sectional design and relatively broad age range of participants. Ideally the same girl would be tested across age throughout the stages of the disorder in a longitudinal design. However, as this is a rare disorder (1:10,000) and participants must be recruited from across the country, repeated visits to the same site are often costly and impractical. With this study, we demonstrate the feasibility and utility of collecting VEP in girls with RTT and establish a standard protocol for data collection and analysis that can then be applied in both research and clinical settings. This provides the necessary foundation for the collection of meaningful longitudinal data in future multisite projects for RTT and other neurodevelopmental disorders. Before VEP can be validated as a biomarker of cortical function and used as a quantitative and unbiased out-come measure in clinical trials, further steps must be taken to establish the test–retest reliability within individuals, and in parallel, its sensitivity in detecting response to treatment in patients. Additionally, at this time we cannot exclude a contribution of any ophthalmic abnormalities to the cortical deficits we report in this study. To properly address this, future work should incorporate systematic and complete ophthalmological examinations into the study design at the time of VEP recording.
An important remaining question is whether deficits in cortical processing, like those observed in this study, contribute to or reflect cognitive impairment in RTT. Unfortunately, there is no accurate method to assess intelligence quotient (IQ) in girls with RTT due to confounds from their expressive language and motor impairments.5 Any standard cognitive assessment could severely underestimate capabilities in this population, also precluding any meaningful comparison to an IQ-matched control group. Future work combining cortical processing studies and adaptive cognitive assessment would allow for the proper investigation of these important brain–behavior correlations.
In summary, our study provides the first direct evidence that VEPs can be used to quantify impairments in neural circuit function in RTT across species. This is the first crucial step toward validating VEPs as a biomarker of cortical function throughout the progression of the disorder and in response to treatment.
Acknowledgment
This work was supported by the International Rett Syndrome Foundation (2907, W.E.K.; 3011, M.F.), NIH (U54 HD061222/HD/NICHD, W.E.K.), Translational Research Program at Boston Children’s Hospital (M.F.), and Palmer and Poorvu families (C.A.N.).
We thank O. Khwaja for his intellectual support in the early phases of this project and the families and children who participated in this study.
Footnotes
Potential Conflicts of Interest
None to report.
References
- 1.Amir RE, Van den Veyver IB, Wan M, et al. Rett syndrome is caused by mutations in X-linked MECP2, encoding methyl-CpG-binding protein 2. Nat Genet 1999;23:185–188. [DOI] [PubMed] [Google Scholar]
- 2.Lyst MJ, Bird A. Rett syndrome: a complex disorder with simple roots. Nat Rev Genet 2015;16:261–274. [DOI] [PubMed] [Google Scholar]
- 3.Pohodich AE, Zoghbi HY. Rett syndrome: disruption of epigenetic control of postnatal neurological functions. Hum Mol Genet 2015; ddv217. [DOI] [PMC free article] [PubMed] [Google Scholar]
- 4.Hagberg B, Witt-Engerström I. Rett syndrome: a suggested staging system for describing impairment profile with increasing age towards adolescence. Am J Med Genet 1986;24:47–59. [DOI] [PubMed] [Google Scholar]
- 5.Percy A Rett syndrome: coming to terms with treatment. Adv Neurosci 2014;2014:1–20. [Google Scholar]
- 6.Kron M, Howell CJ, Adams IT, et al. Brain activity mapping in Mecp2 mutant mice reveals functional deficits in forebrain circuits, including key nodes in the default mode network, that are reversed with ketamine treatment. J Neurosci 2012;32:13860–13872. [DOI] [PMC free article] [PubMed] [Google Scholar]
- 7.Della Sala G, Pizzorusso T. Synaptic plasticity and signaling in Rett syndrome. Dev Neurobiol 2014;74:178–196. [DOI] [PubMed] [Google Scholar]
- 8.Durand S, Patrizi A, Quast KB, et al. NMDA receptor regulation prevents regression of visual cortical function in the absence of Mecp2. Neuron 2012;76:1078–1090. [DOI] [PMC free article] [PubMed] [Google Scholar]
- 9.Odom JV, Bach M, Brigell M, et al. ISCEV standard for clinical visual evoked potentials (2009 update). Doc Ophthalmol 2010;120: 111–119. [DOI] [PubMed] [Google Scholar]
- 10.Lenassi E, Likar K, Stirn-Kranjc B, Brecelj J. VEP maturation and visual acuity in infants and preschool children. Doc Ophthalmol 2008;117:111–120. [DOI] [PubMed] [Google Scholar]
- 11.Von Tetzchner S, Jacobsen KH, Smith L, et al. Vision, cognition and developmental characteristics of girls and women with Rett syndrome. Dev Med Child Neurol 1996;38:212–225. [DOI] [PubMed] [Google Scholar]
- 12.Fontanesi J, Haas RH. Cognitive profile of Rett syndrome. J Child Neurol 1988;3(suppl):S20–S24. [DOI] [PubMed] [Google Scholar]
- 13.Neul JL, Kaufmann WE, Glaze DG, et al. Rett syndrome: revised diagnostic criteria and nomenclature. Ann Neurol 2010;68:944–950. [DOI] [PMC free article] [PubMed] [Google Scholar]
- 14.Verma NP, Nigro MA, Hart ZH. Rett syndrome—a gray matter disease? Electrophysiological evidence. Electroencephalogr Clin Neurophysiol 1987;67:327–329. [DOI] [PubMed] [Google Scholar]
- 15.Kálmánchey R Evoked potentials in the Rett syndrome. Brain Dev 1990;12:73–76. [DOI] [PubMed] [Google Scholar]
- 16.Bader GG, Witt-Engerström I, Hagberg B. Neurophysiological findings in the Rett syndrome, II: Visual and auditory brainstem, middle and late evoked responses. Brain Dev 1989;11:110–114. [DOI] [PubMed] [Google Scholar]
- 17.Saunders KJ, McCulloch DL, Kerr AM. Visual function in Rett syndrome. Dev Med Child Neurol 1995;37:496–504. [DOI] [PubMed] [Google Scholar]
- 18.Guy J, Hendrich B, Holmes M, et al. A mouse Mecp2-null mutation causes neurological symptoms that mimic Rett syndrome. Nat Genet 2001;27:322–326. [DOI] [PubMed] [Google Scholar]
- 19.Guy J, Gan J, Selfridge J, et al. Reversal of neurological defects in a mouse model of Rett syndrome. Science 2007;315:1143–1148. [DOI] [PMC free article] [PubMed] [Google Scholar]
- 20.Neul JL, Fang P, Barrish J, et al. Specific mutations in methyl-CpG-binding protein 2 confer different severity in Rett syndrome. Neurology 2008;70:1313–1321. [DOI] [PMC free article] [PubMed] [Google Scholar]
- 21.Cuddapah VA, Pillai RB, Shekar KV, et al. Methyl-CpG-binding protein 2 (MECP2) mutation type is associated with disease severity in Rett syndrome. J Med Genet 2014;51:152–158. [DOI] [PMC free article] [PubMed] [Google Scholar]
- 22.Iyer KK, Bradley AP, Wilson SJ. Conducting shorter VEP tests to estimate visual acuity via assessment of SNR. Doc Ophthalmol 2013;126:21–28. [DOI] [PubMed] [Google Scholar]
- 23.Lenassi E, Likar K, Stirn-Kranjc B, Brecelj J. VEP maturation and visual acuity in infants and preschool children. Doc Ophthalmol 2008;117:111–120. [DOI] [PubMed] [Google Scholar]
- 24.Glaze DG, Percy AK, Skinner S, et al. Epilepsy and the natural history of Rett syndrome. Neurology 2010;74:909–912. [DOI] [PMC free article] [PubMed] [Google Scholar]
- 25.Verrotti A, Manco R, Matricardi S, et al. Antiepileptic drugs and visual function. Pediatr Neurol 2007;36:353–360. [DOI] [PubMed] [Google Scholar]
- 26.Yamanouchi H, Kaga M, Arima M. Abnormal cortical excitability in Rett syndrome. Pediatr Neurol 1993;9:202–206. [DOI] [PubMed] [Google Scholar]
- 27.Chapleau CA, Lane J, Pozzo-Miller L, Percy AK. Rett syndrome: a model of genetic neurodevelopmental disorders. InTech Open Access Publisher, 2013;223–241. [Google Scholar]
- 28.Marín O Interneuron dysfunction in psychiatric disorders. Nat Rev Neurosci 2012;13:107–120. [DOI] [PubMed] [Google Scholar]
- 29.Yizhar O, Fenno LE, Prigge M, et al. Neocortical excitation/inhibition balance in information processing and social dysfunction. Nature 2011;477:171–178. [DOI] [PMC free article] [PubMed] [Google Scholar]
- 30.Dani VS, Chang Q, Maffei A, et al. Reduced cortical activity due to a shift in the balance between excitation and inhibition in a mouse model of Rett syndrome. Proc Natl Acad Sci U S A 2005; 102:12560–12565. [DOI] [PMC free article] [PubMed] [Google Scholar]
- 31.Chapleau CA, Calfa, Gaston D, et al. Dendritic spine pathologies in hippocampal pyramidal neurons from Rett syndrome brain and after expression of Rett-associated MECP2 mutations. Neurobiol Dis 2009;35:219–233. [DOI] [PMC free article] [PubMed] [Google Scholar]
- 32.Armstrong DD, Dunn K, Antalffy B. Decreased dendritic branching in frontal, motor and limbic cortex in Rett syndrome compared with Trisomy 21. J Neuropathol Exp Neurol 1998;57:1013–1017. [DOI] [PubMed] [Google Scholar]
- 33.Kaufmann WE, Macdonald SM, Altamura CR. Dendritic cytos-keletal protein expression in mental retardation: an immunohisto-chemical study of the neocortex in Rett syndrome. Cereb Cortex 2000;10:992–1004. [DOI] [PubMed] [Google Scholar]
- 34.Li W, Pozzo-Miller L. BDNF deregulation in Rett syndrome. Neuropharmacology 2014;76(pt C):737–746. [DOI] [PMC free article] [PubMed] [Google Scholar]
- 35.Zhou Z, Hong EJ, Cohen S, et al. Brain-specific phosphorylation of MeCP2 regulates activity-dependent Bdnf transcription, dendritic growth, and spine maturation. Neuron 2006;52:255–269. [DOI] [PMC free article] [PubMed] [Google Scholar]
- 36.Heimel JA, Saiepour MH, Chakravarthy S, et al. Contrast gain control and cortical TrkB signaling shape visual acuity. Nat Neurosci 2010;13:642–648. [DOI] [PubMed] [Google Scholar]
- 37.Huang ZJ, Kirkwood A, Pizzorusso T, et al. BDNF regulates the maturation of inhibition and the critical period of plasticity in mouse visual cortex. Cell 1999;98:739–755. [DOI] [PubMed] [Google Scholar]
- 38.Cancedda L, Putignano E, Sale A, et al. Acceleration of visual system development by environmental enrichment. J Neurosci 2004; 24:4840–4848. [DOI] [PMC free article] [PubMed] [Google Scholar]
- 39.Sale A, Maya Vetencourt JF, Medini P, et al. Environmental enrichment in adulthood promotes amblyopia recovery through a reduction of intracortical inhibition. Nat Neurosci 2007;10:679–681. [DOI] [PubMed] [Google Scholar]
- 40.Goffin D, Brodkin ES, Blendy JA, et al. Cellular origins of auditory event-related potential deficits in Rett syndrome. Nat Neurosci 2014;17:804–806. [DOI] [PMC free article] [PubMed] [Google Scholar]
- 41.Liao W, Gandal MJ, Ehrlichman RS, et al. MeCP2+/− mouse model of RTT reproduces auditory phenotypes associated with Rett syndrome and replicate select EEG endophenotypes of autism spectrum disorder. Neurobiol Dis 2012;46:88–92. [DOI] [PMC free article] [PubMed] [Google Scholar]
- 42.Stach BA, Stoner WR, Smith SL, Jerger JF. Auditory evoked potentials in Rett syndrome. J Am Acad Audiol 1994;5:226–230. [PubMed] [Google Scholar]
- 43.Stauder JEA, Smeets EEJ, van Mil SGM, Curfs LGM. The development of visual- and auditory processing in Rett syndrome: an ERP study. Brain Dev 2006;28:487–494. [DOI] [PubMed] [Google Scholar]