

Abstract
Comparative docking is based on experimentally determined structures of protein-protein complexes (templates), following the paradigm that proteins with similar sequences and/or structures form similar complexes. Modeling utilizing structure similarity of target monomers to template complexes significantly expands structural coverage of the interactome. Template-based docking by structure alignment can be performed for the entire structures or by aligning targets to the bound interfaces of the experimentally determined complexes. Systematic benchmarking of docking protocols based on full and interface structure alignment showed that both protocols perform similarly, with top 1 docking success rate 26%. However, in terms of the models’ quality, the interface-based docking performed marginally better. The interface-based docking is preferable when one would suspect a significant conformational change in the full protein structure upon binding, e.g., a rearrangement of the domains in multidomain proteins. Importantly, if the same structure is selected as the top template by both full and interface alignment, the docking success rate increases twofold for both top 1 and top 10 predictions. Matching structural annotations of the target and template proteins for template detection, as a computationally less expensive alternative to structural alignment, did not improve the docking performance. Sophisticated remote sequence homology detection added templates to the pool of those identified by structure-based alignment, suggesting that for practical docking, the combination of the structure alignment protocols and the remote sequence homology detection may be useful in order to avoid potential flaws in generation of the structural templates library.
Keywords: protein recognition, structure prediction, template detection, structure similarity, sequence homology
1. INTRODUCTION
Protein docking techniques can be roughly divided into free and comparative (template-based) approaches.1 The free docking paradigm, based on the global search for structural and physicochemical complementarity of protein surfaces, faces challenges when such complementarity is distorted due to conformational changes upon complex formation and/or inherent inaccuracies of the protein structures (e.g. structures obtained by modeling2). Comparative docking is based on experimentally determined structures of protein-protein complexes (templates), following the paradigm that proteins with similar sequences and/or structures form similar complexes.3,4 Modeling utilizing structural similarity of target monomers and template complexes significantly expands structural coverage of the interactome.4 Since the template-based docking methodology is not based on surface complementarity, it is less sensitive to the quality of the individual protein structures, thus performing well in the docking of protein models.2,5 Recent CAPRI rounds showed the power of the template-based approaches compared to the free docking protocols for a number of targets for which good templates for the complex were available.6
Template-based docking by structure alignment most often is performed for the entire structures (full-structure alignment). However, evolutionary conserved surface patches may yield similar binding modes for otherwise dissimilar proteins.7–10 Therefore, structural similarity can also be inferred by aligning the entire structure of the target interactors to the interface parts of the co-crystallized complexes (interface or partial structure alignment). Earlier studies11–15 showed that interface alignment is a useful tool in detecting remote docking templates, provided proper extraction of the interface parts from the full structures. It was also demonstrated4,16 that a significant fraction of structurally similar proteins share sequence identity < 20%, below reliable detection level of earlier sequence-based alignment techniques. However, with the arrival of new sophisticated techniques for detecting remote sequence homologies,17,18 the question of how sequence homology-based docking complements structure-based techniques needs to be revisited. Also, while sensitivity of the docking by full structure alignment to conformational changes upon binding has been extensively tested, such benchmarking of the interface-based alignment methodology has not been performed. In this paper, we address these problems by systematic comparison of docking results yielded by full and interface structure alignment and by remote sequence homology template detection using both bound and unbound monomer structures.
2. METHODS
2.1. Dataset of protein complexes
For this study, 223 two-chain protein complexes were extracted from the DOCKGROUND docking benchmark set 4.0.19 Both bound and unbound protein structures were used in the benchmarking of the docking protocols. For the sequence-based template detection, the sequences were extracted from the SEQRES part of the PDB files.
2.2. Template-based docking by structure alignment
We employed the protocol previously developed in our lab,14,15 which aligns structures of the target monomers either on the entire monomer structures of the template co-crystallized complexes (full structure alignment) or on the templates’ interfaces only (interface alignment). The alignment was performed by TM-align procedure,20 utilizing full-structure (4950 entries) and interface (5936 entries) template libraries from DOCKGROUND.21 To avoid self-hits, templates with TM-score ≥ 0.98 and sequence identity ≥ 95% to a target (for both monomers) were deemed to be identical to that target and thus excluded from consideration. We also left out templates with both UNIPROT IDs (https://www.uniprot.org) identical to those of the target proteins. Top-N docking success rate was defined as a fraction of targets in the dataset, for which at least one near-native model is in the top N docking solutions, ranked by our previously developed combined score.5 Reliability of the docking models based on this score was investigated in our previous work.5 Since the focus of this paper is on comparative benchmarking of the full and interface alignment-based docking, for clarity we concentrated on the prediction assessment based on the reference native structure. Docking models were assessed by the CAPRI criteria22 (acceptable, medium, high quality or incorrect) and by the interface RMSD (i-RMSD). In this study, i-RMSD is defined as the root mean square deviation of ligand (smaller protein in the complex) interface Cα atoms in the docking prediction from the native complex, provided optimal alignment of the receptor (larger protein in the complex). We used this definition, which slightly differs from the one used in CAPRI (RMSD between the native interface residues in the native and the docked complexes) for consistency with the previous studies.4,16
2.3. Template detection by remote sequence homology
To search for templates based on the sequence homology, we employed hidden Markov profile (HMM) comparison method as implemented in the HH-suite17,18 downloaded from https://toolkit.tuebingen.mpg.de/#/tools/hhpred. Multiple sequence alignments for the target sequences were constructed by searching against clustered version of the UNIPROT database using program HHblits. The generated multiple sequence alignment was converted by the hmake tool to HMM profile, which was compared by the HHsearch program to HMM profiles of protein structures from the pdb70 database with the maximum p-value for alignments - 20, and scoring allowed for secondary structure during alignment. PDB IDs common in the ligand and receptor search results were selected and checked if the two chains form a complex. Templates identical to the target complexes (sequence identity ≥ 95 and TM-score ≥ 0.98) were excluded from the consideration. In total, 2415 template complexes were selected for the docking targets in our dataset.
2.4. CATH annotations
Structural annotations were derived from CATH-Gene3D protein structure classification database 4.023 (http://www.cathdb.info) containing annotations for over 235,000 protein domain structures from PDB and ~25,000,000 domain predictions. CATH annotations consist of 4 digits (class, architecture, topology, homology), which makes them easy to compare quantitatively. The annotations were compared separately for the ligands and receptors from targets and structure templates. Only those target and templates were considered, for which both proteins were annotated as single domains by CATH (76 targets, 2082 full and 2745 interface templates). Of the interface templates, 2675 had 80–100% interface coverage (defined as the number of identical residues between the interface and the CATH domain, divided by the length of the interface).
2.5. ECOD annotations
The ECOD database24,25 (http://prodata.swmed.edu/ecod/) classifies protein domains with experimentally solved structures according to evolutionary relationships. The classification scheme consists of five levels: architecture (A), possible homology (X), homology (H), topology (T), and family (F). A and T levels define the secondary structure elements composition and arrangement/connections, respectively. The X-level points to possible homology between domains, typically implied by the fold similarity. Domains in the same H-group likely descended from a common ancestor, as indicated by significant sequence and/or structure scores. Domains in the same F-group have significant sequence similarity, primarily based on Pfam26 and perform same functions, as described in the literature. Domain annotations for target and template proteins were extracted from the local ECOD copy, which contained ~100,000 protein structures clustered into ~9,000 F-groups and ~2,000 H-groups. The annotations were compared based on all four ECOD categories (4 digits of domain ID provided by ECOD) separately for the targets and structure templates.
3. RESULTS AND DISCUSSION
3.1. Structure alignment-based docking success rates
Docking success rates were determined for the full set of 223 targets. Template-based docking by design is a coarse-grained approach. To some extent it involves the notion of surface complementarity, at least implicitly, as in the structure alignment of the targets to the co-crystallized interface templates. However, due to the nature of the template-based docking (structure superposition), the surface complementarity is obviously less critical for this approach than for the free docking, where it is the key foundation for the prediction.1 Typical difference between bound and unbound protein conformations is to a large extent restricted to the surface sidechains.27 Such difference is still a significant obstacle to the free docking, where most approaches are rigid-body, atomic resolution.1 However, in the structure alignment-based approach (e.g. based on TM-align20) the side chains are not even included in the consideration. Thus, one can expect that, as opposed to the free docking, the results of bound and unbound template-based docking are similar, as indeed our benchmarking showed (Figure 1).
FIGURE 1. Success rates of structure alignment docking protocols.

Success rate is defined as a fraction of complexes for which at least one near-native model is in top N (N = 1, 10 and 100 docking predictions. Near-native models are defined either as (A) the ones with i-RMSD < 10 Å or (B) acceptable and better quality according to CAPRI criteria. Gray parts of the bars correspond to targets with only lower accuracy near-native models (5 Å < i-RMSD < 10 Å) in top N predictions. The full set consists of 223 two-chain protein complexes from the DOCKGROUND benchmark 4. The subset (common templates set) is 75 complexes for which the same templates were selected for top-1 model by both protocols.
Success rates for higher accuracy docking (according to i-RMSD) obtained in this study correlate well with the values from the earlier studies13–15 performed on different datasets of target and template protein complexes. For example, top-1 full structure alignment success rate for higher accuracy docking of bound structures is 26% (Table 1 and Figure 1A) compared to 27.6% reported in Ref. 13 When lower quality docking predictions are included (gray portions of the bars in Figure 1A), at least one near-native docking prediction (albeit irrespectively of the rank) is generated by both protocols for all targets in the dataset.
TABLE 1.
Number of top 1 docking models within different near-native quality categories, generated by full and interface structure alignment protocols, ranked by the combined score.5
| Quality category | Full set (1) |
Common set (2) | ||||
|---|---|---|---|---|---|---|
| Full alignment | Interface alignment | |||||
| B (3) | U (4) | B | U | B | U | |
|
Quality according to interface RMSD | ||||||
| Higher (5) | 58 | 55 | 63 | 62 | 40 | 35 |
| Lower (6) | 29 | 22 | 17 | 19 | 8 | 6 |
|
Quality according to CAPRI criteria (7) | ||||||
| High | 25 | 25 | 38 | 34 | 25 | 22 |
| Medium | 21 | 20 | 15 | 16 | 17 | 15 |
| Acceptable | 10 | 7 | 8 | 11 | 5 | 5 |
223 binary protein-protein complexes from DOCKGROUND Benchmark Set 4.19
Subset of the full set, for which top 1 model was build using the same template by both full and interface protocols (75 complexes)
Bound proteins as targets
Unbound proteins as targets
Interface RMSD (i-RMSD) < 5 Å
5 Å < i-RMSD < 10 Å
From Ref. 30
Success rates for the near-native predictions according to CAPRI criteria are, however, lower than those obtained previously in the studies on docking of modeled protein structures.2 The difference is due to less strict conditions for exclusion of similar target/template pairs in the previous study, because of its specific focus on correlating the accuracy of docking with the structural quality of the individual protein models. Success rates for the near-native predictions according to CAPRI are lower than those defined by i-RMSD only (Figure 1A), indicating importance of diverse metrics for evaluation of model quality (e.g. fraction of the native contacts in the CAPRI criteria).
For a subset of 75 targets (33.6% of the full set), the same template was selected for the top-1 model by both full and interface alignment protocols (hereafter this subset is referred to as common-templates set). Within that set, the success rate for all docking protocols increases dramatically (e.g. more than twofold for the top-1 models according to CAPRI criteria) compared to the success rates in the full set (as seen by comparison of cyan and yellow bars in Figure 1). Thus, if a docking model has both global and local structural similarity to the same template, there is high chance that this model is correct.
3.2. Docking quality of structure-alignment protocols
Overall, full and interface structure alignment docking performed nearly equally well in bound and unbound docking (e.g., in top 10 predictions, the difference in the docking success rate is only 0.3%). However, by combining both structure alignment protocols, the docking success rates increase, albeit slightly, both in terms of the CAPRI (Figure S1) and the higher-quality i-RMSD (Table S1) criteria. The interface alignment docking yielded more top 1 high accuracy predictions for bound and unbound proteins than the full alignment (Table 1). However, this advantage was less significant for the lower accuracy/ranking models. For 193 bound and 200 unbound complexes, top 1 full and interface alignment docking predictions were in the same CAPRI quality category (Figure 2). For 8 targets interface alignment docking was in better quality category than the full alignment docking. Only for 1 bound and 3 unbound targets the interface alignment docking was in the worse quality category. However, there was significant number of targets for which the near-native model was generated by one protocol and an incorrect prediction by the other protocol (several such examples are described below).
FIGURE 2. Quality of top 1 full and interface-based models.
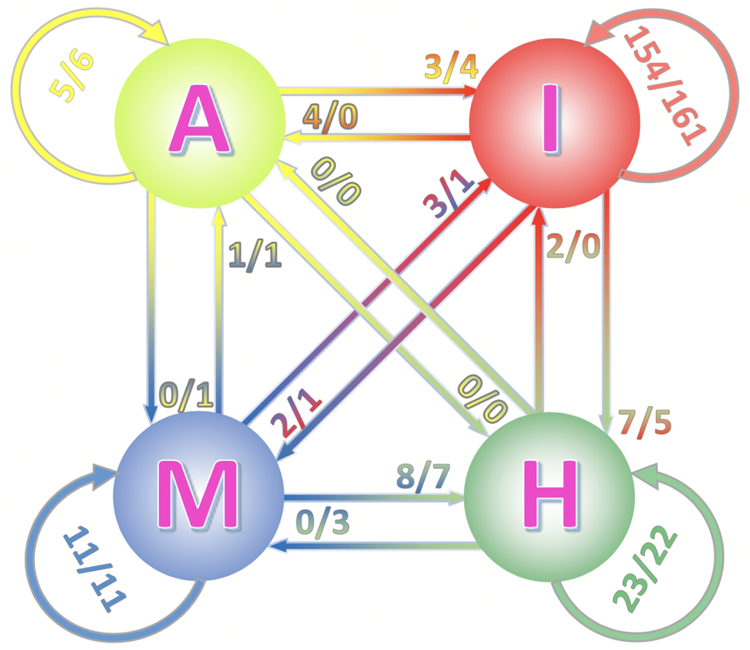
The quality categories: incorrect (I), acceptable (A), medium (M) and high (H) are according to CAPRI criteria. The number at the circular arrows is the number of bound/unbound model pairs, which belong to the same category in full and interface alignment. The numbers at straight arrows are the number of model pairs that change category in full and interface alignment protocols (arrows indicate transition from the full to the interface models).
Correlation of i-RMSD values of the near-native docking predictions for the targets in the common set (Figure 3) showed similar performance of both protocols for bound and unbound proteins (47% and 42% of data points above the diagonal in Figures 3A and 3B, respectively). However, there was a greater difference in performance of these protocols for the top-1 predictions. Interface alignment yielded better predictions for the bound proteins (74% of the top-1 points in Figure 3A below the diagonal), whereas full alignment performed better for the unbound proteins (55% of the top-1 points above the diagonal in Figure 3B). Overall, the full alignment protocol was not sensitive to the differences between bound and unbound structures. However, for the top-1 predictions, bound docking was significantly better (49% of all and 77% of top-1 predictions in Figure 3C above the diagonal). The interface alignment docking of unbound proteins, on average, yielded worse results than that of the bound proteins, irrespective of the rank (58% of all and 73% of top-1 predictions in Figure 3D above the diagonal). The obvious reason is a greater sensitivity of the interface alignment to the conformational mismatch of protein surfaces at the interface. Although conformational changes upon binding affect both protocols, on average, the quality of the top-1 models can be improved if the unbound structures are re-docked by the full alignment protocol using the templates identified by the interface alignment (points above the diagonal in Figure 3B correspond to the improved accuracy after full structure alignment).
FIGURE 3. Correlation of prediction accuracy when the same template is selected by different docking protocols.

All predictions are of acceptable or better quality according to CAPRI criteria.
3.3. Correct prediction due to fold similarity
We analyzed successful predictions by full alignment in which the interface alignment failed (four examples are in Figure 4). One reason for the interface alignment failure was a trivial structure of the interface template (e.g., one or both interface components consisted of a single α-helix, β-strand or loop). For example, top-1 interface templates for the targets 3d3cAJ and 2bkuAB (hereafter targets and templates will be referred to by their PDB code followed by chain IDs) consist of two helices, one on each side of the interface (Figure S2D) and a single unstructured loop on one interface side (Figure S3D), respectively. In the former example, the template originated from the homodimeric biounit and its α-helices align perfectly to the helices on the receptor non-interface (Figure S2E) and ligand interface (Figure S2F). These alignments have relatively high TM-scores (Table 2a) bringing this structure (3eqsAA, Figure S2D) to the top of the template list. In the latter example, unstructured template part aligned to a random place in the target receptor (Figure S3E). However, alignment of the ligands was almost perfect (Figure S3F) which made this structure (3ch5AB) top-1 interface template. In both cases position of the ligand in the interface-based predictions was far from the native (Figures 4A and B, right-hand panels).
FIGURE 4. Examples of top 1 docking predictions generated for targets with better quality of the full alignment-based model.

(A) E. coli complex of N utilization substance protein B and 30S ribosomal protein S10 (3d3cAJ),31 (B) yeast Importin beta-1 subunit bound to GTP-binding nuclear protein RAN from Canis lupus familiaris (2bkuBA),34 (C) human epidermal growth factor in complex with its receptor (1nqlBA),37 and (D) Evasin-1 protein from brown dock tick bound to human chemokine 3 (3fpuAB).39 Receptor is in green, ligand of the docking model is in dark blue, and ligand of the native structure is in cyan. In the right-hand panel A, interface of the native receptor is in blue and that of the ligand in red. Additional information, including analysis, is in Figures S1 – S4 and Table 2.
TABLE 2.
Characteristics of top 1 docking models for examples of targets with better results by full alignment. References in the table are the primary publications describing corresponding PDB structures.
| Docking protocol | Template | Quality category (1) | i-RMSD (Å) | TM-score receptors | TM-score ligands | |
|---|---|---|---|---|---|---|
|
(a) NusB/S10 transcription anti-termination complex (3d3c)31 | ||||||
| Full | B (2) | 3fru32 | Acceptable | 3.9 | 0.39 | 0.49 |
| Interface (3) | B | 3eqs33 | Incorrect | 13.3 | 0.40 | 0.46 |
|
(b) GTP-binding nuclear protein RAN/ importin beta-1 subunit complex (2bku)34 | ||||||
| Full | U (4) | 1ibr35 | Medium | 1.7 | 0.5 | 0.73 |
| Interface | U | 3ch536 | Incorrect | 24.0 | 0.3 | 0.76 |
|
(c) Epidermal growth factor (EGF) / EGF receptor complex (1nql)37 | ||||||
| Full | B | 3ltg38 | Acceptable | 2.3 | 0.43 | 0.63 |
| Interface | B | 3ltg (5) | Incorrect | 5.8 | 0.40 | 0.60 |
|
(d) Evasin-1: C-C motif chemokine 3 (3fpu)39 | ||||||
| Full | B | 1dok40 | Medium | 1.9 | 0.30 | 0.82 |
| Interface | B | 1icw41 | Incorrect | 10.4 | 0.30 | 0.67 |
By CAPRI criteria from Ref. 30
Bound proteins as targets
TM-scores normalized by the smaller interface fragment
Unbound proteins as targets
Reference not available
Receptors of the 3d3cAJ target and top-1 full structure template did not have significant structural similarity (Figure S2B and Table 2a). However, they bound highly similar ligands (Figure S2C and Table 2a) at the same binding site. Thus, full alignment yielded acceptable quality model (Figure 4A, left-hand panel). For 2bkuAB, the shorter template receptor aligned perfectly to the part of the target receptor, which is relevant for binding (Figure S3B and Table 2b). Target and template ligand structures were very similar (Figure S3C and Table 2b). Thus, resulting full alignment model was of medium quality (Figure 4B, left-hand panel).
For the second group of targets with better top-1 full alignment models, the interface structure of the top-1 interface template was more complex. However, due to the partial misalignment of the template interface to the target, ligand shifted away from the native position (Figure 4C and D and Table 2c and d). For example, for target 1nqlAB, both full and interface alignments selected the same top-1 template (Figures S4A and D, respectively). Target and template ligands were structurally almost identical (Figures S4C and F). However, for the receptors, there was a significant difference in the binding domain arrangements. This led to the misalignment of the main binding domain in the interface alignment (Figure S4E), whereas in the full alignment the main binding domains were aligned correctly (Figure S4B). For another target in this group, 3fpuAB, both full and interface alignments selected top-1 templates (Figures S5A and D) with similar ligand structures (Figures S5C, F and Table 2d), but dissimilar receptor structures (Figures S5B, E and Table 2d). However, the full alignment template (Figure S5A) had the main interface structural motif (two loops in conformation close to a β-strand) similar to that in the target. The full-structure protocol correctly aligned interface parts of the target and template receptors (Figure S5B). The interface template had a more structured interface (Figure S5D) and thus the interface protocol emphasized alignment of secondary structure elements away from the target receptor interface (Figure S5E).
3.4. Correct prediction due to interface similarity
The main reason for better performance of the interface alignment was conformational difference between non-interface parts of the target and template that lead to improper matching of the interfaces in the full alignment. Such changes were usually small, thus ligand positions in the full and interface-only predictions were less different than in the above examples with the better full alignment performance (Figure 5 and Table 3). For example, for target 3mj7AB, both top-1 full (Figure S6A) and interface (Figure S6D) templates were structurally similar for both receptors (Figures S6B, E) and ligands (Figures S6C, F). However, the full alignment template had a slightly different arrangement of non-interface β-strands than in the target, resulting in a larger shift of the ligand in the full alignment prediction than in the interface-only one (Figure 5, Table 3a).
FIGURE 5. Examples of top 1 docking predictions generated for targets with better quality of the interface alignment-based model.

(A) Mouse complex of junctional adhesion molecule-like and Coxsackievirus and adenovirus receptor homolog (3mj7AB),42 (B) archaeal homolog of the human protein complex Rpp21-Rpp29 from Pyrococcus horikoshii (2zaeAB),45 (C) human complex of Endothelial PAS domain-containing protein 1 and Aryl hydrocarbon receptor nuclear translocator (3f1pAB),48 and (D) VipD protein from Legionella pneumophila bound to human Ras-related protein Rab-5C (4kyiAB).51 Receptor is in green, ligand of the docking model is in dark blue, and ligand of the native structure is in cyan. Additional information, including analysis, is in Figures S5 – S8 and Table 3.
TABLE 3.
Characteristics of top 1 docking models for examples of targets with better results by interface alignment. References in the table are primary publications describing corresponding PDB structures. For additional explanations, see footnotes to Table 2.
| Docking protocol | Template | Quality category | i-RMSD (Å) | TM-score receptors | TM-score ligands | |
|---|---|---|---|---|---|---|
|
(a) JAML – CAR complex (3mj7)42 | ||||||
| Full | B | 2pkd43 | Incorrect | 5.9 | 0.40 | 0.46 |
| Interface | B | 1eaj44 | Acceptable | 3.0 | 0.67 | 0.78 |
|
(b) Ribonuclease P protein component 1 /component 4 (2zae)45 | ||||||
| Full | B | 1utu46 | Incorrect | 5.9 | 0.26 | 0.42 |
| Interface | B | 3kaw47 | Acceptable | 2.9 | 0.30 | 0.53 |
|
(c) HIF2 alpha / ARNT C-terminal PAS domain (3f1p)48 | ||||||
| Full | B | 3gdi49 | Incorrect | 8.2 | 0.86 | 0.83 |
| Interface | B | 3rkc50 | Medium | 1.3 | 0.40 | 0.4 |
|
(d) Phospholipase VipD / GTPase Rab5 (4kyi)51 | ||||||
| Full | B | 1nf352 | Incorrect | 15.9 | 0.10 | 0.91 |
| Interface | B | 1z0j53 | Acceptable | 2.5 | 0.68 | 0.88 |
In target 2zaeAB, receptor with primarily β-strand structure interacts with a predominantly α-helical ligand (Figure 5B and Table 3b). However, both top-1 full (Figure S7A) and interface (Fig S7D) templates are exclusively α-helical. Thus, target and template receptors were poorly aligned by both full (Figure S7B) and interface (Figure S7E) protocols, while ligand interface helices were well aligned to the interface helices of the full (Figure S7C) and interface (Figure S7F) templates. However, target receptor interface contains rudimental α-helices, which align to the interface α-helices of the interface template, yielding medium-quality interface alignment model. The full alignment template is significantly larger than the interface templates. Thus, these target helices are too short to contribute significantly to the full alignment, leading to the incorrect prediction.
Interface of target 3f1pAB mainly consists of two β–sheets (Figure 5C). However, top-1 full alignment template (Figure S8A) contains additional interacting domains, and relative positions of the interacting β–sheets differ, albeit slightly, from that in the target. Nevertheless, that difference yielded incorrect prediction (Figure 5C, left-hand panel), despite good full alignments of both receptors (Figure S8B) and ligands (Figure S8C). Top-1 interface template (Figure S8D) contains correctly arranged interacting β–sheets. Thus, good interface alignments of both receptors and ligands produced acceptable prediction (Figure 5C, right-hand panel).
A significant difference between top-1 full and interface alignment predictions was observed for target 4kyiAB (Figure 5D and Table 3d). Top-1 full (Figure S9A) and interface alignments (Figure S9D) identified ligands structurally nearly identical to the target ligand (Figures S9C, F). However, these ligands bind structurally dissimilar proteins at different binding sites. Thus, the full alignment matched template receptor to a random non-interface part of the target receptor (Figure S9B), which resulted in incorrect prediction with a large shift of ligand from the native position (Figure 5D, left-hand panel). At the same time, two helices of the interface template were aligned correctly to the interface helices of the target receptor (Figure S9E), yielding an accurate prediction (Figure 5D, right-hand panel).
3.5. Matching structural/evolutionary annotations of targets and templates
Both full and interface template-based docking protocols detect structural similarity of protein complexes by computationally expensive structure alignment algorithms, which have matching of the secondary structure elements of the target and the template embedded in the protocol. However, the mutual arrangement the secondary structure elements is categorized by the domain descriptions. Thus, it is interesting to investigate if a template can be detected by simply matching structural annotations from pre-compiled databases, such as CATH23 or ECOD.24,25 When tested, only a fraction of targets in the dataset (~12%) had a top-1 template with all CATH annotations matching, and ~40% of these templates yielded incorrect docking models (Table 4). Only 31% of full and 26% of interface top-1 templates, which produced near-native docking models, had the same CATH annotations as the target proteins. All matching ECOD annotations were observed for a larger number of the top-1 templates, and a similar portion of them (~40%) generated incorrect docking models (Table 4). About half (53% of full and 51% of interface) of top-1 templates with the near-native models had target and templates that belong to the same F-group. For the common dataset, 19% and 43% of the targets with top-1 near-native models had templates with all matching CATH and ECOD annotations, respectively.
TABLE 4.
Docking of unbound proteins in DOCKGROUND benchmark set 4 with matching target/template structure annotation.
| Subset of docking models | (1) |
|
(3) | (4) | (5) | (6) | |
|---|---|---|---|---|---|---|---|
|
CATH annotations | |||||||
| Full alignment | |||||||
| Top 1 | 27 | 27(20)(7) | 16 | 16(12) | 11 | 11(8) | |
| All | 277 | 32 | 62 | 18 | 215 | 19 | |
| Interface alignment | |||||||
| Top 1 | 25 | 25 | 16 | 16 | 9 | 9 | |
| All | 359 | 32 | 87 | 18 | 272 | 19 | |
|
ECOD annotations | |||||||
| Full alignment | |||||||
| Top 1 | 50 | 50 (36) | 28 | 28 (18) | 22 | 22 (18) | |
| All | 247 | 56 | 55 | 32 | 192 | 34 | |
| Interface alignment | |||||||
| Top 1 | 51 | 51 | 31 | 31 | 20 | 20 | |
| All | 338 | 61 | 75 | 33 | 263 | 39 | |
Total number of models with all matching annotations.
Total number of targets with at least one model having all matching annotations.
Number of near-native models (acceptable or better, according to CAPRI criteria) with all matching annotations.
Number of targets with at least one near-native model having all matching annotations.
Number of incorrect models with all matching annotations.
Number of targets with at least one incorrect model having all matching annotations.
Numbers in parenthesis is the number of targets for which both structure alignment protocols select the same top-1 template.
About half of the targets with the incorrect docking models, but matching structural CATH or ECOD annotations, were signaling proteins. Other functional groups were immune system, viral and transport proteins, chaperons, etc. (see Figure S10 for the full list). Figure 6 shows an example where the target and the top-1 template, involved in chemotaxis/signal transduction, have the same CATH and ECOD annotations. The TM-scores between target and template monomers indicate high structural similarity (0.87 for ligands and 0.79 for receptors). However, the binding sites for the two complexes do not overlap. Interestingly, the interface alignment protocol, which by design focuses on similar structural motifs of distinct binding sites, also selected this wrong template. In general, when the templates have the same CATH/ECOD annotations as the targets, the predicted docked structure is correct except when the protein has alternative binding sites (as seen in signaling proteins, shown in Figures 6 and S10).
FIGURE 6. Example of a target-template pair with structurally similar proteins and matching CATH and ECOD annotations, but different binding sites.
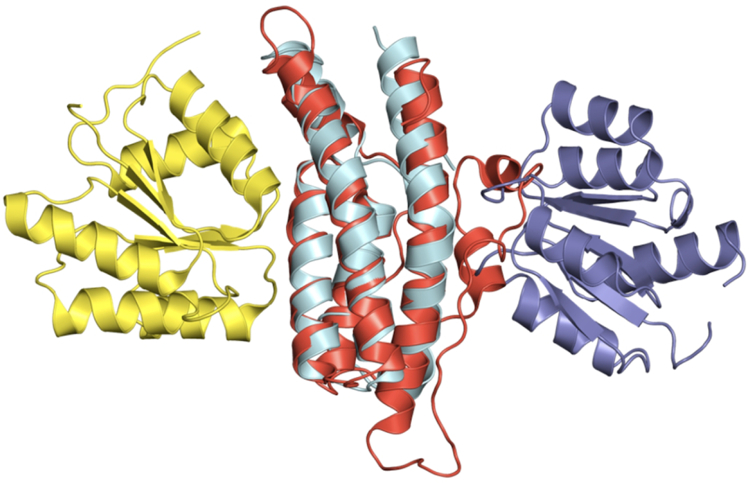
The target, Escherichia coli histidine-containing phosphotransfer (HPt) domain of anaerobic sensor protein ArcB bound to chemotaxis response regulator CheY (1bdjBA),54 is in cyan and dark blue. The top-1 template selected by both full and interface alignment protocols, yeast phosphorelay intermediate protein YPD1 bound to osmo-sensing histidine protein kinase SLN1-R1 (2r25AB),55 is in red and yellow.
Thus, the results showed that simple matching of structural annotations is not a reliable way to detect templates yielding near-native docking predictions. Such annotations, to a significant extent, are based on evolutionary relationships between proteins, and evolution may “design” different quaternary structures to perform similar functions and vice versa. More sophisticated structure-function relationships can be beneficial for comparative docking (e.g. see our earlier paper on improved template selection by gene onthology28) but are outside the scope of this study.
3.6. Adding templates detected by remote sequence homology
At the dawn of the structure-based comparative docking,11,15,29 sequence alignment algorithms reliably identified templates with sequence identities > 20%. A number of templates found by full and interface structure alignment (5%) has sequence identity below that threshold. However, more recently, new techniques for detection of remote sequence homology have been developed. Thus, we re-investigated to what degree sequence- and structure-based algorithms can complement each other. By combining full and interface structure alignment and HHsearch17,18 procedures we were able to detect templates yielding near-native docking models for 194 targets (87%) in the dataset (Figure 7). Only for 10 targets, such templates (14 PDB structures) were found solely by the HHsearch. However, these templates were either structures deposited to PDB after the DOCKGROUND template library was generated, or contained structural defects that warranted their exclusion from the template library.21 On the other hand, templates yielding near-native predictions were found for a significant number of targets solely by either flavor of the structure-based detection (20 and 17 targets by the full and the interface alignment, respectively). These results indicate that provided up-to-date template libraries, the combination of the full and the interface structure alignment remains a powerful tool for protein-protein docking. However, remote sequence homology approaches may add templates missed by the structural alignment due to imperfect selection criteria for inclusion in the template library.
FIGURE 7. Number of targets with near native prediction by different alignment protocols.
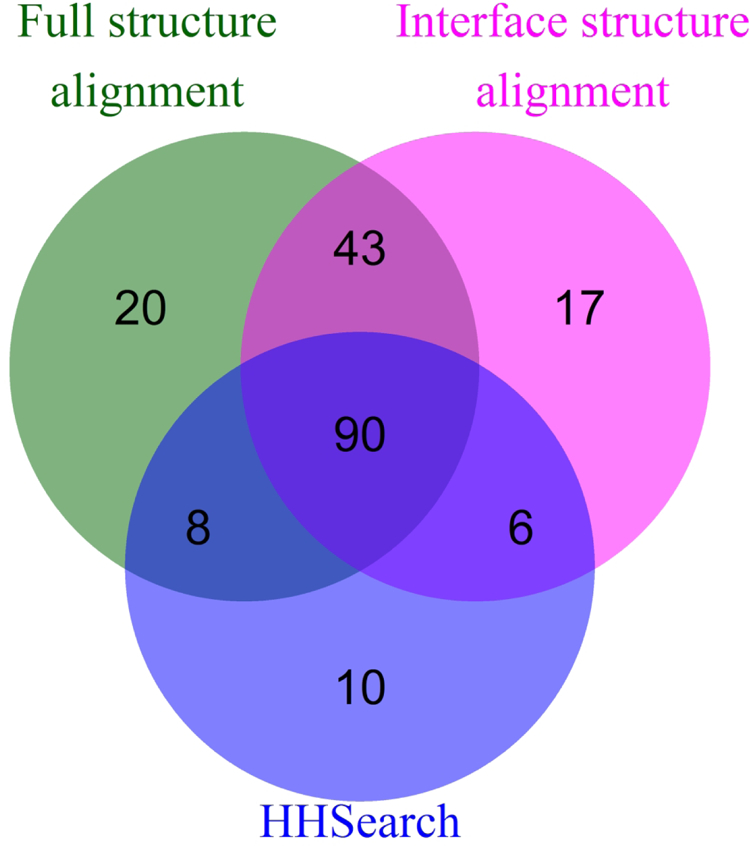
The near native prediction is defined as one of acceptable or better quality according to CAPRI criteria.
4. CONCLUDING REMARKS
We present a comparative benchmarking of docking protocols based on full and interface structural alignment to detect docking templates. The docking was performed using both bound and unbound proteins from DOCKGROUND benchmark set 4. There were no significant differences in success rates and quality of the resulting models between bound and unbound docking in either protocol, reflecting the coarse-grained nature of the alignment. Overall, interface-based docking performed marginally better than the full-alignment protocol in terms of quality of the resulting docking models (defined by interface RMSD and the CAPRI criteria). The interface-based docking should be recommended when one would suspect a significant conformational change in the full protein structure upon binding, for example, a rearrangement of the domains in multidomain proteins. Importantly, if the same structure is selected as the top template by both full and interface alignments, the docking success rate increases dramatically. Many templates identified by simple matching of target/template structural annotations had alternative binding sites. Thus, such template detection approach should be used with caution. Sophisticated remote sequence homology detection added templates to those identified by structure-based alignment. However, this resulted from the use of outdated template libraries and too stringent selection criteria applied for the generation of the DOCKGROUND template library. Still, for practical docking, the combination of the structure alignment protocols and remote sequence homology detection may be optimal. In our study, combining these template detection methods, we were able to generate near-native models for 87% of complexes in our dataset.
Supplementary Material
ACKNOWLEDGEMENTS
The study was supported by NIH grant R01GM074255 and NSF grants DBI1917263 and DBI1565107.
REFERENCES
- 1.Vakser IA. Protein-protein docking: From interaction to interactome. Biophys J 2014;107:1785–1793. [DOI] [PMC free article] [PubMed] [Google Scholar]
- 2.Anishchenko I, Kundrotas PJ, Vakser IA. Modeling complexes of modeled proteins. Proteins 2017;85:470–478. [DOI] [PMC free article] [PubMed] [Google Scholar]
- 3.Aloy P, Ceulemans H, Stark A, Russell RB. The relationship between sequence and interaction divergence in proteins. J Mol Biol 2003;332:989–998. [DOI] [PubMed] [Google Scholar]
- 4.Kundrotas PJ, Zhu Z, Janin J, Vakser IA. Templates are available to model nearly all complexes of structurally characterized proteins. Proc Natl Acad Sci USA 2012;109:9438–9441. [DOI] [PMC free article] [PubMed] [Google Scholar]
- 5.Kundrotas PJ, Anishchenko I, Badal VD, Das M, Dauzhenka T, Vakser IA. Modeling CAPRI targets 110–120 by template-based and free docking using contact potential and combined scoring function. Proteins 2018;86(S1):302–310. [DOI] [PMC free article] [PubMed] [Google Scholar]
- 6.Lensink MF, Brysbaert G, Nadzirin N, et al. Blind prediction of homo- and hetero-protein complexes: The CASP13-CAPRI experiment. Proteins 2019;87:1200–1221. [DOI] [PMC free article] [PubMed] [Google Scholar]
- 7.Keskin O, Nussinov R. Favorable scaffolds: proteins with different sequence, structure and function may associate in similar ways. Protein Eng 2005;18:11–24. [DOI] [PubMed] [Google Scholar]
- 8.Keskin O, Nussinov R. Similar binding sites and different partners: Implications to shared proteins in cellular pathways. Structure 2007;15:341–354. [DOI] [PubMed] [Google Scholar]
- 9.Petrey D, Fischer M, Honig B. Structural relationships among proteins with different global topologies and their implications for function annotation strategies. Proc Natl Acad Sci USA 2009;106:17377–17382. [DOI] [PMC free article] [PubMed] [Google Scholar]
- 10.Zhang QC, Petrey D, Norel R, Honig BH. Protein interface conservation across structure space. Proc Natl Acad Sci USA 2010;107:10896–10901. [DOI] [PMC free article] [PubMed] [Google Scholar]
- 11.Tuncbag N, Gursoy A, Nussinov R, Keskin O. Predicting protein-protein interactions on a proteome scale by matching evolutionary and structural similarities at interfaces using PRISM. Nature Prot 2011;6:1341–1354. [DOI] [PMC free article] [PubMed] [Google Scholar]
- 12.Tuncbag N, Keskin O, Nussinov R, Gursoy A. Fast and accurate modeling of protein-protein interactions by combining template-interface-based docking with flexible refinement. Proteins 2012;80:1239–1249. [DOI] [PMC free article] [PubMed] [Google Scholar]
- 13.Kundrotas PJ, Vakser IA. Global and local structural similarity in protein-protein complexes: Implications for template-based docking. Proteins 2013;81:2137–2142. [DOI] [PMC free article] [PubMed] [Google Scholar]
- 14.Sinha R, Kundrotas PJ, Vakser IA. Protein docking by the interface structure similarity: How much structure is needed? PloS One 2012;7:e31349. [DOI] [PMC free article] [PubMed] [Google Scholar]
- 15.Sinha R, Kundrotas PJ, Vakser IA. Docking by structural similarity at protein-protein interfaces. Proteins 2010;78:3235–3241. [DOI] [PMC free article] [PubMed] [Google Scholar]
- 16.Kundrotas PJ, Vakser IA, Janin J. Structural templates for modeling homodimers. Protein Sci 2013;22:1655–1663. [DOI] [PMC free article] [PubMed] [Google Scholar]
- 17.Remmert M, Biegert A, Hauser A, Söding J. HHblits: Lightning-fast iterative protein sequence searching by HMM-HMM alignment. Nature Methods 2012;9:173–175. [DOI] [PubMed] [Google Scholar]
- 18.Soding J Protein homology detection by HMM-HMM comparison. Bioinformatics 2005;21:951–960. [DOI] [PubMed] [Google Scholar]
- 19.Kundrotas PJ, Anishchenko I, Dauzhenka T, et al. Dockground: A comprehensive data resource for modeling of protein complexes. Protein Sci 2018;27:172–181. [DOI] [PMC free article] [PubMed] [Google Scholar]
- 20.Zhang Y, Skolnick J. TM-align: A protein structure alignment algorithm based on the TM-score. Nucl Acids Res 2005;33:2302–2309. [DOI] [PMC free article] [PubMed] [Google Scholar]
- 21.Anishchenko I, Kundrotas PJ, Tuzikov AV, Vakser IA. Structural templates for comparative protein docking. Proteins 2015;83:1563–1570. [DOI] [PMC free article] [PubMed] [Google Scholar]
- 22.Lensink MF, Wodak SJ. Docking, scoring, and affinity prediction in CAPRI. Proteins 2013;81:2082–2095. [DOI] [PubMed] [Google Scholar]
- 23.Sillitoe I, Lewis TE, Cuff A, et al. CATH: Comprehensive structural and functional annotations for genome sequences. Nucl Acids Res 2015;43:D376–381. [DOI] [PMC free article] [PubMed] [Google Scholar]
- 24.Cheng H, Liao Y, Schaeffer RD, Grishin NV. Manual classification strategies in the ECOD database. Proteins 2015;83:1238–1251. [DOI] [PMC free article] [PubMed] [Google Scholar]
- 25.Cheng H, Schaeffer RD, Liao Y, et al. ECOD: An evolutionary classification of protein domains. PLoS Comp Biol 2014;10:e1003926. [DOI] [PMC free article] [PubMed] [Google Scholar]
- 26.Murzin AG, Brenner SE, Hubbard T, Chothia C. SCOP: A structural classification of proteins database for the investigation of sequences and structures. J Mol Biol 1995;247:536–540. [DOI] [PubMed] [Google Scholar]
- 27.Ruvinsky AM, Kirys T, Tuzikov AV, Vakser IA. Side-chain conformational changes upon protein-protein association. J Mol Biol 2011;408:356–365. [DOI] [PMC free article] [PubMed] [Google Scholar]
- 28.Hadarovich A, Anishchenko I, Tuzikov AV, Kundrotas PJ, Vakser IA. Gene ontology improves template selection in comparative protein docking. Proteins 2019;87:245–253. [DOI] [PMC free article] [PubMed] [Google Scholar]
- 29.Zhang QC, Petrey D, Deng L, et al. Structure-based prediction of protein-protein interactions on a genome-wide scale. Nature 2012;490:556–560. [DOI] [PMC free article] [PubMed] [Google Scholar]
- 30.Lensink MF, Mendez R, Wodak SJ. Docking and scoring protein complexes: CAPRI 3rd edition. Proteins 2007;69:704–718. [DOI] [PubMed] [Google Scholar]
- 31.Luo X, Hsiao HH, Bubunenko M, et al. Structural and functional analysis of the E. coli NusB-S10 transcription antitermination complex. Mol Cell 2008;32:791–802. [DOI] [PMC free article] [PubMed] [Google Scholar]
- 32.Vaughn DE, Bjorkman PJ. Structural basis of pH-dependent antibody binding by the neonatal Fc receptor. Structure 1998;6:63–73. [DOI] [PubMed] [Google Scholar]
- 33.Pazgier M, Liu M, Zou G, et al. Structural basis for high-affinity peptide inhibition of p53 interactions with MDM2 and MDMX. Proc Natl Acad Sci USA 2009;106:4665–4670. [DOI] [PMC free article] [PubMed] [Google Scholar]
- 34.Lee SJ, Matsuura Y, Liu SM, Stewart M. Structural basis for nuclear import complex dissociation by RanGTP. Nature 2005;435:693–696. [DOI] [PubMed] [Google Scholar]
- 35.Vetter IR, Arndt A, Kutay U, Görlich D, Wittinghofer A. Structural view of the Ran–importin β interaction at 2.3 Å resolution. Cell 1999;97:635–646. [DOI] [PubMed] [Google Scholar]
- 36.Schrader N, Koerner C, Koessmeier K, et al. The crystal structure of the Ran-Nup153ZnF2 complex: A general Ran docking site at the nuclear pore complex. Structure 2008;16:1116–1125. [DOI] [PubMed] [Google Scholar]
- 37.Ferguson KM, Berger MB, Mendrola JM, Cho H-S, Leahy DJ, Lemmon MA. EGF activates its receptor by removing interactions that autoinhibit ectodomain dimerization. Molecular Cell 2003;11:507–517. [DOI] [PubMed] [Google Scholar]
- 38.Alvarado D, Klein DE, Lemmon MA. Structural basis for negative cooperativity in growth factor binding to an EGF receptor. Cell 2010;142:568–579. [DOI] [PMC free article] [PubMed] [Google Scholar]
- 39.Dias JM, Losberger C, Déruaz M, Power CA, Proudfoot AE, Shaw JP. Structural basis of chemokine sequestration by a tick chemokine binding protein: The crystal structure of the complex between Evasin-1 and CCL3. PLoS One 2009;4:e8514. [DOI] [PMC free article] [PubMed] [Google Scholar]
- 40.Lubkowski J, Bujacz G, Boque L, Alexander W. The structure of MCP-1 in two crystal forms provides a rare example of variable quaternary interactions. Nature Struc Mol Biol 1997;4:64. [DOI] [PubMed] [Google Scholar]
- 41.Eigenbrot C, Lowman HB, Chee L, Artis DR. Structural change and receptor binding in a chemokine mutant with a rearranged disulfide: X-ray structure of e38C/C50A IL-8 at 2 Å resolution. Proteins 1997;27:556–566. [PubMed] [Google Scholar]
- 42.Verdino P, Witherden DA, Havran WL, Wilson IA. The molecular interaction of CAR and JAML recruits the central cell signal transducer PI3K. Science 2010;329:1210–1214. [DOI] [PMC free article] [PubMed] [Google Scholar]
- 43.Yan Q, Malashkevich VN, Fedorov A, et al. Structure of CD84 provides insight into SLAM family function. Proc Natl Acad Sci USA 2007;104:10583–10588. [DOI] [PMC free article] [PubMed] [Google Scholar]
- 44.van Raaij MJ, Chouin E, van der Zandt H, Bergelson JM, Cusack S. Dimeric structure of the coxsackievirus and adenovirus receptor D1 domain at 1.7 Å resolution. Structure 2000;8:1147–1155. [DOI] [PubMed] [Google Scholar]
- 45.Honda T, Kakuta Y, Kimura K, Saho J, Kimura M. Structure of an archaeal homolog of the human protein complex Rpp21–Rpp29 that is a key core component for the assembly of active ribonuclease P. J Mol Biol 2008;384:652–662. [DOI] [PubMed] [Google Scholar]
- 46.Ekblad CMS, Chavali GB, Basu BP, et al. Binding of EMSY to HP1β: Implications for recruitment of HP1β and BS69. EMBO Reports 2005;6:675–680. [DOI] [PMC free article] [PubMed] [Google Scholar]
- 47.Forouhar F, Neely H, Seetharaman J, et al. Northeast Structural Genomics Consortium Target PaR198. PDB 2009.
- 48.Scheuermann TH, Tomchick DR, Machius M, Guo Y, Bruick RK, Gardner KH. Artificial ligand binding within the HIF2α PAS-B domain of the HIF2 transcription factor. Proc Natl Acad Sci USA 2009;106:450–455. [DOI] [PMC free article] [PubMed] [Google Scholar]
- 49.Hennig S, Strauss HM, Vanselow K, et al. Structural and functional analyses of PAS domain interactions of the clock proteins Drosophila PERIOD and mouse PERIOD2. PLoS Biol 2009;7:e94. [DOI] [PMC free article] [PubMed] [Google Scholar]
- 50.Tang X, Yang C, Gu Y, et al. Structural basis for the neutralization and genotype specificity of hepatitis E virus. Proc Natl Acad Sci USA 2011;108:10266–10271. [DOI] [PMC free article] [PubMed] [Google Scholar]
- 51.Lucas M, Gaspar AH, Pallara C, et al. Structural basis for the recruitment and activation of the Legionella phospholipase VipD by the host GTPase Rab5. Proc Natl Acad Sci USA 2014;111:E3514–E3523. [DOI] [PMC free article] [PubMed] [Google Scholar]
- 52.Garrard SM, Capaldo CT, Gao L, Rosen MK, Macara IG, Tomchick DR. Structure of Cdc42 in a complex with the GTPase-binding domain of the cell polarity protein, Par6. EMBO J 2003;22:1125–1133. [DOI] [PMC free article] [PubMed] [Google Scholar]
- 53.Eathiraj S, Pan X, Ritacco C, Lambright DG. Structural basis of family-wide Rab GTPase recognition by rabenosyn-5. Nature 2005;436:415–419. [DOI] [PMC free article] [PubMed] [Google Scholar]
- 54.Kato M, Shimizu T, Mizuno T, Hakoshima T. Structure of the histidine-containing phosphotransfer (HPt) domain of the anaerobic sensor protein ArcB complexed with the chemotaxis response regulator CheY. Acta Cryst D 1999;55:1257–1263. [DOI] [PubMed] [Google Scholar]
- 55.Zhao X, Copeland DM, Soares AS, West AH. Crystal structure of a complex between the phosphorelay protein YPD1 and the response regulator domain of SLN1 bound to a phosphoryl analog. J Mol Biol 2008;375:1141–1151. [DOI] [PMC free article] [PubMed] [Google Scholar]
Associated Data
This section collects any data citations, data availability statements, or supplementary materials included in this article.