

Abstract
Background—
Diabetes is a prevalent public health problem that affects about one third of the U.S. population and leads to serious vascular complications with increased risk for coronary artery disease. How bone marrow hematopoiesis contributes to diabetes complications is incompletely understood. We thus investigated the role of bone marrow endothelial cells in diabetic regulation of inflammatory myeloid cell production.
Methods—
In three types of mouse diabetes, including streptozotocin, high fat diet and genetic induction using leptin-receptor-deficient db/db mice, we assayed leukocytes, hematopoietic stem and progenitor cells (HSPC) and endothelial cells in the bone marrow with flow cytometry and expression profiling.
Results—
In diabetes, we observed enhanced proliferation of HSPC leading to augmented circulating myeloid cell numbers. Analysis of bone marrow niche cells revealed that endothelial cells in diabetic mice expressed less Cxcl12, a retention factor promoting HSPC quiescence. Transcriptome-wide analysis of bone marrow endothelial cells demonstrated enrichment of genes involved in epithelial growth factor receptor (Egfr) signaling in mice with diet-induced diabetes. To explore whether endothelial Egfr plays a functional role in myelopoiesis, we generated mice with endothelial-specific deletion of Egfr (Cdh5Cre Egfrfl/fl). Unexpectedly, we found enhanced HSPC proliferation and increased myeloid cell production in Cdh5Cre Egfrfl/fl mice compared to wild type mice with diabetes. Disrupted Egfr signaling in endothelial cells decreased their expression of the HSPC retention factor angiopoietin-1. We tested the functional relevance of these findings for wound healing and atherosclerosis, both implicated in complications of diabetes. Inflammatory myeloid cells accumulated more in skin wounds of diabetic Cdh5Cre Egfrfl/fl mice, significantly delaying wound closure. Atherosclerosis accelerated in Cdh5Cre Egfrfl/fl mice, leading to larger and more inflamed atherosclerotic lesions in the aorta.
Conclusions—
In diabetes, bone marrow endothelial cells participate in the dysregulation of bone marrow hematopoiesis. Specifically, diabetes reduces endothelial production of Cxcl12, a quiescence-promoting niche factor that reduces stem cell proliferation. We also describe a previously unknown counter-regulatory pathway, in which protective endothelial Egfr signaling curbs HSPC proliferation and myeloid cell production.
Keywords: Hematopoiesis, myelopoiesis, diabetes, atherosclerosis, monocytes
INTRODUCTION
Diabetes is a major contemporary public health challenge1. According to the U.S. National Diabetes Statistics Report 2017, more than 30 million Americans (~9.4% of the population) suffer from diabetes and an additional 84 million people likely have pre-diabetes2. Insulin resistance in peripheral organs as well as dysfunctional pancreatic beta cells contribute to hyperglycemia in type 2 diabetes3. Obesity-related type 2 diabetes can respond to a combination of diet, exercise and medication. However, longstanding diabetes causes serious complications, many of which affect arteries in various organs. Patients with diabetes have substantially elevated risk for and acceleration of coronary artery disease (CAD) and other forms of cardiovascular disease4, 5.
The pathophysiological mechanisms of aggravated vascular inflammation in diabetes are manifold, involving advanced glycation end products (RAGE), reactive oxygen species and various cell types5. While diabetes impairs endothelial health, hyperglycemia also interferes with the inflammatory myeloid cell supply6, 7. Leukocytosis frequently occurs in diabetes8. Common myeloid progenitor cells, through the receptors for RAGE and interleukin-1, give rise to more myeloid cells in diabetes7, 9. Hematopoiesis is further skewed towards the myeloid lineage via intrinsic p66Shc signaling10. In turn, higher levels of white blood cells – including myeloid cells – confer an elevated risk for coronary artery disease (CAD)11. Given myeloid cells’ central role in most stages of atherosclerosis and vascular inflammation, understanding mechanisms that regulate myelopoiesis in diabetes is crucial12.
In addition to regulating hematopoiesis through growth factors and other ligand-receptor interactions on hematopoietic stem and progenitor cells (HSPC), a number of bone marrow niche cells instruct myelopoiesis and control proliferation in the steady state. HSPC reside in the bone marrow niche, which is formed by endothelial cells, mesenchymal stromal cells, macrophages and osteoblasts13. Niche cells regulate HSPC activity through expression of factors such as Cxcl12, Scf and angiopoietin14. In contrast to bone marrow niche cells’ contribution to steady-state hematopoiesis, their role in diabetes is incompletely understood.
Inadequately controlled diabetes results in systemic endothelial cell dysfunction6. Recent data also indicate that diabetes affects the hematopoietic niche15. Oikawa and colleagues described extensive microangiopathy in longstanding type 1 diabetes in mice16. HSPC predominantly localized to areas in which vascular integrity was preserved, indicating that regions of active myelopoiesis are not evenly distributed throughout the diabetic marrow. Similar morphological changes occur in human diabetes and may involve Mcp1-driven adipogenesis17, 18. Development of endothelial dysfunction in the marrow involves cell intrinsic mechanisms such as redox-induced activation of RhoA/Rho-associated kinase signaling19. Dysfunctional pericytes further modulate endothelial health in diabetes, underlining the complex nature of cell-extrinsic interactions in the hematopoietic niche20–22. Severity and duration of diabetes are predictors of such bone marrow remodeling17.
Taken together, it is becoming increasingly clear that diabetes amplifies myeloid cell production and markedly affects endothelial health; however, it remains incompletely understood how bone marrow niche endothelium interferes with HSPC activity and consequently affects systemic leukocyte levels in diabetes.
METHODS
The data, analytic methods, and study materials will be/have been made available to other researchers for purposes of reproducing the results or replicating the procedure. Microarray data were deposited in the GEO repository (accession number GSE128375). Please also see Supplemental Methods.
Mice
Male C57BL/6J (000664), BKS.Cg-Dock7m +/+ Leprdb/J background C57BLKS/J (000642) and B6;129-Tg(Cdh5-cre)1Spe/J background C57BL/6J (017968) were purchased from The Jackson Laboratory. Cryo-derived Egfrfloxed mice (B6.129S6-Egfrtm1Dwt/Mmnc, identification number 031765-UNC, >99% C57BL/6J background) were obtained from the Mutant Mouse Resource and Research Centers, a NIH-funded strain repository, and were donated to the MMRRC by David Threadgill, PhD, North Carolina State University. B6;129-Tg(Cdh5-cre)1Spe/J mice were crossed with B6.129S6-Egfrtm1Dwt/Mmnc mice. Mice were backcrossed for 3–4 times. Second generation VE-cadherin-Crehemizygote/+ Egfrflox/flox mice were used for experiments. Mice were housed under specific pathogen-free conditions. All experiments were approved by Massachusetts General Hospital’s Institutional Animal Care and Use Committee.
Gene expression profiling and data analysis
Male C57BL/6J mice were used for this experiment. 5000 bone marrow endothelial cells were sorted using FACS gating outlined in Figure 3A with >95% purity. Gene expression profiling was done by the Partners HealthCare Personalized Medicine Translational Genomics Core. Amplified cDNA was prepared using the Ovation Pico WTA System V2 (NuGEN) and hybridized to GeneChip Mouse Gene 2.0 ST arrays (Affymetrix). Raw microarray data were normalized with the robust multi-array average23 and differentially expressed genes were determined with Bioconductor’s Limma package. Gene set enrichment analysis was performed with GSEA’s Java Desktop application, using gene sets from MSigDb’s C2 collection (http://software.broadinstitute.org/gsea/msigdb/index.jsp) and standard parameters (signal-to-noise ratio as the ranking metric, weighted scoring scheme, gene set permutation). The data were deposited in the GEO repository (accession number GSE128375).
Figure 3. Diabetes induces endothelial cell Egfr signaling.
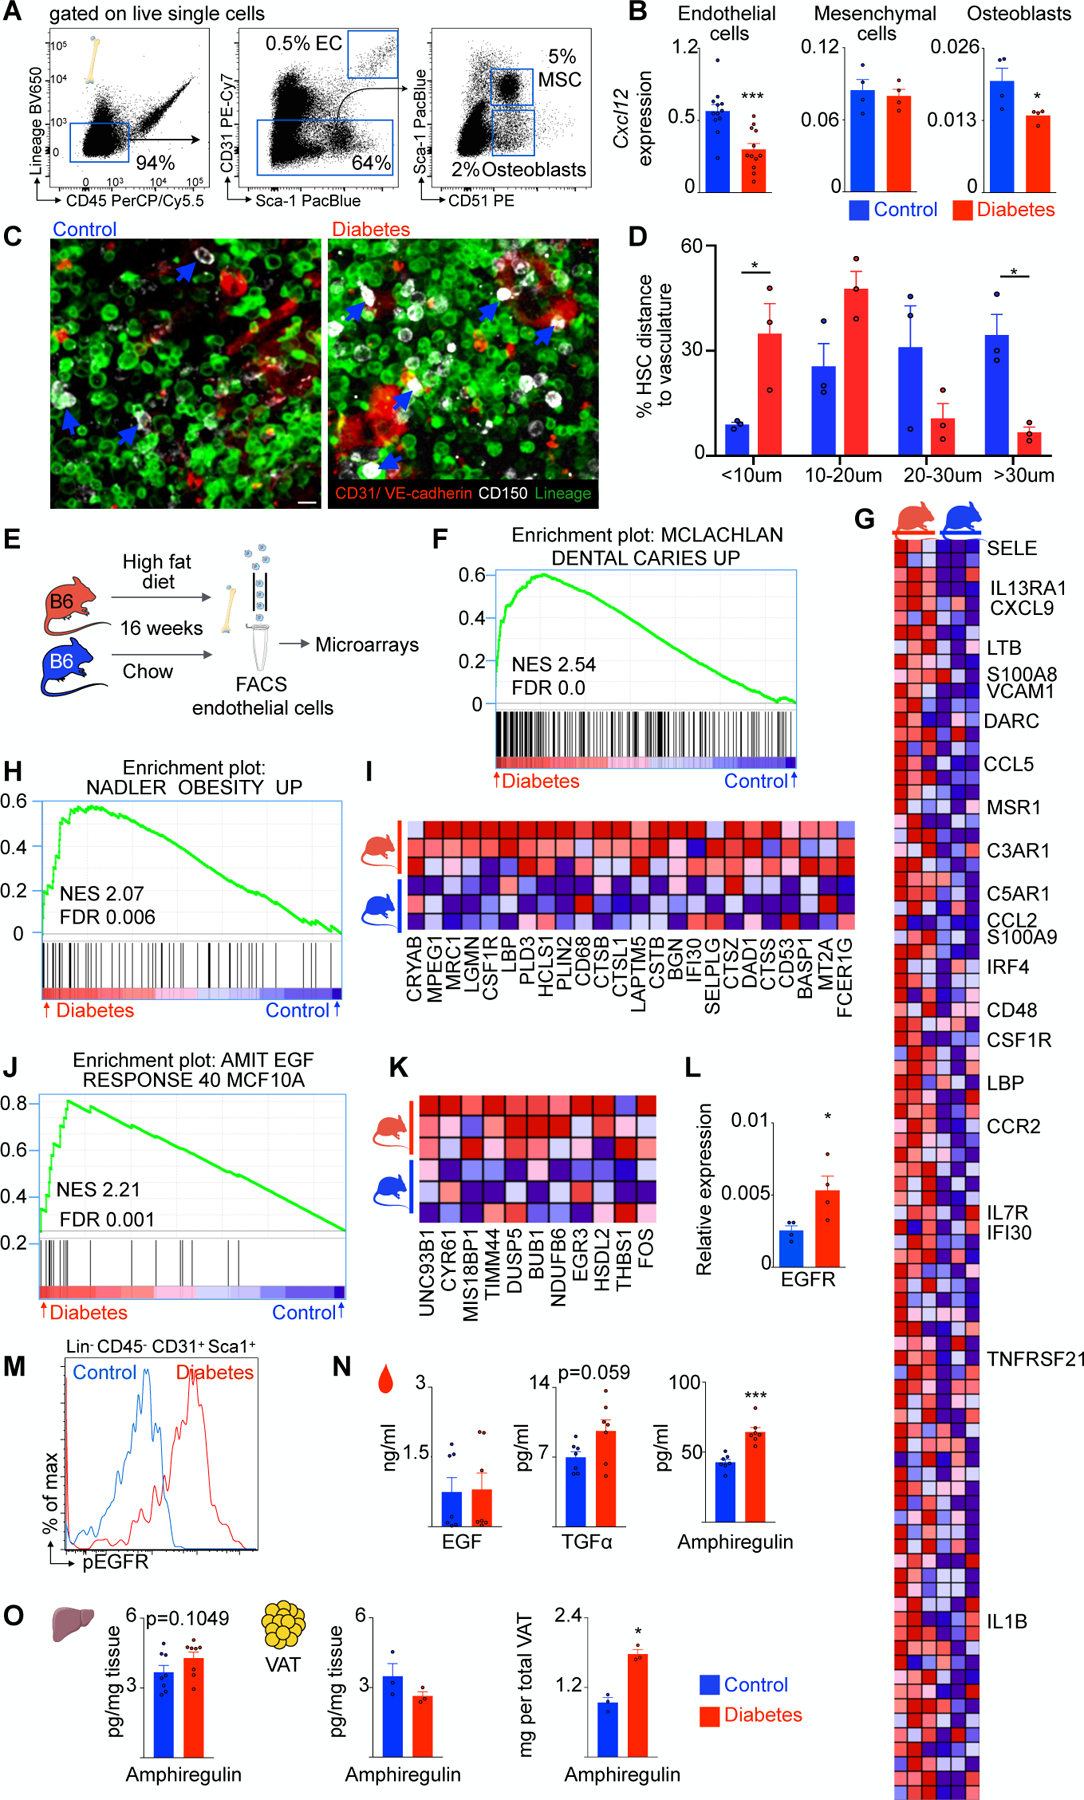
A, Representative flow plots and FACS gating for bone marrow endothelial cells, mesenchymal stem cells and osteoblasts. B, CXCL12 mRNA expression levels in FACS-isolated cells of control and type 2 diabetes mice. C, Representative immunofluorescence images of control and diabetic marrow. CD150+ HSC are white, CD31+ VE-cadherin+ endothelial cells are red, lineage+ cells are green. Blue arrows point at HSC. Scale bar is 10μm. D, Distance of HSC to endothelial cells. E, Experimental design for transcriptome analysis. F, Enrichment of gene set MCLACHLAN_DENTAL_CARIES_UP. G, Heatmap of enriched genes from (D). H, Enrichment of gene set NADLER_OBESITY_UP. I, Heatmap of enriched genes from (F). J, Egfr gene set (AMIT_EGF_RESPONSE_40_MCF10A). K, Heatmap of enriched genes from (H). L, Egfr mRNA levels in bone marrow endothelial cells of control and diabetic mice. M, Representative flow histogram showing enhanced phosphorylation of EGF-receptor in bone marrow endothelial cells of diabetic mice. N, Different Egfr ligands in serum of control and diabetic mice. O, Amphiregulin concentration in liver tissue and visceral adipose tissue as well as total amphiregulin amount per visceral adipose tissue. Unpaired, two-tailed t-test was used for normally distributed data, two-tailed Mann-Whitney test for non-parametric data. N=3–12 mice per group. Data are mean ± s.e.m. *P<0.05, ***P<0.001.
Atherosclerosis experiments
PCSK9 plasmid pAAV/D377Y-mPCSK9 was purchased from Addgene. Stbl3 E. coli were used for virus amplification. Atherosclerosis was induced with a single injection of 1012 genomic copies of an adeno-associated virus 2/8 PCSK9, as calculated by ITR primer titers. Mice were placed on a high fat diet containing 1.25% cholesterol (#D12108C, Research Diets Inc).
Statistics
GraphPad Prism® software was used for analysis. Normal distribution was analyzed with DÀgostino-Pearson omnibus test and Shapiro-Wilk normality test. Unpaired, one- or two-tailed t-test was applied for normally distributed data. For non-parametric distribution, Mann-Whitney U test. N-values represent biological replicates.
RESULTS
Diabetes increases myelopoiesis
We first analyzed different diabetes models and their effects on myeloid cell production. Mouse diabetes that resembles type 1 diabetes in humans can be induced with the alkylating agent streptozotocin (STZ), which targets insulin-producing pancreatic beta cells. Injecting STZ induced significant hyperglycemia compared to vehicle-injected control mice (Figure 1A and Supplementary Figure 1A). After inducing diabetes, we performed serial flow cytometry analyses of circulating leukocytes. Figure 1B depicts the gating strategy for myeloid cells (CD19low CD11bhigh), monocytes (CD19low CD11bhigh CD115high Ly6Glow), Ly6Chigh monocytes (CD19low CD11bhigh CD115high Ly6Glow Ly6Chigh) and neutrophils (CD19low CD11bhigh CD115low Ly6Ghigh) in control and diabetic mice. Diabetes markedly increased levels of all myeloid cell subsets as early as four weeks after the last STZ injection. The difference between STZ-injected and control mice persisted for 16 weeks after injection (Figure 1B and C). The elevated levels of circulating leukocytes pointed to enhanced myeloid cell supply by the bone marrow. Indeed, four months after diabetes induction, myeloid cells, monocytes, Ly6Chigh monocytes and neutrophils were more numerous in the marrow of diabetic animals (Figure 1D and E). Likewise, we observed higher levels of all upstream myeloid progenitor cells. Compared to control, diabetic marrow had significantly more granulocyte-macrophage progenitors (GMP, lineagelow c-Kithigh Sca1low CD16/32high CD34high), LSK cells (lineagelow c-Kithigh Sca1high) and hematopoietic stem cells (HSC, lineagelow c-Kithigh Sca1high CD48low CD150high, Figure 1F and G). To determine whether enhanced stem cell proliferation underlies these higher numbers, we conducted a BrdU pulse chase experiment (Figure 1H). Mice were saturated with the thymidine analogue BrdU, which incorporates into replicating DNA. After two weeks of BrdU pulse and four weeks of chase, we assessed BrdU dilution by quantifying BrdU+ progenitor proportions via flow cytometry. Diabetic mice had significantly fewer BrdU+ LSK and HSC, indicating accelerated BrdU wash-out and enhanced proliferation (Figure 1I and Supplementary Figure 1B). After a 2 week pulse, BrdU saturation was comparable in diabetic mice, demonstrating proper loading prior to the chase period (Supplementary Figure 1C). While fasting glucose levels rose in blood of STZ-injected mice, cholesterol levels did not change significantly (Supplementary Figure 1D). Body weight loss was observed in mice with type 1 diabetes (Supplementary Figure 1D), as described previously24.
Figure 1. Streptozotocin-induced type 1 diabetes increases myelopoiesis.
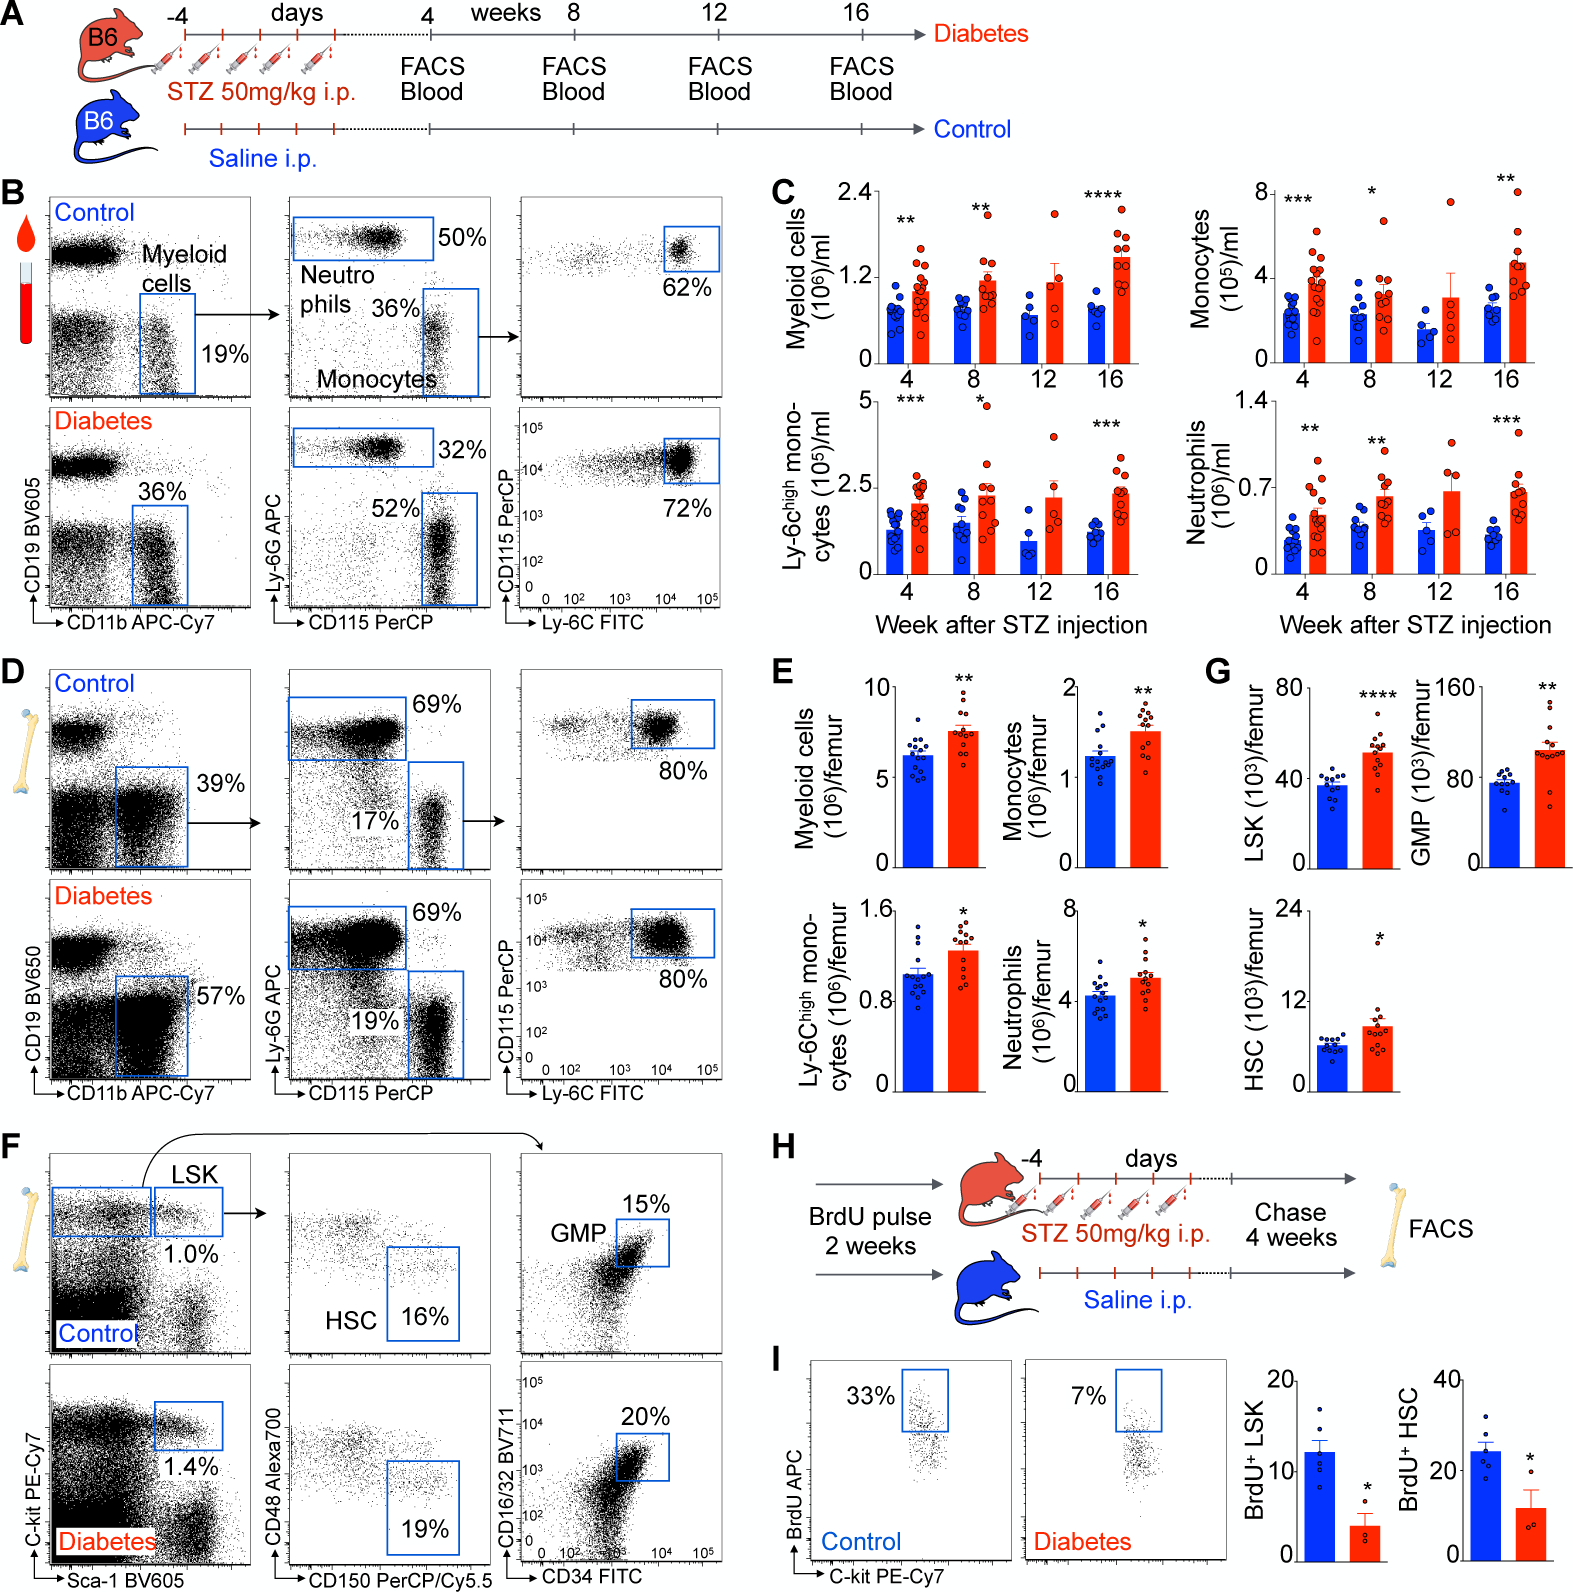
A, Experimental outline. B, Representative flow plots and gating strategy of blood myeloid cells in control and diabetic mice. C, Quantification of blood myeloid cells, monocytes, Ly6Chigh monocytes and neutrophils over time in control (blue) and diabetic (red) mice. D, Representative flow plots and gating strategy of bone marrow leukocytes in control and diabetic mice. E, Quantification of bone marrow leukocytes in control and diabetic mice. F, Representative flow plots and gating strategy of bone marrow progenitor cells. G, Quantification of LSK, GMP and HSC in control and diabetic mice. H, Experimental design of BrdU pulse chase experiments in streptozotocin-induced diabetic and control mice. I, Representative flow plot of BrdU+ HSC and quantification of BrdU+ HSC and LSK in control and diabetic mice. Unpaired, two-tailed t-test was used for normally distributed data, two-tailed Mann-Whitney test for non-parametric data. N=3–15 mice per group. Data are mean ± s.e.m. *P<0.05, **P<0.01, ***P<0.001, ****P<0.0001.
Next, we induced obesity-related diabetes, which mimics type 2 diabetes in humans25. To this end, male C57BL/6J mice consumed a diet with 60 kcal% fat for four months (Figure 2A). High fat diet-fed mice displayed aberrant glucose tolerance (Supplementary Figure 1E). Features of peripheral insulin resistance such as increased insulin, serum glycerol, and serum free fatty acids were present in these mice (Supplementary Figure 1F). As expected, mice were significantly more obese. Fasting glucose levels were elevated; however, we did not detect significant hypercholesterolemia (Supplementary Figure 1F). Taken together, these data confirm that high fat diet-fed mice developed diabetes25. Blood leukocytes were monitored by flow cytometry every other week. Representative flow plots demonstrate increased levels of myeloid cells in mice on high fat diet (Figure 2B). Blood myeloid cells, monocytes, Ly6Chigh monocytes and neutrophils rose four to six weeks after high fat diet began (Figure 2C). To obtain more insight into the source of leukocytosis in diabetic mice, we analyzed bone marrow hematopoietic progenitor cells (Figure 2D). Again, we found elevated levels of stem and progenitor cells in diabetic bone marrow (Figure 2E). Using a BrdU pulse chase protocol, as described above, we found enhanced hematopoietic progenitor cell proliferation in mice fed a high fat diet (Figure 2F and G). Given previous reports that myelopoiesis is not evenly distributed in diabetic marrow16, we separately determined HSPC proliferation in diaphysis and metaphysis of diabetic mice via intracellular Ki-67/propidium iodide flow cytometry. Indeed, proliferation differed regionally with higher cell cycle rates in the metaphysis of diabetic mice (Supplementary Figure 1G). HSPC proliferation did not differ between humerus and femur, indicating that long bones are similarly affected by systemic hyperglycemia (Supplementary Figure 1H). Bone marrow progenitor cell apoptosis, as demonstrated by Annexin-V flow cytometry, was unaffected (Figure 2H and I).
Figure 2. High fat diet-induced type 2 diabetes increases myelopoiesis.

A, Experimental design. B, Representative flow plot and gating strategy of blood myeloid cells. C, Quantification of blood myeloid cells, monocytes, Ly6Chigh monocytes and neutrophils over time in control (blue) and diabetic (red) mice. D, Representative flow plots and gating strategy of bone marrow hematopoietic progenitor cells. E, Quantification of LSK, GMP, LRP and HSC in control and diabetic mice. F, Experimental design of BrdU pulse chase experiments in high fat diet-induced diabetic and control mice. G, Representative flow plot of BrdU+ HSC and quantification of BrdU+ HSC and LSK in control and diabetic mice. H, Representative flow plots for GMP Annexin-V staining. I, Apoptosis quantification for LSK, GMP and HSC in control and diabetic mice. Unpaired, two-tailed t-test was used for normally distributed data, two-tailed Mann-Whitney test for non-parametric data. N=5–12 mice per group. Data are mean ± s.e.m. *P<0.05, **P<0.01, ***P<0.001.
Finally, we used an established genetic model for diabetes; leptin-receptor-deficient db/db mice develop significant hyperglycemia, obesity and type 2 diabetes (Supplementary Figure 2A). Flow cytometry showed raised blood myeloid cell subsets (Supplementary Figure 2B and C). Leukocytosis in db/db mice was accompanied by elevated LSK, GMP and HSC levels in the bone marrow (Supplementary Figure 2D and E). Proliferative activity of bone marrow LSK and HSC was enhanced in diabetic mice, as assessed by intracellular Ki-67/propidium iodide staining (Supplementary Figure 2F and G). In addition to obesity and hyperglycemia, db/db mice exhibited elevated cholesterol levels (Supplementary Figure 2H).
In summary, these data on higher HSC cell cycle activity agree with previous reports of increased hematopoietic progenitor cell proliferation in the bone marrow of diabetic mice7, 9.
Diabetes alters bone marrow endothelial cells
HSC are upstream of all blood cells and reside in the bone marrow. Endothelial cells, key constituents of the bone marrow niche, instruct the behavior of HSC and their progeny while their luminal surfaces are exposed to cellular and molecular components in the blood26. Other niche cells, such as mesenchymal stromal cells and osteoblasts, also significantly contribute to HSPC activity regulation14. Diabetes causes structural marrow alterations including microangiopathy and altered perfusion16. The mechanisms by which compromised hematopoietic niches interfere with hematopoiesis remain incompletely understood. We therefore used fluorescent assisted cell sorting (FACS) to isolate different niche cells from the bone marrow of diet-induced diabetic and control mice (Figure 3A). Quantitative qPCR in sorted niche cells (Figure 3B) revealed reduced Cxcl12 transcript levels in endothelial cells from type 2 diabetic mice. Cxcl12 is an important endothelial cell-derived niche factor that maintains HSC quiescence via interaction with its cognate receptor Cxcr427. Cxcl12 mRNA levels did not change in mesenchymal stromal cells but also decreased in osteoblasts isolated from diabetic bone marrow. Relative Cxcl12 transcript levels were more than 10-fold higher in bone marrow endothelial cells than in osteoblasts (Figure 3B). Next, we analyzed the spatial relationship of CD150+ HSC and CD31+ VE-cadherin+ endothelial cells in bone marrow tissue (Figure 3C). HSC localized more closely to endothelium in diabetic marrow compared to control (Figure 3D). Together, these results indicate that the diabetic milieu affects endothelial cell—HSPC relations prominently. We therefore focused on endothelial cells in our following experiments.
To understand diabetes-induced transcriptional changes in bone marrow endothelial cells in greater detail, we FACS-isolated bone marrow endothelial cells for whole transcriptome profiling in naive controls and mice in which type 2 diabetes was induced by high fat diet (Figure 3E). While we found only one differentially expressed transcript at the single gene level (the prenyltransferase Rabggtb, FDR=0.003), gene set enrichment analysis (GSEA) revealed dozens of gene sets that were significantly upregulated in diabetes. Specifically, 52 gene sets from the MSigDb C2 collection (see methods) were significantly upregulated (FDR<0.05) in the endothelium of diabetic mice. We observed that a large fraction of the significant gene sets represents inflammatory signatures (highlighted in Supplementary Table 1), including the top ranked gene set (NES 2.54, FDR 0.0, Fig. 3F, G). Notably, this top-ranked gene set includes many inflammatory genes, including adhesion molecules and inflammatory cytokines that are upregulated in diabetes-induced endothelial dysfunction28. Further, a gene set associated with obesity (NES 2.07, FDR 0.006, Figure 3H, I) enriched in diabetic mice’s endothelial cells. These data indicate that diabetes induces inflammatory endothelial phenotypes in the bone marrow which likely influence the crosstalk between endothelial niche and hematopoietic stem cells.
The second most significantly enriched gene set involved the response to epidermal growth factor (EGF) (NES 2.21, FDR=0.001, Figure 3J, K). Endothelial cells express high levels of the EGF receptor (Egfr)29. Analysis of deposited microarray data obtained in endothelial cells from femurs of mice with STZ-induced diabetes19 revealed enrichment of a related EGF gene set (NES 1.74, FDR=0.071, Supplementary Figure 3A). We conclude that EGF signaling may be altered in endothelial cells in type I diabetes as well. Egfr is a transmembrane receptor binding growth hormones that ultimately promote cell proliferation, adhesion and migration; its functions and inhibition are well established in the setting of cancer30. However, the role of Egfr in hematopoiesis or diabetes is largely unknown. We hypothesized that signaling through this receptor may give rise to the inflammatory phenotypes observed in bone marrow endothelial cells of diabetic mice, perhaps consequently leading to increased HSPC proliferation. We therefore FACS-isolated endothelial cells from the bone marrow of diabetic and control mice and, via qPCR, observed increased Egfr expression (Figure 3L). To further analyze EGF signaling, we used flow cytometry to assess Egfr phosphorylation and observed markedly increased Egfr phosphorylation in bone marrow endothelial cells of diabetic mice (Figure 3M).
Several Egfr ligands, including EGF, TGF⍺ and amphiregulin, may activate the Egfr tyrosine kinase31. To determine which ligand mediates Egfr activation in diabetes, we measured their levels in serum samples from control and diabetic mice. We observed the most pronounced differences in the serum of diabetic mice, as measured by ELISA, for amphiregulin, a growth factor that binds to Egfr (Figure 3N)32. Seeking the source of elevated amphiregulin, we measured its concentration in potential source tissues. While the liver levels did not change significantly, we observed total amphiregulin amount rising in the visceral adipose tissue compartment (Figure 3O), an established source of this cytokine in obesity33.
Endothelial cell-specific Egfr deletion enhances myelopoiesis
Bone marrow endothelial cells regulate HSPC activity through different niche factors, though endothelial Egfr’s role in this regard remains unclear. To explore whether endothelial EGF signaling regulates myelopoiesis in diabetes, we bred mice that specifically lack the EGF receptor (Cdh5Cre Egfrfl/fl) in endothelial cells. At baseline, levels of circulating myeloid cells did not differ between control and Cdh5Cre Egfrfl/fl mice that were fed regular chow diet (Supplementary Figure 3B, C). Unexpectedly, when fed a high fat diet, the numbers of myeloid cells, monocytes, Ly6Chigh monocytes and neutrophils were significantly enhanced in the blood of mice lacking endothelial Egfr when compared to littermate controls (Figure 4A, B), indicating that endothelial Egfr signaling suppresses leukocyte production in the setting of diabetes. To determine whether the augmented leukocytosis in Cdh5Cre Egfrfl/fl mice indeed arises from enhanced cell production, we again determined bone marrow hematopoietic progenitor cell levels. HSC and LSK were significantly more numerous in the marrow of diabetic Cdh5Cre Egfrfl/fl mice (Figure 4C and D). This rise was accompanied by increased HSC proliferation in Cdh5Cre Egfrfl/fl mice, as measured by intracellular Ki-67/propidium iodide staining (Figure 4E). To probe which niche factors mediated this augmented progenitor cell proliferation, we isolated endothelial cells from the bone marrow of diabetic Cdh5Cre Egfrfl/fl and control mice. We analyzed mRNA levels of the most common niche factors by qPCR. While we did not observe changes in Vcam1, Cxcl12 and Scf, angiopoietin-1 expression fell significantly in Cdh5Cre Egfrfl/fl mice (Figure 4G). Angiopoietin-1 is a key HSC maintenance factor in the steady state34. Taken together, these data imply that increased Egfr signaling in bone marrow endothelial cells of diabetic mice represents an anti-inflammatory pathway that is not active in the steady state but counters the marrow’s diabetes-associated increased leukocyte output when mice are fed a high fat diet. Of note, other conditions may also alter the same or different Egfr ligands, perhaps with diverging effects on hematopoiesis.
Figure 4. Endothelial cell Egfr regulates myelopoiesis.

A, Representative flow plots of blood myeloid cells in Cdh5Cre Egfrfl/fl and control mice on high fat diet. B, Quantification of blood myeloid cells, monocytes, Ly6Chigh monocytes and neutrophils. C, Representative flow plots of bone marrow hematopoietic progenitor cells. D, Quantification of LSK, GMP and HSC. E, Representative flow plots of intracellular Ki-67/ PI staining of HSC and analysis of cell cycle G0, G1 and SG2M. F, Bone marrow endothelial cells of Cdh5Cre Egfrfl/fl and control mice on high fat diet were FAC-sorted. Niche factors were determined by qPCR. Unpaired, two-tailed t-test was used for normally distributed data, two-tailed Mann-Whitney test for non-parametric data. N=3–10 mice per group. Data are mean ± s.e.m. *P<0.05, **P<0.01, ***P<0.001.
Disrupted endothelial EGF signaling impairs wound healing in diabetes
We next wanted to evaluate the relevance of above findings for diabetes-induced complications. Increased numbers of inflammatory myeloid cells in diabetic wounds fuel inflammation and hinder proper healing35. Using a widely accepted diabetic skin wound injury punch biopsy model, we repetitively imaged wounds over a period of 20 days and digitally analyzed open wound areas. As expected, wound healing was significantly impaired in diabetic mice fed a high fat diet for four months when compared to age-matched control mice on chow diet (Supplementary Figure 4A). Ly6Chigh monocytes and neutrophils were more numerous in diabetic wounds, as assessed by flow cytometry on day 7 after skin wound induction (Supplementary Figure 4B). As described above, we observed that endothelial cell-specific Egfr deletion amplifies myelopoiesis in diabetes. To test this finding’s functional relevance, we performed the skin wound injury in Cdh5Cre Egfrfl/fl and age-matched control mice fed a high fat diet for four months (Figure 5A). On day 7 after injury, we analyzed myeloid cells in the skin wound by flow cytometry. Ly6Chigh monocytes and neutrophils rose in diabetic wounds of mice lacking endothelial Egfr (Figure 5B, C). Skin wound monitoring revealed additionally delayed healing in Cdh5Cre Egfrfl/fl mice, particularly around day 7 after wound induction (Figure 5D, E).
Figure 5. Diabetic skin wounds in Cdh5Cre Egfrfl/fl mice.

A, Experimental design. B, Representative flow plots of skin wounds in control and Cdh5Cre Egfrfl/fl mice. C, Quantification of myeloid cells in diabetic skin wounds of control and Cdh5Cre Egfrfl/fl mice. D, Representative skin wound images of control and Cdh5Cre Egfrfl/fl mice. E, Skin wound healing in Cdh5Cre Egfrfl/fl and control mice over time. Unpaired t-test was used for normally distributed data, Mann-Whitney test for non-parametric data. N=4–10 mice per group. Data are mean ± s.e.m. *P<0.05, **P<0.01.
Disrupted endothelial EGF signaling accelerates atherosclerosis
Accelerated development of coronary artery disease frequently complicates diabetes. Atherosclerotic progression critically depends on inflammatory myeloid cells throughout different disease stages36. To determine the functional relevance of enhanced myelopoiesis in endothelial Egfr-deficient mice in the setting of vascular inflammation, we used AAV2/8-driven PCSK9 production to induce atherosclerosis37. Binding of PCSK9 to low-density lipoprotein receptors promotes lysosomal degradation and prevents receptor recycling. A single dose of AAV2/8 PCSK9 induces a gain-of-function mutation, increases cholesterol levels and induces atherosclerosis in mice38. Cdh5Cre Egfrfl/fl and age-matched control mice were infected with AAV2/8 PCSK9 and placed on a high fat diet (Figure 6A). We first measured circulating leukocytes in Cdh5Cre Egfrfl/fl and age-matched control mice treated with AAV2/8 PCSK9. Flow cytometry revealed elevated levels of blood myeloid cells, monocytes, Ly6Chigh monocytes and neutrophils in Cdh5Cre Egfrfl/fl mice compared to controls (Figure 6B, C). Again, to explore whether enhanced myelopoiesis underlies peripheral leukocytosis in this setting, we examined hematopoietic progenitor cell levels in the bone marrow. LSK, GMP and HSC were more numerous in the marrow of Cdh5Cre Egfrfl/fl mice compared to controls, as assessed by flow cytometry (Figure 6D, E). To determine whether increased inflammatory myeloid cells supply influences arterial inflammation and atherosclerosis, we harvested thoracic aortic tissue after 12 weeks of high fat diet. Indeed, we observed increased levels of macrophages, Ly6Chigh monocytes and neutrophils in aortic tissue of Cdh5Cre Egfrfl/fl mice compared to controls, as quantified by flow cytometry (Figure 6F, G). To obtain more details on atherosclerotic lesion morphology, we assessed aortic roots from both groups by histology. Plaque size was determined by oil red o staining. In line with increased aortic inflammation, we observed larger atherosclerotic lesions in Cdh5Cre Egfrfl/fl mice as compared to controls (Figure 6H). To visualize collagenous structures in atherosclerotic lesions and evaluate plaque stability, we performed Masson staining of aortic roots. The necrotic core area and fibrous plaque thickness did not change in Cdh5Cre Egfrfl/fl mice (Supplementary Figure 5A), indicating that local cell death and extracellular matrix production in the plaque likely did not contribute to the observed differences in plaque size. Serum cholesterol levels were unchanged by endothelial specific deletion of Egrf in Cdh5Cre Egfrfl/fl mice (Supplementary Figure 5B). The question arises whether non-bone marrow endothelial Egfr signaling contributes to plaque formation. Egrf phosphorylation, however, did not increase significantly in aortic endothelial cells of high fat diet fed, atherosclerotic mice when compared to chow-fed wild type controls (Supplementary Figure 5C).
Figure 6. Enhanced myelopoiesis in Cdh5Cre Egfrfl/fl mice accelerates atherosclerosis.

A, Experimental design. Atherosclerosis was induced via AAV2/8 PCSK9 injection. B, Flow plots of blood myeloid cells in Cdh5Cre Egfrfl/fl and control mice on high fat diet. C, Quantification of blood myeloid cells, monocytes, Ly6Chigh monocytes and neutrophils. D, Representative flow plots of bone marrow hematopoietic progenitor cells. E, Quantification of LSK, GMP and HSC. F, Representative flow plots and gating strategy of aortic myeloid cells. G, Quantification of aortic myeloid cells. H, Representative oil red o staining of aortic roots and quantification of atherosclerotic lesion. Unpaired t-test was used for normally distributed data, Mann-Whitney test for non-parametric data. N=5–8 mice per group. Data are mean ± s.e.m. *P<0.05, **P<0.01. Scale bar 500μm.
Enhanced EGFR signaling in human diabetes
Finally, we probed whether the observed mechanisms are relevant in human disease. To this end, we FACS-isolated endothelial cells from the marrow of type 2 diabetes patients and non-diabetic controls (n=3–4 autopsy cases per group, Figure 7A). Indeed, EGFR phosphorylation was markedly enhanced in diabetic endothelial cells (Figure 7B), matching the data observed in mice. Further, also in line with the observations in mice, transcript levels of Cxcl12 were significantly reduced in endothelial cells isolated from diabetic patients (Figure 7C). Overall, these human pilot data indicate that EGF signaling may have a role in endothelial cell-mediated hematopoietic niche pathologies.
Figure 7. Human diabetes and summary cartoon.

A, Representative flow plots and gating strategy for human bone marrow endothelial cells. B, Bone marrow endothelial cell EGFR phosphorylation in non-diabetic and diabetic patients, as assessed with intracellular phospho-flow cytometry. C, HSC retention factor transcript level in bone marrow endothelial cells from non-diabetic and diabetic patients. Unpaired one-tailed t-test was used for normally distributed data, one-tailed Mann-Whitney test for non-parametric data. n=3–4 per group, *P<0.05. D, Summary cartoon.
DISCUSSION
Here we reveal that bone marrow endothelial cells fuel myelopoiesis under chronic hyperglycemic and inflammatory conditions. We also show that diabetes activates Egfr signaling in endothelial cells. Disrupted endothelial Egfr was accompanied by augmented HSPC proliferation and inflammatory myeloid cell production. The surplus of myeloid cells was associated with typical diabetic complications, as demonstrated by delayed diabetic skin wound healing and enlarged atherosclerotic lesions. Our results indicate that enhanced endothelial Egfr signaling, likely mediated through the Egfr ligand amphiregulin, dampens excessive myelopoiesis in type 2 diabetes (Figure 7D).
This counter-regulatory mechanism is intriguing in light of previous studies that demonstrated that enhanced myeloid precursor proliferation occurs through direct interactions with specific ligands. In this context, neutrophilic S100A8/S100A9 interacts with advanced glycation end products’ receptor on common myeloid progenitor cells and drives them into the cell cycle7. Likewise, adipose tissue macrophage-derived IL1β induces bone marrow myeloid progenitor cell proliferation via IL1 receptor activation9. Diabetes also alters the landscape of growth factors, which may further accelerate myeloid cell production7. Our data confirm these findings using three different diabetes models, which all promote leukocytosis. Our observation that even the most upstream CD150+ CD48− SLAM HSC proliferate more vigorously under diabetic conditions is an interesting new addition to these prior reports. Proliferative stimuli may directly influence HSPC activity. In addition to cytokines and growth factors, declining niche cell-derived Cxcl12 contributes to higher HSPC activity, whereas endothelial Egfr signaling curbs myeloid cell production. Cxcl12 mRNA was not changed in endothelial cells lacking Egfr, indicating that both pathways act independently. Whether Cxcl12 or Egfr signaling changes dynamically during different disease stages remains to be elucidated. Furthermore, computational analysis suggests that Egfr signaling may also be relevant in type 1 diabetes.
Podocyte-specific Egfr plays a role in the genesis of diabetic nephropathy39. Additionally, systemic pharmacological Egfr inhibition improves insulin sensitivity40. Considering these reports together with increased Egfr signaling in bone marrow endothelial cells and augmented myelopoiesis in diabetes, we expected curtailed myelopoiesis in mice lacking this receptor in endothelial cells. We were surprised to observe the opposite, i.e. increased myelopoiesis in Cdh5Cre Egfrfl/fl mice. On a note of caution, knock out of the receptor is a drastic intervention and may yield different results than gradually declining ligand binding. Interestingly, a recent study reported that Egfr expression in hematopoietic cells is important for HSPC expansion after radiation injury41, indicating that the Egfr’s effects on hematopoiesis are cell specific. By analyzing important niche factors, we found that Egfr deletion lowered angiopoietin-1 expression. Unlike angiopoietin-2, the vascular growth factor angiopoietin-1 is anti-inflammatory and preserves vascular integrity42, 43. Angiopoietin-1 binds to tyrosine kinase Tie2 on HSC, induces their quiescence and prevents apoptosis34. It is therefore conceivable that enhanced proliferation of bone marrow hematopoietic progenitor cells in Cdh5Cre Egfrfl/fl mice is mediated via modulation of angiopoietin-1.
Several growth factors and molecules bind to Egfr31. We did not detect any differences in EGF levels in the serum of diabetic mice. In contrast, amphiregulin levels rose sharply in diabetic mouse serum. As we did not analyze every known ligand for Egfr, we cannot rule out that additional signals are altered by diabetes and thus may contribute to enhanced Egfr activity. Yet our experiments indicate that diabetes changes molecules known to interact with Egfr.
Inflammatory myeloid cells exacerbate diabetes-associated complications such as atherosclerosis or chronic diabetic wounds12. Indeed, we observed that increased myeloid cell output in Cdh5Cre Egfrfl/fl mice accelerated atherosclerotic lesion formation and impeded healing of diabetic skin wounds. While elevated myeloid cell levels certainly contribute to these phenomena, we cannot rule out that local endothelial Egfr deletion in plaques and wounds contributed to the observed effects, as this would require currently unavailable organ- and cell-specific gene deletion. Leukocytes’ catalytic role in atherosclerosis and diabetic skin wound injuries is well established11, 44, 45. Increased myeloid cell supply in Cdh5Cre Egfrfl/fl mice therefore likely contributes to disease exacerbation in diabetes.
Another interesting notion is that Egfr deletion in endothelial cells accelerates atherosclerosis. A recent study convincingly demonstrated that myeloid-specific Egfr deletion attenuates atherosclerotic lesion formation in mice46. Thus, Egfr may have cell-specific roles that diverge for myeloid and endothelial cells, an insight that may guide drug development. While EGFR inhibitors, including monoclonal antibodies and small molecule tyrosine kinase inhibitors, are successfully used in EGFR+ cancers47, our data indicate that repurposing such drugs for cardiovascular disease may require cell-specific action. This obstacle could be overcome by, for instance, using nanoparticles to restrict drug delivery to myeloid cells48. Additionally, modalities to interfere with niche cells’ functions in diabetes may become available. For instance, adenovirus enabled gene therapy was successfully employed to ameliorate bone marrow sensory malfunction in type 1 diabetic mice49.
Our data complement several other studies16, 19, 20 indicating that pathologies occur in specific regions within type 1 diabetic marrow. We report that myelopoiesis was higher in close proximity to endothelial cells and in femoral metaphysis bone in mice with type 2 diabetes. Morphological niche alterations in type 1 diabetes include fat accumulation and vessel rarefaction 30 weeks after diabetes induction16. Preserved bone marrow cellularity was reported 14 weeks after type 1 diabetes induction15. Mechanisms underlying regulation of diabetes-induced myelopoiesis are likely manifold, and interactions between marrow endothelium and HSPC are likely time- and stage-dependent. Transcriptome analysis revealed prominent activation of inflammatory pathways, which may impact HSPC activity in the marrow. While hyperglycemia may be a main driver of myelopoiesis in the STZ- and high fat diet model, hypercholesterolemia in db/db mice likely contributes to increased hematopoiesis, as previous reports indicated increased LSK proliferation in mice with hypercholesterolemia50. Overall, the data presented here support a key role of bone marrow endothelial signaling, which regulates excessive myeloid cell production and cardiovascular complications in diabetes.
Supplementary Material
Clinical Perspective.
What is new?
Bone marrow endothelial phenotypes are shaped by diabetes mellitus.
Since bone marrow endothelial cells are an important component of the blood stem cell niche, diabetic alterations of endothelial cells influence bone marrow stem cell function.
What are the clinical implications?
The leukocytosis driving inflammation of atherosclerotic plaque is propelled by diabetic alterations of the hematopoietic niche.
Cross talk between endothelial and hematopoietic stem cells is a potential target for the development of anti-inflammatory atherosclerosis treatment.
Acknowledgements
We thank the Massachusetts General Hospital Flow Cytometry Core at the Center for Regenerative Medicine for assistance with FACS. We used Servier Medical Arts to create figures.
Sources of Funding
This study was funded by grants from the National Institutes of Health (HL142494, NS108419, HL139598, HL125428, HL121076, HL143967, HL080472, HL134892 and T32HL076136), by the German Research Foundation (HO5279/1-2 and RO5071/1-1), the American Heart Association (18CSA34080399), the RRM Charitable Fund, the Jung Foundation for Science and Research, the China Council Scholarship (CSC 201706370261) and the MGH Research Scholar Program.
Nonstandard abbreviations and acronyms
- BrdU
Bromodeoxyuridine / 5-bromo-2’-deoxyuridine
- CAD
Coronary artery disease
- EGF
Epidermal growth factor
- Egfr
Epithelial growth factor receptor
- FACS
Fluorescent assisted cell sorting
- GSEA
Gene set enrichment analysis
- GMP
Granulocyte macrophage progenitor
- HSPC
Hematopoietic stem and progenitor cells
- PI
Propidium Iodide
- STZ
Streptozotocin
Footnotes
Disclosures
M.N. has received funds or material research support from Novartis, GSK, Pfizer, GlycoMimetics, Medtronic, Biotronik, Alnylam and CSL Behring and consulting fees from Verseau Therapeutics, Sigilon, Molecular Imaging Inc., IFM Therapeutics and Biogen. P.L. is an unpaid consultant to or involved in clinical trials for Amgen, AstraZeneca, Esperion Therapeutics, Ionis Pharmaceuticals, Kowa Pharmaceuticals, Novartis, Pfizer, Sanofi-Regeneron and XBiotech, Inc.. P.L. is a scientific advisory board member for Amgen, Corvidia Therapeutics, DalCor Pharmaceuticals, IFM Therapeutics, Kowa Pharmaceuticals, Olatec Therapeutics, Medimmune, Novartis, and XBiotech, Inc.. P.L. has received research funding in the last two years from Novartis.
Supplementary Materials
Expanded MethodsSupplemental Figures I-V
Supplemental Tables I-II
References
- 1.Rowley WR, Bezold C, Arikan Y, Byrne E, Krohe S. Diabetes 2030: Insights from Yesterday, Today, and Future Trends. Popul Health Manag. 2017;20:6–12. [DOI] [PMC free article] [PubMed] [Google Scholar]
- 2.Centers for Disease Control and Prevention. National Diabetes Statistics Report, 2020. Atlanta, GA: Centers for Disease Control and Prevention, US Department of Health and Human Services; 2020. [Google Scholar]
- 3.Zheng Y, Ley SH, Hu FB. Global aetiology and epidemiology of type 2 diabetes mellitus and its complications. Nat Rev Endocrinol. 2018;14:88–98. [DOI] [PubMed] [Google Scholar]
- 4.Booth GL, Kapral MK, Fung K, Tu JV. Relation between age and cardiovascular disease in men and women with diabetes compared with non-diabetic people: a population-based retrospective cohort study. Lancet. 2006;368:29–36. [DOI] [PubMed] [Google Scholar]
- 5.DeFronzo RA, Ferrannini E, Groop L, Henry RR, Herman WH, Holst JJ, Hu FB, Kahn CR, Raz I, Shulman GI et al. Type 2 diabetes mellitus. Nat Rev Dis Primers. 2015;1:15019. [DOI] [PubMed] [Google Scholar]
- 6.Avogaro A, Albiero M, Menegazzo L, de Kreutzenberg S, Fadini GP. Endothelial dysfunction in diabetes: the role of reparatory mechanisms. Diabetes Care. 2011;34 Suppl 2:S285–90. [DOI] [PMC free article] [PubMed] [Google Scholar]
- 7.Nagareddy PR, Murphy AJ, Stirzaker RA, Hu Y, Yu S, Miller RG, Ramkhelawon B, Distel E, Westerterp M, Huang LS et al. Hyperglycemia promotes myelopoiesis and impairs the resolution of atherosclerosis. Cell Metab. 2013;17:695–708. [DOI] [PMC free article] [PubMed] [Google Scholar]
- 8.Woo SJ, Ahn SJ, Ahn J, Park KH, Lee K. Elevated systemic neutrophil count in diabetic retinopathy and diabetes: a hospital-based cross-sectional study of 30,793 Korean subjects. Invest Ophthalmol Vis Sci. 2011;52:7697–7703. [DOI] [PubMed] [Google Scholar]
- 9.Nagareddy PR, Kraakman M, Masters SL, Stirzaker RA, Gorman DJ, Grant RW, Dragoljevic D, Hong ES, Abdel-Latif A, Smyth SS et al. Adipose tissue macrophages promote myelopoiesis and monocytosis in obesity. Cell Metab. 2014;19:821–835. [DOI] [PMC free article] [PubMed] [Google Scholar]
- 10.Albiero M, Ciciliot S, Tedesco S, Menegazzo L, D’Anna M, Scattolini V, Cappellari R, Zuccolotto G, Rosato A, Cignarella A et al. Diabetes-Associated Myelopoiesis Drives Stem Cell Mobilopathy Through an OSM-p66Shc Signaling Pathway. Diabetes. 2019;68:1303–1314. [DOI] [PubMed] [Google Scholar]
- 11.Nahrendorf M Myeloid cell contributions to cardiovascular health and disease. Nat Med. 2018;24:711–720. [DOI] [PMC free article] [PubMed] [Google Scholar]
- 12.Dragoljevic D, Westerterp M, Veiga CB, Nagareddy P, Murphy AJ. Disordered haematopoiesis and cardiovascular disease: a focus on myelopoiesis. Clin Sci (Lond). 2018;132:1889–1899. [DOI] [PubMed] [Google Scholar]
- 13.Schepers K, Campbell TB, Passegué E. Normal and leukemic stem cell niches: insights and therapeutic opportunities. Cell Stem Cell. 2015;16:254–267. [DOI] [PMC free article] [PubMed] [Google Scholar]
- 14.Pinho S, Frenette PS. Haematopoietic stem cell activity and interactions with the niche. Nat Rev Mol Cell Biol. 2019;20:303–320. [DOI] [PMC free article] [PubMed] [Google Scholar]
- 15.Ferraro F, Lymperi S, Méndez-Ferrer S, Saez B, Spencer JA, Yeap BY, Masselli E, Graiani G, Prezioso L, Rizzini EL et al. Diabetes impairs hematopoietic stem cell mobilization by altering niche function. Sci Transl Med. 2011;3:104ra101. [DOI] [PMC free article] [PubMed] [Google Scholar]
- 16.Oikawa A, Siragusa M, Quaini F, Mangialardi G, Katare RG, Caporali A, van Buul JD, van Alphen FP, Graiani G, Spinetti G et al. Diabetes mellitus induces bone marrow microangiopathy. Arterioscler Thromb Vasc Biol. 2010;30:498–508. [DOI] [PMC free article] [PubMed] [Google Scholar]
- 17.Spinetti G, Cordella D, Fortunato O, Sangalli E, Losa S, Gotti A, Carnelli F, Rosa F, Riboldi S, Sessa F et al. Global remodeling of the vascular stem cell niche in bone marrow of diabetic patients: implication of the microRNA-155/FOXO3a signaling pathway. Circ Res. 2013;112:510–522. [DOI] [PMC free article] [PubMed] [Google Scholar]
- 18.Ferland-McCollough D, Maselli D, Spinetti G, Sambataro M, Sullivan N, Blom A, Madeddu P. MCP-1 Feedback Loop Between Adipocytes and Mesenchymal Stromal Cells Causes Fat Accumulation and Contributes to Hematopoietic Stem Cell Rarefaction in the Bone Marrow of Patients With Diabetes. Diabetes. 2018;67:1380–1394. [DOI] [PubMed] [Google Scholar]
- 19.Mangialardi G, Katare R, Oikawa A, Meloni M, Reni C, Emanueli C, Madeddu P. Diabetes causes bone marrow endothelial barrier dysfunction by activation of the RhoA-Rho-associated kinase signaling pathway. Arterioscler Thromb Vasc Biol. 2013;33:555–564. [DOI] [PMC free article] [PubMed] [Google Scholar]
- 20.Mangialardi G, Ferland-McCollough D, Maselli D, Santopaolo M, Cordaro A, Spinetti G, Sambataro M, Sullivan N, Blom A, Madeddu P. Bone marrow pericyte dysfunction in individuals with type 2 diabetes. Diabetologia. 2019;62:1275–1290. [DOI] [PMC free article] [PubMed] [Google Scholar]
- 21.Cathery W, Faulkner A, Maselli D, Madeddu P. Concise Review: The Regenerative Journey of Pericytes Toward Clinical Translation. Stem Cells. 2018;36:1295–1310. [DOI] [PMC free article] [PubMed] [Google Scholar]
- 22.Slater SC, Jover E, Martello A, Mitić T, Rodriguez-Arabaolaza I, Vono R, Alvino VV, Satchell SC, Spinetti G, Caporali A et al. MicroRNA-532–5p Regulates Pericyte Function by Targeting the Transcription Regulator BACH1 and Angiopoietin-1. Mol Ther. 2018;26:2823–2837. [DOI] [PMC free article] [PubMed] [Google Scholar]
- 23.Irizarry RA, Hobbs B, Collin F, Beazer-Barclay YD, Antonellis KJ, Scherf U, Speed TP. Exploration, normalization, and summaries of high density oligonucleotide array probe level data. Biostatistics. 2003;4:249–264. [DOI] [PubMed] [Google Scholar]
- 24.Nørgaard SA, Sand FW, Sørensen DB, Abelson KS, Søndergaard H. Softened food reduces weight loss in the streptozotocin-induced male mouse model of diabetic nephropathy. Lab Anim. 2018;52:373–383. [DOI] [PubMed] [Google Scholar]
- 25.Winzell MS, Ahrén B. The high-fat diet-fed mouse: a model for studying mechanisms and treatment of impaired glucose tolerance and type 2 diabetes. Diabetes. 2004;53 Suppl 3:S215–9. [DOI] [PubMed] [Google Scholar]
- 26.Xu C, Gao X, Wei Q, Nakahara F, Zimmerman SE, Mar J, Frenette PS. Stem cell factor is selectively secreted by arterial endothelial cells in bone marrow. Nat Commun. 2018;9:2449. [DOI] [PMC free article] [PubMed] [Google Scholar]
- 27.Ding L, Morrison SJ. Haematopoietic stem cells and early lymphoid progenitors occupy distinct bone marrow niches. Nature. 2013;495:231–235. [DOI] [PMC free article] [PubMed] [Google Scholar]
- 28.Tabit CE, Chung WB, Hamburg NM, Vita JA. Endothelial dysfunction in diabetes mellitus: molecular mechanisms and clinical implications. Rev Endocr Metab Disord. 2010;11:61–74. [DOI] [PMC free article] [PubMed] [Google Scholar]
- 29.Amin DN, Hida K, Bielenberg DR, Klagsbrun M. Tumor endothelial cells express epidermal growth factor receptor (EGFR) but not ErbB3 and are responsive to EGF and to EGFR kinase inhibitors. Cancer Res. 2006;66:2173–2180. [DOI] [PubMed] [Google Scholar]
- 30.Yarden Y The EGFR family and its ligands in human cancer. signalling mechanisms and therapeutic opportunities. Eur J Cancer. 2001;37 Suppl 4:S3–8. [DOI] [PubMed] [Google Scholar]
- 31.Schneider MR, Wolf E. The epidermal growth factor receptor ligands at a glance. J Cell Physiol. 2009;218:460–466. [DOI] [PubMed] [Google Scholar]
- 32.Berasain C, Avila MA. Amphiregulin. Semin Cell Dev Biol. 2014;28:31–41. [DOI] [PubMed] [Google Scholar]
- 33.Yang B, Kumoto T, Arima T, Nakamura M, Sanada Y, Kumrungsee T, Sotomaru Y, Shimada M, Yanaka N. Transgenic mice specifically expressing amphiregulin in white adipose tissue showed less adipose tissue mass. Genes Cells. 2018;23:136–145. [DOI] [PubMed] [Google Scholar]
- 34.Arai F, Hirao A, Ohmura M, Sato H, Matsuoka S, Takubo K, Ito K, Koh GY, Suda T. Tie2/angiopoietin-1 signaling regulates hematopoietic stem cell quiescence in the bone marrow niche. Cell. 2004;118:149–161. [DOI] [PubMed] [Google Scholar]
- 35.Wicks K, Torbica T, Mace KA. Myeloid cell dysfunction and the pathogenesis of the diabetic chronic wound. Semin Immunol. 2014;26:341–353. [DOI] [PubMed] [Google Scholar]
- 36.Galkina E, Ley K. Immune and inflammatory mechanisms of atherosclerosis (*). Annu Rev Immunol. 2009;27:165–197. [DOI] [PMC free article] [PubMed] [Google Scholar]
- 37.Roche-Molina M, Sanz-Rosa D, Cruz FM, García-Prieto J, López S, Abia R, Muriana FJ, Fuster V, Ibáñez B, Bernal JA. Induction of sustained hypercholesterolemia by single adeno-associated virus-mediated gene transfer of mutant hPCSK9. Arterioscler Thromb Vasc Biol. 2015;35:50–59. [DOI] [PubMed] [Google Scholar]
- 38.Bjørklund MM, Hollensen AK, Hagensen MK, Dagnaes-Hansen F, Christoffersen C, Mikkelsen JG, Bentzon JF. Induction of atherosclerosis in mice and hamsters without germline genetic engineering. Circ Res. 2014;114:1684–1689. [DOI] [PubMed] [Google Scholar]
- 39.Chen J, Chen JK, Harris RC. EGF receptor deletion in podocytes attenuates diabetic nephropathy. J Am Soc Nephrol. 2015;26:1115–1125. [DOI] [PMC free article] [PubMed] [Google Scholar]
- 40.Prada PO, Ropelle ER, Mourão RH, de Souza CT, Pauli JR, Cintra DE, Schenka A, Rocco SA, Rittner R, Franchini KG et al. EGFR tyrosine kinase inhibitor (PD153035) improves glucose tolerance and insulin action in high-fat diet-fed mice. Diabetes. 2009;58:2910–2919. [DOI] [PMC free article] [PubMed] [Google Scholar] [Retracted]
- 41.Doan PL, Himburg HA, Helms K, Russell JL, Fixsen E, Quarmyne M, Harris JR, Deoliviera D, Sullivan JM, Chao NJ et al. Epidermal growth factor regulates hematopoietic regeneration after radiation injury. Nat Med. 2013;19:295–304. [DOI] [PMC free article] [PubMed] [Google Scholar]
- 42.Nykänen AI, Krebs R, Saaristo A, Turunen P, Alitalo K, Ylä-Herttuala S, Koskinen PK, Lemström KB. Angiopoietin-1 protects against the development of cardiac allograft arteriosclerosis. Circulation. 2003;107:1308–1314. [DOI] [PubMed] [Google Scholar]
- 43.Roviezzo F, Tsigkos S, Kotanidou A, Bucci M, Brancaleone V, Cirino G, Papapetropoulos A. Angiopoietin-2 causes inflammation in vivo by promoting vascular leakage. J Pharmacol Exp Ther. 2005;314:738–744. [DOI] [PubMed] [Google Scholar]
- 44.Pettersson US, Christoffersson G, Massena S, Ahl D, Jansson L, Henriksnäs J, Phillipson M. Increased recruitment but impaired function of leukocytes during inflammation in mouse models of type 1 and type 2 diabetes. PLoS One. 2011;6:e22480. [DOI] [PMC free article] [PubMed] [Google Scholar]
- 45.Dragoljevic D, Kraakman MJ, Nagareddy PR, Ngo D, Shihata W, Kammoun HL, Whillas A, Lee MKS, Al-Sharea A, Pernes G et al. Defective cholesterol metabolism in haematopoietic stem cells promotes monocyte-driven atherosclerosis in rheumatoid arthritis. Eur Heart J. 2018;39:2158–2167. [DOI] [PMC free article] [PubMed] [Google Scholar]
- 46.Zeboudj L, Giraud A, Guyonnet L, Zhang Y, Laurans L, Esposito B, Vilar J, Chipont A, Papac-Milicevic N, Binder CJ et al. Selective EGFR (Epidermal Growth Factor Receptor) Deletion in Myeloid Cells Limits Atherosclerosis-Brief Report. Arterioscler Thromb Vasc Biol. 2018;38:114–119. [DOI] [PubMed] [Google Scholar]
- 47.Sigismund S, Avanzato D, Lanzetti L. Emerging functions of the EGFR in cancer. Mol Oncol. 2018;12:3–20. [DOI] [PMC free article] [PubMed] [Google Scholar]
- 48.Duivenvoorden R, Senders ML, van Leent MMT, Pérez-Medina C, Nahrendorf M, Fayad ZA, Mulder WJM. Nanoimmunotherapy to treat ischaemic heart disease. Nat Rev Cardiol. 2019;16:21–32. [DOI] [PMC free article] [PubMed] [Google Scholar]
- 49.Dang Z, Avolio E, Albertario A, Sala-Newby GB, Thomas AC, Wang N, Emanueli C, Madeddu P. Nerve growth factor gene therapy improves bone marrow sensory innervation and nociceptor-mediated stem cell release in a mouse model of type 1 diabetes with limb ischaemia. Diabetologia. 2019;62:1297–1311. [DOI] [PMC free article] [PubMed] [Google Scholar]
- 50.Yvan-Charvet L, Pagler T, Gautier EL, Avagyan S, Siry RL, Han S, Welch CL, Wang N, Randolph GJ et al. ATP-binding cassette transporters and HDL suppress hematopoietic stem cell proliferation. Science. 2010;328:1689–1693. [DOI] [PMC free article] [PubMed] [Google Scholar]
Associated Data
This section collects any data citations, data availability statements, or supplementary materials included in this article.