Abstract
The Antarctic sea ice extent has been slowly increasing contrary to expected trends due to global warming and results from coupled climate models. After a record high extent in 2012 the extent was even higher in 2014 when the magnitude exceeded 20×106 km2 for the first time during the satellite era. The positive trend is confirmed with a newly reprocessed sea ice data that addressed inconsistency issues in the time series. The variability in sea ice extent and ice area was studied alongside surface ice temperature for the 34-year period starting 1981 and the result of the analysis show a strong correlation of −0.94 during the growth season and −0.86 during the melt season. The correlation coefficients are even stronger with a one-month lag in surface temperature at −0.96 during the growth season and −0.98 during the melt season suggesting that the trend in sea ice cover is strongly influenced by the trend in surface temperature. The correlation with atmospheric circulation as represented by the Southern Annular Mode (SAM) index appears to be relatively weak. A case study comparing the record high in 2014 with a relatively low ice extent in 2015 also shows strong sensitivity to changes in surface temperature. The results suggest that the positive trend is a consequence of the spatial variability of global trends in surface temperature and that the ability of current climate models to forecast sea ice trend can be improved through better performance in reproducing observed surface temperatures in the Antarctic region.
1. Introduction
Among the contentious issues associated with the historical satellite record of the sea ice cover has been the observation of a positive trend in sea ice extent in the Antarctic region. Earlier reports indicated that the trend was relatively small, insignificant, and inconclusive (Zwally et al., 1983; Cavalieri et al., 1997; Bjorgo et al., 1997) but more recent reports show even more positive trends (Zwally et al., 2002; IPCC2014; Parkinson and Cavalieri, 2012). A positive trend in the Antarctic sea ice cover is intriguing because it appears physically counter-intuitive to what is expected from global warming observations. Some studies have indicated that the Antarctic sea ice cover was actually more extensive during the pre-satellite era (e.g., de la Mare, 1997; Gagne et al., 2014) but the uncertainties associated with such pre-satellite data are large (Ackley et al., 2003).
The positive sea ice trend might be in part the result of stratospheric ozone depletion that has caused a deepening of the lows in the West Antarctic region (Turner et al., 2009; Sigmond and Fyfe, 2010; Turner et al., 2015). The atmospheric conditions over the area between the Antarctic Peninsula and the Ross Sea is controlled primarily by the Amundsen Sea Low (Turner et al., 2016) which gives rise to the climatological southerly winds over the Ross and Amundsen Seas. The inter-annual variability of the sea ice extent in the Ross Sea Sector has been significantly correlated with the strength of the southerly winds over the Ross Sea and the depth of the Amundsen Sea Low (Turner et al., 2016). Stronger southerly winds and more vigorous coastal polynya formation along the Ross Ice Shelf boundary would increase sea ice production in the region as has been observed (Comiso et al., 2011; Martin et al., 2007; Holland and Kwok, 2012). Others have linked the positive trend in ice cover to a freshening of Antarctic sea water (Jacobs, 2006; Swart and Fyfe, 2013) but model experiments suggest that the magnitude of this contribution cannot account for the observed ice increase. Some attribute the trend to changes in atmospheric circulation resulting from changes in the Southern Annular Mode, ENSO and the greater frequency of La Niña events since the late 1990s (Zhang 2007; Kwok and Comiso, 2002). Attribution studies are also complicated by the inability to reproduce the observed trend in recent simulation studies that make use of CMIP5 and other model outputs (Hobbs et al., 2015; IPCC 2014).
Among the goals of this study are to show that the positive trend in sea ice extent is real using an updated and enhanced version of the sea ice data; to quantify through correlation analysis the strength of the relationship of the trend in sea ice cover with the trend in global surface temperature; and to assess how the trends in temperature from satellite observations compares with those from models and reanalysis data. The positive trend is important to establish because it has been questioned and postulated as caused by the lack of consistency in the processing of data from different sensors (Eisenman et al., 2014). The consistency issue has already been addressed earlier by Comiso and Nishio (2008) but further examined again to establish a stronger confidence in the results. The connection of the positive trend in sea ice cover to changes in surface temperature is quantified for the first time using satellite data while the consistency of observed trends in ice extent with those from available models and reanalysis data is evaluated.
2. Sea Ice and Surface Temperature Data
a. Enhancing and Updating the Sea Ice Concentration Data Set
The key issue brought up by Eisenman et al. (2014) was an inconsistency in the ice extents estimated before and after January 1992 in the earlier and later versions of the Bootstrap data set. The problem came about because the earlier version was generated using whatever data were available then and did not take into account an unknown change in calibration when SSM/I-F8 data was replaced by F11 data during this period. The inconsistency was fixed when the entire data set (and referred to as SBA) was reprocessed as reported by Comiso and Nishio (2008). To establish higher confidence in the results of our current study the data set was again enhanced to generate a new data set (referred to as SB2). The new data had been enhanced as follows: (a) the consistency between the different sensors were further checked and improved if necessary; (b) the tie point for open water was made dynamic; and (c) the threshold for lower limit for ice was relaxed to allow retrieval of ice at 10% ice concentration. Further adjustments in brightness temperature (TB) than previously done were made to improve consistency in the retrieval of ice concentration, ice extent and ice area from the different sensors. The enhanced data set also made use of dynamic tie-points for 100% sea ice and 100% ice-free ocean that better accounts for daily fluctuations in TB as may be caused by different weather conditions. Furthermore, the threshold for separating ice-covered areas from liquid surface water areas was slightly adjusted to ensure that all data elements with greater than 15% ice concentration are included in the ice extent calculations. Other filters are also utilized to exclude erroneous retrievals of ice in land/ocean boundaries where the measurements are contaminated by land data (Cho et al., 1996). Additional details are discussed in Comiso (2010).
To illustrate the effectiveness of the procedure, average ice concentration maps during the overlap period in December 1991 for F8 and F11 SSM/I data are shown to provide very similar distribution in Fig. 1a and 1b, respectively. Good agreement and consistency are also depicted in the scatter plots of brightness temperatures from F8 versus those from F11 shown in Figures 1c for 37 GHz(V) and 1d for 19 GHz(V). The ice concentrations are also virtually identical as indicated in Figure 1e while the ice extents and ice areas are highly in agreement with the difference averaging 0.1% for both ice extent and ice area (Figure 1f). The results clearly show that there is good agreement during the period when the consistency in extent was questioned by Eisenman et al. (2014). For completeness, similar studies were done during overlap periods of the other sensors (not shown) and the results also indicated good agreement.
Figure 1.
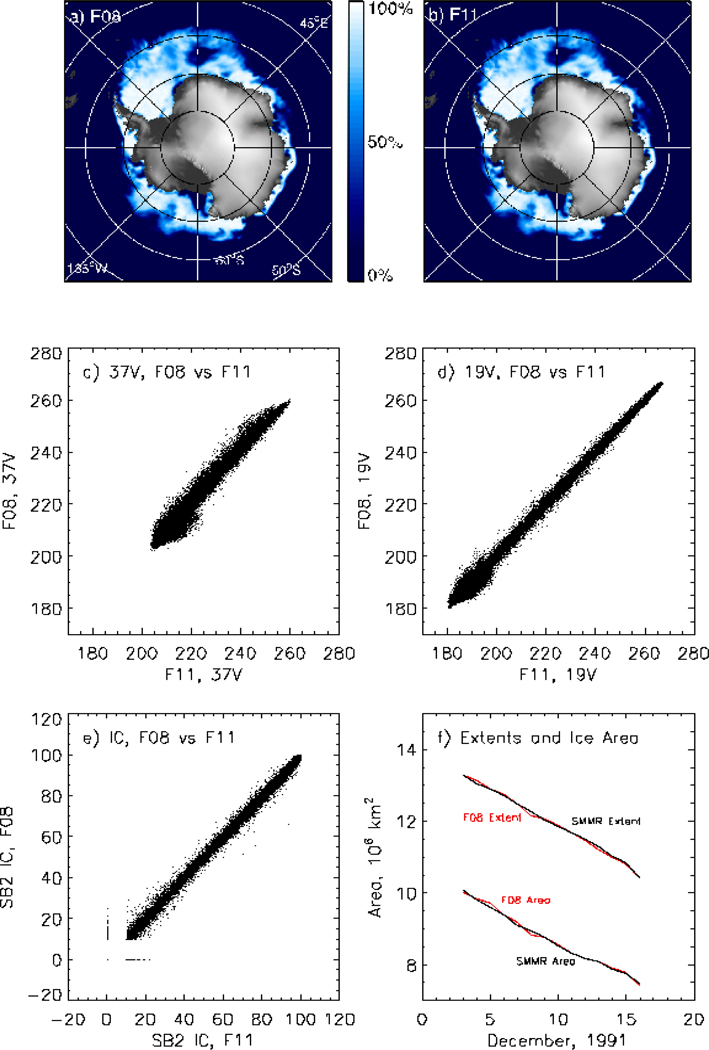
Color-coded ice concentration maps using (a) SSM/I F8 data and (b) SSM/I F11 data during overlap period on 3–16 December 1991. Scatter plots of brightness temperatures for (c) F8 versus F11 for 37 GHz (V) and (d) for F8 versus F11 for 19 GHz (V) and (e) for F8 versus F11 ice concentrations during overlap period. (f) Daily ice extent and ice area from F8 and F11 during overlap period in December 1991.
b. Enhancement and update of surface temperature data
A key variable that affects the growth and decay of the sea ice cover is surface temperature. Sea ice are formed only in areas where surface temperatures are lower than or near the 271 K freezing temperature of seawater. Together with winds and surface current, surface temperature determines the spatial distribution of the sea ice cover as well as the farthest north from the continent the sea ice edge can reach during the winter period. Detailed large-scale distributions of temperatures could be measured on a regular and consistent basis only through the use of satellite data and primarily through thermal infrared sensors (Comiso, 2010). Surface data can be acquired during both day and night but only during clear sky conditions. The daily average maps of the data therefore have gaps due to cloud cover but multiple passes at high latitude increase coverage and minimize the problem. The key data used are monthly surface temperature averages that have been shown to have reasonably good agreement with in situ surface temperatures (Steffen et al., 1993; Comiso 2000; Shuman and Comiso, 2002).
The surface temperature data used in this study is an enhanced version of the data described by Comiso (2003, 2010). Surface temperature is derived separately over land, sea ice covered areas and ice-free ocean. The key enhancement was an improved cloud masking technique that uses climatology to eliminate abnormally high or low values. Also, updated and quality checked in situ data were used to ensure good consistency in the radiances and the calibration of the different AVHRR sensors. An additional quality control is applied on SST data through the use of Reynolds data (Reynolds et al. 2002), now referred to as NOAA high resolution data (which in this case means a few km) (http:/NOAA/OAR/ESRL/PSO), to exclude anomalous data that are likely contaminated by clouds.
Some examples of monthly averages of surface temperature (TS) in the Antarctic as derived from AVHRR data are shown in Figure 2a and 2b. The data depicted are for September 2014 when the record high sea ice extent occurred and for September 2015 when the ice extent was significantly lower. For convenience, the locations of the ice edges for the two years are indicated. The distribution of surface temperature is shown to be highly variable over the Antarctic continent and the sea ice cover while that for the open ocean is much more uniform. Previous studies have shown generally good agreement of derived surface temperatures with in situ data with the standard deviations ranging mainly from 2 to 3 K (Comiso 2000; Shuman and Comiso 2002, Comiso 2010). Comparative analysis of the enhanced surface temperature data with WMO station data yielded similar results with RMS error of 2.7K when 2014 monthly averages are used (Figure 2c) and 2.4K when 2015 data are used (Figure 2d). The 1.5 to 2m surface air temperature station data have been converted to surface temperature using a conversion formula as discussed by Comiso (2003) to be consistent with AVHRR surface temperature data. In recent years aircraft thermal infrared data have become available (Kurtz et al. 2013) from Operation Ice Bridge (OIB) which enabled a direct comparison of similar infrared measurements as indicated in Figures 2e and 2f. The direct comparison yielded a better agreements with RMS errors of 2.1K in 2012 and 1.5K in 2013. The accuracy of the AVHRR data is likely higher than these RMS values since the in situ and OIB data are not perfect and the errors in the latter can contribute to the estimated standard deviation and RMS. The isotherms on the maps are also shown to be coherent with the location of the ice edges and the expected changes due to variations in the elevation of surface snow in Antarctica. Overall, the data show good consistency with a similar surface data from Aqua/MODIS which has improved capability in cloud masking but shorter record length.
Figure 2.
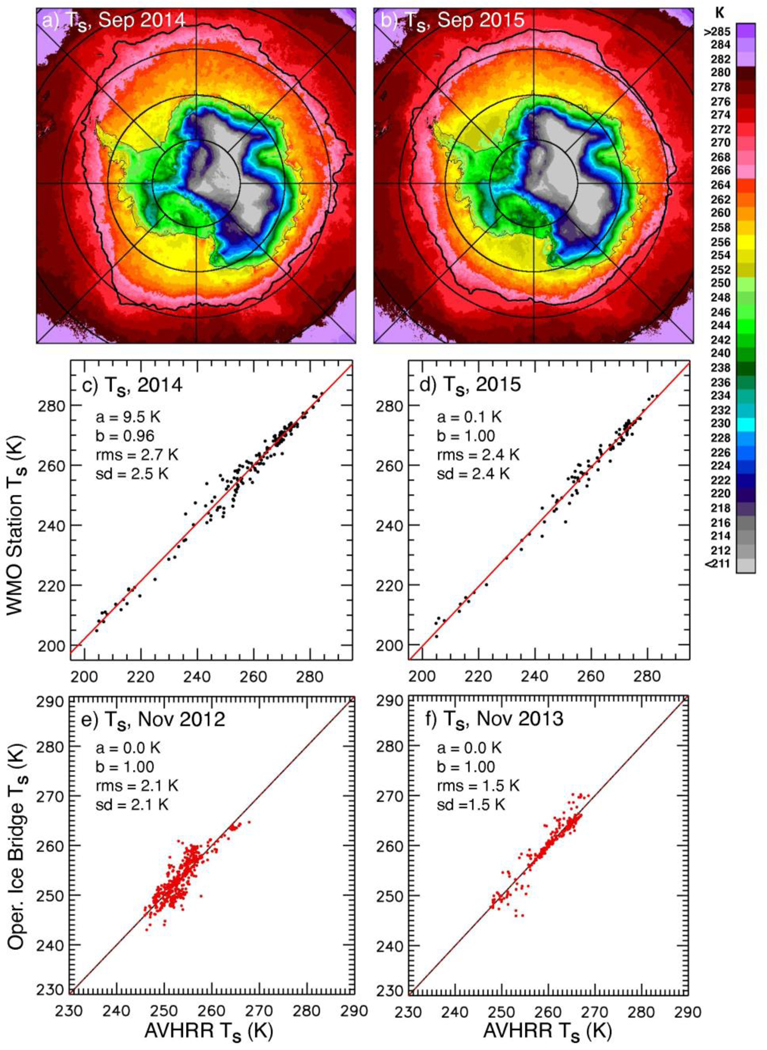
Color-coded maps of monthly average surface temperatures in (a) September 2014 and (b) September 2015. Scatter plots of WMO/in situ data versus corresponding AVHRR surface temperatures data in (c) September 2014 and (d) September 2015. Scatter plots of Operation Ice Bridge infrared data versus AVHRR surface temperatures in (e) November 2012 and (f) November 2013.
3. Results of Data Analyses
a. Decadal Changes and Trends in the Sea Ice Cover
The monthly averages of the Antarctic sea ice extent as derived from satellite data for the period from November 1978 to December 2015 are presented in Figure 3a. Sea ice extent is defined as the integral sum of all observations with ice concentration greaterthan 15%. The newly enhanced and updated version of the monthly data (labeled SB2) are shown in black while the updated version of the original data (labeled SBA), that are derived as reported in Comiso and Nishio (2008), are shown in red. The two data sets are not identical because of the enhancements as described earlier but the patterns are similar and the trends are basically consistent. The monthly extent plots show generally higher values for SB2 than those for SBA because of the adjustment made to the ice and ocean tie points in SB2 that allows for more of the low concentration data near the ice edge to be included as part of the ice covered area. The effect appears to be larger during the SMMR era as well in part because of different spatial resolution and antenna side-lobe characteristics than SSM/I.
Figure 3.
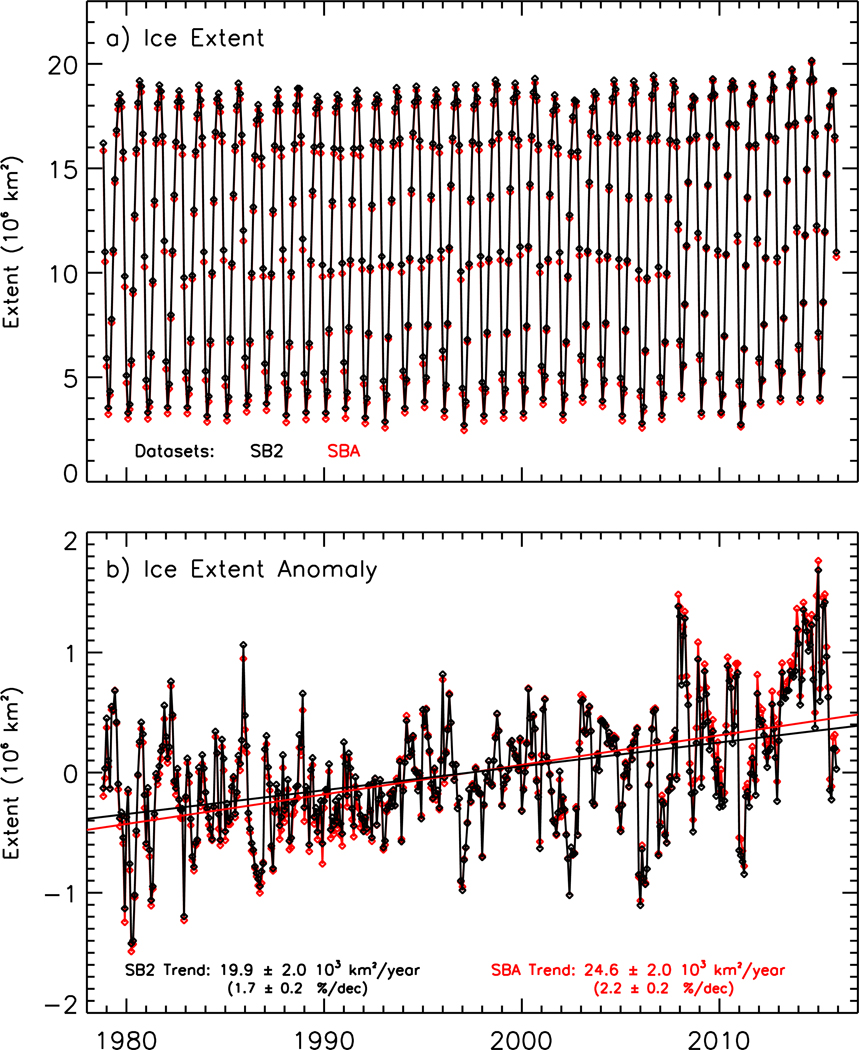
Plots of the time series of (a) Monthly averages and (b) monthly anomalies of sea ice extents derived using the newly enhanced SB2 data (in black) and the older SBA data (in red) from November 1978 to December 2015. The trend lines using SB2 and SBA data are also shown and the trend values with statistical errors are also provided.
It is intriguing that the September 2014 extent is the highest during the 1978 to 2015 era with the extent exceeding 20 million km2 for the first time. The monthly anomalies of sea ice extent as derived, using averages from November1978 to December 2015 as the baseline, and presented in Fig. 3b show similar patterns for SB2 and SBA but slightly different trends with the SB2 yielding a trend of 1.7 ± 0.2 %/decade while SBA shows 2.2 ± 0.2 % per decade. The slight discrepancy in the trend is likely caused primarily by the lower threshold for ice-covered regions and the use of a dynamic water tie point in SB2 that affected SSMR data more than the SSM/I data.
Monthly anomalies of the sea ice area for the entire Southern Ocean and individual sectors, as described in Zwally et al. (2002), are presented in Fig. 4. Sea ice area is determined by taking the sum of the product of the area and the ice concentration of each data element. The monthly averages and anomalies of ice areas using SB2 match those of SBA much closer than extents and the trends are more similar as well. For the entire hemisphere the trend estimated for SB2 data is 2.5± 0.2 % per decade while that for SBA data is 2.7 ± 0.2 % per decade. Regionally, except for the Bellingshausen/Amundsen Seas sector the trends are all positive with the Ross Sea showing the highest at 4.5 ± 0.5 % per decade followed by the West Pacific Ocean at 4.0 ± 0.6, the Indian Ocean at 3.6 ± 0.5 and the Weddell Sea at 2.5 ± 0.4. The trend for the the Bellingshausen/Amundsen Seas is the only one that is negative at −2.5 ± 0.7% per decade, although it is not as negative as reported previously by Comiso et al. (2011). This suggests a general warming in the Bellingshausen/ Amundsen Seas region, which has been regarded as a climate anomaly region (Jacobs and Comiso 1997; King and Comiso 2003). It is apparent from Fig. 4f that there has been a recovery in the ice area in the region since 2009. It also appears that the trend in the ice cover in the Ross Sea has not been as high as previously reported in Comiso et al. (2011), in part because the change in sea ice extent in this region since 2008 has been minimal. The overall increase in the trend as indicated in Figure 4a is thus mainly due to higher trends in the other sectors.
Figure 4.
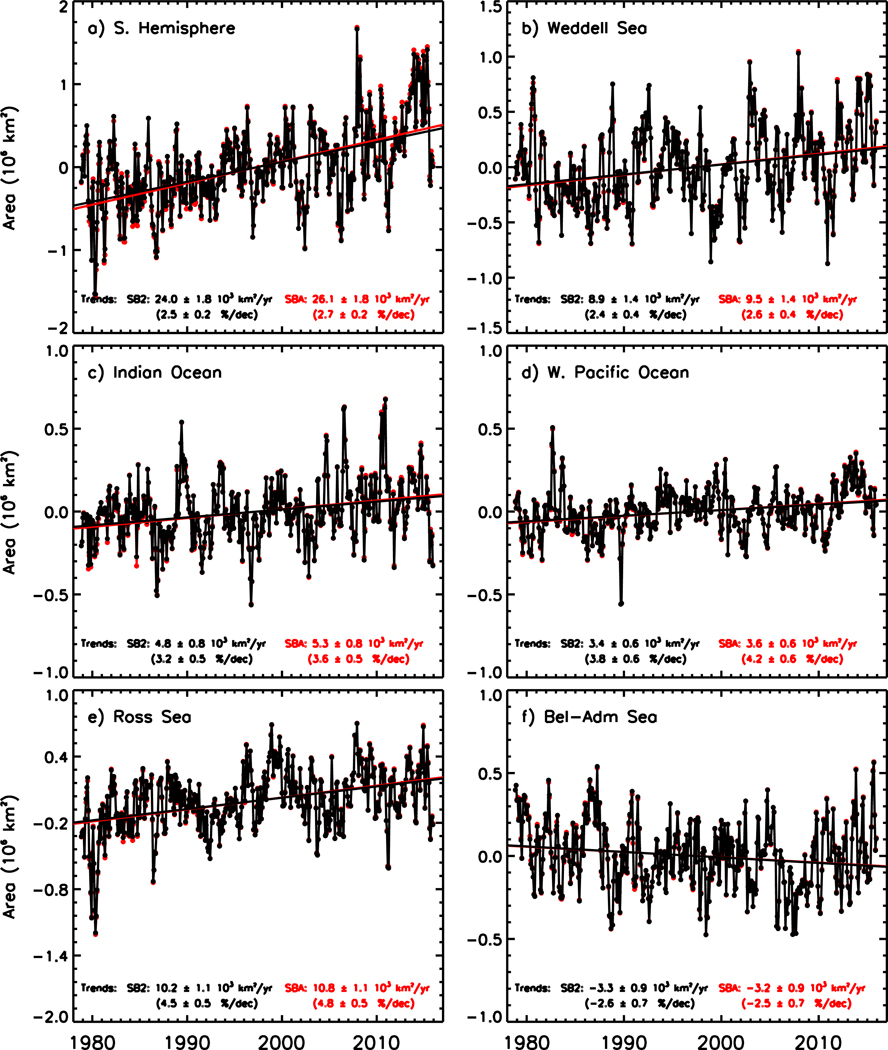
Plots of the time series of monthly anomalies of sea ice area from 1978 to 2015 and trends in the (a) entire Southern Hemisphere; (b) Weddell Sea; (c) Indian Ocean; (d) West Pacific Ocean; (e) Ross Sea; and (f) Bellingshausen/Amundsen Seas using both SB2 and SBA data.
The trends in the ice extent and ice area for the different seasons and also during the maximum and minimum ice extent are listed in Table 1. Although the yearly fluctuations in each category are relatively small the trends for the different cases vary significantly. Actual trends in km2 per year and percentage trends are provided for ease in interpretation. The season with the highest trend is observed to be autumn at 3.8 % per decade for ice extent and 5.4% per decade for ice area. These trends are significantly higher than the annual trend of 1.7% and 2.5% per decade for ice extent and ice area, respectively. This suggests that the slight increase in the trend in the more recent years is associated with more ice production in autumn. Following autumn are the more moderate trends in winter and summer while spring has the lowest trend at 0.9 %/decade for ice extent and 1.5%/decade for ice area. Note that the trends for ice minimum are relatively high suggesting increases in areas covered by thick ice in winter.
Table 1:
Trends in Sea Ice Extent and Area using SB2 during the 1979 to 2015 period for the different seasons and during maximum and minimum ice cover.
| Parameter | Trend in Area (×103km2/yr) | Pecentage Trend (%/dec) |
|---|---|---|
| Winter Ice Extent | 21.8 ± 5.0 | 1.39 ± 0.32 |
| Spring Ice extent | 16.4± 4.7 | 0.93 ± 0.27 |
| Summer Ice Extent | 16.3 ± 7.1 | 2.54 ± 1.10 |
| Autumn Ice extent | 26.4 ± 7.3 | 3.79 ± 1.05 |
| Minimum Ice Extent | 8.8 ± 5.8 | 2.89 ± 1.92 |
| Maximum Ice Extent | 20.4 ± 5.9 | 1.08 ± 0.31 |
| Annual Ice Extent | 20.2 ± 4.0 | 1.73 ± 0.34 |
| Winter Ice Area | 27.1 ± 4.8 | 1.98 ± 0.35 |
| Spring Ice Area | 22.5 ± 4.8 | 1.51 ± 0.32 |
| Summer Ice Area | 18.7 ± 5.8 | 4.21 ± 1.29 |
| Autumn Ice Area | 29.0 ± 6.8 | 5.24 ± 1.23 |
| Minimum Ice Area | 10.7 ± 4.4 | 5.41 ± 2.22 |
| Maximum Ice Area | 24.6 ± 5.5 | 1.50 ± 0.33 |
| Annual Ice Area | 24.3 ± 3.5 | 2.52 ± 0.36 |
To gain additional insights into the aforementioned trend results, plots of decadal averages of daily ice extent and area over an annual cycle are presented in Fig. 5. In particular, daily averages for the first decade of satellite data (i.e., 1979 to 1988) are represented by the red line, the second decade (1989 to 1998) by the blue line and the third (1999 to 2008) by the gold line. For comparison, although not a complete decade, daily averages for the 2009 to 2015 are shown in green while daily extents for the years 2013, 2014 and 2015 are presented as different gray levels. It is apparent that the changes in the first 3 decades were relatively minor with the biggest change occurring in autumn. The average values in the more recent years (green line) are obviously significantly higher than those of the previous periods. It is interesting that the yearly values for 2013 and 2014 are significantly higher than the 2009 to 2015 average. The plot for 2015 is intriguing since during summer and autumn (January to May) the values were relatively high and appeared headed for a record high but the rate of increase stalled in early winter and the maximum winter extent became much lower than that of 2014. In mid-August, the extent in 2014 was almost 2 × 10⁶ km2 higher than that of 2015. The ice extent in 2015 also indicates significant fluctuation but significantly lower extent during the winter with the maximum occurring later in winter than normal.
Figure 5.
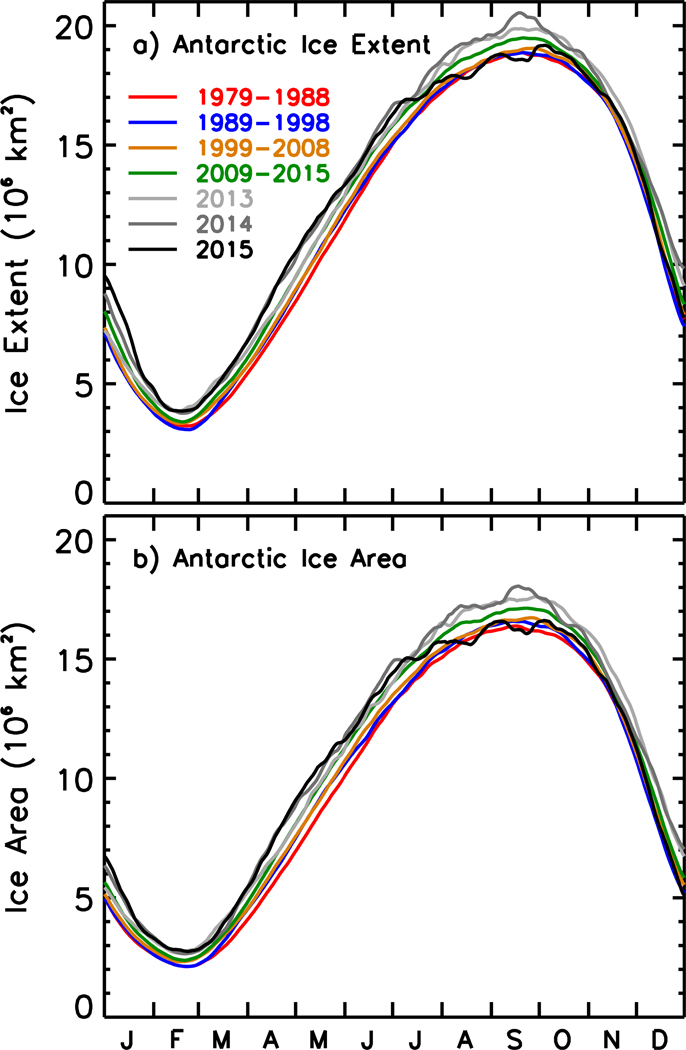
Plots shown decadal changes in the seasonality of Antarctic Sea Ice (a) extent and (b) area using daily averages. The first three decades are represented by red, blue and gold lines while the last decade (2009 to 2015 only) is represented by a green line. Data during the years 2013, 2014, and 2015 represented by different shades of gray are shown for comparison with the decadal averages.
To identify regions where the sea ice cover has been changing the most, color-coded maps of trends in ice concentration for each data element during different seasons and for the all seasons are presented in Fig. 6. Areas where the ice has been advancing are shown in greens and grays while areas where it has been retreating are depicted in purples and oranges. In spring and summer the maps show a pattern of alternating advance and retreat in sea ice cover around the Antarctic ice margins. In summer and autumn there is a persistence of negative trend in the Bellingshausen-Amundsen Seas and a persistence of positive trend in the other sectors especially in the Ross Sea. Note that areas of specific trend patterns are not confined to and may go beyond each sector. In particular, the trend may change from negative to positive within a sector indicating the need to interpret the trends in the various sectors with care. In winter and spring, sea ice retreats are apparent near the Antarctic Peninsula and parts of the Western Pacific Ocean while advances occur in the Ross/Western Amundsen Seas and the Eastern Weddell Sea and Indian Ocean. In the summer and autumn, ice decline is dominant in the Bellingshausen and Amundsen Seas while increases are dominant in the Weddell Sea and Western Ross Sea. In the all-season trend map (Fig. 6e) the trends are more modest overall but it is apparent that there is ice decline in the Bellingshausen and Amundsen Seas and ice advance in the Ross Sea and the other regions.
Figure 6.
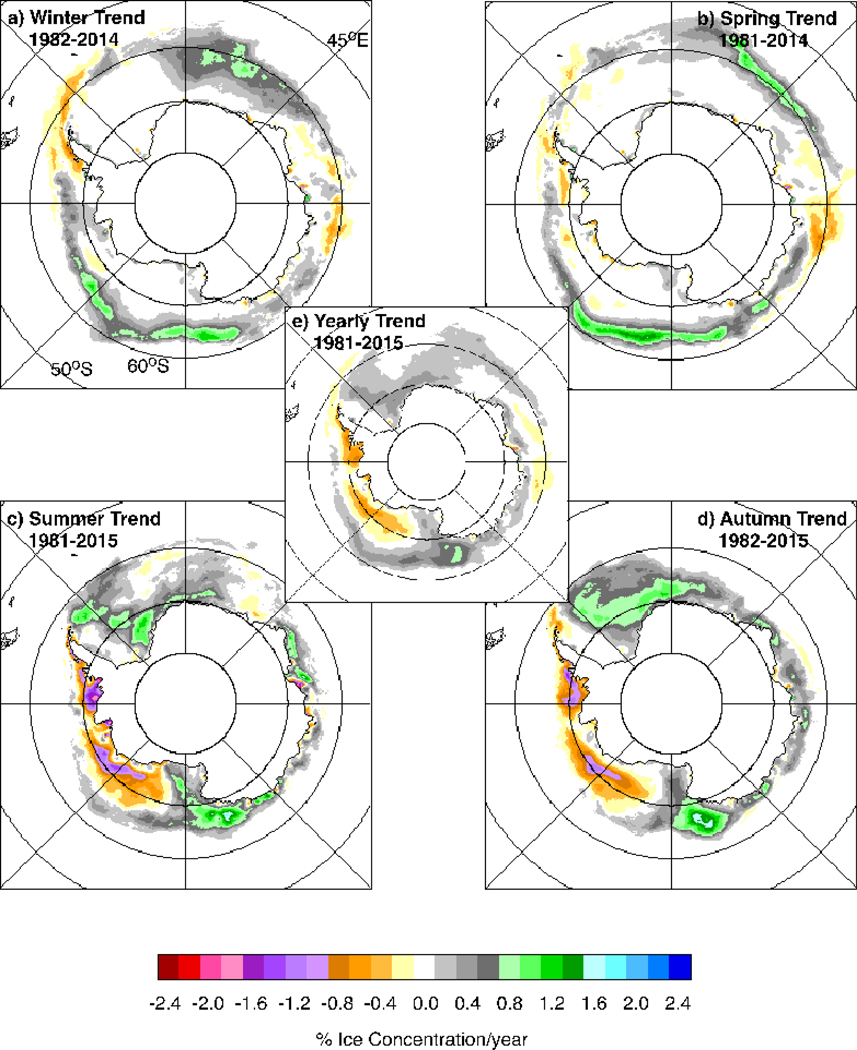
Color-coded maps of trends in the sea ice cover in each data element during the austral (a) winter; (b) spring; (c) summer and (d) autumn and (e) the entire year during the period August 1981 to December 2015.
b. Associated Variability and Trends in Surface Temperature
The availability of concurrent ice concentration and surface temperature data provided the opportunity to assess the temporal changes in surface temperature that may be associated with the observed trends in sea ice cover as indicated in Fig. 6. The maps of trends in surface temperature for the same periods, with the contours of the 15% ice concentration averaged for each period depicted by black contour lines, are presented in Fig. 7. The two maps reveal a striking coherence of the trends in surface temperature and the sea ice cover suggesting a strong connection. With a few exceptions, the regions where the trends in the sea ice cover are observed to be positive as depicted in Fig. 6 are also the general location where the temperature trends are negative indicating a general cooling as would be expected. For example, the regions near 0°E and 170°E where strong positive trend in sea ice have been observed are also the regions where strong negative trends in surface temperatures are observed. Conversely, the region where sea ice is observed to be declining, like the Bellingshausen-Amundsen Seas region is also where the trend in temperature is positive.
Figure 7.
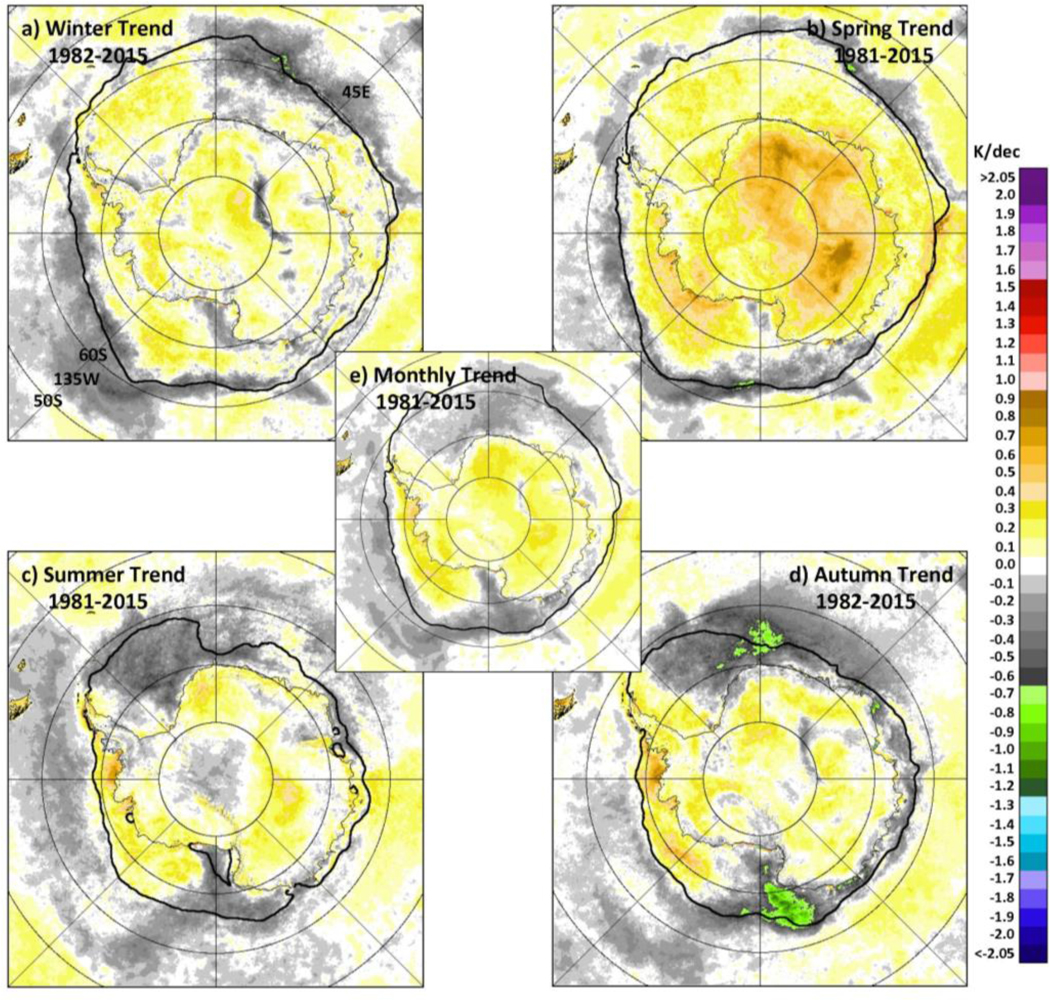
Color-coded maps of trend of surface temperatures in each data element during the austral (a) winter; (b) spring; (c) summer and (d) autumn and (e) the entire year during the period August 1981 to December 2015. The location of the 15% ice edge for each period is indicated by the black contour.
The all-season trend map of surface temperatures as shown in Fig. 7e depicts the spatial distribution of the trends, which are quantitatively more moderate than those of seasonal trends in part because of the averaging of trends. The trends in the continental region shows a general warming, although the trend maps for winter, autumn and summer show some cooling in parts of the continent. Again, this is due to the averaging and a significant warming in the continent during spring. Quantitatively, the overall trend of 0.1 K per decade is estimated using all pixels >60°S from 1981 to 2015 which is much lower than the 0.6 K per decade observed in the Arctic (Comiso and Hall, 2014).
It should be noted that ice-covered surfaces are usually colder than ice-free ocean surfaces and therefore an advancing (or retreating) ice would have an effect on the temperature trend. For example, during ice growth in autumn, sea ice is shown in Fig. 6d to have positive trends in most areas of the Weddell Sea. As more ice accumulates in a region, the trend in surface temperature would become more negative because the presence of more ice would lead to more surfaces with colder temperatures. This phenomenon, however, is only relevant in the advancing (or retreating) ice regions and in Fig. 7d the negative trend goes way beyond the sea ice covered regions indicating that there is cooling in the general region that includes ice free surfaces. The results of lag analysis as will be presented later actually suggest that the positive trend in sea ice is strongly influenced by the trend in surface temperature.
c. Correlation Analysis of Sea Ice versus Surface Temperature
Correlation analysis of sea ice area versus sea ice surface temperature for all monthly data from 1981 to 2015 yields a correlation coefficient of −0.68 which is relatively low because of the hysteresis effect. The correlation is stronger when data are divided into the growth period and the melt period. The results of doing correlation analysis of the data for the entire hemisphere and the various sectors during the growth period (March to August) are presented in Fig. 8. The correlation is shown to be very strong at −0.94 for the entire hemisphere. The correlation is also very strong and varies from −0.82 to −0.90 for data from the various sectors. The high correlation is an indication that temperature is strongly related to the area and extent of the ice cover. These results are also consistent with qualitative comparison of the anomalies for sea ice concentration and surface temperature in Figs. 6 and 7. Since it takes a few hours to a few weeks for the influence of surface temperature to cause an impact on the ice cover, a lag correlation analysis was also done using a one-month lag in surface temperature and the results show an even higher correlation at −0.96 for the entire hemisphere and −0.87 to −0.93 for the various sectors. The higher correlation with a one-month lag is indicative of an influence of surface temperature with the positive trend in area and extent of the sea ice cover.
Figure 8.
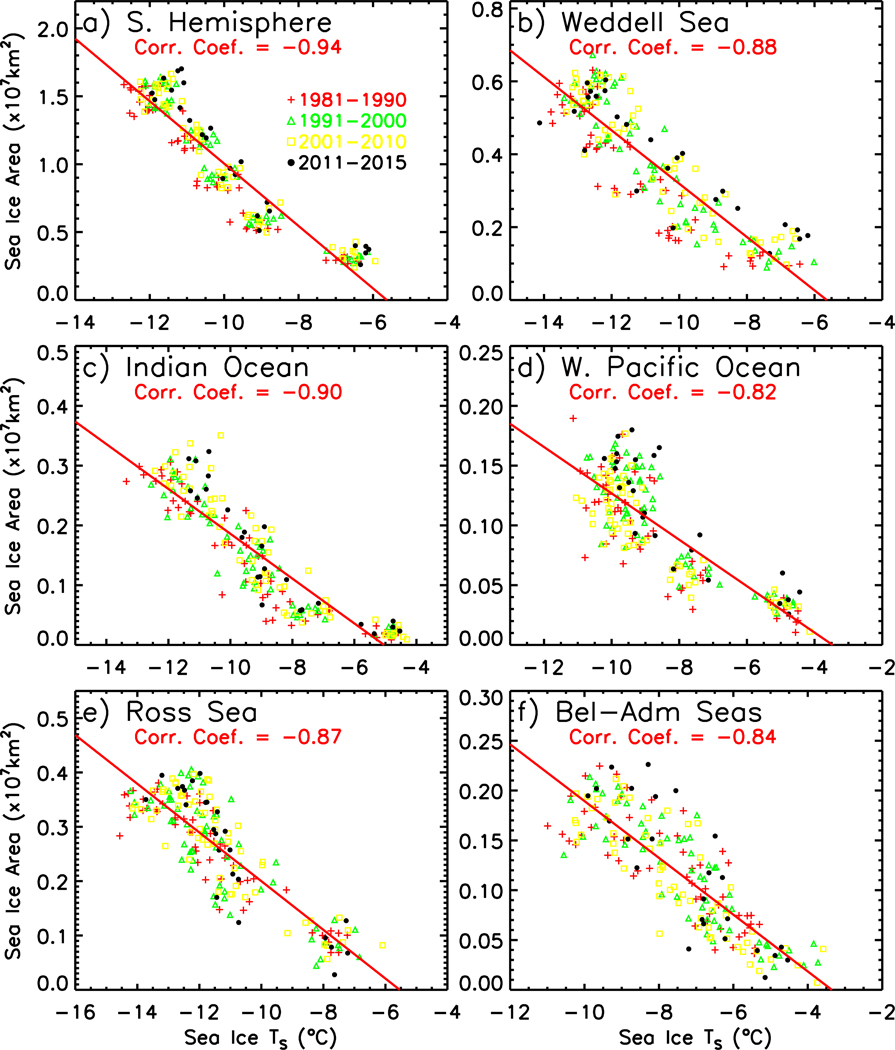
Scatter plot of sea ice area versus surface ice temperature for (a) the entire Antarctic region and (b-f) the various sectors. Data from the decades 1981–1990, 1991–2000, and 2001 to 2000 are indicated as red, green and yellow while the data for the remaining years are indicated in black. The red line is the result of a linear regression analysis that yielded the indicated correlation coefficient.
A similar correlation analysis was done for the ice melt period (September to February) and the results of the analysis yielded a correlation coefficient of −0.86 for the entire hemisphere and −0.80 to −0.91 for the various sectors. With a one-month lag in surface temperature, the correlation is dramatically increased to −0.98 for the entire hemisphere and −0.94 to −0.97 for the various sectors. Again, such increases in correlations with a one-month lag are indicative of a strong influence of surface temperature on the area and extent of the sea ice cover.
To address the effect of changing ice concentration on surface temperature, the analysis was repeated using actual sea ice temperature that excludes ice free water through the use of ice concentration data (not shown). The observed temperatures for each data element are highly correlated to actual sea ice temperatures with the correlation coefficient being 0.96 for the entire hemisphere and 0.93 to 0.96 for the various sectors except at the Ross Sea where the correlation is 0.73. The correlation of sea ice area with surface temperature is also high at −0.83.
c. Case Study: Ice Growth and Surface Temperature in 2014 and 2015
The growth patterns of sea ice in 2014 and 2015, as illustrated in Fig. 5, were very similar but deviated considerably starting in June as the ice cover increased to reached maximum extent in September. To gain insight into how this phenomenon may have been influenced by surface temperature and other variables, monthly anomalies of sea ice concentration, surface temperature, surface pressure and winds during the growth period in 2014 and 2015 are presented in Figs. 9 and 10, respectively. NCEP/NCAR reanalysis data (Kalnay et al. 1996) were used for the surface wind and sea level pressure maps. Fig. 9 shows a robust growth period for the sea ice cover (left column) in practically all regions for the months from June to September 2014 with the exception of some limited areas (near the Antarctic Peninsula). It is remarkable that the corresponding surface temperature anomaly maps during the period (middle column) show a very strong match, with the areas of negative anomaly (cooling) located in basically the same areas where significant ice growth (or positive anomalies) are located. Note again that the negative anomalies in temperature extend beyond the regions of positive anomalies in the sea ice cover indicating that the cooling is not just due to changes in ice concentration. The wind and pressure data as presented in the third column show substantial monthly variability but qualitative analysis indicates no consistent relationships to the observed anomalies in sea ice for each month. For example, the location of the lows changed considerably from June to July but the anomalies in sea ice and surface temperature were located in basically the same area. The changes in the distribution of anomalies in the ice cover in the Ross Sea and the Amundsen Sea from August to September are also coherent with the changes in the surface temperature anomaly maps but not with the wind or sea level pressure data.
Figure 9.
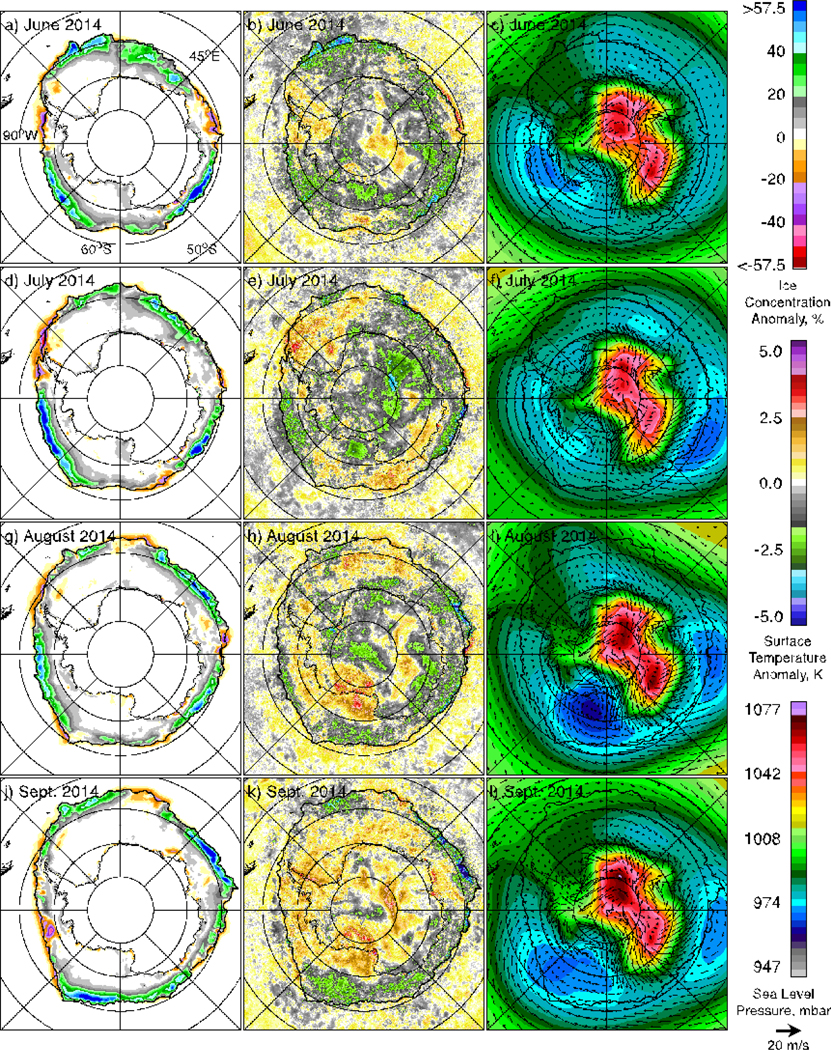
Color-coded monthly anomaly maps of sea ice (a, d, g, j) and surface temperature (b, e, h, k) and monthly average maps of sea level pressure and wind (c, f, i, l) from June to September 2014.
Figure 10.
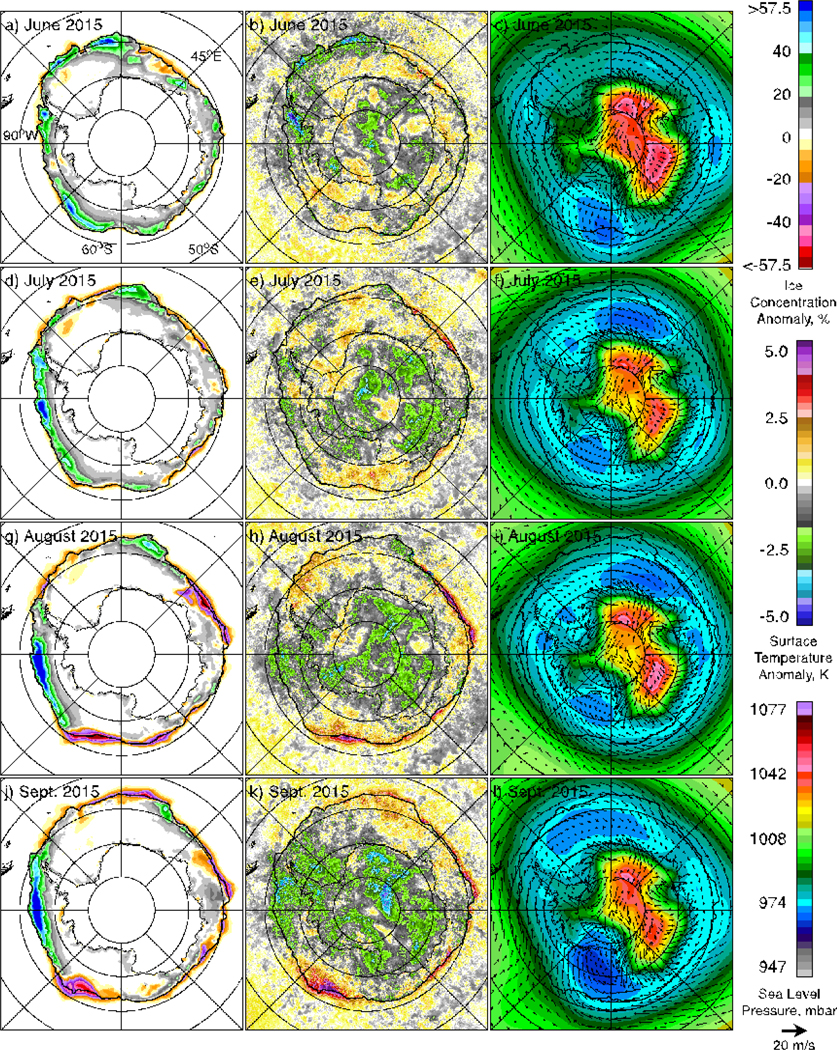
Color-coded monthly anomaly maps of sea ice (a, d, g, j) and surface temperature (b, e, h, k) and monthly average maps of sea level pressure and wind (c, f, i, l) from June to September 2015.
A similar set of images for 2015, as presented in Fig. 10, shows a significantly different growth pattern for the period June to September. Although sea ice advance was also robust in June 2015 as in June 2014, the areas of negative anomalies started to appear in July and was much more apparent in August and September especially in the Ross Sea region and to a lesser degree, the Weddell Sea and Indian Sea regions. Again, the matching of negative anomalies in sea ice to the positive anomalies in surface temperature is very good in practically all areas. It is interesting to note that the Bellingshausen/Amundsen Seas sector and a small segment of Western Indian Ocean are areas of persistent positive anomalies in surface temperature. These anomalies are coherent with the anomalies in the sea ice cover during the June to September period. Meantime, there are no apparent changes in the sea level pressure and the wind pattern that may be associated with changes in the sea ice cover.
e. Influence of Other Environmental Factors
The influence of other factors on the trend of the Antarctic ice extent have been studied by several investigators (Hobbs et al. 2015; Zhang 2007; Holland and Kwok 2012; Turner et al. 2013). Among the key factors that have been considered is the change in atmospheric circulation in the Antarctic region as may be influenced by the Southern Annular MODE (SAM). A direct correlation analysis of SAM indices with sea ice extent for data from November 1978 to December 2016 yielded a correlation coefficient of 0.43 which indicates some but a relatively weak connection. A similar correlation analysis using monthly surface temperature data yielded an even weaker correlation coefficient of 0.025. A factor which may need greater attention is the influence of extra-polar phenomena like ENSO. A recent report indicates that the trends in the winter ice edge over the Ross Sea and Bellingshausen/Amundsen Seas regions are highly correlated to trends in atmospheric anomalies associated with ENSO (Kwok et al. 2016). This phenomenon may also be the cause of some of the changes in the spatial distribution of surface temperature in the region.
Prior to the record high extent in 2014 there was a record high extent in 2012 the temporal evolution of which was studied by Turner et al. (2013). The authors concluded that the record high extent was associated with the intrinsic variability of the Amundsen Sea low (Turner et al. 2015) which in turn would cause more ice production in the Ross Sea region and the observed cooling in the region.
f. Trends in Surface Temperature from Numerical Models
The failure of current coupled climate models to reproduce the positive trend in Antarctic sea ice has been the subject of strong interest. To gain some insights into this phenomenon we show a comparison of trends from AVHRR data (Fig. 11a) with those from reanalysis data (Figs. 11b and 11c). The trend map using NCEP data shows a reasonable agreement with observations near the ice margin but shows much stronger positive values within the continent and also in the Ross Sea region. The ECMWF trends show the best consistency with AVHRR trends but there are significant discrepancies in Weddell Sea, Indian Ocean, the Ross Sea and the Amundsen Sea. The problems with models like CMIPS have been discussed by Turner et al. (2013) but if models provide trends similar to those provided by NCEP and ECMWF data it would be highly unlikely for them to reproduce the observed positive trend in the sea ice cover. For completeness, we show in Fig. 11d the trend from the GSFC/Merra-2 data assimilation model that makes use as input satellite observed sea ice data. In this case where the trend in sea ice cover is correct, the resulting trends in surface temperature distribution are much more negative than AVHRR trends. The inability of Merra-2 to match observed surface temperature data is again an indication that the performance of the models needs to be improved.
Figure 11.
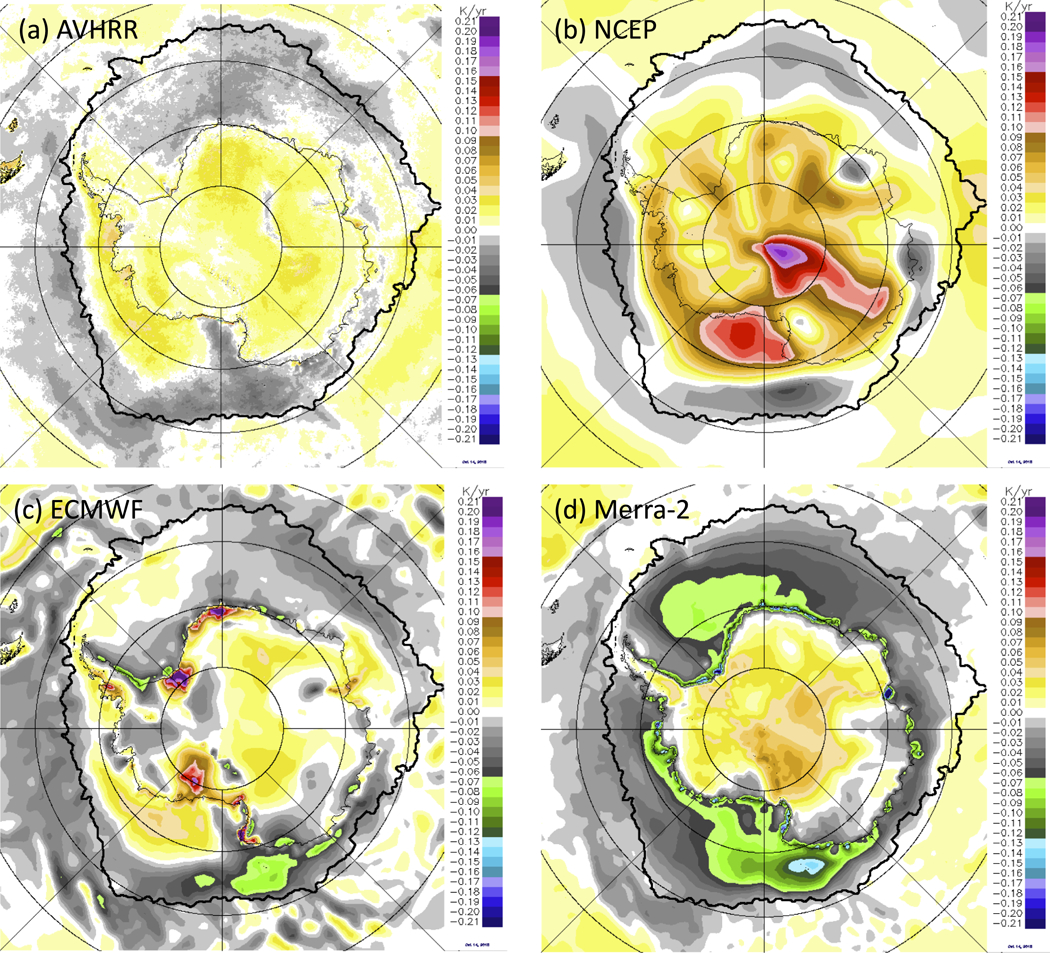
Trends in surface temperature using data from (a) AVHRR; (b) NCEP; (c) ECMWF; and (d) Merra-2.
4. Discussion and Conclusions
This study confirms using an enhanced sea ice data set that the trend in the Antarctic sea ice cover is positive. The trend is even more positive than previously reported because prior to 2015, the sea ice extent was anomalously high for a few years with the record high recorded in 2014 when the ice extent was more than 20 × 106 km2 for the first time during the satellite era. The positive trend, however, should not be regarded as unexpected despite global warming and the strong negative trend in the Arctic ice cover because the distribution of global surface temperature trend is not uniform. In the Antarctic region the trend in surface temperature is about 0.1 °C per decade while the trend is 0.6 °C per decade in the Arctic and 0.2 °C per decade globally since 1981 (Comiso and Hall, 2014).
The observed positive trend in the sea ice cover is found to be highly coherent with the trend in surface temperature. The results of correlation analyses show very strong relationships between surface temperature and sea ice area with the correlation coefficient being −0.94 without lag and −0.96 with one-month lag in surface temperature during the growth period. During the melt period, the increase in correlation coefficient with a month lag in surface temperature is even higher being −0.86 without lag and −0.98 with one-month lag. The significant increase in correlation when a lag in surface temperature is applied is indicative of a strong role of surface temperature on the observed positive trends in the sea ice extent. A similar analysis using surface temperature of only ice covered areas yielded similar results. On the other hand, the results of regression analysis of SAM indices versus sea ice extent over the entire study period indicate a relatively weak correlation suggesting a less important role of atmospheric circulation on the increasing ice extent in the Antarctic.
During the 1979 to 2015 period, the overall trend in sea ice cover was estimated to be 1.7% per decade and was dominantly positive in the Ross Sea region while dominantly negative in the Bellingshausen/Amundsen Seas. Such contrast in ice trends is consistent with the observed trends in surface temperature and also has been cited as a manifestation of the important role of the Amundsen Sea Low in the region (Turner et al. 2016). A case study comparing the 2014 data when the extent was a record high to 2015 data when the extent was more moderate depicts the strong coherence of temperature changes with those of the sea ice cover. A connection of changes in sea ice cover with those of wind forcing and sea level pressure during the two years is not so apparent.
A comparison of the distribution and magnitude of trends of the satellite observed surface temperature in the Antarctic with those from reanalysis data (i.e., NCEP, ECMWF and Merra-2) shows large discrepancies. A representation of surface temperatures by climate models that agrees better with observed surface temperatures is likely needed to ensure that the simulated trends in Antarctic sea ice extent agree with those from satellite observations.
Acknowledgement
We are grateful to the NASA Cryospheric Sciences Program for providing funding support for this project. Sea ice brightness temperature data was provided by NSIDC while surface temperature data were provided by NOAA.
References
- Ackley SF, Wadhams P, Comiso JC, and Worby A, 2003: Decadal decrease of Antarctic sea ice extent from whaling records revisited on the basis of historical and modern sea ice records. Polar Research, 22, 10–25. [Google Scholar]
- Parkinson CL., and Cavalieri DJ, 2012: Antarctic sea ice variability and trends. 1979–2010. Cryosphere, 6(4), 871–880. [Google Scholar]
- Cavalieri DJ, Gloersen P, Parkinson C, Comiso J, and Zwally HJ, 1997: Observed hemispheric asymmetry in global sea ice changes. Science, 278, 1104–1106,1997. [Google Scholar]
- Cho K, Sasaki N, Shimoda H, Sakata T, and Nishio F, 1996: Evaluation and improvement of SSM/I sea ice concentration algorithms for the Sea of Okhotsk. J. Rem. Sens. Soc. of Japan, 16, 133–144. [Google Scholar]
- Comiso JC, 1995: SSM/I Concentrations using the Bootstrap Algorithm, NASA RP, 1380, 40pp. [Google Scholar]
- Comiso JC, 2000: Variability and trends in Antarctic surface temperatures from in situ and satellite infrared measurements. J. Climate, 13, 1674–1696. [Google Scholar]
- Comiso JC, 2002: A rapidly declining Arctic perennial ice cover. Geophys Res. Letts, 29, 1956, doi: 10.1029/2002GL015650. [DOI] [Google Scholar]
- Comiso JC (2003) Warming Trends in the Arctic, J. Climate, 16(21), 3498–3510. [Google Scholar]
- Comiso JC, 2010: Polar Oceans from Space, Springer Publishing, New York, doi 10.1007/978-0-387-68300-3. [DOI] [Google Scholar]
- Comiso JC and Hall DK, 2014: Climate Trends in the Arctic. WIREs (Wiley Interdisciplinary Reviews) Climate Change, Advanced Review, 5, doi: 10.1002/wcc.277. [DOI] [PMC free article] [PubMed] [Google Scholar]
- Comiso JC and Nishio F, 2008: Trends in the sea ice cover using enhanced and compatible AMSR-E, SSM/I, and SMMR data. J. Geophys. Res., 113, C02S07, doi: 10.1029/2007JC004257. [DOI] [Google Scholar]
- Comiso JC, Cavalieri D, Parkinson C, and Gloersen P, 1997: Passive microwave algorithms or sea ice concentrations. Remote Sensing of the Env., 60, 357–384. [Google Scholar]
- Comiso JC, Cavalieri DJ, and Markus T, 2003: Sea ice concentration, ice temperature, and snow depth, using AMSR-E data. IEEE TGRS, 41, 243–252. [Google Scholar]
- Comiso JC, Kwok R, Martin S and Gordon A, 2011: Variability and trends in sea ice and ice production in the Ross Sea. J. Geophys. Res., 116, C04021, doi:1029/2010JC006391. [Google Scholar]
- de la Mare WK, 1997: Abrupt mid-twentieth century decline in Antarctic sea-ice extent from whaling records. Nature, 389, 57–60, doi: 10.1038/37956. [DOI] [Google Scholar]
- Eisenman I, Meier WN, and Norris JR, 2014: A spurious jump in the satellite record: Has Antarctic sea ice expansion been overestimated? Cryosphere, 8, 1289–1296. [Google Scholar]
- Evans R, and Podesta G, 1996: AVHRR Pathfinder SST approach and results. EOS Trans. Amer. Geophys. Union, 77, 354. [Google Scholar]
- Gagné ME, Gillett1 NP, and Fyfe JC, 2014: Observed and simulated changes in Antarctic sea ice extent over he past 50 years. Geophys. Res. Lett., 42, 90–95, doi : 10.1002/2014GL062231. [DOI] [Google Scholar]
- Hobbs WR, Bindoff NL, Raphael MN, 2015: New perspectives on observed and simulated Antarctic sea ice extent trends using optimal fingerprinting techniques, J. Climate, 28: 1543–1560. [Google Scholar]
- Holland PR, and Kwok R, 2012: Wind-driven trends in Antarctic sea-ice drift. Nature Geoscience, 5, 872–875. [Google Scholar]
- Ivanova N, Pedersen LT, Tonboe RT, Kern S, Heygster G, Lavergne T, S0rensen A, Saldo R, Dybkjær G, Brucker L, and Shokr M, 2015: Satellite passive microwave measurements of sea ice concentration: an optimal algorithm and challenges. The Cryosphere Discuss., 9, 1269–1313. [Google Scholar]
- IPCC., 2014: “Summary for Policymakers” In Climate Change 2013: The Physical Basis. Contribution of Working Group I to the Fifth Assessment Report of the Intergovernmental Panel on Climate Change, edited by Stocker TF, Qin D, Plattner GK, et al. Cambridge: Cambridge University Press, 1–27. [Google Scholar]
- Jacobs SS, 2006: Observations of change in the Southern Ocean. Phil. Trans. Royal Soc., 364, 1657–1681, doi: 10.1098/rsta.2006.1794. [DOI] [PubMed] [Google Scholar]
- Jacobs SS, and Comiso JC, 1997: Climate variability in the Amundsen and Bellingshausen Seas. J. Climate, 10, 697–709. [Google Scholar]
- Kalnay E, Kanamitsu R, Krisler R, Collins W, Deaven D, Gandin L, Iredell M, Saha S, White G, Wollen J, Zhsu Y, Chella M, Janowlak J, Eb W, Ropelewski CR, Jenne R, 1996: The NCEP/NCAR reanalysis project. Bull. Amer. Meteor. Soc. 77, 437–479. [Google Scholar]
- King JC, and Comiso JC, 2003: The spatial coherence of inteannual temperature variations in the Antarctic Peninsula. Geophys. Res. Lett., 30, 1040, doi: 10.1029/2002GL015580. [DOI] [Google Scholar]
- Kurtz NT, Farrell SL, Studinger M, Galin N, Harbeck JP, Lindsay R, Onana VD, Panzer B and Sonntag JG, 2013: Sea ice thickness, freeboard, and snow depth products from Operation Ice Bridge airborne data. The Cryosphere, 7, 1035–1056. [Google Scholar]
- Kwok R, and Comiso JC, 2002: Spatial patterns of variability in Antarctic surface temperature: Connections to the Southern Hemisphere Annular Mode and the Southern Oscillation. Geophys. Res. Lett., 29, doi: 10.1029/2002GL015415. [DOI] [Google Scholar]
- Kwok R, and Comiso JC, 2002: Southern ocean climate and sea ice anomalies associated with the Southern Oscillation. J. Climate, 15, 487–501. [Google Scholar]
- Kwok R, Comiso JC, Lee T and Holland PR, 2016: Linked trends in the South Pacific sea ice edge and Southern Oscillation Index. Geophy. Res. Lett., 43, doi: 10.1002/2016GL070655. [DOI] [Google Scholar]
- Parkinson CL, and Cavalieri DJ, 2012: Antarctic sea ice variability and trends, 1979–2010. Cryosphere, 6, 871–880. [Google Scholar]
- Parkinson CL, and Comiso JC, 2008: Antarctic sea ice from AMSR-E from two algorithms and comparisons with sea ice from SSM/I. J. Geophys. Res., 113, C02S06, doi: 10.1029/2007JC004253. [DOI] [Google Scholar]
- Markus T and Cavalieri DJ, 2009: The AMSR-E NT2 Sea ice concentration algorithm: its basis and implementation. Remote Sensing Soc. of Japan, 29, 216–223. [Google Scholar]
- Martin S, Drucker RS and Kwok R, 2007: The areas and ice production of the western and their relation to the B-15 and C-19 of 2000 and 2002, J. Marine Systems, 68, 201–214. [Google Scholar]
- Reynolds RW, Rayner NA, Smith TM, Stokes DC, Wang W, 2002: An improved in situ and satellite SST analysis for climate. J. Climate, 15, 1609–1625. [Google Scholar]
- Shuman C, and Comiso JC, 2002: In situ and satellite surface temperature records in Antarctica, Annals of Glaciology, 34, 113–120. [Google Scholar]
- Sigmond M, and Fyfe JC, 2010: Has the ozone hole contributed to increased Antarctic sea ice extent?, Geophys. Res. Lett., 37, L18502, doi : 10.1029/2010GL044301. [DOI] [Google Scholar]
- Steffen K, Cavalieri DJ, Comiso JC, St K. Germain P. Gloersen, Key J, and Rubinstein I, 1992: “The estimation of geophysical parameters using Passive Microwave Algorithms,” Chapter 10, Microwave Remote Sensing of Sea Ice, (ed. by Carsey Frank), American Geophysical Union, Washington, D.C., 201–231. [Google Scholar]
- Steffen K, Bindschadler R, Casassa C, Comiso J, Eppler D, Fetterer F, Hawkins J, Key J, Rothrock D, Thomas R, Weaver R, and Welch R, 1993: Snow and ice applications of AVHRR in polar regions. Ann. Glaciol., 17, 1–16. [Google Scholar]
- Steig EJ, Schneider DP, Rutherford SD, Mann ME, Comiso JC and Shindell DT, 2009: Warming of the Antarctic ice sheet surface since the 1957 International Geophysical Year. Nature, 457, 459–463. [DOI] [PubMed] [Google Scholar]
- Swart NC, and Fyfe JC (2013), The influence of recent Antarctic ice sheet retreat on simulated sea ice area trends. Geophys. Res. Lett., 40, 4328–4332, doi: 10.1002/grl.50820. [DOI] [Google Scholar]
- Turner J, Comiso JC, Marshall GJ, Lachlan-Cope TA, Bracegirdle T, Maksym T, Meredith M and Wang Z. 2009: Non-annular atmospheric circulation change induced by stratospheric ozone depletion and its role in the recent increase of Antarctic sea ice extent. Geophy. Res. Lett. 36, L08502, doi: 10.1029/2009GL037524. [DOI] [Google Scholar]
- Turner J JS Hosking T. Phillips, and Marshall GJ, 2013: Temporal and spatial evolution of the Antarctic sea ice prior to the September 2012 record maximum extent. Geophys. Res. Lett., 40, 5894–5898, doi: 10.1002/2013GL058371. [DOI] [Google Scholar]
- Turner J, Hosking JS, Marshall GJ, Phillips T, and Bracegirdle TJ, 2015: Antarctic sea ice increase consistent with intrinsic variability of the Amundsen Sea Low. Climate Dynamics, 46(7), doi: 10.1007/s00383-015-2708-9. [DOI] [Google Scholar]
- Turner J, Hosking JS, Bracegirdle TJ, Marshall GJ and Phillips T, 2016: Recent changes in Antarctic sea ice. Phil. Trans. R. Soc., A373, doi:org/10.1098/214.0163. [DOI] [PubMed] [Google Scholar]
- Wang X, and Key JR, 2005: Arctic Surface, Cloud, and Radiation Properties Based on the AVHRR Polar Pathfinder Dataset. Part I: Spatial and Temporal Characteristics. J. Clim, 18, 2558–2574. [Google Scholar]
- White WB and Peterson RG, 1996: An Antarctic circumpolar wave in surface pressure, wind, temperature and sea ice extent, Nature, 380, 699–702, doi: 10.1038/380699a0. [DOI] [Google Scholar]
- Zhang J, 2007: Increasing Antarctic sea ice under warming atmospheric and oceanic conditions. J. Climate, 20, 2515–2529, doi:10-5194/tc-7-451-2013. [Google Scholar]
- Zwally HJ, Parkinson CL, and Comiso JC, 1983: Variability of Antarctic sea ice and changes in carbon dioxide, Science, 220, 1005–1012. [DOI] [PubMed] [Google Scholar]
- Zwally HJ, Comiso JC, Parkinson CL, Cavalieri DJ, Gloersen P, 2002: Variability of the Antarctic sea ice cover. J. Geophys. Res, 107, 1029–1047. [Google Scholar]


