Abstract
Context.
Pre-equinox measurements of comet 67P/Churyumov-Gerasimenko with the mass spectrometer ROSINA/DFMS on board the Rosetta spacecraft revealed a strongly heterogeneous coma. The abundances of major and various minor volatile species were found to depend on the latitude and longitude of the nadir point of the spacecraft. The observed time variability of coma species remained consistent for about three months up to equinox. The chemical variability could be generally interpreted in terms of surface temperature and seasonal effects superposed on some kind of chemical heterogeneity of the nucleus.
Aims.
We compare here pre-equinox (inbound) ROSINA/DFMS measurements from 2014 to measurements taken after the outbound equinox in 2016, both at heliocentric distances larger than 3 AU. For a direct comparison we limit our observations to the southern hemisphere.
Methods.
We report the similarities and differences in the concentrations and time variability of neutral species under similar insolation conditions (heliocentric distance and season) pre- and post-equinox, and interpret them in light of the previously published observations. In addition, we extend both the pre- and post-equinox analysis by comparing species concentrations with a mixture of CO2 and H2O.
Results.
Our results show significant changes in the abundances of neutral species in the coma from pre- to post-equinox that are indicative of seasonally driven nucleus heterogeneity.
Conclusions.
The observed pre- and post-equinox patterns can generally be explained by the strong erosion in the southern hemisphere that moves volatile-rich layers near the surface.
Keywords: comets: individual: 67P/Churyumov-Gerasimenko, methods: data analysis, methods: observational
1. Introduction
The many unexpected surprises of comet 67P/Churyumov-Gerasimenko (hereafter 67P) revealed by the historic Rosetta mission highlight the importance of observing the evolution of comets throughout their orbits. One of the surprises was the drastic heterogeneity in both the major and minor volatile species in the coma that was observed early on in the mission (Hässig et al. 2015; Luspay-Kuti et al. 2015, hereafter ALK15). When Rosetta first arrived at comet 67P in August 2014, the Rosetta Orbiter Mass Spectrometer for Ion and Neutral Analysis/Double Focusing Mass Spectrometer (ROSINA/DFMS; Balsiger et al. 2007) detected large diurnal variations in the intensity profiles of various species in the coma from distances to the comet as far as 250 km. At this time, 67P was still at a distance of about 3 AU and inbound from the Sun. The intensity variations in the major and minor volatile species were found to be periodic, and were dependent on both the observing sub-spacecraft latitude and longitude (Hässig et al. 2015; ALK15). As reported in Hässig et al. (2015), the intensity of H2O in the coma dominated the overall signal, with maxima in the H2O signal every ~6 h, about twice during a rotation. Interestingly, however, CO2 and CO displayed a separate additional maximum when the H2O signal was near its minimum. This independent maximum in CO2 and CO only occurred at negative observing latitudes that are associated with a particular “view” of Rosetta at 67P, with the larger lobe blocking out the neck and head. At this time, 67P had not yet reached its first equinox (10 May 2015), and the poorly illuminated southern hemisphere was experiencing winter. In addition, the largest H2O activity was localized at the well-illuminated neck region, as also seen by the Microwave Instrument on the Rostta Orbiter (MIRO; Gulkis et al. 2015; Biver et al. 2015; Lee et al. 2015) and by the Visible InfraRed Thermal Imaging Spectrometer (VIRTIS; Bockelée-Morvan et al. 2015; Migliorini et al. 2016). VIRTIS also measured weak H2O production in regions with low solar illumination, while CO2 was outgassing from both illuminated and non-illuminated regions pre-inbound equinox (Bockelée-Morvan et al. 2015; Migliorini et al. 2016; Fink et al. 2016). The observed outgassing pattern of the major cometary species suggested that CO and CO2 may be sublimating from a depth below the diurnal skin depth.
The fact that these maxima in the more volatile CO2 and CO at times of H2O minima were clearly associated with the southern, winter hemisphere implied that the difference in temperature between the two hemispheres is at least an important contributor to the observed phenomenon. The idea of possible thermal effects driving the observed outgassing pattern was further explored in ALK15, where in addition to H2O, CO2, and CO, we reported on the variability of HCN, CH3OH, C2H6, and CH4 over the southern hemisphere between September and October 2014. ALK15 found that the coma heterogeneity was not limited to the major species, and that the minor species followed the time variation of either H2O or CO2. Correlation plots and standard correlation coefficients were used to determine the degree of correlation between minor species and either H2O or CO2 (the general method of maximum correlation used here was established by Livadiotis & McComas 2013). The less volatile species (with a volatility between that of CO2 and H2O) HCN and CH3OH showed a strong correlation with H2O, while the more volatile (volatility higher than that of CO2) C2H6 and CO strongly correlated with CO2. CH4 showed a different, unique behavior, where it did not follow either of the major species. These correlations, along with the fact that the absolute abundances of CO2, CO, and the analyzed minor species relative to H2O were higher over the poorly illuminated southern (winter) hemisphere than over the northern, summer hemisphere (Le Roy et al. 2015), were interpreted as some type of nucleus heterogeneity superposed on temperature effects (ALK15). Heterogeneity could be driven by seasonal mass transfer on the nucleus (e.g., Keller et al. 2017). The lower temperatures over the southern hemisphere were high enough to drive the sublimation of the more volatile species, but not enough for H2O and the less volatile species to sublimate. Furthermore, the apparent strong correlation of polar species with H2O and that of non-polar species with CO2 indicated the possible existence of two distinct ice phases in (at least) the southern hemisphere nucleus (ALK15), but that CH4 did not follow the time variation of other non-polar species suggested that this picture might be more complicated.
Based on the time variations and correlations of the analyzed non-polar species from ALK15, Luspay-Kuti et al. (2016) concluded that the observed outgassing pattern early in the mission, and especially the different behavior of CH4, could be explained by the presence of CH4, C2H6, and possibly other clathrates in the nucleus of 67P. These results complemented other early findings of the possible presence of N2, Ar, and CO clathrates (Lectez et al. 2015; Mousis et al. 2016a,b). Sublimation of pure condensates is another possibility, wherein gases released from either amorphous ice or clathrates may recondense and stratify during diffusion in the porous nucleus (e.g., Huebner et al. 2006; Prialnik et al. 2004; Laufer et al. 2018).
While it is clear that measuring the diurnal variability of gases in the coma provides a limited way to indirectly infer various properties of the nucleus (e.g., composition, sub-surface temperature, layering, ice phase, or content of volatile species), temporal changes as the comet evolves along its orbit are also crucial to consider. For the first time, the Rosetta mission allows us to study temporal and spatial changes in situ in the outgassing of the same comet as it travels around the Sun, during which journey dramatic changes in insolation are encountered. At the same time, the two equinoxes provide a unique opportunity to compare observations for conditions that were presumably the same, or at least as similar as possible.
The pre-equinox neutral gas observations of the poorly illuminated southern hemisphere of the comet outlined above serve as motivation for this work. In particular, this work looks at the behavior following the outbound equinox (21 March 2016), when similar conditions (heliocentric distance and season) are reproduced. For a direct and valid comparison with the pre-equinox results of ALK15, it is important to “recreate” the same conditions as well as possible. Therefore, it was critical to restrict the analyzed time span to intervals comparable to those in ALK15 in order to avoid introducing unknown variables. However, insolation conditions could not be reproduced, and these conditions turn out to be an important factor in interpreting the observations.
A similar pattern in the time variation of species and correlations of minors with H2O and CO2 following the outbound equinox would strengthen the simplified story of some kind of compositional heterogeneity superposed on thermal effects. A different pattern, on one hand, may shed light on physical changes in the southern hemisphere nucleus during perihelion passage, when the southern hemisphere experienced a short but “hot” summer (Altwegg et al. 2017; Hansen et al. 2016) and the solar phase angle on the southern hemisphere is different from pre-perihelion. On the other hand, it may indicate that the scenarios proposed for the early, pre-perihelion observations of neutral species are more complicated than what can be explained by the simplified picture of nucleus heterogeneity and temperature effects. Here, we perform the first direct comparison of the early mission results from ALK15 to the same areas (southern hemisphere) at the same heliocentric distances. We perform this comparison for as close to the same season (southern hemisphere “winter”) as possible, nearly two years later, but not for the exact same insolation conditions. We model the actual illumination conditions for the pre- and post-equinox observations to illustrate the differences. The direct comparison of the neutral gas coma behavior is critical to better understand the evolution of the nucleus subsurface and cometary outgassing.
2. Methods
To compare the southern hemisphere behavior of neutral species from early in the mission to outgassing under similar conditions following an intense southern hemisphere summer, we analyzed the ROSINA/DFMS data obtained after the second equinox (March 2016). Here, we use the term “pre-equinox” to refer to the time preceding the inbound equinox in May 2015, and “post-equinox” refers to the time after the outbound equinox in March 2016. For the most direct comparison between pre- and post-equinox, we needed to select post-equinox dates that would most closely reflect the conditions reported in ALK15. Thus, we again focused on the southern hemisphere alone (negative sub-spacecraft latitudes), and selected dates and times when the heliocentric distance was about the same as reported in ALK15. Based on these criteria, we chose two time periods: (1) from 22 June 2016; 06:00 UTC to 24 June 2016; 24:00 UTC, and (2) from 8 July 2016; 06:00 UTC to 10 July 2016 11:00 UTC. The average heliocentric and comet-centric distances for the pre- and post-equinox time periods of Rosetta are summarized in Table 1.
Table 1.
Average heliocentric distance (rh) in astronomical units (AU), and average distance of Rosetta from comet 67P (d) in km for pre-equinox (from ALK15) and post-equinox (this work).
| Pre-equinox | Post-equinox | ||||
|---|---|---|---|---|---|
| Sep. 18 2014 | Sep. 26–30 2014 | Oct. 11 2014 | Jun. 22–24 2016 | Jul. 8–10 2016 | |
| 3.3 | 3.2 | 3.2 | 3.2 | 3.3 | |
| 29 | 24 | 14 | 25 | 18 | |
Following the theme to match the pre- and post-equinox observations as well as possible, we performed the same data analysis on the same masses for post-equinox as we did for pre-equinox in ALK15. In its high-resolution mode, ROSINA/DFMS has an unprecedented mass separation of m/Δm=3000 at 1% of the peak height on mass/charge 28 u/e (Balsiger et al. 2007). We used high-resolution DFMS data again for our two selected post-equinox time periods. Similarly to the pre-equinox data shown in ALK15, the post-equinox data were not corrected for the sensitivities of the different species. Because we examined general trends in the time evolution and correlations between species in ALK15, we followed the same direction in this work and did not consider absolute densities. Therefore, as in ALK15, it is important to emphasize that the values shown in this paper do not represent absolute abundances. To avoid being interpreted as densities, we only showed the normalized detector signal in ALK15. However, potential changes, or the lack thereof in the signal strength between pre- and post-equinox may be present, and it is important to identify them. Thus, the analyzed signal strength is reported here in units of particles/20 s (i.e., the number of ionized neutral particles hitting the detector in 20 s). For comparison, we also show the signal strength for one of the pre-equinox time periods studied in ALK15 (29–30 September 2014) in Fig. 1. The species signals over this time period were typical of the southern hemisphere up to about two to three months pre-equinox.
Fig. 1.
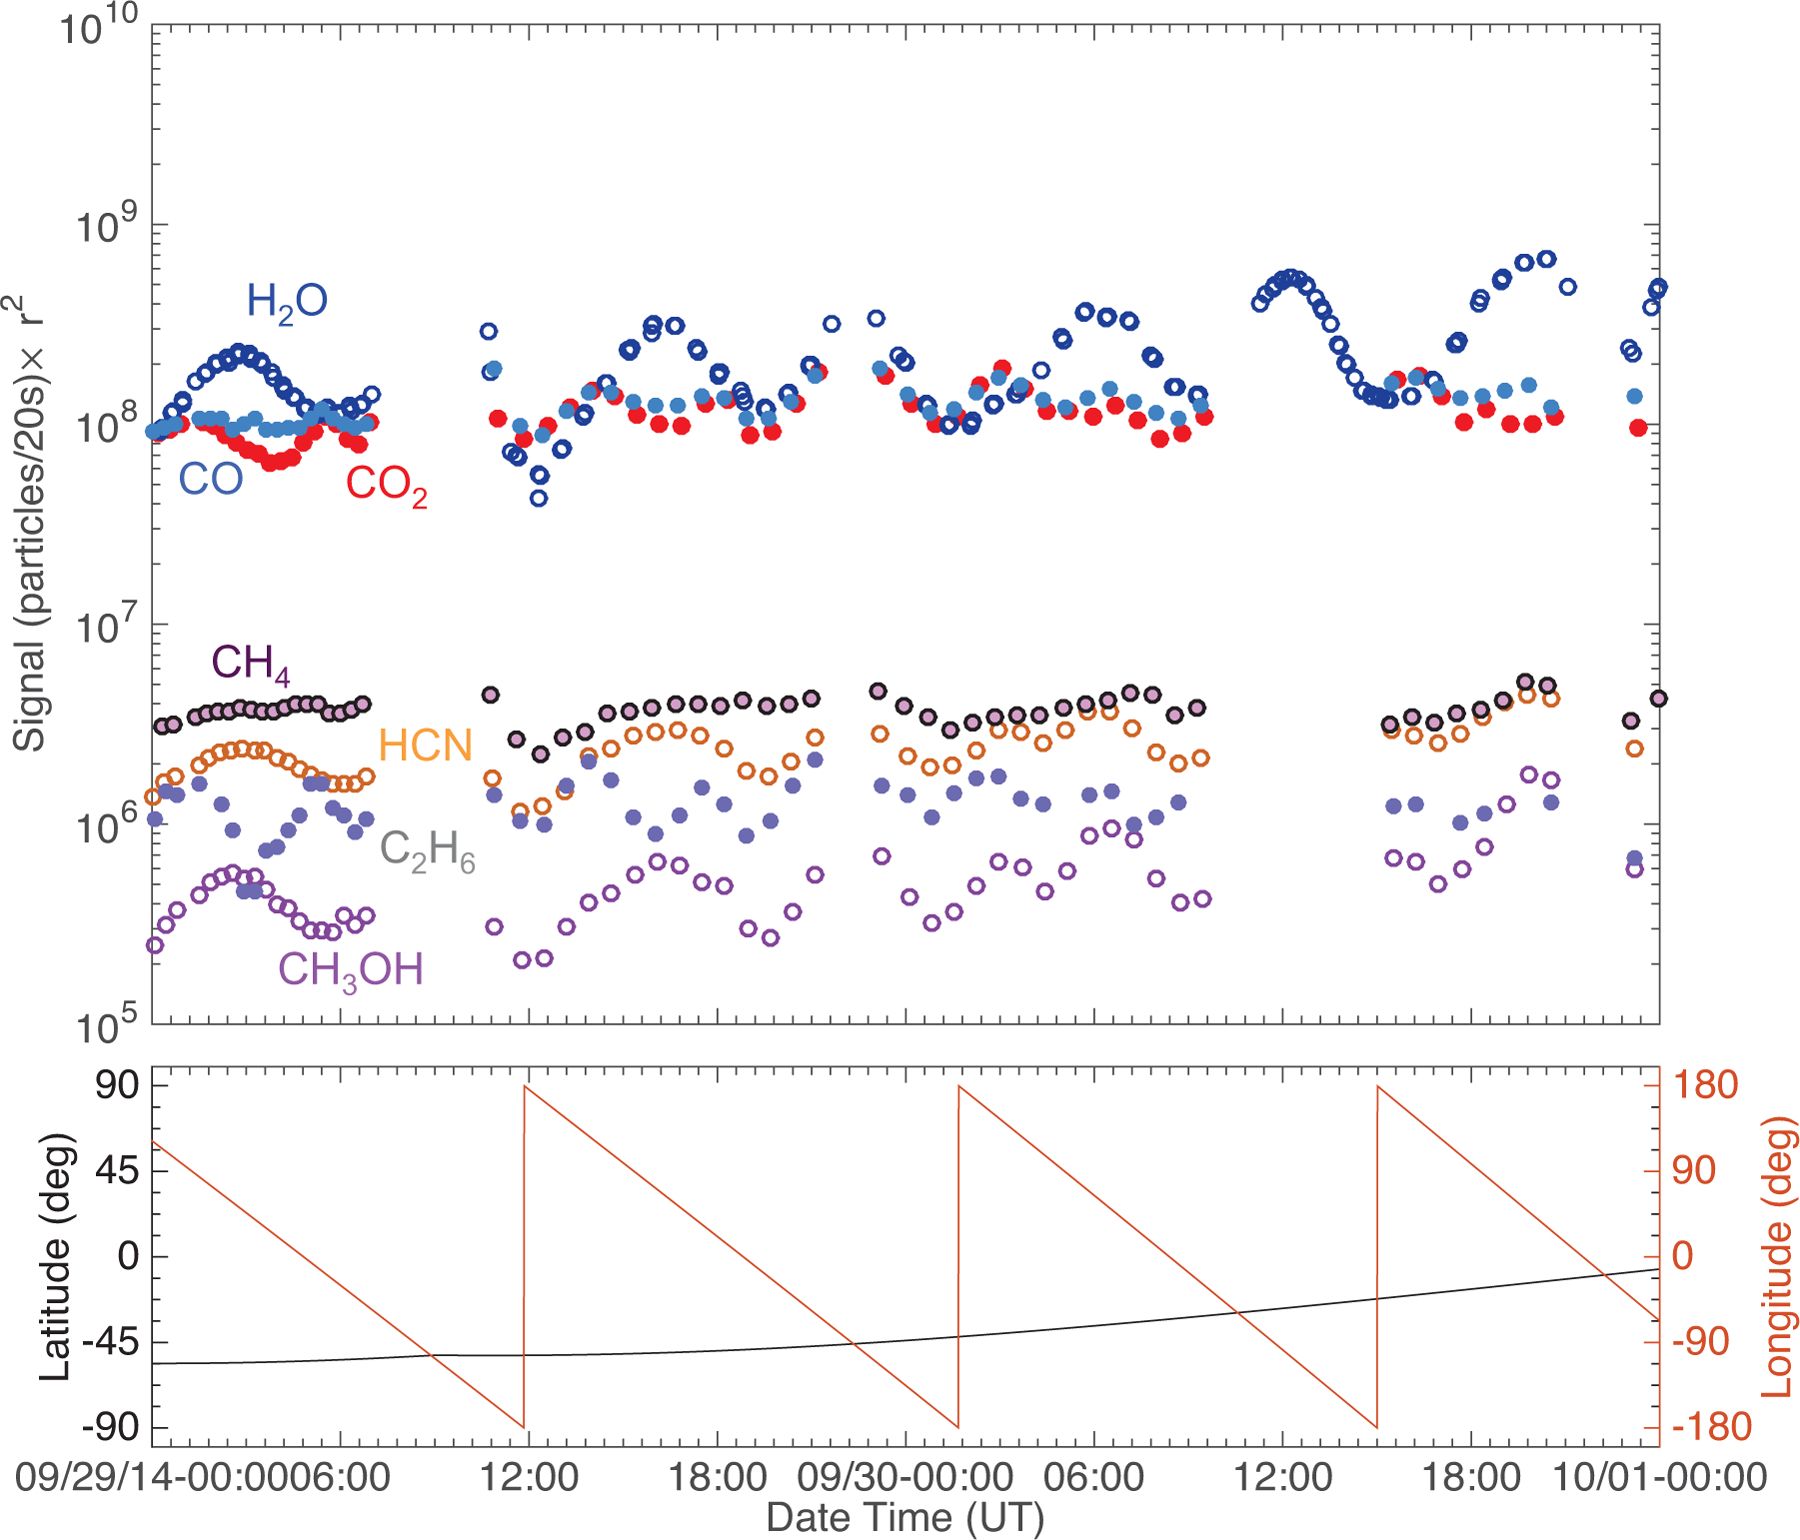
Top: typical pre-inbound-equinox (29–30 September 2014) southern hemisphere time variation of the seven studied species for a time period analyzed in ALK15. The signal has been scaled to the distance of Rosetta from the center of the nucleus (i.e., multiplied by r2). Species that trend together are illustrated with empty and filled markers. Bottom: corresponding sub-spacecraft longitude (red) and latitude (black). Errors are smaller than the marker size. Plot shown for comparative purposes with post-outbound-equinox data.
3. Results
The time evolution of the seven analyzed species in the southern hemisphere for the two selected post-equinox periods is shown in Figs. 2 and 3. Since the density in the coma is consistent with a decrease close to r−2 for distances covered by the spacecraft (Fougere et al. 2016; Kramer et al. 2017), we scaled the signal strength (shown in particles/20 s, and not in units of density) for all cases to the distance of Rosetta from the cometary nucleus center. This correction allows direct comparison of the post-equinox signal strength to that of pre-equinox, in addition to the general time variation trends discussed in ALK15.
Fig. 2.
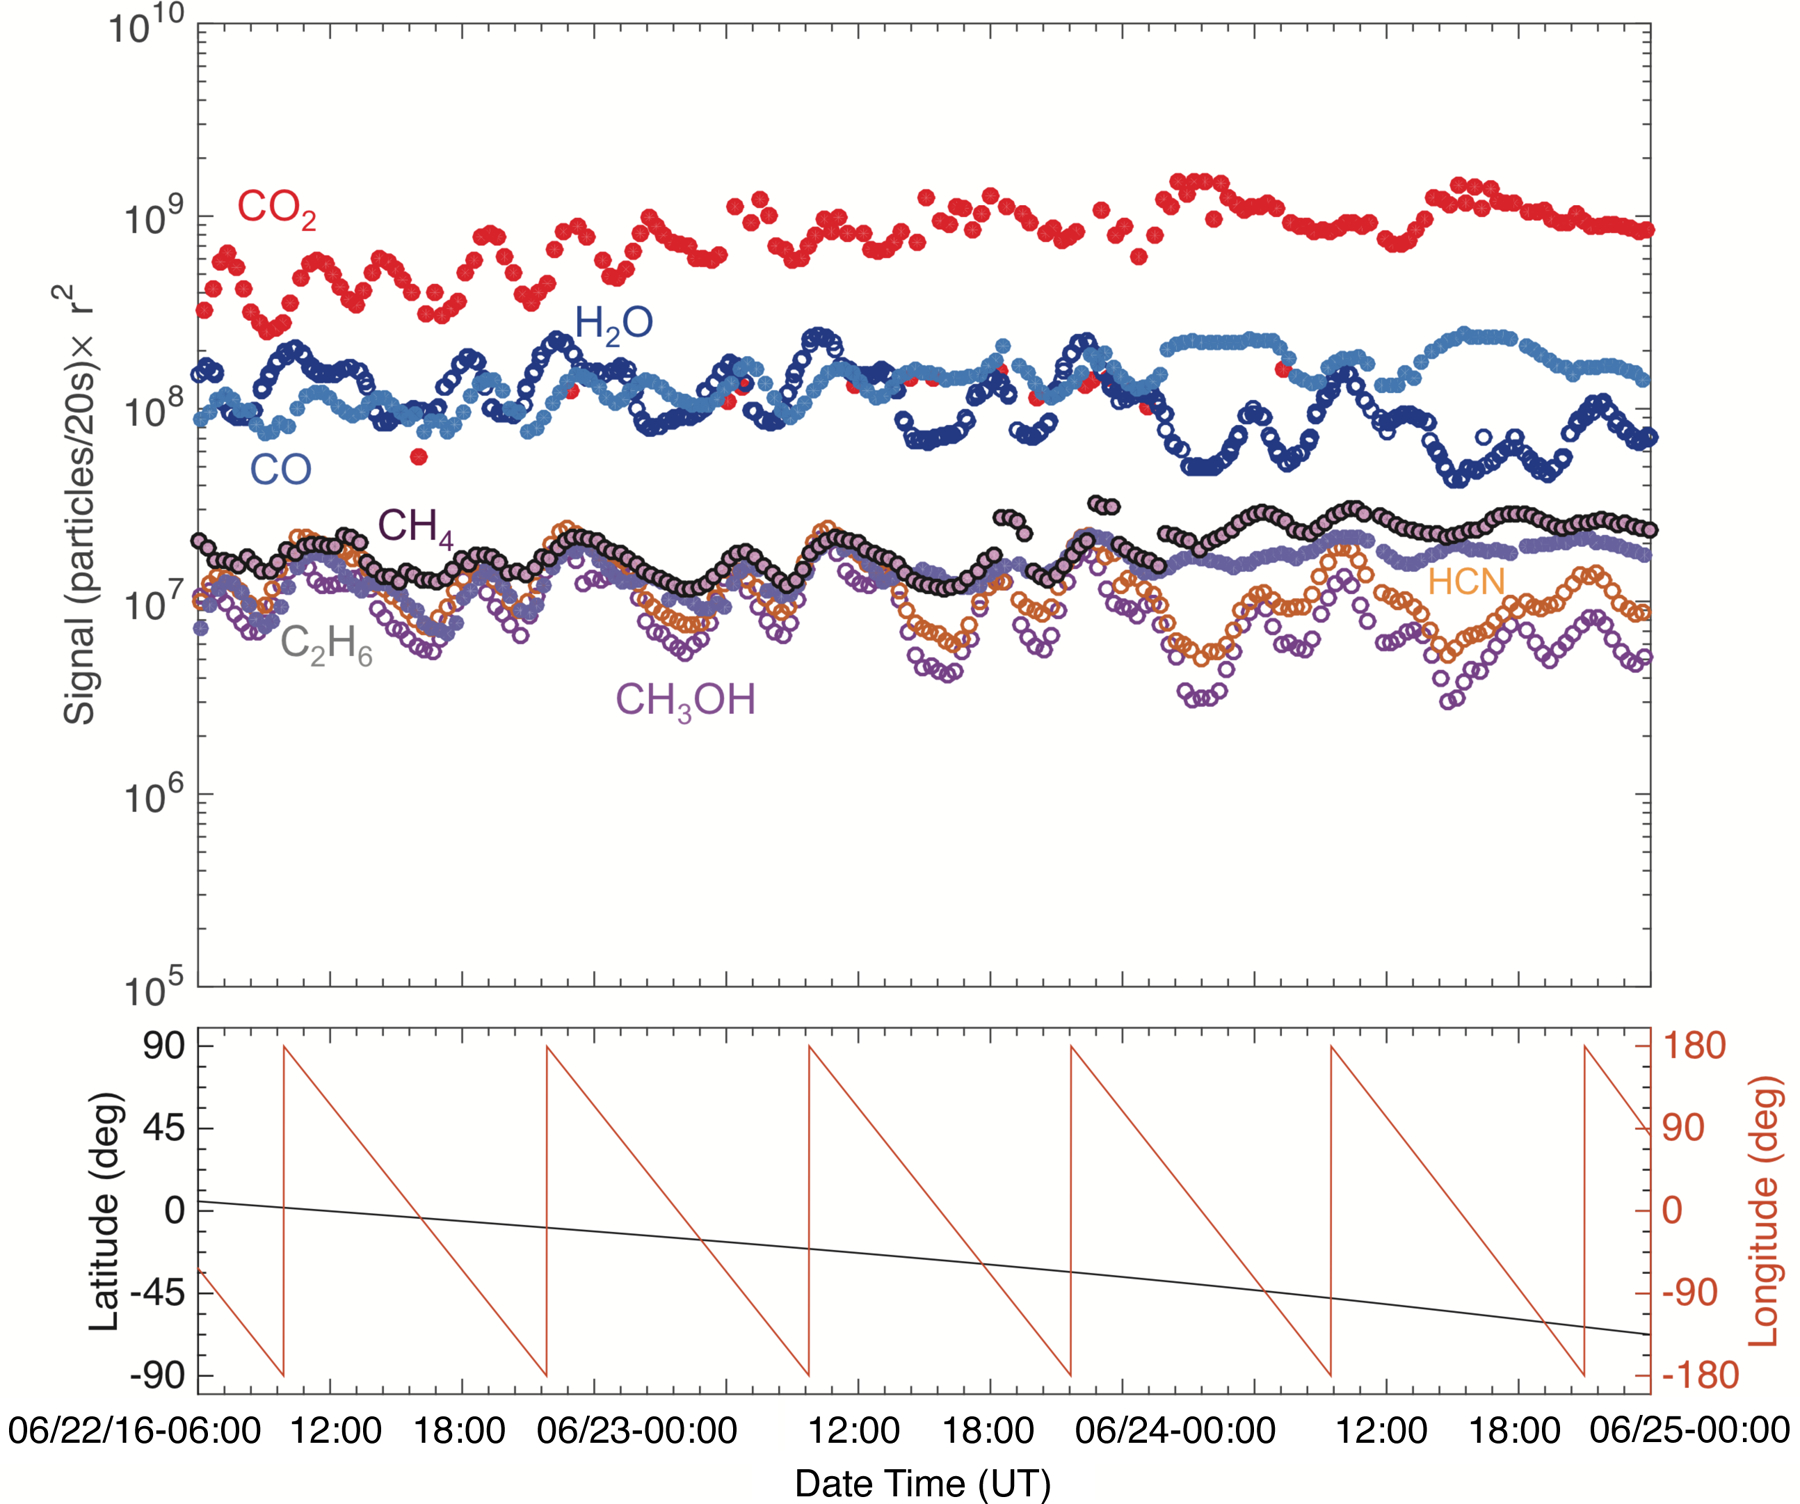
Top: post-outbound-equinox (22–24 June 2016) southern hemisphere time variation of the seven studied species scaled to the distance of Rosetta from the center of the nucleus (r2), and the corresponding sub-spacecraft longitude and latitude values (bottom). Species that trend together are illustrated with empty and filled markers. Errors are smaller than the marker size.
Fig. 3.
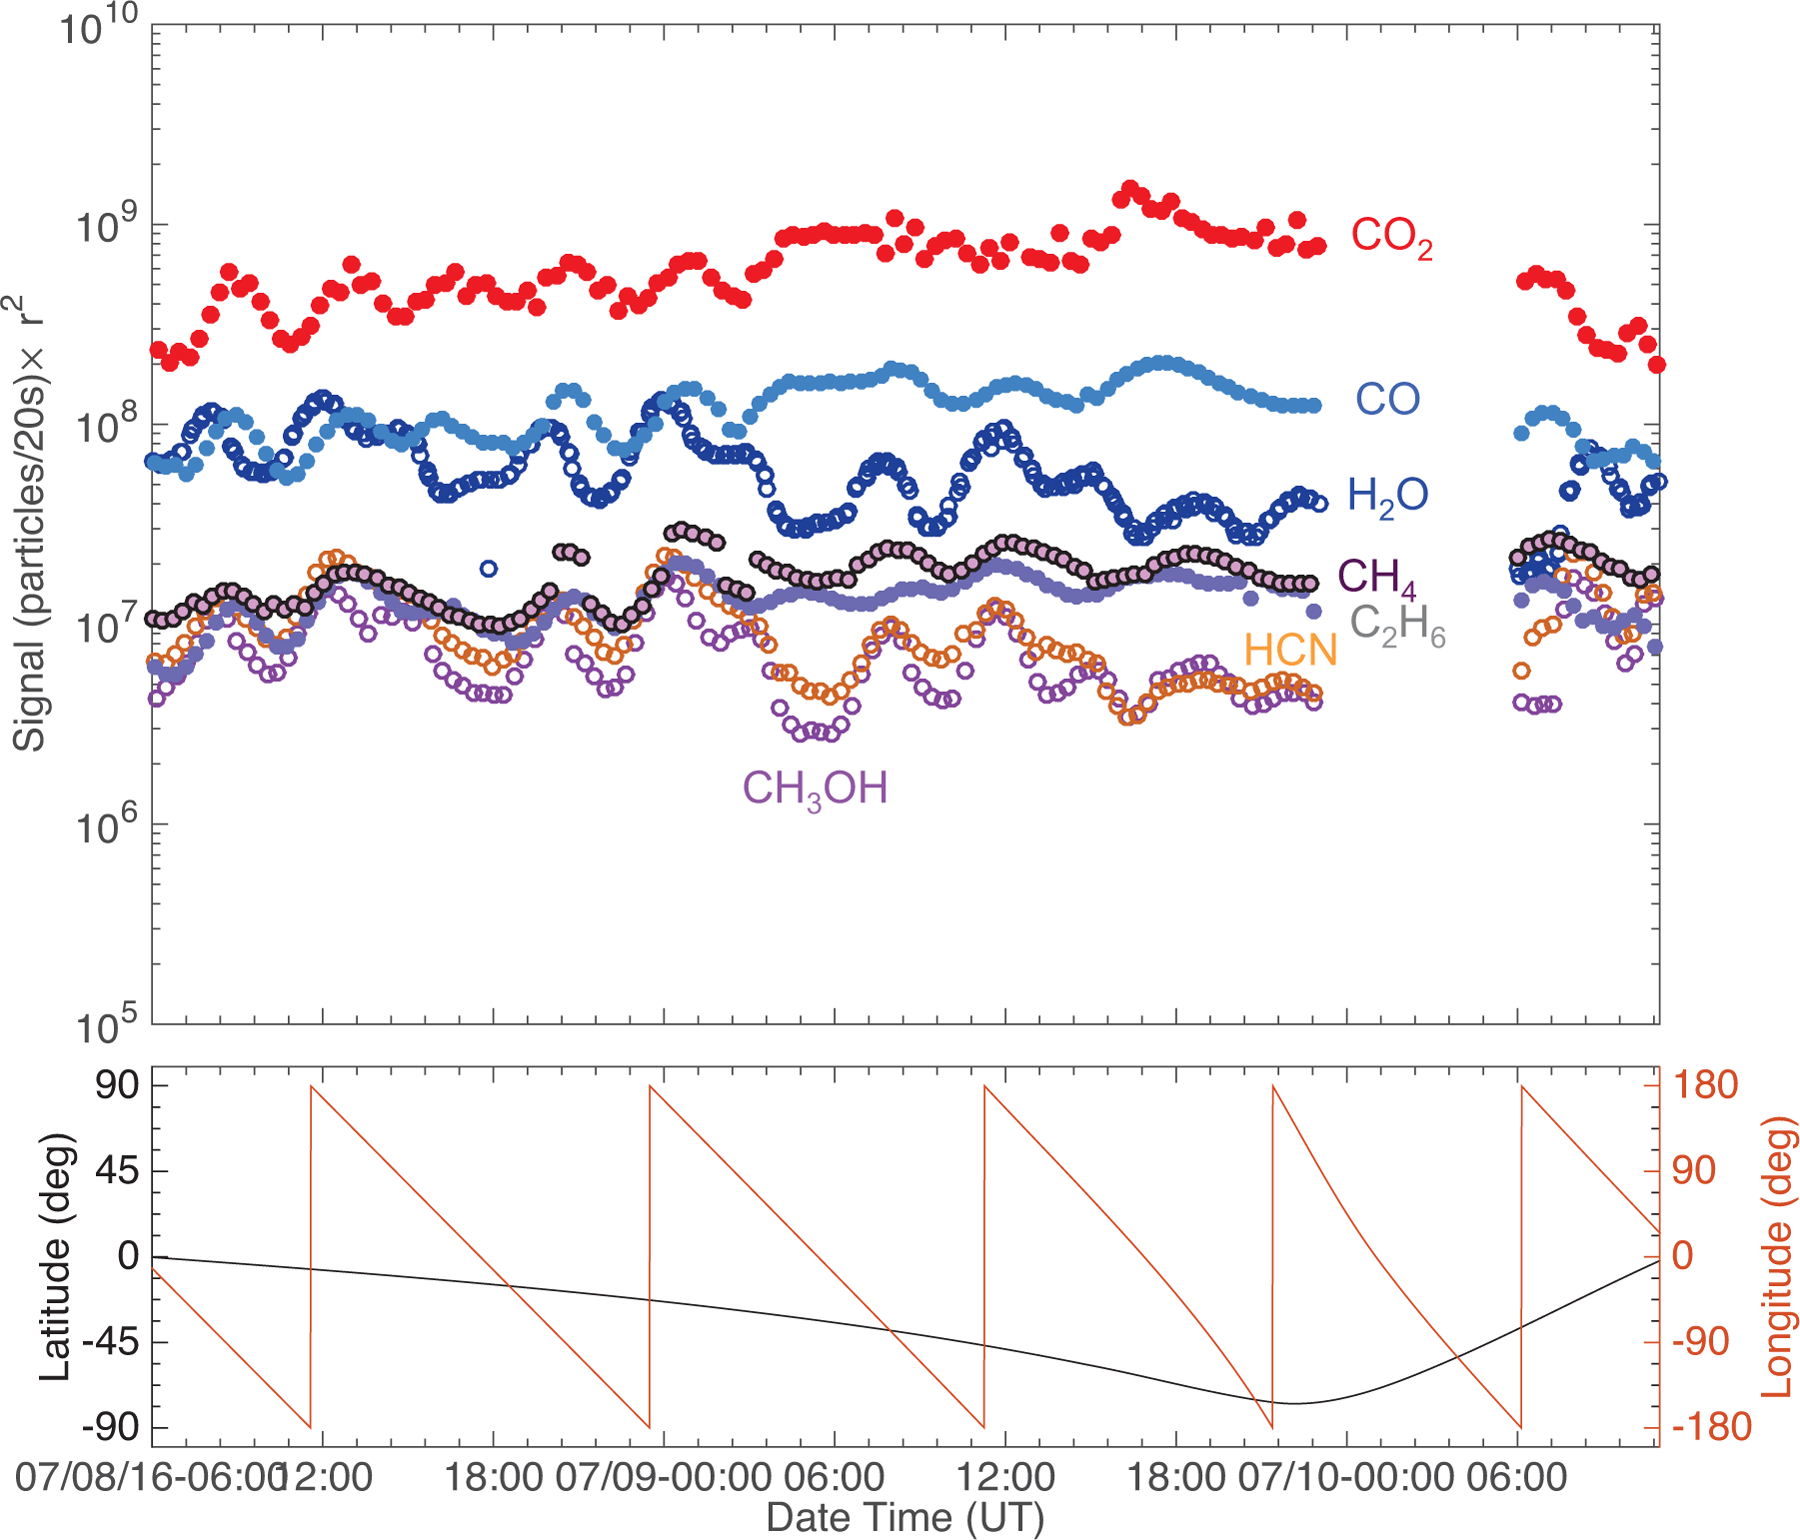
Top: post-outbound-equinox (8–10 July 2016) southern hemisphere time variation of the seven studied species scaled to the distance of Rosetta from the center of the nucleus (r2), and the corresponding sub-spacecraft longitude and latitude values (bottom). Species whose time variability trend together are illustrated with empty and filled markers.
The time variation trends show that the studied species can be divided into two groups, similarly to the pre-equinox cases (ALK15). While very different in their signal strength, the trend of the signals of H2O, HCN, and CH3OH show the same characteristics over a rotation period, with their maxima and minima occurring at the same time over the same longitudes. On the other hand, the time variation of CO2, CO, C2H6, and CH4 share the same characteristics. These characteristics are different from those of the species in the first group, in particular the timing of their signal maxima and minima. As noted earlier, this separation by time variability is very similar to what was observed pre-equinox, when the minor species followed either H2O or CO2 more closely, except for CH4 (ALK15). Pre-equinox CH4 did not follow either H2O or CO2 closely, but instead it showed a separate, unique time variation. However, the post-equinox time variation of CH4 follows that of CO2 and the more volatile species, which is again different compared to what was observed pre-equinox (Figs. 1–3).
The scatter plots in Figs. 4 and 5 further emphasize the fact that minor species follow one of the major species more closely not only pre-equinox, but also post-equinox. Because the data were not corrected for the species’ sensitivities, these slopes of the regression curves do not represent abundance ratios, thus they are not given. It was clear from the pre-equinox observations that the northern and southern hemisphere behaved differently (Hässig et al. 2015; ALK15; Le Roy et al. 2015; Bieler et al. 2015; Bockelée-Morvan et al. 2015; Migliorini et al. 2016; Fink et al. 2016). The focus here is a comparison of ALK15 with post-equinox observations, therefore we limit the post-equinox observations to a few days and focus on the southern hemisphere. Mixing data from the northern and southern hemispheres could wash out possible correlations. For example, a strong correlation between H2O and HCN over the southern hemisphere with a given H2O level and slope and a strong correlation over the northern hemisphere with a different slope would appear as a weak correlation when combined into one scatter plot and when fitted to the combined data. Clearly, such an effect would mask an underlying strong correlation between H2O and HCN over the northern hemisphere and a strong correlation between these two species over the southern hemisphere. Because the entire comet nucleus was in the field of view of ROSINA/DFMS all the time, there was inevitable cross-talk between the hemispheres, where neutral gas measured above a less active region in one hemisphere may originate from a more active region in the opposite hemisphere. For these reasons, it is imperative that careful consideration is given to various factors before drawing conclusions about the outgassing pattern and the underlying physical relationships based on correlation studies. It is also important to establish the correlations mathematically. We used the coefficient of determination (R2), which is defined as the ratio of the residual sum of squares to the total sum of squares, to study correlations between the major and minor volatile species , where yi is the observed data, fi is the predicted value of yi, and is the mean of the observed data.) The R2 values describing the post-equinox correlations of H2O and CO2 with the minor species and a comparison to the pre-equinox correlation coefficients from ALK15 are summarized in Table 2.
Fig. 4.
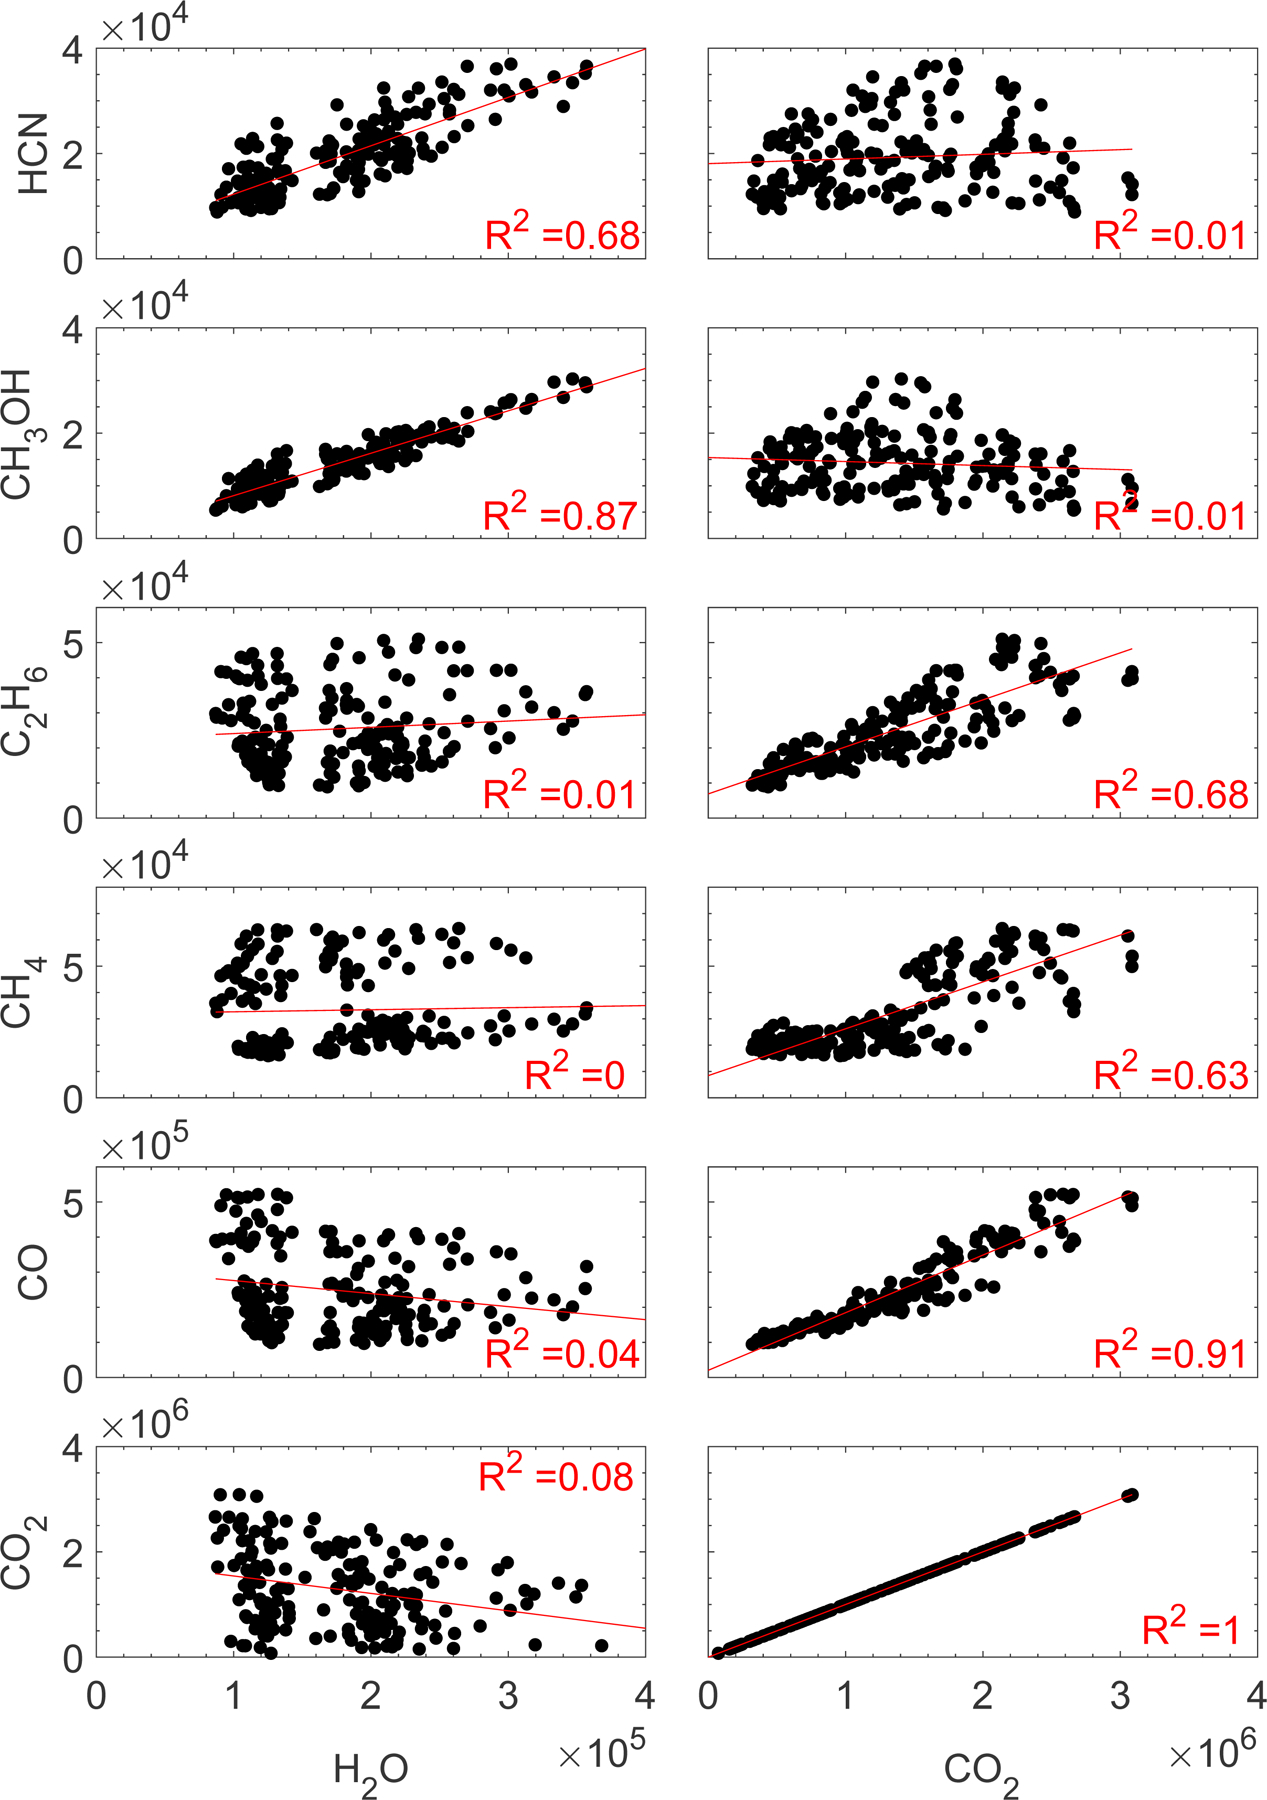
Scatter plots of the seven analyzed minor species against H2O (left) and CO2 (right) for 22–24 June 2016. Data are shown in units of particles/20 s. The linear regression line and the corresponding R2 values for each pair are also shown.
Fig. 5.
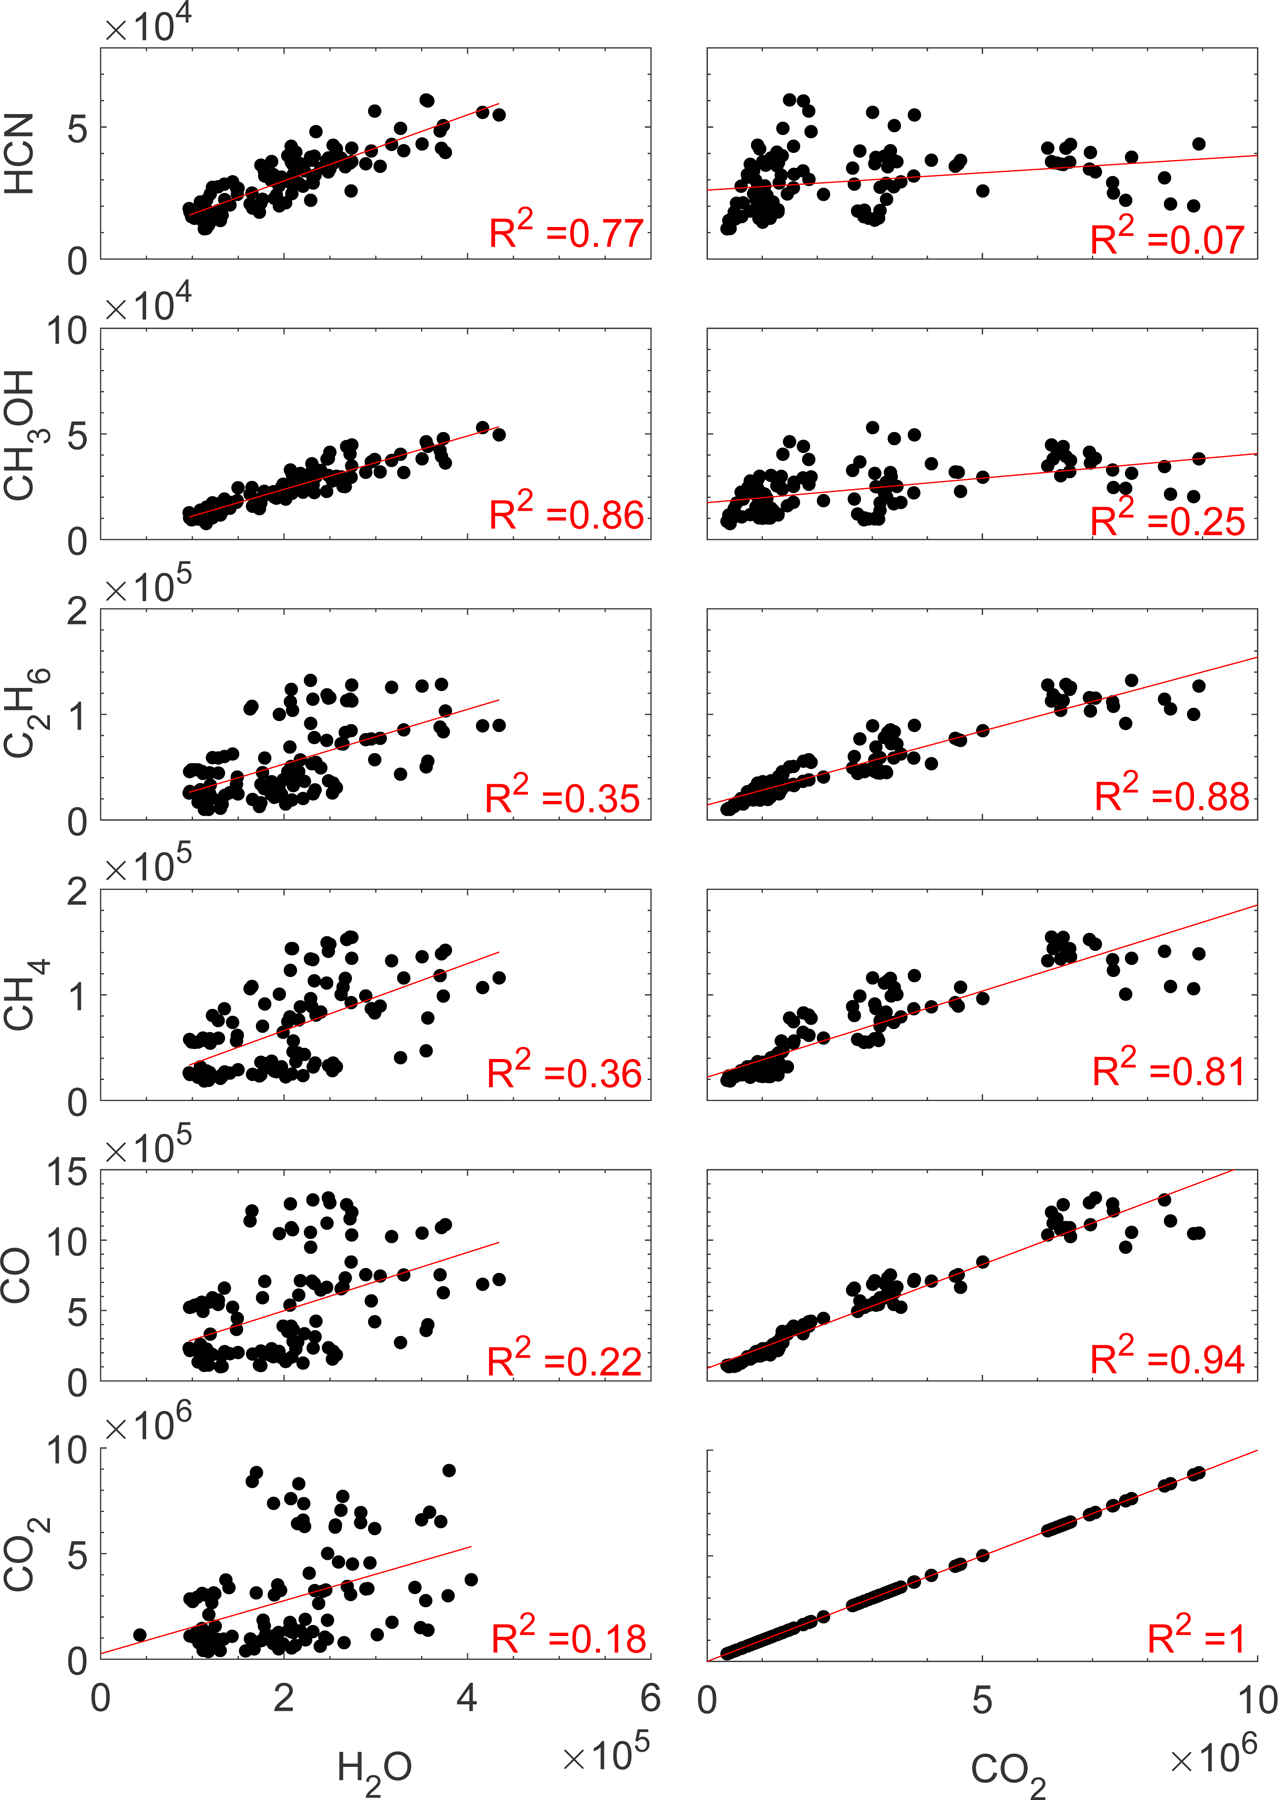
Scatter plots of the seven analyzed minor species against H2O (left) and CO2 (right) for 8–10 July 2016. Data are shown in units of particles/20 s. The linear regression line and the corresponding R2 values for each pair are also shown.
Table 2.
Correlation coefficients for pre- and post-equinox.
| Pre-equinox | Post-equinox | |||
|---|---|---|---|---|
| Sep. 26–30 2014 | June 22–24 2016 | July 8–10 2016 | ||
| Species | R2 | |||
| H2O | HCN | 0.69 | 0.68 | 0.77 |
| H2O | CH3OH | 0.87 | 0.87 | 0.86 |
| H2O | C2H6 | 0.03 | 0.01 | 0.35 |
| H2O | CH4 | 0.57 | 0.00 | 0.36 |
| H2O | CO | 0.30 | 0.04 | 0.22 |
| CO2 | HCN | 0.44 | 0.01 | 0.07 |
| CO2 | CH3OH | 0.21 | 0.01 | 0.25 |
| CO2 | C2H6 | 0.77 | 0.68 | 0.88 |
| CO2 | CH4 | 0.18 | 0.63 | 0.81 |
| CO2 | CO | 0.79 | 0.91 | 0.94 |
The post-equinox separation of species into two groups based on their time variation, as described above, also corresponds to a separation based on volatility. The signals of all species but CH4 more volatile than (and including) CO2 show very similar time variations pre- and post-equinox, (R2 = 0.63–0.94), while species less volatile than CO2 trend together as well (R2 = 0.68–0.87). This separation between trends is clearly visible when ordering the species along an arbitrary y-axis according to their volatility (Figs. 6 and 7). As demonstrated in Figs. 6 and 7, we could draw a line the center of which is somewhere in the space between the signals of CO2 and HCN, above and below which all species trend together to a greater or lesser extent. As expected for observations over more than one comet rotation and the full range of longitudes, the thickness of this line could encompass several species. However, in general, the separation by volatility in Figs. 6 and 7 is at least similar to what was seen pre-equinox, with the exception of CH4, which did not fit the volatility trend pre-equinox (ALK15).
Fig. 6.
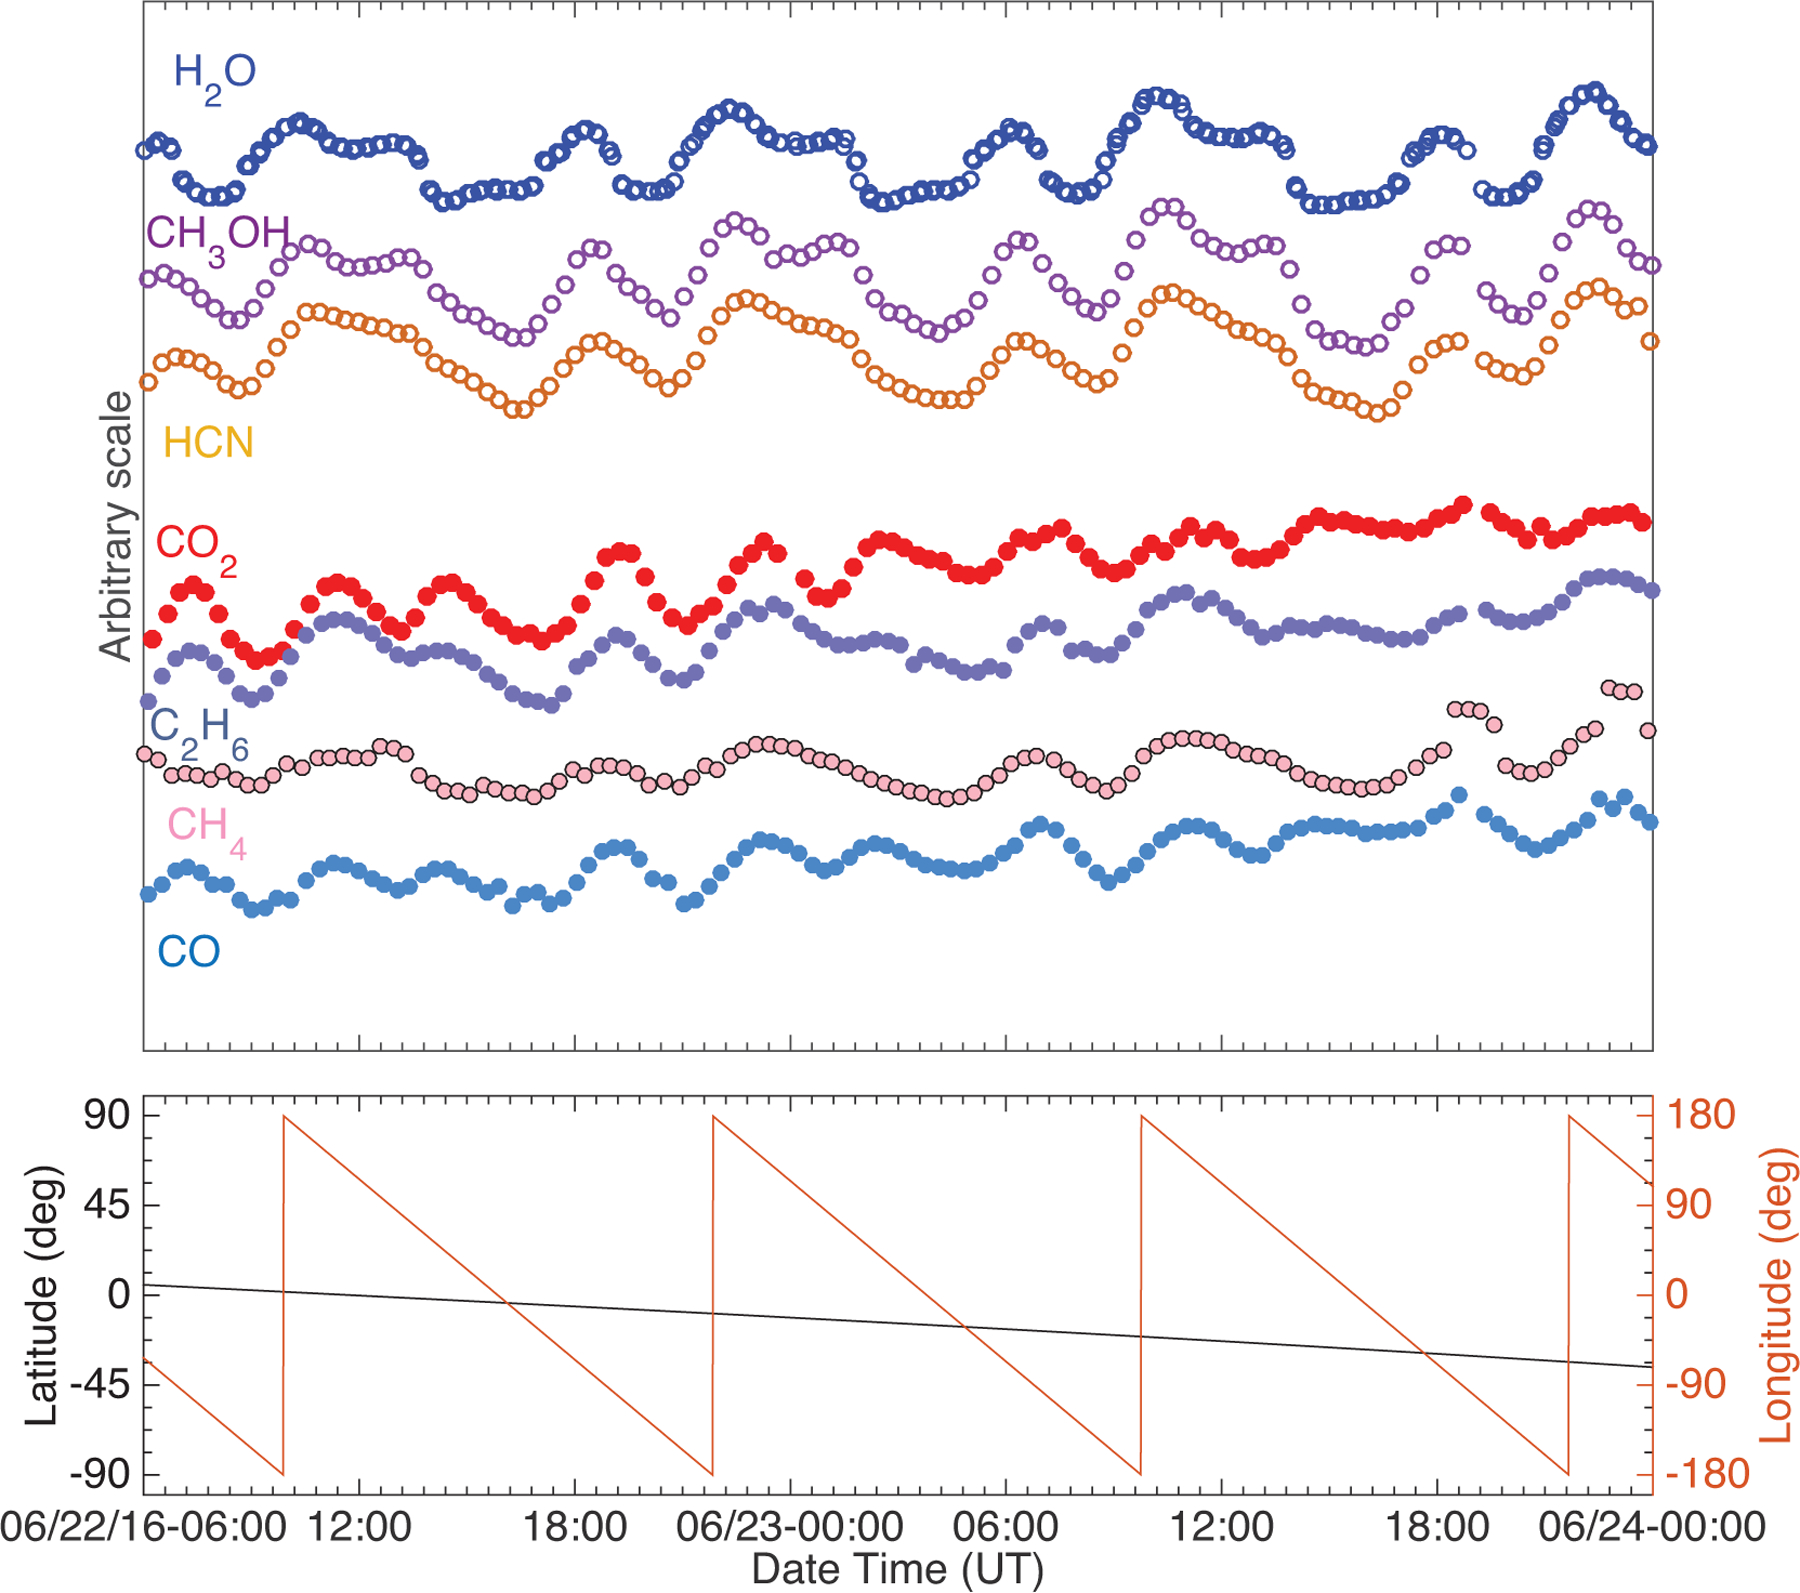
Profiles of major and minor species vs. time, shown on arbitrary scale for 22–24 June 2016. The separation of species into two groups (following H2O or CO2) based on their time variability profiles is clearly visible and is confirmed by the correlations listed in Table 2. CH3OH and HCN follow H2O closely, while C2H6, CH4 and CO follow CO2.
Fig. 7.
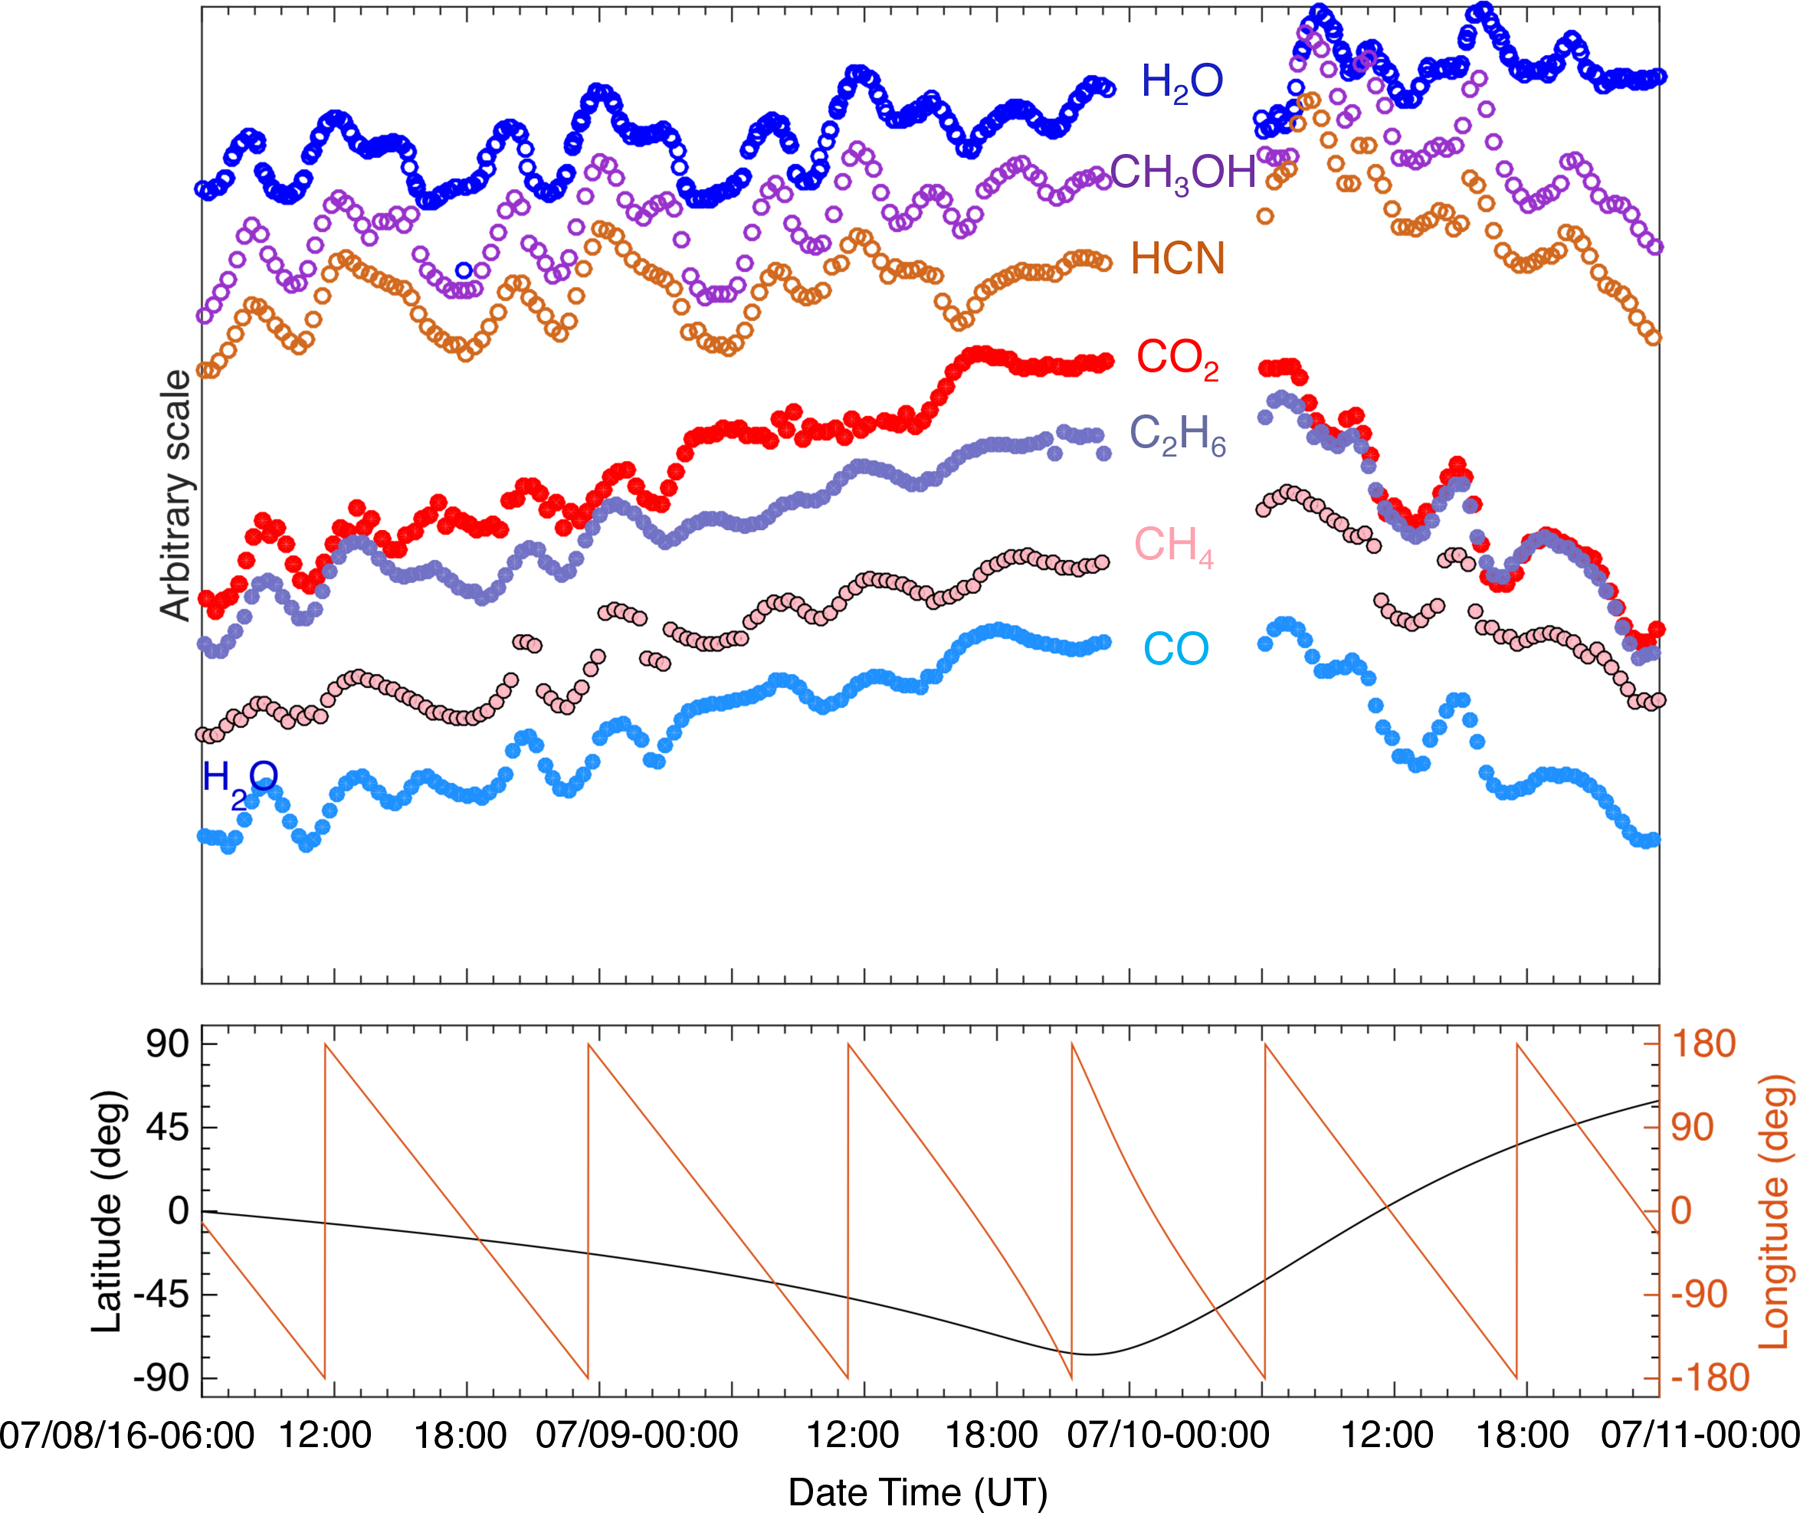
Profiles of major and minor species vs. time, shown on arbitrary scale for 8–10 July 2016. The separation of species into two groups (following H2O or CO2) based on their time variability profiles is clearly visible and is confirmed by the correlations listed in Table 2.
The fact that species do not trend exactly with either CO2 or H2O begs the question whether a mixture of the two dominant species would produce better correlation. We address this issue by investigating the relationship between the correlations and the mole fractions of H2O and CO2. To determine this relationship, we return to Fig. 4, which shows correlations between a minor species such as HCN and either H2O or CO2. Each correlation plot has a corresponding correlation coefficient. For each minor species, we computed the correlation coefficient, R2, for a range of mole fractions from 0 (pure CO2) to 1 (pure H2O). Then, for each minor species, we plotted 1 − R2 as a function of the mole fraction. We used 1 − R2, (where a good correlation is now a small number) to have a relatively simple measure of the uncertainty in the mole fraction that produces the best correlation (Livadiotis & McComas 2013; Livadiotis 2007). If there was a depression in the curve somewhere between 0 and 1, we used a parabolic fit to the region around that depression to determine an approximate error in the optimum mole fraction for a given minor species.
The results of this analysis are shown in Fig. 8. The three columns of plots are for the three time periods in Table 2 with pure CO2 and pure H2O in Table 2, respectively. Figure 8 illustrates how the correlations change with mole fraction for the pre-equinox period in September 2014 and the two post-equinox periods in June and July 2016. In essence, these changes map out the thickness of the line separating species that go with either CO2 or H2O in Figs. 6 and 7 (hereafter referred to as “temperature line”).
Fig. 8.
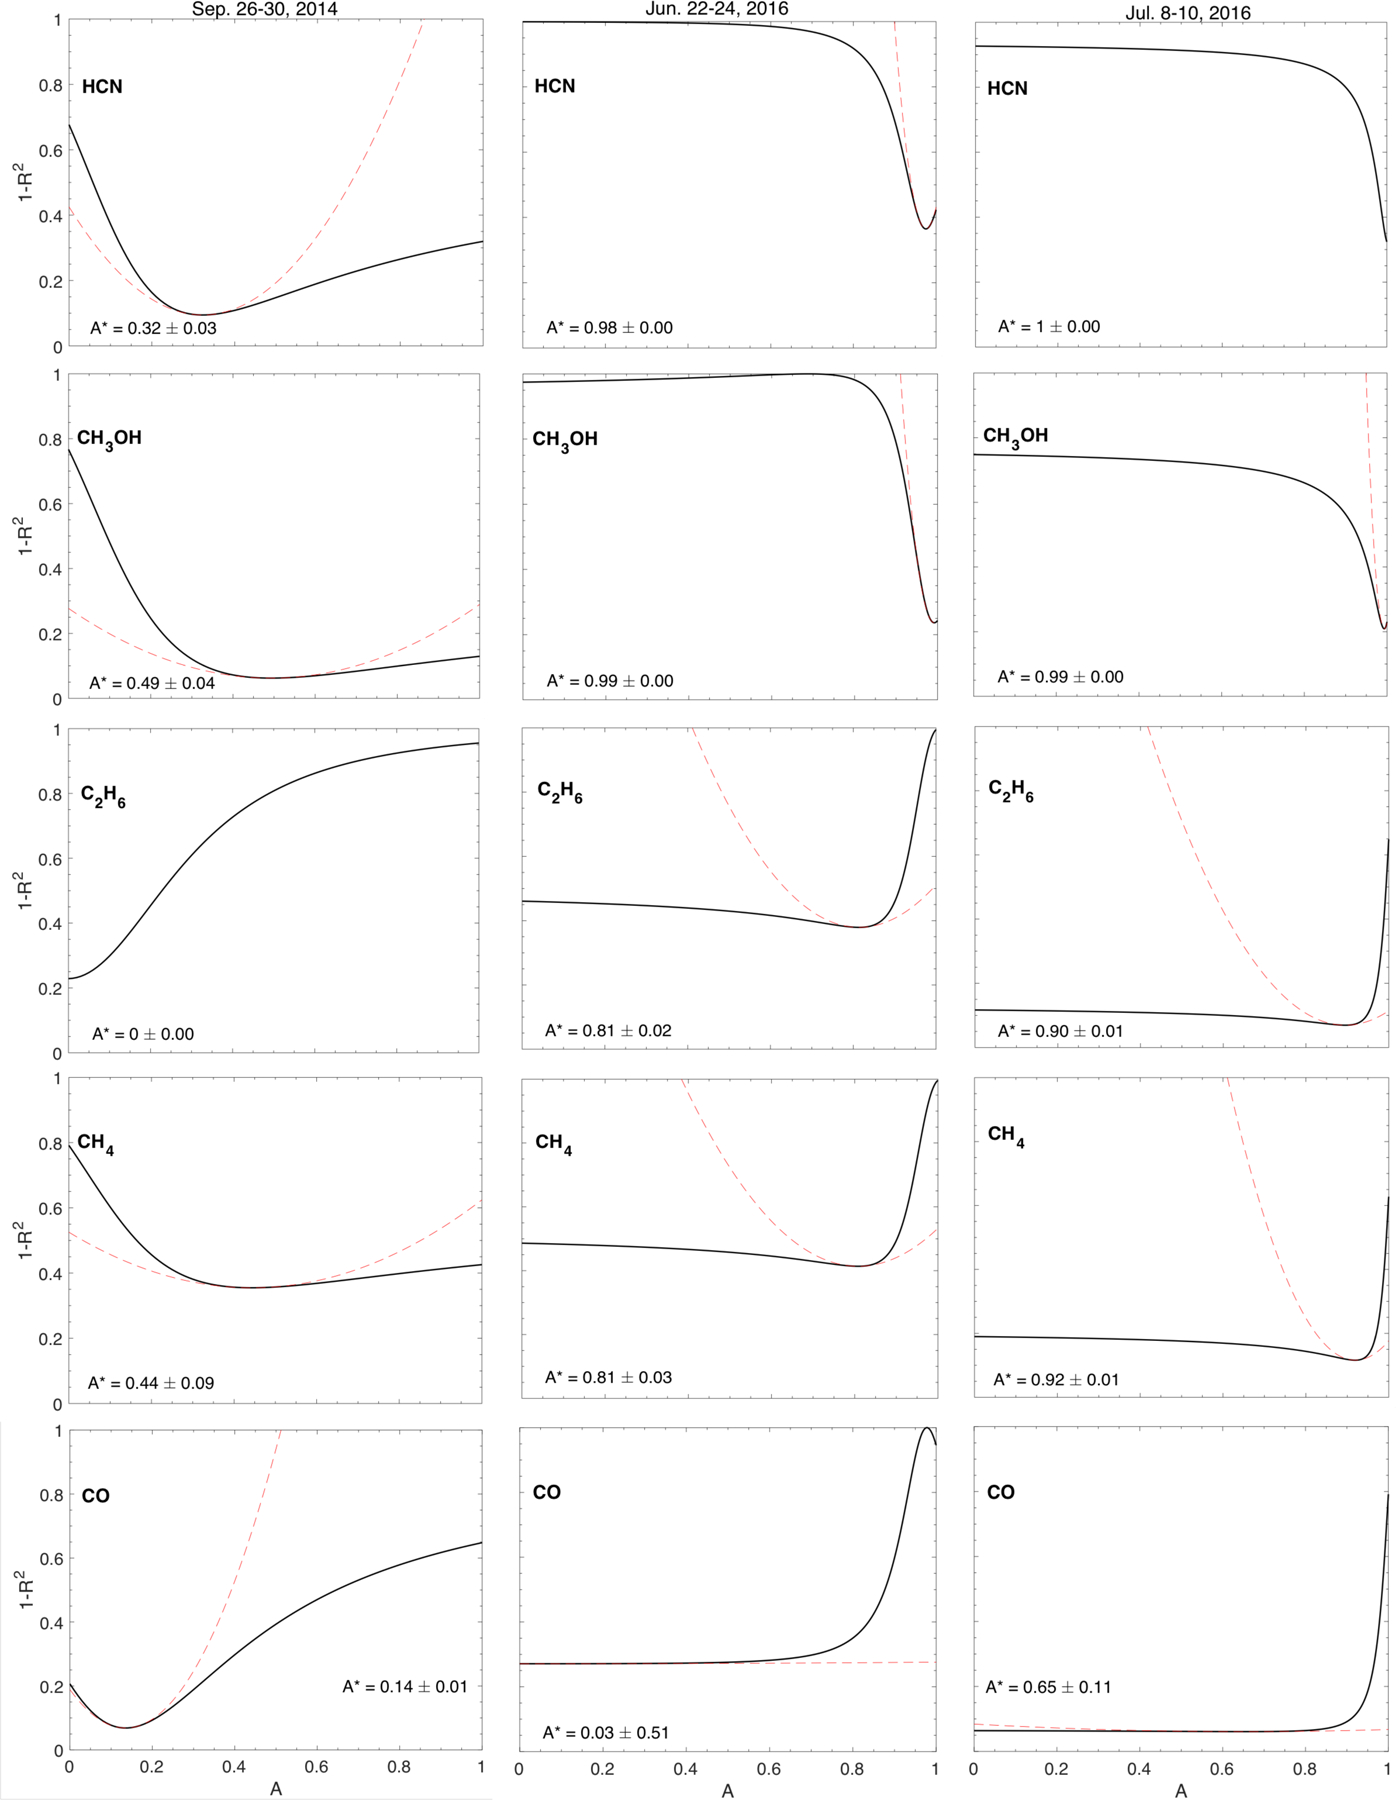
1 − R2 vs. mole fraction (0 = pure CO2, 1 = pure H2O) for three species for the pre-equinox and the two post-equinox time periods. The dashed curves show a parabolic fit to peaks in 1 − R2. These fits provide an indication of the uncertainties in the range of mole fractions that produce the best fit (corresponding to the maximum correlation, i.e., the lowest 1 − R2, see Livadiotis & McComas 2013; Livadiotis 2007). Post-equinox, HCN correlates best with pure H2O. Preand post-equinox, C2H6 correlates best with CO2 because addition of H2O either makes the correlation worse or does not change the correlation. CH4 is clearly different pre- and post-equinox. Pre-equinox, this species correlates better with pure H2O, but post equinox, the correlation is best with pure CO2. HCN pre-equinox is the only species that has a better correlation with a mix of CO2 and H2O.
The trends of the correlation coefficients versus mole fraction tend to fall into three categories. For the first category, addition of any fraction of H2O to the CO2–H2O mix either makes the correlation worse (1−R2 increases) or does not change the correlation. An example for this category is C2H6 for all three time periods. For June and July 2016, the addition of significant H2O does appear to improve the correlation slightly. However, this improvement is not statistically significant. CH4 in June and July 2016 also fits this category, as does CO for all three time periods. For this category, the species tend follow CO2, although the degree to which the species follows CO2 is variable.
The second category is the opposite of the first. Addition of any fraction of CO2 to the CO2–H2O mix either makes the correlation worse or does not change the correlation. The example for this category is HCN in June and July 2016, CH3OH for all three time periods, and CH4 in July 2016 could be considered in this category. For this category, the species follow H2O, although, like the first category, the degree to which a given species follows H2O is variable.
For the third category, the best correlation is obtained with a mixture of CO2 and H2O. HCN in September 2014 is the best (and only) example of this category in our data set. For HCN, an addition of about 36% CO2 to H2O produces a clearly superior correlation coefficient. CH4 in September 2014 marginally fits this category. The best correlation for this species occurs for a very small admixture of CO2. However, the 1 − R2 curve follows the parabolic fit to the depression very well over a wide range of mole fractions of CO2. This fit shows that the uncertainty in the mole fraction is large enough to encompass pure H2O. In other words, for CH4 in September 2014, there is no statistical difference between the correlation for pure H2O and the correlation for H2O with a small addition of CO2.
In summary, the investigation of the minor species correlation with a mixture of CO2 and H2O leads to conclusions that are similar to those obtained from inspection of Table 2, at least for most species and time periods. In particular, C2H6 correlates best with pure CO2. Although not shown in Fig. 8, CH3OH and CO correlate best with pure H2O and CO2, respectively. Post-equinox, HCN in June and July also correlates best with pure H2O. Within the uncertainties in the mole fraction, it is still possible to conclude that CH4 correlates better with pure H2O than pure CO2 in September 2014 (ALK15). Also, within the uncertainties in the mole fraction, CH4 correlates better with CO2 than H2O post-equinox in June and July. It is important to note that the H2O–CH4 or CO2–CH4 correlations are not good, except for the post-equinox period in July 2016.
HCN pre-equinox in September 2014 is the interesting complication in this investigation of mole fraction. It is the only molecule that is strongly correlated with pure H2O, only weakly correlated with pure CO2, yet shows a statistically better correlation with a mixture that includes significant CO2. A possible explanation is given in the discussion section below.
The signal strength of the various species is another important property to compare between pre- and post-equinox, which identify potential outgassing differences. These differences are easily visible by directly comparing Figs. 1–3. Pre-equinox, the H2O signal was generally the highest, with the CO2 and CO signals only rivaling it at specific southern hemisphere sub-spacecraft longitudes, when (i) the larger lobe blocked out the neck and the smaller lobe (Hässig et al. 2015; ALK15), and (ii) at very high southern latitudes, with a view to the “underside” of the nucleus (ALK15). Not only is the CO2 signal higher post-equinox than it was pre-equinox for the southern hemisphere (a factor of ~7 at 55°S, and ~3 at 20°S), it is also generally higher than the H2O signal, regardless of the observing longitude. Thus, we have CO2 unequivocally dominating the southern hemisphere coma signal post-equinox. At the same time, the H2O signal is about the same (a factor of 1.03 lower) at a latitude of 55°S, and 3.18 times lower at 20°S compared to pre-equinox. The CO signal was corrected for the contribution of CO2 due to fragmentation in the ion source (Hässig et al. 2015; ALK15). While the efficiencies decreased after perihelion, most of this decrease was taken into account and the decrease in the H2O signal at latitude 20°S cannot be accounted for entirely by this efficiency decrease. CO did not change notably between pre- and post-equinox, while the signals of all the minor species are significantly higher post-equinox. The most drastic increase occurs for C2H6 and CH3OH, whose signals at 55°S increase by as much as a factor of ~20 and ~85, respectively, from pre-equinox to post-equinox. Furthermore, a notable difference compared to the pre-equinox signal is the pronounced increase of CO2 and other minor molecules, and the slight decrease of H2O toward higher negative latitudes. This change is especially obvious for 8–10 July 2016 shown in Fig. 3, when Rosetta covered latitudes as high as 77°S. The association between signal strength and latitude suggests that insolation plays an important role in what is observed in the coma.
Another interesting feature seen in the post-equinox data is the presence of “shoulders” on every other H2O maxima. These shouldered maxima features in the H2O signal are separated by ~10–12 h. For instance, they are apparent between 12:00 and 14:30 UT on 8 July, and between 00:00 – 03:00 UT and 12:00 – 15:00 UT on 9 July, and show a 10-h separation for the period of 22–24 June 2016 (Fig. 2). Pre-equinox, H2O maxima were separated from each other by about half a nucleus rotation, that is, ~6 h without any shoulders. Species that trend with H2O (HCN and CH3OH) also show the same feature. This association with longitude also suggests that insolation plays an important role in what is observed in the coma.
In addition, the specific view with the larger lobe blocking the neck and the smaller lobe out of Rosetta’s view that was associated with CO2 maxima and H2O minima pre-equinox (referenced above) now shows maxima in H2O and the less volatile species than CO2 (Figs. 9 and 10). This is a surprising and unexpected change compared to pre-equinox.
Fig. 9.
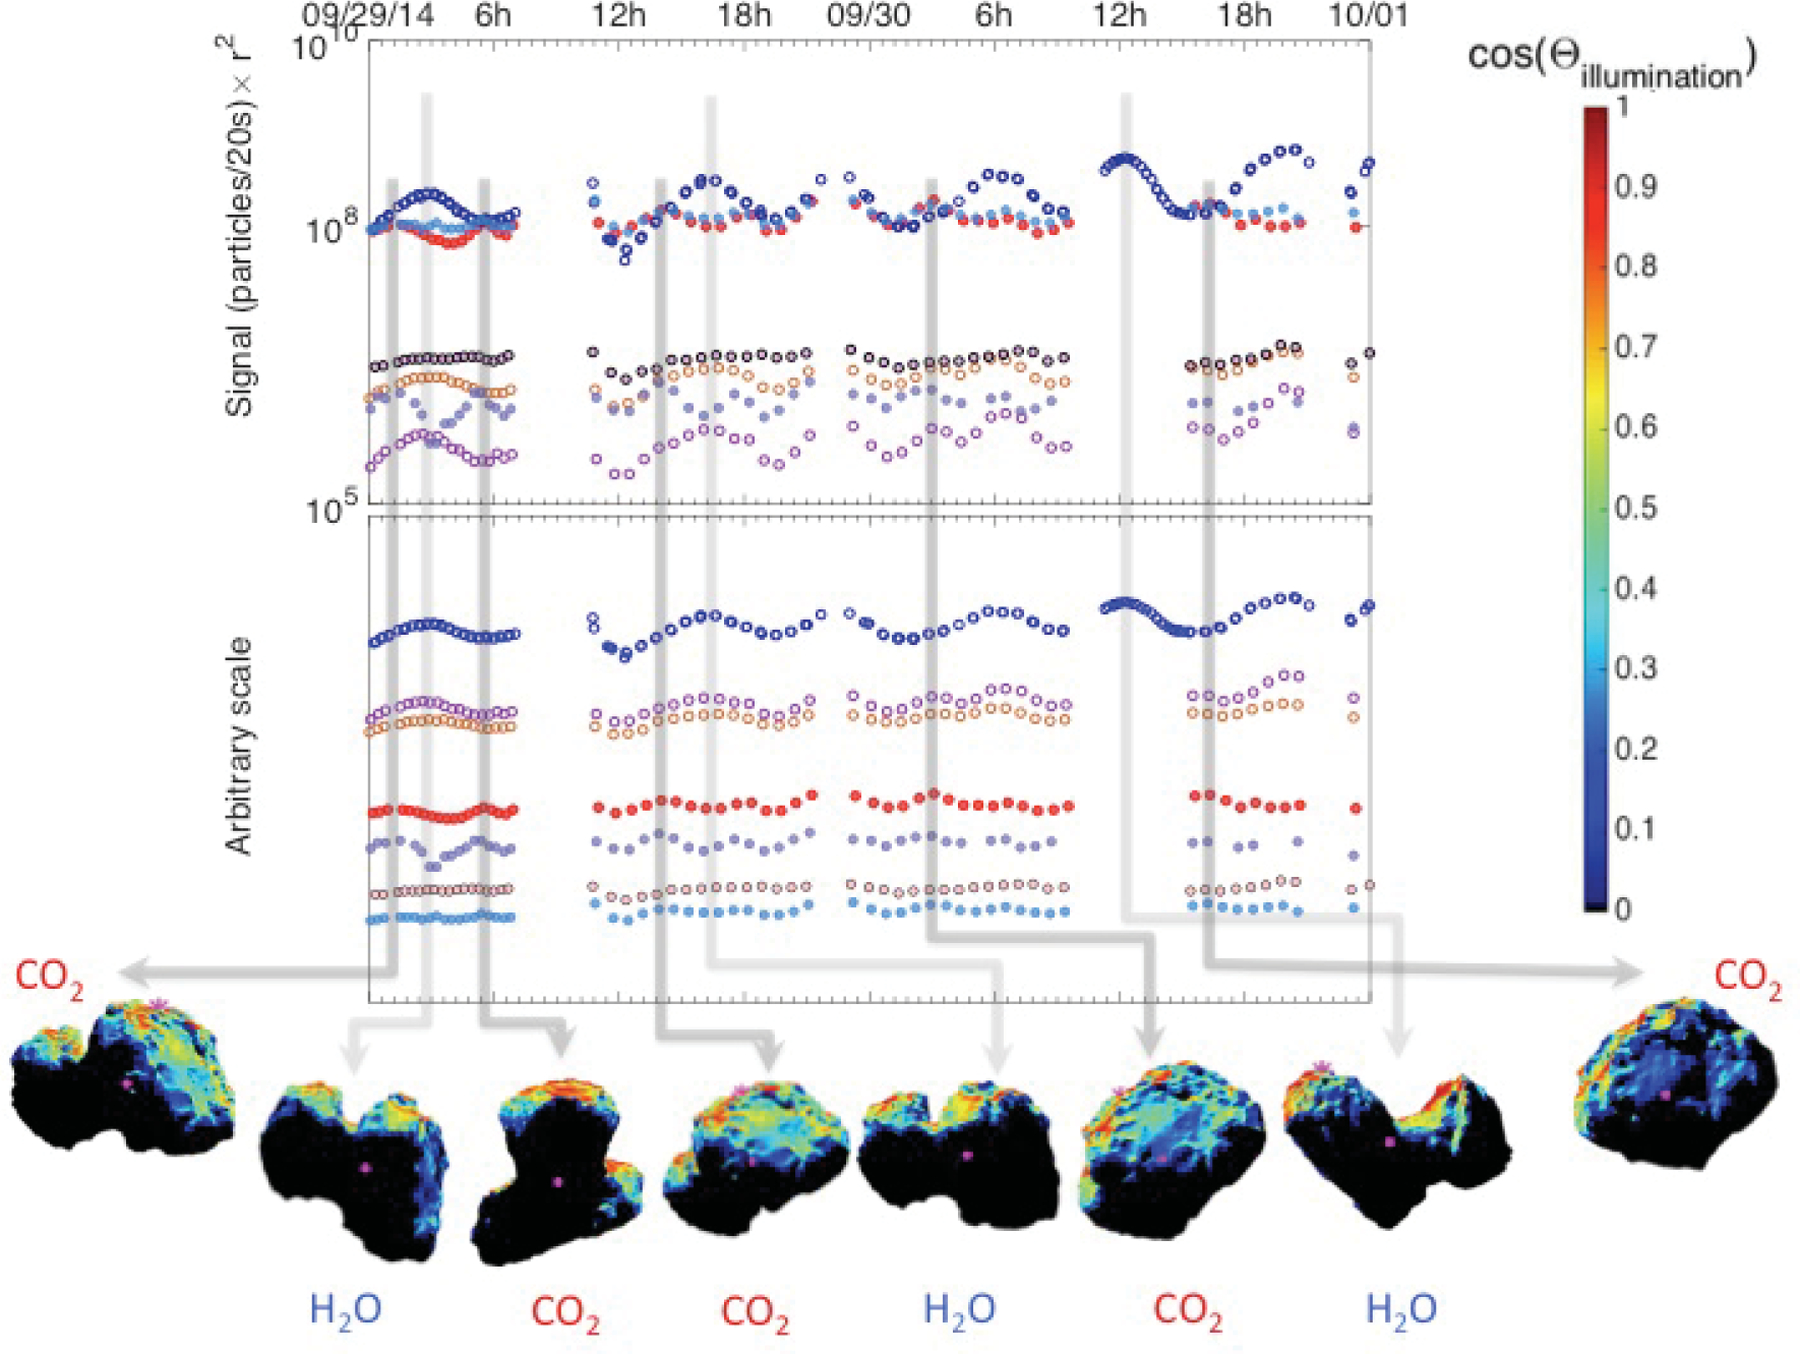
Snapshots of the pre-equinox spacecraft view of 67P at the times of signal maxima with the rough illumination (the cosine between the surface normal and the direction of the Sun). Top: signal corrected for r2. Bottom: shifted signal according to volatility. Light gray arrows indicate H2O, while darker gray arrows indicate CO2 maxima. Shape model: ESA NAVCAM.
Fig. 10.
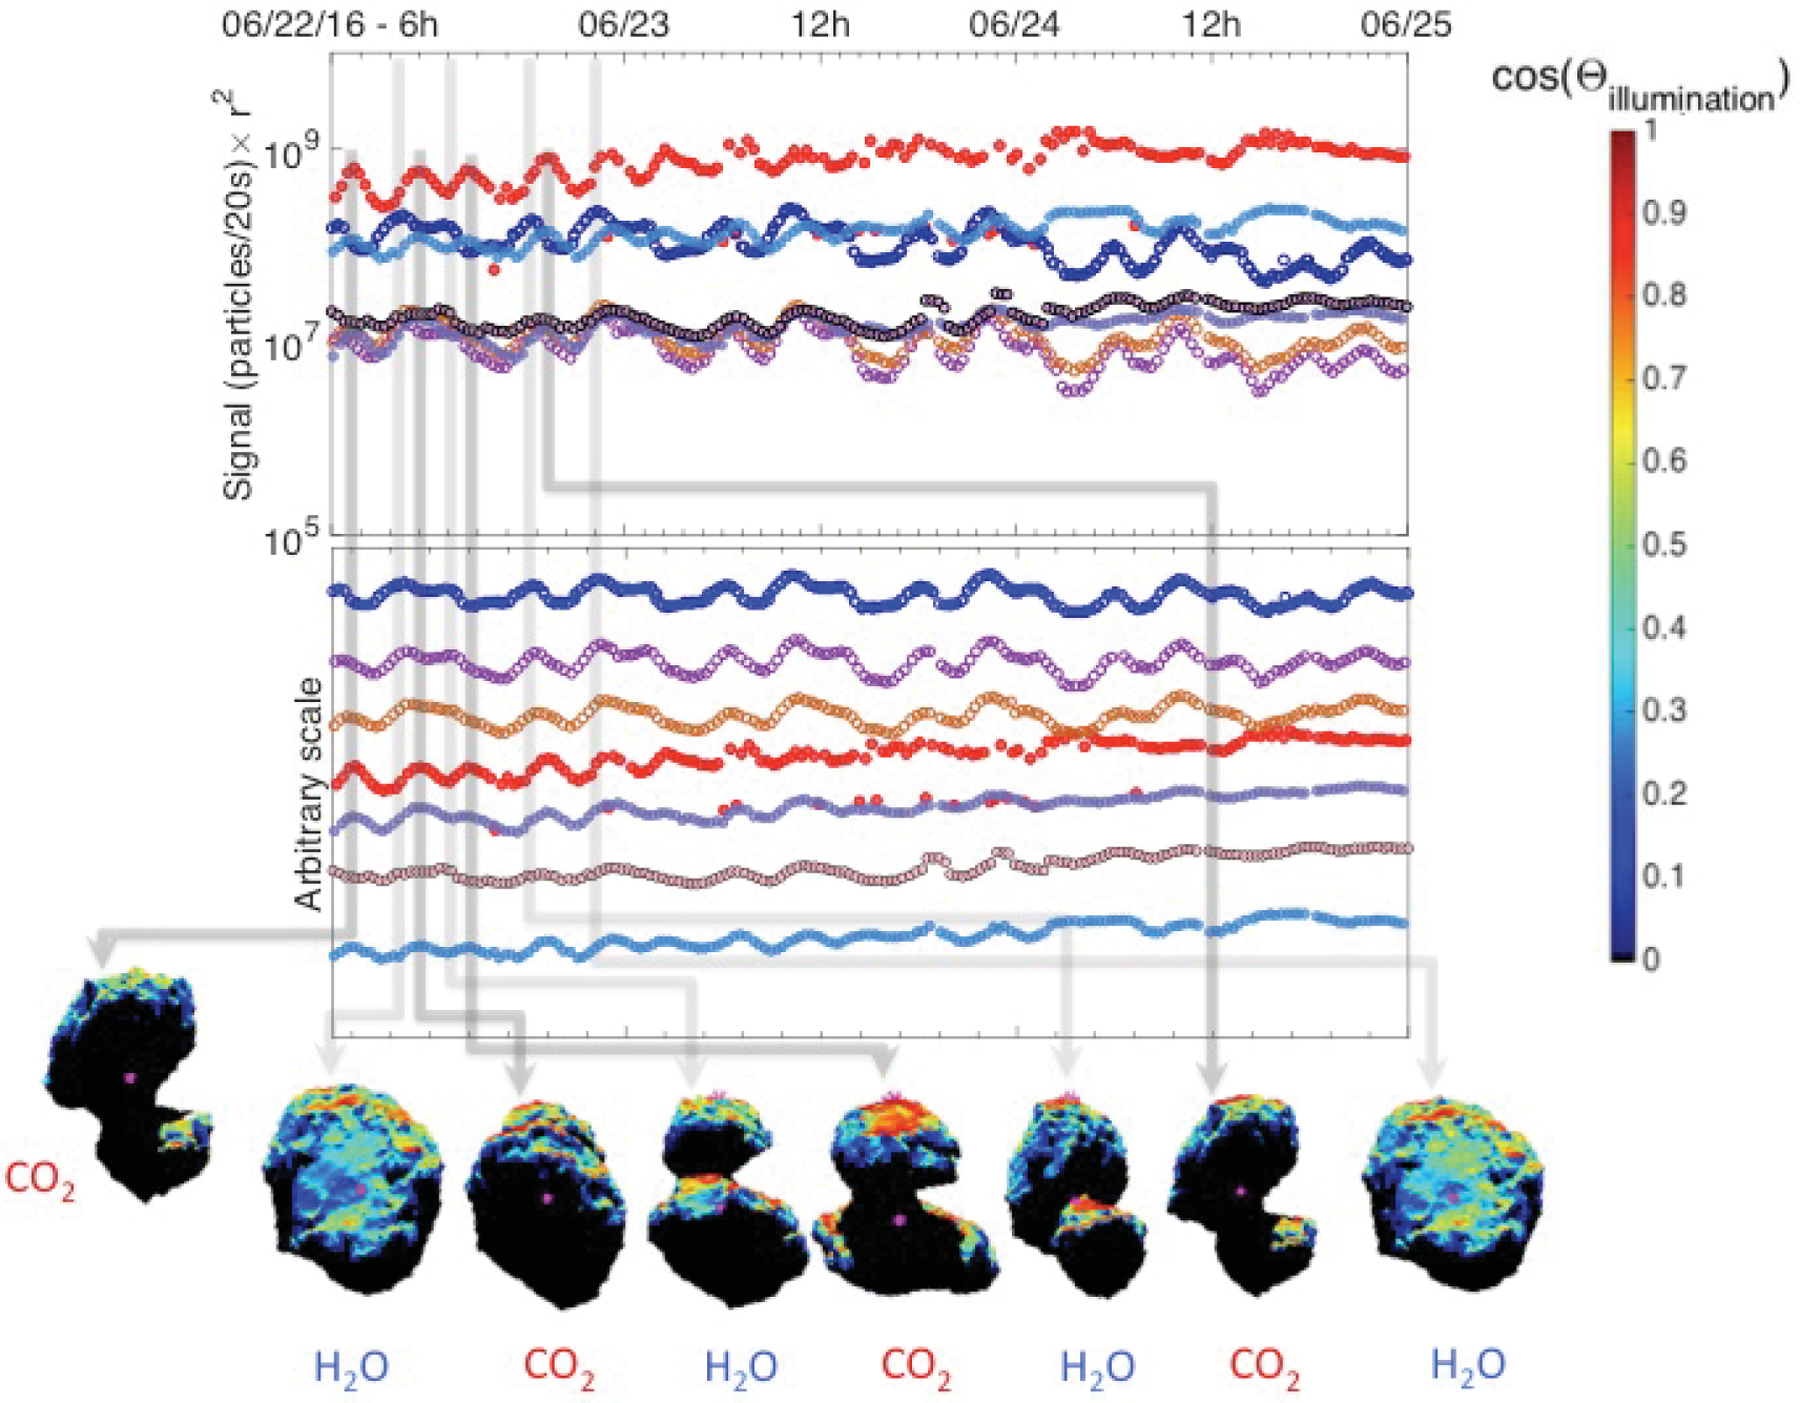
Snapshots of the post-equinox spacecraft view of 67P at the times of signal maxima with the rough illumination (the cosine between the surface normal and the direction of the Sun). Top: signal corrected for r2. Bottom: shifted signal according to volatility. Light gray arrows indicate H2O, while darker gray arrows indicate CO2 maxima. Shape model: ESA NAVCAM.
Thus, in addition to the general time variability trend and separation of the analyzed species, there are significant differences between the pre- and post-equinox coma signals. These differences point to the importance of insolation. Unfortunately, insolation is one of the few quantities that is not controllable in the pre- and post-equinox comparison presented here.
4. Discussion
For the southern hemisphere, the post-equinox time variation of the individual species’ coma signal was very similar to that of pre-equinox, with the minor species following either H2O or CO2 more closely. Consequently, the post-equinox correlations of minor species with H2O and CO2 are also strikingly similar to those pre-equinox, except for CH4. The strong post-equinox correlation of CH4 with CO2 found in this paper was not found in the pre-equinox data (ALK15). The appearance of intensity maxima in the less volatile species in the southern hemisphere post-equinox strongly suggests that thermal effects are important drivers of the observed time variability. Excluding CH4 for the moment, based on the above similarities between pre- and post-equinox, we may conclude that the overall temperature conditions returned during post-equinox, and the chemical heterogeneity proposed in ALK15 still appears to be present.
By extending the correlation study to mole fractions of CO2 and H2O in Fig. 8, we investigated the variations in the imaginary temperature line that separates the sublimation temperatures of CO2 and HCN and determines whether a species correlates better with CO2 or H2O. Again excluding CH4 for the moment, most of the species strongly correlate with either pure CO2 or H2O and any addition of one or the other major species decreases the correlation. The interesting exception is clearly HCN. We found that HCN is best correlated with pure H2O post-equinox, but is best correlated with a mixture of CO2 and H2O pre-equinox. Thus, based on the pre-equinox correlation of HCN with a mixture of CO2 and H2O and the distinct pre/post-equinox pattern of CH4, our initially proposed explanation of segregated polar and non-polar ice phases in the nucleus of 67P (ALK15) becomes less clear. In terms of volatility, as defined by the sublimation temperature, HCN is the closest species to CO2. Thus, one interpretation of Fig. 8 is that temperature variations in the southern hemisphere nucleus pre-equinox were sometimes large enough to reach the sublimation temperature of HCN, but not that of CH3OH or H2O. Thus, HCN is observed to correlate with a mixture of CO2 and H2O. This interpretation does not take into account insolation, which is discussed below.
An unexpected result of our pre- and post-equinox comparison is the difference in the overall signal strength of the analyzed species (see also Kramer et al. 2017). During pre-equinox, the DFMS signal strength of CO2 (and also that of CO) came close to and even rivaled the signal of H2O (Fig. 1) only at specific sub-spacecraft longitudes and latitudes (100°–140° at moderate negative latitudes and −40° to 10° at high negative latitudes; Hässig et al. 2015; ALK15; hereafter interpreted in terms of “spacecraft view” for easier visualization). This pattern where the CO2 signal rivaled the H2O signal was typical for all southern hemisphere scans up to about five months before the inbound equinox. However, CO2 dominated the overall post-equinox signal (Figs. 2 and 3) regardless of the spacecraft view.
For the time periods considered in both ALK15 and in this study, Rosetta orbited the nucleus on bound, near-terminator orbits. Although we can control most parameters to make the pre- and post-equinox conditions nearly the same for direct comparison, we cannot control the illumination. Thus, when trying to explain these pre- and post-equinox differences in the dominating species, an obvious effect to investigate is potential changes in illumination. The spin axis of 67P is tilted by 52°, together with the elliptical orbit, this results in large differences between the length and intensity of seasons in the two hemispheres (Keller et al. 2015, 2017). The orientation of the spin axis relative to the Sun pre- and post-equinox is also different by more than 45°, which causes different illumination conditions in the southern hemisphere during post-equinox than pre-equinox. We calculated the rough illumination at the southern hemisphere of 67P for both pre- and post-equinox at the times of individual H2O and CO2 maxima, and superposed the illumination on the ESA NAVCAM shape model for the times of pre- and post-equinox maxima, as shown in Figs. 9 and 10. The shape model is divided into facets. The illumination for a given position of the Sun from the spacecraft perspective is calculated based on Lambert’s cosine law as the cosine of the angle between the normal of the facet and the direction of the Sun. While we understand that this approach does not take other potential effects into account, such as illumination by reflected sunlight off the nucleus surface, it does provide a reasonable estimate of the overall illumination of the nucleus from the spacecraft perspective. Comparing the pre-and post-equinox CO2 maxima in Figs. 9 and 10, it is striking how much weaker the illumination was post-equinox, especially when the larger lobe was facing the spacecraft. Although the illumination at the larger lobe was much weaker, the post-equinox CO2 signal was still noticeably stronger than the H2O signal. When comparing the H2O maxima pre- and post-equinox, it is interesting that H2O showed similar local maxima when the large lobe was well illuminated and in view post-equinox; however, the CO2 signal is even stronger during these occasions.
The overall signal strength of H2O and CO2 may be explained by the differences in the seasons on the comet. That is, these post-equinox changes may reflect the effects of 67P’s recent perihelion passage on the comet’s southern hemisphere. Southern hemisphere summer occurs near perihelion, which results in shorter but more intense summers than in the northern hemisphere. As a result, the southern hemisphere loses a significant amount of volatile species during its summer; the erosion is estimated to be several meters in the southern hemisphere (Keller et al. 2015). This summer erosion sheds off the more near-surface southern hemisphere layers (which may fall back elsewhere). These southern hemisphere layers are more depleted in the highly volatile species, setting the scene for the exposure of deeper, more pristine nucleus material. This material is more enriched in volatile species due to the limited insolation (and, at places, no insolation) it has experienced in the past, which now, being closer to the surface, may be released into the coma. Sublimation from these enriched layers of the nucleus then results in the observed higher signals of the minor super-volatile species, and the higher CO2 than H2O densities. The exposure of fresh, super-volatile-rich layers is supported by the fact that the strength of the southern hemisphere H2O signal remains roughly the same from pre- to post-equinox, while the signals of the more volatile species increase noticeably post-equinox. These findings for post-equinox are in agreement with the conclusions of Bockelée-Morvan et al. (2016) from VIRTIS observations, who attributed near-perihelion changes in the CO2/H2O ratio to the erosion of volatile-poor surface layers.
In light of the above, the pre-equinox CO2 maxima that rivaled the H2O signal only when the larger lobe was in the DFMS field of view may alternatively be interpreted as a preview of the southern hemisphere or even the lobe composition. Therefore, it is possible based on these observations that the sublimating layer in the southern hemisphere nucleus is indeed enriched in CO2 and other volatile species relative to H2O compared to the northern hemisphere, and that such chemical heterogeneity would primarily be driven by the seasonal thermal evolution of the nucleus. If Rosetta had had the capability to follow 67P throughout its entire orbit, then based on the heterogeneity interpretation, we predict that we would see the CO2 (and other more volatile species) signal gradually decrease as the sublimating southern hemisphere nucleus layers become more and more depleted in the more volatile species. CO2 and the more volatile species can sublimate even after H2O sublimation stops near aphelion, thus allowing the release of these more volatile species over a longer period of time. By the time 67P returned to the same position as Rosetta’s approach phase in late 2014, we would most likely see the same signal pattern of CO2 and the more volatile species as we did several months before the inbound equinox in 2014. In particular, their signals would be reduced compared to the previous outbound equinox and comparable to the H2O signal.
While the main underlying cause for CO2 dominating the total outgassing over the southern hemisphere is most easily explained by outgassing from more volatile-rich layers following the intense summer, illumination does have a clearly observable effect on the periodic time variation trend of the coma species. For instance, when the larger lobe rotates out of full view and the illumination drops, the H2O, CH3OH, and HCN signals also decrease, but not to a minimum – a plateau or “shoulder” in all three appears when the more volatile species following CO2 reach their local maxima. As the better-illuminated northern part of the large lobe is now turning into view along with parts of the head, these well-illuminated areas likely contribute to the detected signal, resulting in a plateau instead of a sudden drop in the H2O, HCN and CH3OH signals. This observation is supported by the secondary maxima in these species following the signal plateau, which occur when the better-illuminated parts of both lobes rotate into view (e.g., 22 June 2016 from about 7 h to about 12 h, which is the sequence of first – second spacecraft views labeled “H2O”, and the “CO2” view in between in Fig. 10). At the same time, the maxima in CO2 and the more volatile species are seen when the larger lobe has slightly rotated out of direct view of Rosetta, and is darker, that is, weakly illuminated. Because these more volatile species have lower sublimation temperatures, they are less affected by the change in illumination at the rotating nucleus.
Taken in light of the pre-equinox results of ALK15, these post-equinox observations may indicate that the main source of CO2 is still in the southern hemisphere. In that case, the post-equinox coma heterogeneity may be the manifestation of a heterogeneous nucleus evolution with the sublimating layer in the southern hemisphere having a higher fraction of the volatile species whose periodic outgassing pattern is driven by illumination. If the erosion depth exceeds the depth of the active layers, which is suggested by Keller et al. (2015) and the model of Capria et al. (2017), then the freshly exposed volatile-rich layers are representative of the original cometary material.
5. Summary and conclusions
A direct comparison of pre-equinox (ALK15) and matching post-equinox conditions for the southern hemisphere of comet 67P revealed notable differences in the behavior of neutral species in the coma. While these differences revealed fundamental clues about the composition of the southern hemisphere nucleus, they also fit within the original explanation proposed for the pre-equinox behavior of neutral species. ALK15 explained the time variability of various coma species with thermal effects superposed on nucleus heterogeneity. The exact same conditions as observed pre-equinox were clearly not reproduced post-equinox. In particular, insolation, which was clearly different pre- and post-equinox, has a large effect on the coma composition. Nonetheless, the stronger post-equinox signals, with the exception of H2O, suggest outgassing from more volatile-rich layers compared to pre-equinox. The continuous release of the more volatile species at the colder temperatures through aphelion may have depleted the sublimating layers from which outgassing is observed inbound to equinox. Rosetta first arrived at the comet on its inbound trajectory at heliocentric distances beyond 3 AU following several years of slow outgassing of the most volatile species. On its approach at relatively low phase angles, ROSINA/DFMS measured the southern hemisphere coma reflective of a large lobe somewhat depleted in volatiles during this approach phase. The significant erosion over the short but intense southern-hemisphere summer that followed revealed fresh layers of nucleus material. Comparing the neutral ROSINA/DFMS signals observed under very similar conditions pre- and post-equinox shed light onto a pre-equinox depletion, and further emphasized the thermally (seasonally) driven heterogeneity of the larger lobe. The short-scale periodic changes superposed on the overall signal (repeating maxima and minima) correspond to the illumination conditions and the orientation of the rotating nucleus with respect to Rosetta.
As revealed by our study, the correlations and coma heterogeneity of some species may be different in the southern hemisphere at shorter pre-and post-equinox segments of the mission than at longer ones with changing heliocentric distance, and/or with the consideration of both hemispheres together (Hansen et al. 2016; Gasc et al. 2017). One likely explanation for the differences between our post-equinox correlation results and those of Gasc et al. (2017) is that the scatter plots in Gasc et al. (2017) include a combination of different slopes for each hemisphere, which when plotted together may appear as no correlation. This explanation seems to be supported by Fig. 4 of Gasc et al. (2017), where it is apparent that the southern hemisphere HCN is correlated with H2O and is anticorrelated with CO2 at 3.18 AU. Nevertheless, the surprising differences in the patterns of certain species warrant further investigation that will require a comprehensive interpretation consistent with both the short-term pre- and post-equinox observations and the long-term changes observed over the mission.
Acknowledgements.
The Rosetta/ROSINA team consists of many individuals who worked over a period of more than 20 yr to achieve the spectacular successes from the Rosetta mission encounter with comet 67P. The authors are deeply indebted to these individuals. Work at JHU/APL was supported by NASA grant 80NSSC18K1620. Work at the University of Bern was funded by the State of Bern, the Swiss National Science Foundation and by the European Space Agency PRODEX Program. Work at Southwest Research institute was supported by NASA (subcontract JPL-1496541), at the University of Michigan by NASA (contract JPL-1266313). This work has also been supported through the A*MIDEX project from the French National Research Agency (ANR; ANR-11-IDEX- 0001-02) and by CNES grants at IRAP, LATMOS, LPC2E, LAM, CRPG. The authors would also like to thank an anonymous reviewer for their suggestions that improved this paper.
References
- Altwegg K, Balsiger H, Berthelier JJ, et al. 2017, Phil. Trans. R. Soc. A, 375, 20160253. [DOI] [PMC free article] [PubMed] [Google Scholar]
- Balsiger H, Altwegg K, Bochsler P, et al. 2007, Space Sci. Rev, 128, 745 [Google Scholar]
- Bieler A, Altwegg K, Balsiger H, et al. 2015, Nature, 526, 678. [DOI] [PubMed] [Google Scholar]
- Biver N, Hofstadter M, Gulkis S, et al. 2015, A&A, 583, A3 [Google Scholar]
- Bockelée-Morvan D, Debout V, Erard S, et al. 2015, A&A, 583, A6 [Google Scholar]
- Bockelée-Morvan D, Crovisier J, Erard S, et al. 2016, MNRAS, 462, S170 [Google Scholar]
- Capria MT, Capaccioni F, Filacchione G, et al. 2017, MNRAS, 469, S685 [Google Scholar]
- Fink U, Doose L, Rinaldi G, et al. 2016, Icarus, 277, 78 [Google Scholar]
- Fougere N, Altwegg K, Berthelier J-J, et al. 2016, A&A, 588, A134 [Google Scholar]
- Gasc S, Altwegg K, Fiethe B, et al. 2017, Planet. Space Sci, 135, 64 [Google Scholar]
- Gulkis S, Allen M, von Allmen P, et al. 2015, Science, 347, aaa0709. [DOI] [PubMed] [Google Scholar]
- Hansen KC, Altwegg K, Berthelier J, et al. 2016, MNRAS, 462, S491 [Google Scholar]
- Hässig M, Altwegg K, Balsiger H, et al. 2015, Science, 347, aaa0276. [DOI] [PubMed] [Google Scholar]
- Huebner WF, Benkhoff J, Capria M-T, et al. 2006, Heat and Gas Diffusion in Comet Nuclei, (Bern, Switzerland: ISSI; ), 133 [Google Scholar]
- Keller HU, Mottola S, Davidsson B, et al. 2015, A&A, 583, A34 [Google Scholar]
- Keller HU, Mottola S, Hviid SF, et al. 2017, MNRAS, 469, S357 [Google Scholar]
- Kramer T, Läuter M, Rubin M, & Altwegg K 2017, MNRAS, 469, S20 [Google Scholar]
- Laufer D, Bar-Nun A, & Greenberg AN 2018, MNRAS, 469, S818 [Google Scholar]
- Le Roy L, Altwegg K, Balsiger H, et al. 2015, A&A, 583, A1 [Google Scholar]
- Lectez S, Simon J-M, Mousis O, et al. 2015, ApJ, 805, L1 [Google Scholar]
- Lee S, Von Allmen P, Allen M, et al. 2015, A&A, 583, A5 [Google Scholar]
- Livadiotis G 2007, Phys. A, 375, 518 [Google Scholar]
- Livadiotis G, & McComas DJ 2013, J. Geophys. Res, 118, 2863 [Google Scholar]
- Luspay-Kuti A, Hässig M, Fuselier SA, et al. 2015, A&A, 583, A4 [Google Scholar]
- Luspay-Kuti A, Mousis O, Hässig M, et al. 2016, Sci. Adv, 2, e1501781. [DOI] [PMC free article] [PubMed] [Google Scholar]
- Migliorini A, Piccioni G, Capaccioni F, et al. 2016, A&A, 589, A45 [Google Scholar]
- Mousis O, Lunine JI, Luspay-Kuti A, et al. 2016a, ApJ, 819, L33 [Google Scholar]
- Mousis O, Ronnet T, Brugger B, et al. 2016b, ApJ, 823, L41 [Google Scholar]
- Prialnik D, Benkhoff J, & Podolak M 2004, in Comets II, eds. Festou M, Keller U, & Weaver H (Tucson, AZ: University of Arizona Press; ), 359 [Google Scholar]


