

Abstract
Background
Coronavirus disease 2019 (COVID-19) has rapidly become a global pandemic. Because the severity of the disease is highly variable, predictive models to stratify patients according to their mortality risk are needed.
Objective
Our aim was to develop a model able to predict the risk of fatal outcome in patients with COVID-19 that could be used easily at the time of patients' arrival at the hospital.
Methods
We constructed a prospective cohort with 611 adult patients in whom COVID-19 was diagnosed between March 10 and April 12, 2020, in a tertiary hospital in Madrid, Spain. The analysis included 501 patients who had been discharged or had died by April 20, 2020. The capacity of several biomarkers, measured at the beginning of hospitalization, to predict mortality was assessed individually. Those biomarkers that independently contributed to improve mortality prediction were included in a multivariable risk model.
Results
High IL-6 level, C-reactive protein level, lactate dehydrogenase (LDH) level, ferritin level, d-dimer level, neutrophil count, and neutrophil-to-lymphocyte ratio were all predictive of mortality (area under the curve >0.70), as were low albumin level, lymphocyte count, monocyte count, and ratio of peripheral blood oxygen saturation to fraction of inspired oxygen (SpO2/FiO2). A multivariable mortality risk model including the SpO2/FiO2 ratio, neutrophil-to-lymphocyte ratio, LDH level, IL-6 level, and age was developed and showed high accuracy for the prediction of fatal outcome (area under the curve 0.94). The optimal cutoff reliably classified patients (including patients with no initial respiratory distress) as survivors and nonsurvivors with 0.88 sensitivity and 0.89 specificity.
Conclusion
This mortality risk model allows early risk stratification of hospitalized patients with COVID-19 before the appearance of obvious signs of clinical deterioration, and it can be used as a tool to guide clinical decision making.
Key words: COVID-19, IL-6, mortality risk, predictive model
Abbreviations used: ALT, Alanine transaminase; ARDS, Acute respiratory distress syndrome; AST, Aspartate transaminase; AUROCC, Area under the receiver operating characteristic curve; COVID-19, Coronavirus disease 2019; CRP, C-reactive protein; ICU, Intensive care unit; LDH, Lactate dehydrogenase; N/L, Neutrophil-to-lymphocyte; PPV, Positive predictive value; ROC, Receiver operating characteristic; SARS-CoV-2, Severe acute respiratory syndrome coronavirus 2; SOFA, Sequential organ failure assessment; SpO2/FiO2, Peripheral blood oxygen saturation–to–fraction of inspired oxygen
The outbreak of severe acute respiratory syndrome coronavirus 2 (SARS-CoV-2) infection started in December 2019 in China1 and has since spread globally, reaching more than 7 million confirmed cases and more than 400,000 reported deaths to date.2 SARS-CoV-2 infection causes Coronavirus disease 2019 (COVID-19), and its severity ranges from asymptomatic to acute respiratory distress syndrome (ARDS), multiorgan failure, and eventually death.3
The overall rate of mortality due to COVID-19 has been estimated at 1% to 3%3, whereas the reported mortality rate in hospitalized patients has varied from 6% to 34%,4, 5, 6 and it can exceed 50% in patients in intensive care units (ICUs).7 Given these differences in disease severity and the potentially high in-hospital mortality, there is a need for early predictive biomarkers able to stratify patients according to their likelihood of a fatal outcome. A few reports have described the clinical characteristics of hospitalized patients with COVID-19 and have proposed risk factors for mortality.4 , 8, 9, 10 These factors include older age; high sequential organ failure assessment (SOFA) score; high neutrophil count; high C-reactive protein (CRP), d-dimer, or lactate dehydrogenase (LDH) or IL-6 level; and low lymphocyte count and platelet count or albumin level.
IL-6 may play a relevant role in the pathophysiology of patients with severe COVID-19.11 Blocking of the IL-6/IL-6R signaling pathway with tocilizumab among other drugs is currently being studied in clinical trials as a potential treatment for such patients. In this study, we analyzed the individual mortality prediction capacity of early, 1-time, readily available laboratory tests, including tests to determine IL-6 level, together with peripheral blood oxygen saturation–to–fraction of inspired oxygen (SpO2/FiO2) ratio, and we developed a multivariable model to predict fatal outcome in hospitalized patients with COVID-19.
Methods
Study design
This is a single-center prospective cohort study performed at Hospital Universitario 12 de Octubre, a large tertiary hospital in Madrid (Spain). A total of 611 hospitalized adult patients in whom COVID-19 was diagnosed between March 10 and April 12, 2020, and whose IL-6 level had been measured were included in the study. SARS-CoV-2 real-time RT-PCR assay of nasopharyngeal or oropharyngeal swabs or sputum samples was performed to diagnose COVID-19. According to the local protocols during the peak of the pandemic, a COVID-19 diagnosis was assumed in 28.9% of patients with suggestive clinical and radiologic presentation and compatible epidemiologic history (Table I ). Two patients with chronic lymphocytic leukemia and a lymphocyte count higher than 70,000 cells/μL were excluded. Only patients who had been discharged or had died by April 20, 2020, were included in the final analysis (N = 501) (Fig 1 ). The institutional clinical research ethics committee approved the study protocol (reference no. 20/167).
Table I.
Demographic and clinical characteristics of the cohort
| Characteristic | Overall cohort (N = 501) | Survivors (n = 465 [92.8%]) | Nonsurvivors (n = 36 [7.2%]) | P value |
|---|---|---|---|---|
| Age (y), median (IQR) | 52 (44-60) | 52 (44-58) | 65 (57-72) | <.0001 |
| Gender, male, no. (%) | 317 (63.3%) | 292 (62.9%) | 25 (69.4%) | .54 |
| Ethnicity, no. (%) | .035 | |||
| White | 272 (54.3%) | 241 (52.5%) | 27 (75.0%) | |
| Hispanic | 213 (42.5%) | 204 (44.0%) | 9 (25.0%) | |
| Other | 16 (3.2%) | 16 (3.5%) | 0 | |
| Previous comorbidities, no. (%) | ||||
| Hypertension | 139 (27.7%) | 117 (25.2%) | 22 (61.1%) | <.0001 |
| Diabetes mellitus | 56 (11.2%) | 49 (10.5%) | 7 (19.4%) | .11 |
| Dyslipidemia | 125 (25.0%) | 109 (23.4%) | 16 (44.4%) | .008 |
| Thromboembolic event | 23 (4.6%) | 20 (4.3%) | 3 (8.3%) | .28 |
| Obesity | 41 (8.2%) | 31 (6.7%) | 10 (27.8%) | .0002 |
| Chronic pneumopathy∗ | 54 (10.8%) | 47 (10.1%) | 7 (19.4%) | .09 |
| Neoplasia | 19 (3.8%) | 16 (3.4%) | 3 (8.3%) | .14 |
| Smoking | 91 (18.2%) | 80 (17.2%) | 11 (30.6%) | .07 |
| SARS-CoV-2 RT-PCR result, positive, no. (%)† | 356 (71.1%) | 327 (70.3%) | 29 (80.6%) | .25 |
| ARDS classification on test day, no. (%)‡ | ||||
| None | 281 (56.1%) | 277 (59.6%) | 4 (11.1%) | <.0001 |
| Mild | 113 (22.6%) | 109 (23.4%) | 4 (11.1%) | .10 |
| Moderate | 36 (7.2%) | 32 (6.9%) | 4 (11.1%) | .31 |
| Severe | 67 (13.4%) | 43 (9.3%) | 24 (66.7%) | <.0001 |
| COVID-19 treatment on test day, no. (%) | ||||
| Hydroxychloroquine | 442 (88.2%) | 413 (88.8%) | 29 (80.6%) | .17 |
| Azithromycin | 387 (77.2%) | 362 (77.9%) | 25 (69.4%) | .30 |
| IFN-β | 32 (6.4%) | 26 (5.6%) | 6 (16.7%) | .021 |
| Lopinavir/ritonavir | 184 (36.7%) | 167 (35.9%) | 17 (47.2%) | .21 |
| Corticosteroids | 123 (24.6%) | 106 (22.8%) | 17 (47.2%) | .002 |
| Time from onset of illness to hospital admission (d), median (IQR) | 8 (6-10) | 8 (6-11) | 7 (5-8) | .032 |
| Time from hospital admission to laboratory measurements (d), median (IQR) | 2 (1-4) | 2 (1-4) | 2 (1-4) | .87 |
| Length of hospital stay (d), median (IQR) | 8 (6-13) | 8 (6-13) | 7 (5-13) | .62 |
| ICU admission, no. (%) | 42 (8.4%) | 28 (6.0%) | 14 (38.9%) | <.0001 |
IQR, Interquartile range.
Included pulmonary fibrosis, chronic obstructive pulmonary disease, bronchiectasis, and asthma.
Real-time RT-PCR.
ARD syndrome.
Fig 1.
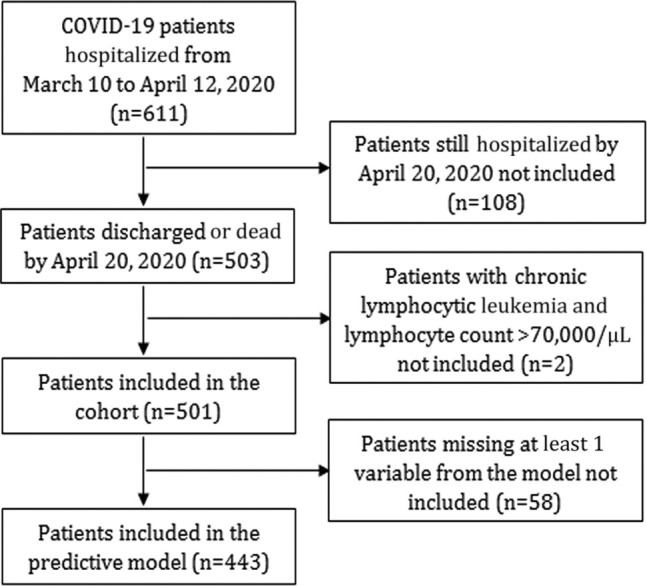
Flowchart of patients included in the study.
Data collection
Clinical data (including demographics and major comorbidities; hospital admission, discharge, and death dates; time from symptom onset to hospitalization; length of hospital stay; and ICU requirement) were collected from the electronic medical records into the study database. Oxygen saturation and COVID-19 treatment were recorded on the day of the blood test. Respiratory function was assessed by measurement of SpO2/FiO2 ratio. The SpO2/FiO2 ratio shows a good correlation with the partial pressure of arterial oxygen (PaO2)/Fio 2 ratio (SpO2/FiO2 = 64 + 0.84 × [PaO2/FiO2]),12 and unlike the latter, it was available for all the patients. ARDS was classified according to the Berlin criteria, according to which an SpO2/FiO2 ratio higher than 315 indicates no ARDS, an SpO2/FiO2 ratio between 315 and 235 indicates mild ARDS, an SpO2/FiO2 ratio between 148 and 235 indicates moderate ARDS, and an SpO2/FiO2 ratio less than 148 indicates severe ARDS.13
Laboratory measurements
IL-6 level was measured with the BD CBA Human IL-6 Flex Set (BD Biosciences, San Diego, Calif) by using a BD Canto II flow cytometer. The results were analyzed with FCAP Array software, version 3.0 (BD Biosciences). IL-6 level measurements following tocilizumab therapy were not included in the study. Other laboratory parameters such as CRP level, albumin level, alanine transaminase (ALT) level, aspartate transaminase (AST) level, LDH level, ferritin level, d-dimer level, fibrinogen level, platelet count, neutrophil count, lymphocyte count, and monocyte count were measured as part of the standard of care. All laboratory measurements were performed on the same day. Neutrophil-to-lymphocyte (N/L) ratio was calculated for every patient. High-sensitivity cardiac troponin level was not included in the analysis given the low number of patients with that measurement.
Statistical analysis
Continuous numeric data have been represented as medians and interquartile ranges and were compared by using the Mann-Whitney U test. Categoric variables have been represented as numbers and percentages and were compared by using the chi-square test or the Fisher exact test when appropriate. Box plots have been represented in Tukey style. Correlation was evaluated with linear regression and the Spearman rank coefficient. Univariate logistic regression was performed for each variable to test association with mortality. We evaluated each variable as a potential biomarker by using receiver operating characteristic (ROC) curves.
The Transparent Reporting of a Multivariable Prediction Model for Individual Prognosis or Diagnosis (TRIPOD) guidelines for development of multivariate prediction models were followed.14 All the variables with a significant association with fatal outcome, as tested by univariate logistic regression and an area under the ROC curve (AUROCC) value higher than 0.70 were used in the backward stepwise regression. Nonsignificant variables were excluded thereafter. Random forest analysis (with 500 trees) was then used to evaluate the importance of IL-6 level, LDH level, N/L ratio, SpO2/FiO2 ratio, and age to the model, after which 5 sequential logistic regression models for mortality were performed. The discriminative capacity of the 5 models was estimated by using the AUROCC. No imputation was performed; for every model, only patients with all the available data were included in the logistic regression. Model coefficients are shown in Table E1 (available in this article’s Online Repository at www.jacionline.org). The Hosmer-Lemeshow test was used to assess the models' goodness of fit. Logistic regression models were transformed to a 0-1 scale to facilitate their interpretation. The model including 5 variables was selected as our final mortality predictive model. The final model can be calculated with the following formula: score = 1/(1 + EXP [–(–7.6991 – 0.0076 × SpO2/FiO2 ratio + 0.0547 × N/L ratio + 0.0046 × LDH + 0.0043 × IL6 + 0.0682 × age)]). The variance inflation factor was lower than 1.2 for the 5 variables in the model, showing no collinearity. Internal validation of the selected model was performed by bootstrapping (1000 replications) of the 5 variables. The prediction model was calculated on each bootstrap sample and tested on the original sample. Optimism and optimism-adjusted discrimination were calculated.
The Youden index was used for cutoff selection. Sensitivity, specificity, negative predictive value, and positive predictive value (PPV) were calculated for each individual variable and model cutoff. Time-to-event curves were plotted by the Kaplan-Meier method, and differences were compared with the log-rank test to analyze the suitability of the score for stratification across risk categories. Throughout the analysis, only patients with available data were compared, and the number of patients is specified in the figures and tables. A P value less than .05 was considered statistically significant. Data sets can be made available subsequent to formal request to the corresponding author. All the analyses were performed with R software, version 3.6.1.
Results
The final patient cohort included 501 patients with COVID-19 (Fig 1); their demographic and clinical characteristics are described in Table I. In all, 36 patients (7.2%) died during follow-up and 42 patients (8.4%) required ICU admission.
The median time from arrival at the hospital to laboratory testing was 2 days (interquartile range, 1-4 days) (Table I). Neither the time from hospital admission to laboratory testing nor the time from onset of illness to hospital admission differed between survivors and nonsurvivors (2 days vs 2 days [not significant] and 8 days vs 7 days [not significant], respectively). The laboratory test results had minimal or no correlation with the time from onset of illness (see Fig E1 in this article’s Online Repository at www.jacionline.org). However, all of the recorded variables except for AST level and fibrinogen level differed between survivors and nonsurvivors (Table II ). IL-6 level, CRP level, LDH level, ferritin level, d-dimer level, neutrophil count, and N/L ratio were significantly increased in deceased patients compared with in discharged patients, whereas albumin level, ALT level, platelet count, monocyte count, lymphocyte count, and SpO2/FiO2 ratio were decreased. Univariate logistic regression assessed the ability of each individual variable to predict mortality; the analysis showed that high IL-6 level, CRP level, LDH level, ferritin level, neutrophil count, and N/L ratio were risk factors for mortality due to COVID-19, whereas low albumin level, ALT level, platelet count, monocyte count, lymphocyte count, and SpO2/FiO2 ratio were also associated with higher risk of death (see the odds ratio in Table II). d-Dimer level did not reach statistical significance as a risk factor.
Fig E1.

Laboratory values and SpO2/FiO2 ratio did not correlate with the time from onset of illness to the measurement. Most variables did not correlate, and for those that did, the impact of days from onset of illness was minimal (very low R2). This implied that the values obtained depended not on the number of days with symptoms until the measurement but rather on the severity of each particular patient.
Table II.
Variables measured in survivors and nonsurvivors and their association with mortality
| Variables | Survivors (n = 465) |
Nonsurvivors (n = 36) |
P value | Univariate logistic regression |
||||||
|---|---|---|---|---|---|---|---|---|---|---|
| Median | IQR | n | Median | IQR | n | OR∗ | 95% CI | P value | ||
| IL-6 level (pg/mL) | 17.0 | 5.0-44 | 421 | 86.0 | 20.0-225.0 | 33 | <.0001 | 1.008 | 1.005-1.012 | <.0001 |
| CRP level (mg/dL) | 7.68 | 3.31-14.93 | 464 | 19.4 | 13.0-26.5 | 36 | <.0001 | 1.105 | 1.069-1.145 | <.0001 |
| Albumin level (g/dL) | 3.7 | 3.4-4.0 | 459 | 3.3 | 2.9-3.5 | 36 | <.0001 | 0.071 | 0.028-0.168 | <.0001 |
| ALT level (U/L) | 43.0 | 28.0-72.0 | 463 | 24.5 | 16.5-39.5 | 36 | .0002 | 0.984 | 0.970-0.996 | .016 |
| AST level (U/L) | 38.0 | 26.0-58.0 | 461 | 42 | 30.0-64.8 | 36 | .22 | 1.001 | 0.991-1.008 | .86 |
| LDH level (U/L) | 344.0 | 270.8-443.0 | 456 | 538.0 | 384.8-691.8 | 36 | <.0001 | 1.007 | 1.005-1.009 | <.0001 |
| Ferritin level (ng/mL) | 984.0 | 449.5-1801.2 | 378 | 2345.0 | 1502.0-3388.0 | 23 | .0001 | 1.000 | 1.000-1.000 | .0009 |
| d-Dimer level (ng/mL) | 550.0 | 354.8-935.0 | 304 | 1514.0 | 614.5-3367.2 | 26 | <.0001 | 1.000 | 0.999-1.000 | .052 |
| Fibrinogen level (mg/dL) | 811.0 | 697.0-923.0 | 331 | 845.0 | 776.0-960.5 | 27 | .12 | 1.002 | 0.999-1.004 | .08 |
| Platelet count (× 103 cells/μL) | 277.0 | 211.5-372.0 | 463 | 232.5 | 172.8-300.8 | 36 | .011 | 0.996 | 0.992-0.999 | .017 |
| Monocyte count (× 103 cells/μL) | 0.5 | 0.4-0.7 | 463 | 0.4 | 0.2-0.5 | 36 | .002 | 0.084 | 0.015-0.398 | .003 |
| Neutrophi count (× 103 cells/μL) | 4.3 | 3.0-6.8 | 463 | 8.1 | 6.0-11.4 | 36 | <.0001 | 1.225 | 1.135-1.326 | <.0001 |
| Lymphocyte count (× 103 cells/μL) | 1.0 | 0.7-1.4 | 464 | 0.6 | 0.3-0.9 | 36 | <.0001 | 0.076 | 0.025-0.201 | <.0001 |
| N/L ratio | 4.2 | 2.4-8.0 | 463 | 16.9 | 7.4-28.4 | 36 | <.0001 | 1.097 | 1.065-1.133 | <.0001 |
| SpO2/FiO2 ratio | 346.4 | 269.4-452.4 | 461 | 106.7 | 101.1-212.1 | 36 | <.0001 | 0.986 | 0.982-0.990 | <.0001 |
Odd ratio per unit increase.
To evaluate the potential of these variables as predictors of mortality due to COVID-19, an AUROCC analysis was performed (Table III ). Several variables emerged individually as potential biomarkers, namely, IL-6 level (AUROCC = 0.74), CRP level (AUROCC = 0.80), albumin level (AUROCC = 0.81), LDH level (AUROCC = 0.78), ferritin level (AUROCC = 0.74), d-dimer level (AUROCC = 0.75), monocyte count (AUROCC = 0.71), neutrophil count (AUROCC = 0.76), lymphocyte count (AUROCC= 0.79), N/L ratio (AUROCC = 0.83), and SpO2/FiO2 ratio (AUROCC = 0.87). Optimal cutoffs based on Youden index were calculated for these variables to classify patients into groups at high or low risk of a fatal outcome. AUROCC and survival curves for each individual biomarker are shown in Fig E2 (in this article’s Online Repository at www.jacionline.org), except for neutrophil count and lymphocyte count (which were replaced in any further analysis by N/L ratio because of its superiority as a biomarker in this setting). The variable with the highest sensitivity was CRP level (0.97), whereas IL-6 level had the highest specificity (0.89) (Table III). Patients in our cohort with a CRP value below 8.75 mg/dL had less than a 1% probability of dying. PPVs were discrete owing to the relatively low mortality in the cohort. IL-6 level and SpO2/FiO2 ratio had the highest PPVs (0.26 and 0.32 respectively), which meant that having an IL-6 level higher than 86 pg/mL or an SpO2/FiO2 ratio lower than 211 increased the likelihood of dying from 7.2% in the overall cohort to 26% or 32%, respectively. Individually, the most robust biomarkers for predicting risk of mortality in this study were CRP level and SpO2/FiO2 ratio; patients with a CRP level higher than 8.75 mg/dL or an SpO2/FiO2 ratio less than 211 had 20 times more risk of dying than did those with values below or above the threshold.
Table III.
Variables analyzed as potential biomarkers for mortality
| Variable | ROC curve |
Risk factor cutoff characterization |
Cutoff univariate logistic regression |
||||||||
|---|---|---|---|---|---|---|---|---|---|---|---|
| AUC | 95% CI | Cutoff | Sensitivity | Specificity | PPV | NPV | Value | OR | 95% CI | P value | |
| IL-6 level (pg/mL) | 0.74 | 0.64-0.84 | 86 | 0.52 | 0.89 | 0.26 | 0.96 | ≤86 | Ref | — | <.0001 |
| >86 | 7.67 | 3.61-16.30 | |||||||||
| CRP level (mg/dL) | 0.80 | 0.72-0.89 | 8.75 | 0.97 | 0.53 | 0.14 | 0.99 | ≤8.75 | Ref | — | <.0001 |
| >8.75 | 19.52 | 5.85-121.15 | |||||||||
| Albumin level (g/dL) | 0.81 | 0.75-0.87 | 3.4 | 0.74 | 0.78 | 0.17 | 0.97 | ≤3.4 | 6.35 | 3.10-13.80 | <.0001 |
| >3.4 | Ref | — | |||||||||
| ALT level (U/L) | 0.69 | 0.61-0.77 | 25 | 0.80 | 0.53 | 0.16 | 0.96 | ≤25 | 4.06 | 2.03-8.17 | .0001 |
| >25 | Ref | — | |||||||||
| AST level (U/L)∗ | 0.57 | 0.47-0.67 | — | — | — | — | — | — | — | — | — |
| — | — | — | |||||||||
| LDH level (U/L) | 0.78 | 0.69-0.87 | 424 | 0.72 | 0.71 | 0.16 | 0.97 | ≤424 | Ref | — | <.0001 |
| >424 | 5.70 | 2.79-12.38 | |||||||||
| Ferritin level (ng/mL) | 0.74 | 0.62-0.86 | 1799 | 0.70 | 0.75 | 0.14 | 0.97 | ≤1799 | Ref | — | .0002 |
| >1799 | 5.59 | 2.35-14.26 | |||||||||
| d-dimer level (ng/mL) | 0.75 | 0.64-0.87 | 1386 | 0.62 | 0.84 | 0.23 | 0.96 | ≤1386 | Ref | — | <.0001 |
| >1386 | 7.10 | 3.10-16.76 | |||||||||
| Fibrinogen level (mg/dL)∗ | 0.59 | 0.47-0.71 | — | — | — | — | — | — | — | — | — |
| — | — | — | |||||||||
| Platelet count (× 103 cells/μL) | 0.63 | 0.54-0.72 | 245 | 0.63 | 0.61 | 0.11 | 0.95 | ≤245 | 2.61 | 1.31-5.35 | .007 |
| >245 | Ref | — | |||||||||
| Monocyte count (× 103 cells/μL) | 0.71 | 0.63-0.78 | 0.4 | 0.77 | 0.67 | 0.11 | 0.96 | ≤0.4 | 2.63 | 1.31-5.56 | .008 |
| >0.4 | Ref | — | |||||||||
| Neutrophil count (× 103 cells/μL) | 0.76 | 0.66-0.85 | 5.1 | 0.86 | 0.62 | 0.15 | 0.98 | ≤5.1 | Ref | — | <.0001 |
| >5.1 | 8.08 | 3.53-21.87 | |||||||||
| Lymphocyte count (× 103 cells/μL) | 0.79 | 0.73-0.85 | 0.9 | 0.63 | 0.83 | 0.13 | 0.98 | ≤0.9 | 6.37 | 2.78-17.23 | <.0001 |
| >0.9 | Ref | — | |||||||||
| N/L ratio | 0.83 | 0.74-0.91 | 6.5 | 0.86 | 0.68 | 0.17 | 0.98 | ≤6.5 | Ref | — | <.0001 |
| >6.5 | 10.54 | 4.59-28.55 | |||||||||
| SpO2/FiO2 ratio | 0.87 | 0.83-0.92 | 211.11 | 0.88 | 0.75 | 0.32 | 0.98 | ≤211.11 | 21.26 | 9.86-50.04 | <.0001 |
| >211.11 | Ref | — | |||||||||
AUC, Area under the curve; NPV, negative predictive value; Ref, reference.
Variables with an AUC less than 0.60 were not analyzed further.
Fig E2.


ROC and Kaplan-Meier analysis of individual variables with an area under the curve (AUC) greater than 0.70 and with a P value less than .05 in univariate logistic regression. Color shades represent the 95% CI. Time is indicated in days.
A multivariate prediction model was developed to improve the predictive power of each individual biomarker. The independent contribution of the top 8 variables to mortality risk, as identified by significant univariate logistic regression (Table II) and ROC curve analysis result greater than 0.70 (Table III) plus age, was assessed by backward stepwise regression. Age was included in the analysis because it had been identified as one of the major risk factors in COVID-19 in previous studies.3 , 4 Of these 9 variables, only IL-6 level, LDH level, N/L ratio, SpO2/FiO2 level, and age showed a statistically significant individual contribution to the predictive model. Random forest analysis gave the relative levels of relevance of each of the selected variables for mortality risk stratification, which in descending order were as follows: SpO2/FiO2 ratio, N/L ratio, LDH level, IL-6 level, and age (see Fig 3 in this article’s Online Repository at www.jacionline.org). The sequential regression models for mortality prediction in COVID-19 are shown in Table IV , and their β-coefficients are shown in Table E1. Increasing the model's complexity through the sequential addition of biomarkers improved its predictive performance up to an AUROCC of 0.94 (95% CI = 0.89-1.00). This final model, which includes SpO2/FiO2 ratio, N/L ratio, LDH level, IL-6 level, and age, had a robust classifying accuracy (Fig 2 , A). The Youden index–based cutoff generated for the model was 0.07, with a 0.88 sensitivity, 0.89 specificity, 0.38 PPV, and 0.99 negative predictive value. Kaplan-Meier analysis showed a very significant difference in survival for patients below or above the model threshold (P < .0001 [Fig 2, B]). Internal validation of the final model was performed by bootstrap resampling, showing maintained high accuracy (optimism-adjusted AUROCC = 0.93) (see Table E2 in this article’s Online Repository at www.jacionline.org). The COR+12 calculator based on the model can be found online at https://utrero-rico.shinyapps.io/COR12_Score/, thus allowing for calculation of a patient’s probability of death (see the instructions at the end of this article).
Fig 3.

Comparison of variables for survivors who did not require ICU admission, survivors who required ICU admission, and nonsurvivors. There were significant differences in most of the variables between the patient groups. The ICU survivors (blue) were similar to the nonsurvivors (red) for some variables such as CRP level and neutrophil count. For other variables, however, ICU survivors had values intermediate between those for survivors who did not require ICU admission (gray) and those for nonsurvivors.
Table IV.
Sequential regression models for mortality prediction in COVID-19
| Model | SpO2/FiO2 ratio | N/L ratio | LDH level | IL-6 level | Age | AIC | H-L | AUC | 95% CI | Cutoff | Sensitivity | Specificity | PPV | NPV |
|---|---|---|---|---|---|---|---|---|---|---|---|---|---|---|
| 1 | Yes | No | No | No | No | 190.63 | .05 | 0.87 | 0.80-0.95 | 0.12 | 0.75 | 0.88 | 0.32 | 0.98 |
| 2 | Yes | Yes | No | No | No | 175.14 | .41 | 0.91 | 0.84-0.97 | 0.07 | 0.86 | 0.83 | 0.27 | 0.99 |
| 3 | Yes | Yes | Yes | No | No | 169.43 | .57 | 0.91 | 0.84-0.97 | 0.11 | 0.81 | 0.88 | 0.34 | 0.98 |
| 4 | Yes | Yes | Yes | Yes | No | 136.41 | .92 | 0.93 | 0.87-0.99 | 0.13 | 0.81 | 0.92 | 0.44 | 0.98 |
| 5 | Yes | Yes | Yes | Yes | Yes | 129.28 | .93 | 0.94 | 0.89-1.00 | 0.07 | 0.88 | 0.89 | 0.38 | 0.99 |
AIC, Akaike information criterion; AUC, area under the curve; HL, Hosmer-Lemeshow test P value; NPV, negative predictive value.
Model 1 included 497 patients and 36 events, model 2 included 495 and 36 events, model 3 included 486 patients and 36 events, model 4 included 443 patients and 33 events, and model 5 includes 443 patients and 33 events.
Fig 2.

The mortality risk model accurately classified patients at risk of dying. A, The area under the curve (AUC) of the model was 0.94 (95% CI = 0.89-1.00); the optimal cutoff of 0.07 had a sensitivity of 0.88 and a specificity of 0.89. B, Kaplan-Meier analysis based on Youden index optimal cutoff showed a very different survival rate between the groups with low and high risk of death (P < .0001). Color shades represent the 95% CI. Time is indicated in days. C, The score obtained from the model in nonsurvivors (red) was significantly higher than that in survivors who required intensive care (blue) (P = .0001) and in survivors who did not require intensive care (gray) (P = .0001). Dashed line indicates the optimal cutoff for mortality (0.07).
The developed model detected, early after their arrival at the hospital, 88% of patients who subsequently died. Only 4 patients stratified by the model as having a low mortality risk died (12% of the deceased patients) (see Table E3 in this article’s Online Repository at www.jacionline.org). Three of these patients (75%) had relevant comorbidities for mortality due to COVID-19. At the time of data collection, more than half of the patient cohort had no respiratory distress (281 [56.1%]), 113 patients (22.6%) had mild ARDS, 36 (7.2%) had moderate ARDS, and 67 (13.4%) had severe ARDS (Table I). The initial respiratory function assessment was a good predictor of mortality (SpO2/FiO2 ratio AUROCC = 0.87); however, 12 patients with no ARDS or mild-to-moderate ARDS in this early assessment died. Most of these patients (73%) who died without initial severe ARDS would have been classified by the model as having a high mortality risk (see Fig E4 in this article’s Online Repository at www.jacionline.org).
Fig E4.

Contribution of the model to prediction of patient mortality in addition to their initial respiratory function assessment. SpO2/FiO2 ratio and mortality score are represented for every deceased patient in the cohort, except for 3 of 36 patients who died (1 indicates no ARDS, and 2 indicates severe ARDS), and no score was available. Of the 11 patients without severe ARDS who died, 8 (73%) had a high mortality score in the beginning of their hospitalization. The lower limit of the color shade corresponds to the model cutoff 0.07.
Finally, we analyzed all of the studied variables regarding ICU admission. Patients were divided into 3 levels of severity: patients who were discharged from hospital without having needed for intensive care, patients who required ICU admission but survived, and patients who died either after ICU admission or not. There were significant differences between the severity groups with regard to all variables except for AST level (Fig 3 ). For some biomarkers, such as CRP level or neutrophil count, ICU patients had values similar to those of nonsurvivors, whereas for other biomarkers such as LDH level, lymphocyte count, or SpO2/FiO2 ratio, ICU patients had intermediate values between those of less severely ill discharged patients and nonsurvivors. Next, the capacity of the risk model to predict intensive care requirement was tested. The score was significantly higher in patients who required ICU admission than in survivors who did not require ICU admission (0.059 [interquartile range, 0.015-0.15] vs 0.007 [interquartile range, 0.002-0.024]; P < .0001) (Fig 4 , A). The AUROCC for ICU requirement was 0.82 (95% CI = 0.74-0.91), with an optimal cutoff for the model of 0.03, which had 0.77 sensitivity and specificity. The value of the model to further define disease severity and to assist in hospital resource planning was tested; a significant positive correlation was found between the model and length of hospital stay in survivors (R 2 = 0.12; P < .0001) (Fig 4, B).
Fig 4.

The mortality risk model could also be applied to other severity estimates such as ICU requirement and length of hospital stay. A, The model was an acceptable predictor of ICU requirement, with an area under the curve (AUC) of 0.82 (95% CI = 0.74-0.91) and optimal cutoff of 0.03, with 0.77 sensitivity and 0.77 specificity. The risk score was significantly higher for patients who required ICU admission than the score for those who did not (P < .0001). Dashed line represents the optimal cutoff for ICU admission (0.03). B, There was a positive correlation between the model and length of hospital stay by survivors (P < .0001).
Discussion
We have described a predictive model to classify patients with a recent COVID-19 diagnosis according to their risk of death by using 5 early, easy-to-assess biomarkers. This study analyzed a large patient cohort at a hospital in Madrid, Spain, at the peak of the pandemic. Recently, a score to predict critical illness,15 and 2 scores to predict mortality,5 , 16 in hospitalized patients with COVID-19 have been published, with all of them analyzing patients from China. These have studies included a large number of variables in their model, and in contrast to in the present work, some of the variables, such as radiographic abnormalities or dyspnea, are relatively subjective. Additionally, a new machine learning model showed that LDH level, lymphocyte frequency, and CRP level can predict patient mortality more than 10 days in advance.17
The present cohort confirmed in a non-Asian population some of the previously identified risk factors (eg, age). The patients included in the study were mostly of white or Hispanic ethnicity. A higher mortality rate was found in white patients than in Hispanic patients, which could be partly explained by age difference (56 years [range 47-64 years] vs 48 years [range 41-54 years]; P < .0001). The main comorbidities associated with fatal outcome were hypertension, dyslipidemia, and obesity. Of note, the overall mortality rate of 7.2% during follow-up was lower than that reported by other hospital cohorts4 , 6 and lower than the 23% mortality rate described in the first consecutive 521 patients with COVID-19 in our hospital (from the end of February to the beginning of March, 2020) (Lalueza et al personal communication, 2020). Because it includes patients with IL-6 level measurements, the present cohort is younger (52 vs 65 years) and with lower rate of comorbidities (eg, a hypertension prevalence of 27.7% vs 42%) than in the work reported in the aforementioned communication by Lalueza et al. Moreover, 195 patients in our cohort (38.9%) received tocilizumab; the potential effect of this and other treatments on the mortality rate is currently being studied. The median time from hospital admission to laboratory testing was 2 days. However, the laboratory test results had minimal or no correlation with the time from onset of illness (see Fig E1), suggesting that the variables included in the study correlated with the severity of the disease rather than with the time interval since onset of symptoms or hospital admission.
Patients who progress to severe forms of COVID-19 are thought to have hyperactivation of the immune system with uncontrolled release of inflammatory cytokines.10 Signaling of the proinflammatory cytokine IL-6 can be blocked by the humanized anti–IL-6 receptor mAb tocilizumab.18 We set up measurement of IL-6 level in patients with COVID-19 at our hospital as a biomarker for inflammation and to help guide the administration of tocilizumab together with other inflammation markers such as CRP level, lymphocyte count, and clinical evaluation results.19 In our cohort, IL-6 level was increased in nonsurvivors. This reinforces the evidence that the amount of circulating IL-6 is closely linked to the severity of COVID-19,4 , 10 , 20 which has been further confirmed in a recent meta-analysis21 and contradicts the results reported for smaller published cohorts in which there were no differences in IL-6 level between patients with mild and severe COVID-19 cases.8 , 22 IL-6 level has also been associated with mortality risk in patients with ARDS who do not have COVID-19.23 Measuring IL-6 level and including it in the predictive model may not only be relevant for prognosis but could also improve therapeutic decision making. There is an increasing number of studies reporting a favorable outcome from blocking IL-6 signaling in patients with COVID-19,19 , 24, 25, 26 all of them without a randomized control group. The model described here could be used as a tool to classify patients into more biologically and clinically uniform subgroups before inclusion in randomized trials for tocilizumab or other drugs. Until results from clinical trials are available, the current model can be useful to indicate those patients who could potentially benefit most from immunomodulatory treatments. Besides measuring IL-6 level, measuring the level of other cytokines could offer deeper insight into the pathophysiology of the disease or prognostic value, and it could also be targeted for therapy intervention. Notably, blocking of IL-1 with anakinra is proving beneficial in reducing the need for invasive mechanical ventilation and mortality among patients with severe COVID-19.27
CRP is commonly used in clinical practice for decision making. In our study, it showed a remarkably high sensitivity for mortality prediction (0.97); however, it dropped out of the model, possibly because of its strong correlation with the variables SpO2/FiO2 ratio, N/L ratio, LDH level, and IL-6 level (see Fig E5 in this article’s Online Repository at www.jacionline.org). In particular, CRP levels are influenced by IL-6 level, as its cellular transcription can be a direct result of IL-6 signaling. Regarding the 3 levels of disease severity in Fig 3, CRP level appeared to be an accurate biomarker for predicting disease severity defined as ICU requirement or death.
Fig E5.
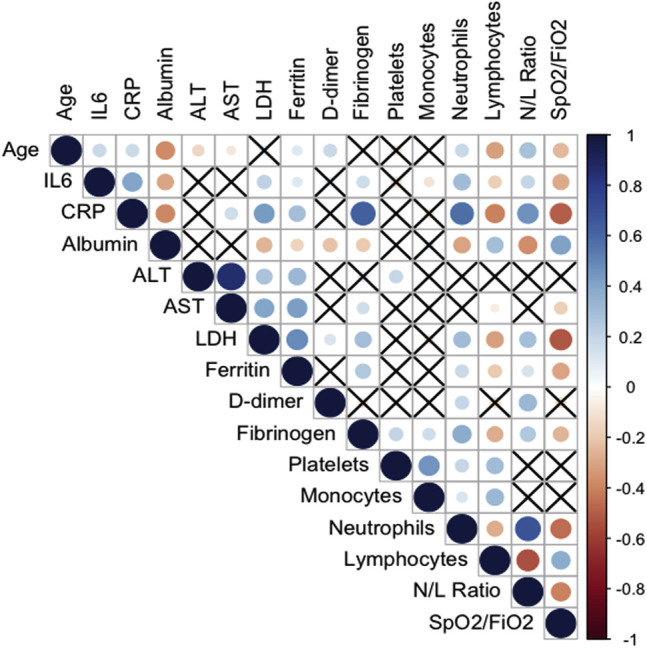
Correlation plot of all the variables assessed as potential predictive biomarkers of mortality due to COVID-19. Positive correlations appear in blue, and negative correlations appear in red. The size of the circle corresponds to the magnitude of the correlation. The cross indicates no correlation.
Zhou et al highlighted d-dimer, together with age and SOFA score, as an independent risk factor for mortality.4 Our study did not confirm the predictive value of d-dimer level (Table II). In the study by Zhou et al, 81% of nonsurvivors had a d-dimer level higher than 1000 ng/mL, whereas in our cohort only 13% of nonsurvivors had a level above that threshold. It is plausible that this biomarker classifies a subgroup of patients with coagulopathy complications during COVID-19 and this subgroup was less represented in our cohort. Of note, d-dimer level was measured in only 330 patients, and this might have prevented its significance as biomarker. Similarly, in our cohort the transaminase ALT level was significantly lower in nonsurvivors, in contrast with the levels in previous studies in which ALT was increased in ICU patients or nonsurvivors.4 , 8 Lei et al described a delayed increase in ALT level in patients with COVID-19 compared with the increase in levels of other liver enzymes. This could partially explain why ALT level was not increased in nonsurvivors at the time of measurement.28
The final model includes only 5 variables, namely, SpO2/FiO2 ratio, N/L ratio, LDH level, IL-6 level, and age, which are readily obtainable at hospitals and clinical laboratories and can be obtained in a short time. Their combination boosted the mortality predictive accuracy of the model to an AUROCC of 0.94. Nevertheless, 5 sequential regression models were developed, and all of them can be used on the basis of the available data. For example, in the absence of laboratory data, SpO2/FiO2 ratio alone could be used as a biomarker predictive of mortality (AUROCC = 0.87), with 0.75 sensitivity and 0.88 specificity. Similarly, in a setting without measurements of IL-6 level, model 3 could be used, increasing the predictive capacity (AUROCC = 0.91) with 0.81 sensitivity and 0.88 specificity. The already published scores of patients with COVID-19 do not include IL-6 level; however, we have provided data supporting the potential relevance of this cytokine in prognosis and personalized treatment.
The potential limitations of this study include a relatively low number of deceased patients for developing the mortality risk model from a single enter. In addition, patients with measurements of IL-6 level were selected for inclusion in the cohort, which might have biased the cohort toward a younger median age. Finally, laboratory tests were performed not at time of admission but rather with a median delay of 2 days after hospitalization, and this may have limited the predictive capacity of the model. Validation of these results in other cohorts and at hospital admission is needed.
The COVID-19 pandemic has posed an enormous challenge for health care professionals and the medical systems worldwide. We have developed a risk model that could allow early identification of patients at high risk of a fatal outcome. The early identification of prognostic factors and patient groups at high risk of COVID-19 mortality could contribute to guiding medical decisions, planning for hospital resources (including intensive care), and reducing the fatality rate of this new infection.
COR+12 calculator instructions
Go to https://utrero-rico.shinyapps.io/COR12_Score/. Introduce the following 5 parameters: SpO2/FiO2 ratio, N/L ratio, LDH level (U/L), IL-6 level (pg/mL), and age (in years). Click the Predict button. The probability of death will appear in the graph, represented as a square with its 95% CI. By positioning the mouse over the square, the specific values for each patient can be visualized. For any issues regarding use of the COR+12 calculator, please contact R.L.G. at the e-mail address rociolagunagoya@gmail.com.
Clinical implications.
This model provides a quantifiable risk of fatal outcome in patients with COVID-19, including patients without respiratory distress at the time of evaluation, which can help guide medical decisions.
Footnotes
Supported by the Instituto de Salud Carlos III, Spanish Ministry of Science and Innovation (COVID-19 research call COV20/00181), and cofinanced by the European Development Regional Fund A Way to Achieve Europe, Operative Program Intelligent Growth 2014-2020. R.L.G. and O.C.M. each hold a Rio Hortega research contract (CM19/00120 and CM19/00092, respectively). P.T. holds a Juan Rodes research contract (JR19/00049), and M.F.R. holds a Miguel Servet research contract (CP18/00073), all from the Instituto de Salud Carlos III, Spanish Ministry of Science and Innovation. The funder of this study had no role in the study design, data collection, data analysis, interpretation of the data, or writing of the report. R.L.G. had full access to all the data and final responsibility to submit for publication. A.U.R. also had access to all the raw data.
Disclosure of potential conflict of interest: The authors declare that they have no relevant conflicts of interest.
Appendix
Fig E3.
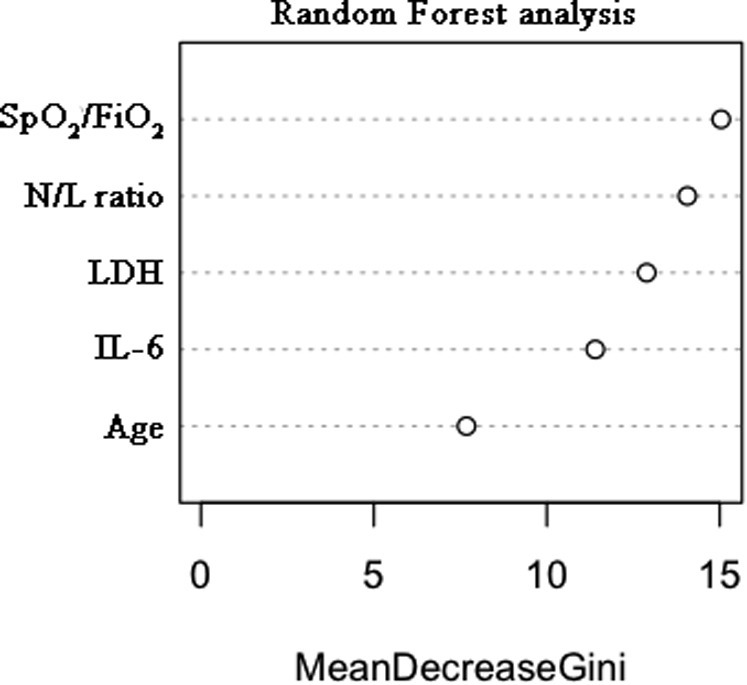
Determination of the importance of each significant variable in the multivariate logistic regression by random forest analysis. The relative weights of each variable, from highest to lowest, were as follows: SpO2/FiO2 ratio, N/L ratio, LDH level, IL-6 level, and age.
Table E1.
β-Coefficients of sequential regression models for mortality prediction in COVID-19
| Model | Intercept | SpO2/FiO2 ratio | N/L ratio | LDH level | IL-6 level | Age |
|---|---|---|---|---|---|---|
| 1 | 0.8415 | –0.0136 | — | — | — | — |
| 2 | –0.3353 | –0.0121 | 0.0660 | — | — | — |
| 3 | –2.2212 | –0.0103 | 0.0604 | 0.0034 | — | — |
| 4 | –3.2413 | –0.0091 | 0.0675 | 0.0038 | 0.0046 | — |
| 5 | –7.6991 | –0.0076 | 0.0547 | 0.0046 | 0.0043 | 0.0682 |
Table E2.
Internal validation of the model by bootstrapping
| Risk model | Optimism | Optimism-adjusted | |
|---|---|---|---|
| AUROCC | 0.944 | 0.017 | 0.927 |
| Calibration intercept | 0.000 | 0.121 | –0.121 |
| Calibration slope | 1.000 | 0.096 | 0.904 |
Table E3.
Mortality score in the 36 deceased patients and clinical characteristics of the patients who had a low mortality risk score but died
| Initial respiratory function | High score | Low score | No score available | Characteristics of the deceased patients with a low score |
|---|---|---|---|---|
| No ARDS (n = 4) | 2 | 1 | 1 | Kidney transplantation, hypertension, dyslipidemia, previous thromboembolic event, smoking |
| Mild ARDS (n = 4) | 3 | 1 | — | No comorbidities |
| Moderate ARDS (n = 4) | 3 | 1 | — | Hypertension, dyslipidemia, obesity, benign prostatic hyperplasia, steatosis |
| Severe ARDS n = 24) | 21 | 1 | 2 | HIV-HCV coinfection |
HCV, Hepatitis C virus.
References
- 1.Zhu N., Zhang D., Wang W., Li X., Yang B., Song J. A novel Coronavirus from patients with pneumonia in China, 2019. N Engl J Med. 2020;382:727–733. doi: 10.1056/NEJMoa2001017. [DOI] [PMC free article] [PubMed] [Google Scholar]
- 2.Johns Hopkins University: Coronavirus Resource Center. https://coronavirus.jhu.edu/ Available at:
- 3.Wu Z., McGoogan J.M. Characteristics of and important lessons from the Coronavirus disease 2019 (COVID-19) outbreak in China: summary of a report of 72314 cases from the Chinese Center for Disease Control and Prevention. JAMA. 2020;323:1239–1242. doi: 10.1001/jama.2020.2648. [DOI] [PubMed] [Google Scholar]
- 4.Zhou F., Yu T., Du R., Fan G., Liu Y., Liu Z. Clinical course and risk factors for mortality of adult inpatients with COVID-19 in Wuhan, China: a retrospective cohort study. Lancet. 2020;395:1054–1062. doi: 10.1016/S0140-6736(20)30566-3. [DOI] [PMC free article] [PubMed] [Google Scholar]
- 5.Wang K, Zuo P, Liu Y, Zhang M, Zhao X, Xie S, et al. Clinical and laboratory predictors of in-hospital mortality in patients with COVID-19: a cohort study in Wuhan, China. Clin Infect Dis [Published online May 2020]. https://doi.org/10.1093/cid/ciaa538. [DOI] [PMC free article] [PubMed]
- 6.Richardson S., Hirsch J.S., Narasimhan M., Crawford J.M., McGinn T., Davidson K.W. Presenting characteristics, comorbidities, and outcomes among 5700 patients hospitalized with COVID-19 in the New York City area. JAMA. 2020;323:2052–2059. doi: 10.1001/jama.2020.6775. [DOI] [PMC free article] [PubMed] [Google Scholar]
- 7.Yang X., Yu Y., Xu J., Shu H., Xia J., Liu H. Clinical course and outcomes of critically ill patients with SARS-CoV-2 pneumonia in Wuhan, China: a single-centered, retrospective, observational study. Lancet Respir Med. 2020;8:475–481. doi: 10.1016/S2213-2600(20)30079-5. [DOI] [PMC free article] [PubMed] [Google Scholar]
- 8.Huang C., Wang Y., Li X., Ren L., Zhao J., Hu Y. Clinical features of patients infected with 2019 novel Coronavirus in Wuhan, China. Lancet. 2020;395:497–506. doi: 10.1016/S0140-6736(20)30183-5. [DOI] [PMC free article] [PubMed] [Google Scholar]
- 9.Zhang J., Yu M., Tong S., Liu L.Y., Tang L.V. Predictive factors for disease progression in hospitalized patients with Coronavirus disease 2019 in Wuhan, China. J Clin Virol. 2020;127 doi: 10.1016/j.jcv.2020.104392. [DOI] [PMC free article] [PubMed] [Google Scholar]
- 10.Chen G., Wu D., Guo W., Cao Y., Huang D., Wang H. Clinical and immunological features of severe and moderate Coronavirus disease 2019. J Clin Invest. 2020;130:2620–2629. doi: 10.1172/JCI137244. [DOI] [PMC free article] [PubMed] [Google Scholar]
- 11.Blanco-Melo D., Nilsson-Payant B.E., Liu W.C., Uhl S., Hoagland D., Moller R. Imbalanced host response to SARS-CoV-2 drives development of COVID-19. Cell. 2020;181:1036–1045. doi: 10.1016/j.cell.2020.04.026. [DOI] [PMC free article] [PubMed] [Google Scholar]
- 12.Rice T.W., Wheeler A.P., Bernard G.R., Hayden D.L., Schoenfeld D.A., Ware L.B. Comparison of the SpO2/FIO2 ratio and the PaO2/FIO2 ratio in patients with acute lung injury or ARDS. Chest. 2007;132:410–417. doi: 10.1378/chest.07-0617. [DOI] [PubMed] [Google Scholar]
- 13.Ranieri V.M., Rubenfeld G.D., Thompson B.T., Ferguson N.D., Caldwell E., Fan E. Acute respiratory distress syndrome: the Berlin Definition. JAMA. 2012;307:2526–2533. doi: 10.1001/jama.2012.5669. [DOI] [PubMed] [Google Scholar]
- 14.Moons K.G., Altman D.G., Reitsma J.B., Collins G.S. New guideline for the reporting of studies developing, validating, or updating a multivariable clinical prediction model: The TRIPOD Statement. Adv Anat Pathol. 2015;22:303–305. doi: 10.1097/PAP.0000000000000072. [DOI] [PubMed] [Google Scholar]
- 15.Liang W, Liang H, Ou L, Chen B, Chen A, Li C, et al. Development and validation of a clinical risk score to predict the occurrence of critical illness in hospitalized patients with COVID-19. JAMA Intern Med [Published online May 12, 2020]. https://doi.org/10.1001/jamainternmed.2020.2033. [DOI] [PMC free article] [PubMed]
- 16.Zou X., Li S., Fang M., Hu M., Bian Y., Ling J. Acute Physiology and Chronic Health Evaluation II score as a predictor of hospital mortality in patients of Coronavirus disease 2019. Crit Care Med. 2020;48:e657–e665. doi: 10.1097/CCM.0000000000004411. [DOI] [PMC free article] [PubMed] [Google Scholar]
- 17.Yan L., Zhang H., Goncalves J. An interpretable mortality prediction model for COVID-19 patients. Nat Mach Intell. 2020:283–288. [Google Scholar]
- 18.Zumla A., Hui D.S., Azhar E.I., Memish Z.A., Maeurer M. Reducing mortality from 2019-nCoV: host-directed therapies should be an option. Lancet. 2020;395:e35–e36. doi: 10.1016/S0140-6736(20)30305-6. [DOI] [PMC free article] [PubMed] [Google Scholar]
- 19.Fernandez-Ruiz M L-MF, Perez-Jacoiste MA, et al. Tocilizumab for the treatment of adult patients with severe COVID-19 pneumonia: a single-center cohort study. J Med Virol [Published online July 16, 2020]. https://doi.org/10.1002/jmv.26308. [DOI] [PMC free article] [PubMed]
- 20.Herold T., Jurinovic V., Arnreich C., Lipworth B.J., Hellmuth J.C., Bergwelt-Baildon M.V. Elevated levels of IL-6 and CRP predict the need for mechanical ventilation in COVID-19. J Allergy Clin Immunol. 2020;146:128–136.e4. doi: 10.1016/j.jaci.2020.05.008. [DOI] [PMC free article] [PubMed] [Google Scholar]
- 21.Aziz M, Fatima R, Assaly R. Elevated interleukin-6 and severe COVID-19: a meta-analysis. J Med Virol [Published online April 28, 2020]. https://doi.org/10.1002/jmv.25948. [DOI] [PMC free article] [PubMed]
- 22.Zheng H.Y., Zhang M., Yang C.X., Zhang N., Wang X.C., Yang X.P. Elevated exhaustion levels and reduced functional diversity of T cells in peripheral blood may predict severe progression in COVID-19 patients. Cell Mol Immunol. 2020;17:541–543. doi: 10.1038/s41423-020-0401-3. [DOI] [PMC free article] [PubMed] [Google Scholar]
- 23.Bime C., Casanova N., Oita R.C., Ndukum J., Lynn H., Camp S.M. Development of a biomarker mortality risk model in acute respiratory distress syndrome. Crit Care. 2019;23:410. doi: 10.1186/s13054-019-2697-x. [DOI] [PMC free article] [PubMed] [Google Scholar]
- 24.Xu X., Han M., Li T., Sun W., Wang D., Fu B. Effective treatment of severe COVID-19 patients with tocilizumab. Proc Natl Acad Sci U S A. 2020;117:10970–10975. doi: 10.1073/pnas.2005615117. [DOI] [PMC free article] [PubMed] [Google Scholar]
- 25.Sciascia S., Apra F., Baffa A., Baldovino S., Boaro D., Boero R. Pilot prospective open, single-arm multicentre study on off-label use of tocilizumab in patients with severe COVID-19. Clin Exp Rheumatol. 2020;38:529–532. [PubMed] [Google Scholar]
- 26.Klopfenstein T., Zayet S., Lohse A., Balblanc J.C., Badie J., Royer P.Y. Tocilizumab therapy reduced intensive care unit admissions and/or mortality in COVID-19 patients. Med Mal Infect. 2020;50:397–400. doi: 10.1016/j.medmal.2020.05.001. [DOI] [PMC free article] [PubMed] [Google Scholar]
- 27.Huet T.B.H., Voisin O., Jouveshomme S., Dauriat G., Lazareth I., Sacco E. Anakinra for severe forms of COVID-19: a cohort study. Lancet Rheumatol. 2020;2:E393–E400. doi: 10.1016/S2665-9913(20)30164-8. [DOI] [PMC free article] [PubMed] [Google Scholar]
- 28.Lei F, Liu YM, Zhou F, Qin JJ, Zhang P, Zhu L, et al. Longitudinal association between markers of liver injury and mortality in COVID-19 in China. Hepatology [Published online May 2, 2020]. https://doi.org/10.1002/hep.31301. [DOI] [PMC free article] [PubMed]