Abstract
The ability to recognize and interact with members of the same species is essential for social communication. Investigating the neural substrates of social interest and recognition may offer insights into the behavioral differences present in disorders affecting social behavior. Assays used to study social interest in rodents include the 3-chamber test, a partition test, and a social interaction test. Here, we present a single protocol that can be used to quantify the level of social interest displayed by mice, the ability to distinguish between different individual mice (social recognition), and the level of repetitive self-grooming displayed. In the first part of the protocol, a social habituation/dishabituation test, the time spent by a test mouse sniffing a stimulus mouse is quantified over 9 trials. In the first 8 interactions, the same stimulus mouse is used repeatedly; on the ninth trial, a novel stimulus mouse is presented. Intact social recognition is indicated by a progressive decrease in the investigation time over trials 1-8, and an increase in trial 9. The interval between each social trial is used to quantify self-grooming, a stereotyped repetitive behavior in mice. We also present a method for randomized, blinded analysis of these behaviors to increase rigor and reproducibility of results. Therefore, this single behavioral test enables ready assessment of phenotypes of both social and repetitive behaviors in an integrated manner in the same animals. This feature can be advantageous in understanding interactions between these behaviors and phenotypes in mouse models with genetic variants associated with autism and other neurodevelopmental or neuropsychiatric disorders, which are often characterized by these behavioral differences.
Keywords: Behavior, Habituation, Dishabituation, Grooming, Blinded analysis, Social interest, Social recognition
Background
Verbal and nonverbal communications enhance an organism’s ability to establish and maintain a social hierarchy, and thus survive and reproduce. These forms of communication rely on the motivation to interact with fellow conspecifics and the ability to recognize and distinguish between different individuals. In humans, disorders that are commonly characterized by altered social behavior include depression, anxiety, and autism (Saunders and Roy, 1999; White et al., 2009 ). Although there is a general understanding of symptoms, the etiologies of these disorders, particularly the underlying mechanisms of social impairments and differences, remain unclear (Goldstein and Rosselli, 2003).
Mice offer advantageous models for studying the neurobiology of behavior through similarities to certain aspects of human behavior and physiology ( Austin et al., 2004 ; Cryan and Holmes, 2005). Although a mouse model will not perfectly replicate human disease, overall symptoms can apply when investigating theories regarding genetic or environmental modulation (Crawley, 2007). For example, much of the current preclinical autism research revolves around the diagnostic criteria of abnormal social interaction, impaired social communication and interaction, and repetitive behaviors ( Silverman et al., 2010 ).
A social habituation/dishabituation test enables measurement of two components of rodent social behavior: 1) the interest in a familiar social stimulus shown repeatedly over a short period of time; and 2) the ability to recognize a new social stimulus (Tejada and Rissman, 2012; Ujjainwala et al., 2018 ). In this paradigm, the mouse used to provide a social stimulus is placed under a wire cup to confine it to a fixed location and to physically separate it from the mouse whose behavior is being examined (“test mouse”). Interest is measured by the amount of time the test mouse spends exploring the stimulus mouse under the wire cup, typically quantified through sniffing. This paradigm can be used to investigate biological and environmental influences on social interest and/or social recognition. For example, our group recently reported that mice genetically deficient for the diazepam binding inhibitor (DBI) protein show a significant reduction in social interest compared to wild-type littermates, with no deficit in social recognition ( Ujjainwala et al., 2018 ). Furthermore, rodents often show sex differences in social interest levels (Tejada and Rissman, 2012; Karlsson et al., 2015 ), and sex steroid hormones, such as testosterone and estradiol, affect social exploratory behavior. Variations of this protocol have also been used to examine the loss of the oxytocin gene as well as lesions to the CA2 region of the hippocampus and their effect on social recognition ( Ferguson et al., 2000 ; Stevenson and Caldwell, 2014). In addition, this test could be applied to further evaluate the impacts of other environmental and behavioral factors, such as social isolation or gestational exposure to bisphenol A ( Wolstenholme et al., 2012 ; Lander et al., 2017 ).
Restricted repetitive behaviors are most often associated with autism in humans, but these behaviors are also present in other disorders such as Rett, Fragile X, and Prader-Willi syndromes (Lewis and Kim, 2009; Crawley, 2007; McFarlane et al., 2008 ). In mice, this phenotype can present in numerous forms, including repetitive grooming, circling, jumping, or other stereotypical movements (Crawley, 2007). Given the overlap between impaired social interaction and repetitive behaviors in these and other neuropsychiatric and neurodevelopmental disorders, a single protocol that enables ready and integrated assessment of multiple phenotypes is advantageous.
Another paradigm commonly used to study social interest and recognition in mice is the 3-chamber test. This test requires a specialized apparatus containing multiple chambers separated by removable doors. This configuration is of higher novelty to a mouse than an environment that mirrors the home cage, potentially inducing higher levels of general exploratory behavior rather than social interaction specifically ( Yang et al., 2011 ). By contrast, the test described in this protocol can be performed in a standard mouse cage used for daily housing in many laboratories. The other materials required can be obtained readily at a low cost.
Blinded analyses significantly enhance experimental rigor, especially regarding manual scoring of behavior, where pre-conceptions may lead to biased evaluation. For any given study, requiring separate researchers to either conduct experiments or perform analyses is not always feasible and can lead to differences in interpretation. Here, we provide a method to randomly code, name, and sort files using Excel. This method allows for one person to conduct the behavioral test and then score the videos in a blinded fashion. This process could be used to anonymize other file types for blinded analysis as well.
Materials and Reagents
Chrome Round Pencil Holder (Spectrum Diversified, catalog number: 31570, diameter of 10.2 cm, distance between bars of 0.64 cm, initial height of 10.8 cm)
400 ml plastic beaker
Post-pubertal male or female test mice of any strain
-
2 stimulus mice (e.g., ovariectomized adult female mice)
Note: For this procedure, at least two stimulus mice are needed. Ensure both stimulus mice are of the same sex and age, and that both have had no prior contact with any of the test mice (i.e., not littermates). Stimulus mice can be either males or females as they are physically separated during the test with the cup. Commonly, ovariectomized females are used to provide neutral stimuli to quantify social interest without provoking aggressive or sexual responses. Consult with local animal care committee guidelines regarding ovariectomy surgeries if needed.
Ethyl Alcohol 70%
Deionized (DI) water
Equipment
MiliporeSigma Synergy Ultrapure Water Purification System (MiliporeSigma, model: SYNSOHFUS)
Windows PC computer
-
Video Camera (Logitech Webcam C930e, 90° field of view, 1920 x 1080 pixels)
Note: Any camera with similar specifications that can visualize that entire cage can be used for this protocol.
Testing chamber (bottom and filter top of standard mouse cage can be used with the dimensions of 29.3 cm x 17.1 cm x 12.7 cm for the base, and a total height of 20.3 cm with the lid placed on top)
Corn Cob Bedding (use the same type of bedding as in the home cage)
Software
iSpy (freeware open-source video surveillance platform available at www.ispyconnect.com)
Microsoft Excel
Statistics software, such as SAS
Procedure
-
Setup of clean testing chamber and wire cup
Line a clean mouse cage bottom with new bedding to a depth of 1-2 cm. The cage used should be equivalent to the type typically used for housing. Food and water should not be present in the testing chamber.
-
Clean a wire cup with 70% EtOH, followed by DI water, ensuring it is completely cleaned and dry before placement in the testing chamber. The wire cup should have a diameter and height large enough to accommodate one mouse.
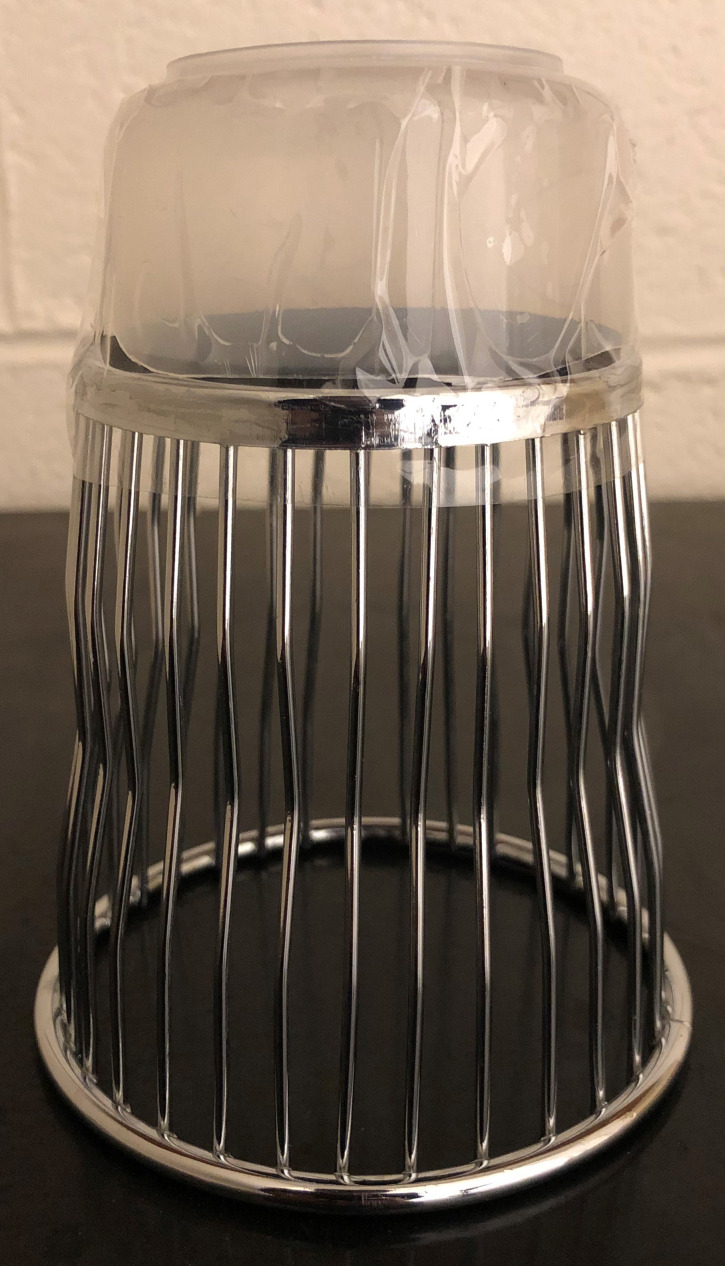
Note: If the wire cup is not tall enough to prevent the mouse from climbing and perching on top, extend the height of the wire cup by affixing the bottom of a 400 ml plastic beaker to the underside of the wired cup with glue or tape, as shown in the Figure 1. An overall cup height of > 14 cm should prevent most mice from perching on the top of the cup.
The testing area should be isolated from other laboratory activity. If a separate room is not available, isolate the testing area by hanging opaque sheets around it and keep the room as quiet as possible to minimize disruption.
Within the testing area, the lights should be dim, and there should not be any bright light directly above, as light level can influence exploratory behaviors in mice (Morato and Castrechini, 1989). Use a light level (approximately 3-6 lux) sufficient to visualize the entire cage and the test mouse through the video camera. This illumination can be achieved through indirect light.
-
Setup of camera and computer for video recording
Position camera to ensure it captures the entire area of the testing chamber. The camera should be placed perpendicular to the long end of the cage. The camera should be close enough for detailed quantification, but far enough away that the entire cage can be visualized (Figure 2).
Connect the camera to the video software iSpy.
Edit the camera settings to set the recording time to 610 s (10 min plus 10 s), the max frame rate to 10 FPS, and the buffer time to 2 s. Each trial is 10 min long; the additional 10 s are used to place the stimulus mouse within the cup.
-
Acclimatization of mice to testing room and chamber
Bring stimulus and test mice to the testing room in their respective home cages. During transport, cages should be individually covered by opaque cloths or dark plastic bags. Keep mice in home cages until ready for individual acclimatization to the testing chamber. Cages holding stimulus mice and test mice should be placed at least 1.5 m away from each other to prevent any interaction prior to the test.
Place one test mouse in a fresh testing chamber and place the chamber within the enclosed testing area for 30 min. (This habituation period will not be analyzed, so video recording during this period is optional.)
Separate stimulus mice to individual clean cages kept outside of the enclosed area for 30 min.
Following the test mouse’s 30-min habituation to the testing chamber, place an inverted wire cup in the middle of the right half of the testing chamber (Figure 3). The stimulus mouse should be able to explore the entire cup perimeter.
-
Allow the mouse to explore the cup for 10 min.
Note: This exploration period will not be analyzed, so video recording during this period is optional.
-
Habituation test trials (Trials 1-8)
Begin video recording
Lift one side of the cup and gently place stimulus mouse #1 underneath (Figure 4). Complete placement underneath the cup within 10 s.
Immediately start a stopwatch or use a clock to time 1 min. Note the time of day in a lab notebook. An example worksheet that can be used for this purpose is provided as Supplemental File 1.
After 1 min, quickly remove the stimulus mouse from the wire cup and place back in its individual cage.
Allow the test mouse to explore the testing chamber and empty wire cup for the remaining 9 min. This marks the end of the first trial.
Repeat Steps D1-D5 until 8 trials have been completed, using stimulus mouse #1 for each trial.
-
Dishabituation test trial (Trial 9)
-
After completion of the 8th trial, repeat Steps D2-D4 using stimulus mouse #2 (Figure 5). This marks the end of the 9th trial and the end of testing.
Note: If testing another mouse immediately after, clean the wire cup and the sides of the cage with 70% EtOH followed by DI Water, wipe dry with a paper towel, and replace the bedding. When testing for a given day is completed, stimulus mice can be returned together to their home cage, if housed together prior to testing.
-
-
Video Coding for Blinded Analysis
Each 90-min testing period is recorded as 9 separate 10-min video recordings.
Create an Excel spreadsheet (Figure 6A)
In the first column (e.g., Column A), type the original names for the files (e.g., CageId-Trial#), such that each row represents one trial.
In the second column (e.g., Column B), type the following code into the function tab above the Excel cells: =CHAR(RANDBETWEEN(65,90))andCHAR(RANDBETWEEN(65,90))andRANDBETWEEN(10,99)
Use the corner of the bottom right of the cell and drag it down to assign that function to all the rows to create a key.
Highlight the codes and copy them. Right-click in the first cell of the column to the right (e.g., Column C), select “Paste Special,” and select “Paste Values” (Figure 6B). (If “Paste Values” is not used, the values generated by the code will continue to change anytime a change is made in the spreadsheet.)
-
Rename the files according to the corresponding codes. Sort files alphabetically by file name to shuffle the files out of order (Figure 6C). Follow the alphabetical order of coded file names during analysis.
Note: When renaming files for blinded analysis, make sure to have an alternate way of identifying the video. For example, videos recorded in iSpy have the time in the corner of the image, which can serve as back-up identification. When running the behavioral tests, note the times of each trial in a notebook in case a file is misnamed.
Once blinded analysis is complete, refer to the key created In the Excel sheet to match the code-named file to the respective mouse and trial.
Figure 1. Example of extended stimulus cup.
To prevent the mouse from climbing on top, the height of the cup can be extended by attaching the bottom of a 400 ml plastic beaker. This cup is extended by 3.75 cm to a total height of 14.6 cm. A height of at least 14 cm is typically sufficient to prevent a mouse from perching on top.
Figure 2. Testing area setup including testing chamber, camera, stimulus cup, and opaque sheets for light control.
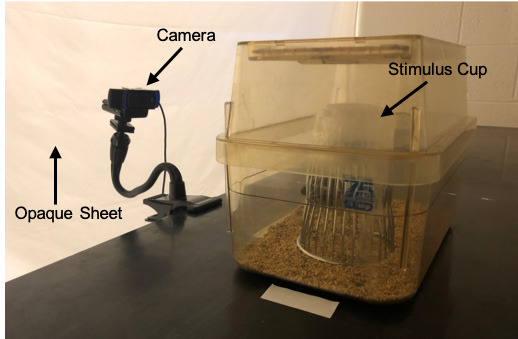
In this setup, the lights directly over the cage are turned off, so the light in the testing area comes from the other side of the opaque sheets. Laboratory tape is placed on the bench to indicate consistent placement of the cage.
Figure 3. Placement of stimulus cup with testing apparatus.
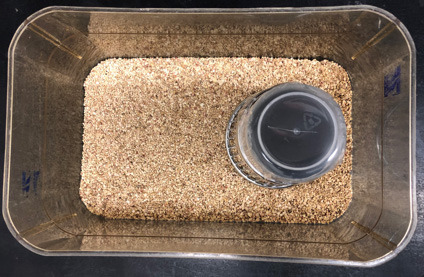
Figure 4. Placement of stimulus mouse under wired cup.
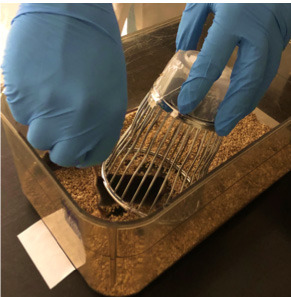
Figure 5. Timeline of protocol.
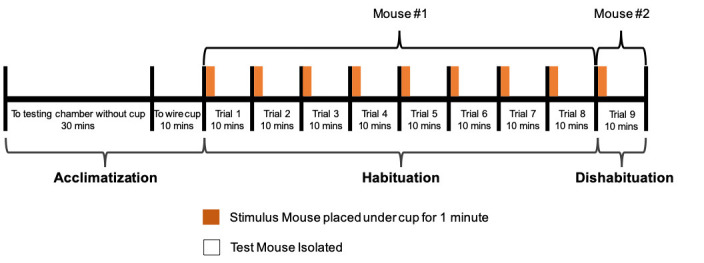
Figure 6. Example of random file naming/coding on Excel and sample blinding file.

A. The “key” is created in Excel by listing the original file names in Column A. The function is added to the adjacent column to produce the randomized “blinding” names. B. After copying the names and selecting “Paste Special: Values”, the key is complete and will not change. From there, the respective file names are renamed with this randomized 4-digit name. C. Finally, the files are sorted alphabetically by 4-digit name. When scoring the videos, follow this alphabetized order to shuffle the videos for blinded analyses.
Data analysis
Quantification of social interaction
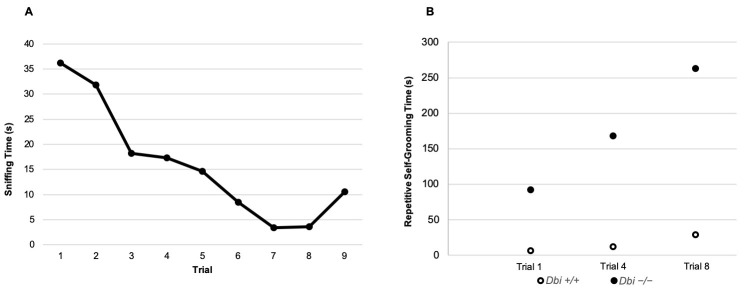
Social interaction can be quantified with a stopwatch. Interaction is defined as direct contact of the test mouse’s nose to the cup or stimulus mouse, or position of the test mouse’s nose within 1 cm of the wire cup, with the nose facing the stimulus mouse (Figure 7). Social interaction is analyzed from the time the cage top is placed on the cage to 1 min after. Evaluate and score 1 full minute with a stopwatch for each trial. Plot the data as shown in Figure 8A.
Figure 7. Mouse engaging in “social interaction”.

In the image on the left, the test mouse is away from the cup and its nose is not within 1 cm of it. This behavior would not be counted as sniffing time. In the image on the right, the test mouse’s nose is making direct contact with the cup and facing toward the cup; this behavior is thus included in the sniffing time.
Figure 8. Example data from a habituation/dishabituation test.
A. The social interest (sniffing time) of the test mouse (n = 1) decreases over the first 8 trials and increases for the 9th trial when the novel mouse is introduced. B. Repetitive self-grooming times in the 1st, 4th, and 8th trials. This example illustrates representative Dbi+/+ and Dbi-/- mice (n = 1 each). Full comparisons between these genotypes are presented in Ujjainwala et al., 2018 .
Repetitive self-grooming
Repetitive self-grooming can also be scored with a stopwatch using the portions of videos covering min 2-10 of each trial. Repetitive self-grooming is defined as a period of at least 10 s spent grooming, with no more than 5 s between consecutive grooming spurts ( Silverman et al., 2010 ). For an initial analysis, record self-grooming times for min 2-10 of trials 1, 4, and 8 to assess grooming at the beginning, middle, and end of testing. Plot the data as shown in Figure 8B. The remaining trials can be analyzed for repetitive grooming time if more comprehensive quantification is desired. If removing the stimulus mouse from the testing cage is not done consistently and rapidly for every trial, a different interval, such as min 3-10, may be used.
Statistical analysis
Enter data into SAS or other statistics software.
Analyze sniffing time and repetitive grooming time (in s) using repeated measures analysis of variance (ANOVA).
Enter trial as within-subjects factor, and enter sex and genotype as between-subjects factors.
To test for differences in social interest, compare sniffing time (in s) across trials 1-9 to test for significance. In addition, compare the total sniffing time summed across trials 1-8 to test for significant differences in total levels of interest displayed toward the first stimulus mouse.
To test for differences in social recognition, compare sniffing time (in s) across trials 8 and 9 to test for significance.
To test for differences in repetitive self-grooming, compare repetitive grooming time (in s) across the intertrial intervals for which grooming was quantified.
Notes
Unless explicitly studying the effects of social isolation, all test mice should be group-housed until testing, as social isolation can lead to altered social behavior ( Lander et al., 2017 ).
Tests should be conducted at a consistent time of day. For example, our lab routinely performs these tests between 9:00 AM and 1:00 PM (relative to 7:00 PM lights off).
If possible, stimulus mice and test mice should be housed in different animal facility rooms. If that option is not available, physically separate the cages housing stimulus and test mice on a cage rack with at least one row in between. If the animal facility uses fully enclosed individually ventilated cages (IVCs), thus minimizing olfactory and pheromonal signals, separation such that there is no visual interaction is suggested.
The first time the stimulus mouse is placed under the cup should not be during an experiment. Stimulus mice tend to exhibit behaviors reflecting anxiety, such as clinging to wires of the cup or cage-biting, in response to initial exposure to the cup. Train the stimulus mice by using non-test mice prior to running experimental mice.
When transporting mice (test or stimulus) between cages, minimize the time the mouse is moved without having contact with a support surface underneath as hanging the mouse for significant time is a stressor for mice (Deacon, 2006). This support can be provided by placing the mouse on the sleeve of the investigator’s forearm covered by a clean lab coat, or placing on top of a cage lid with light restraint on the tail.
In our studies, most mice continued to show habituation (as indicated by continued decreases in sniffing time) throughout the first 8 trials. However, if the test mice show stronger habituation earlier on, the number of trials prior to the “dishabituation phase” can potentially be reduced.
If the test mouse is spending a significant amount of time in a part of the cage obscured by the wire cup, consider positioning the camera to record from a top-down view.
Cross-validation of phenotypes across multiple behavioral assays can help solidify conclusions regarding the effect of a genetic mutation or other manipulation. Therefore, it may be advisable to test mice on another assay of social interest, such as the 3-chamber test ( Yang et al., 2011 ), in addition to the social habituation/dishabituation test presented here.
Acknowledgments
We thank Dr. Emilie Rissman for helpful advice regarding the social habituation/dishabituation test procedures. This work was supported by the Brain and Behavior Research Foundation (NARSAD Young Investigator Grant 24086, C.A.C.). C.A.C. is also supported by NIH/NINDS grants R01 NS105825 and R03 NS103029. This protocol is adapted from Ujjainwala et al., 2018 .
Competing interests
The authors declare no competing interests.
Ethics
All animal protocols were approved by the Institutional Animal Care and Use Committee of the University of Illinois at Urbana-Champaign (17237).
Citation
Readers should cite both the Bio-protocol article and the original research article where this protocol was used.
References
- 1. Austin C. P., Battey J. F., Bradley A., Bucan M., Capecchi M., Collins F. S., Dove W. F., Duyk G., Dymecki S., Eppig J. T., Grieder F. B., Heintz N., Hicks G., Insel T. R., Joyner A., Koller B. H., Lloyd K. C., Magnuson T., Moore M. W., Nagy A., Pollock J. D., Roses A. D., Sands A. T., Seed B., Skarnes W. C., Snoddy J., Soriano P., Stewart D. J., Stewart F., Stillman B., Varmus H., Varticovski L., Verma I. M., Vogt T. F., von Melchner H., Witkowski J., Woychik R. P., Wurst W., Yancopoulos G. D., Young S. G. and Zambrowicz B.(2004). The knockout mouse project. Nat Genet 36(9): 921-924. [DOI] [PMC free article] [PubMed] [Google Scholar]
- 2. Crawley J. N.(2007). Mouse behavioral assays relevant to the symptoms of autism. Brain Pathol 17(4): 448-459. [DOI] [PMC free article] [PubMed] [Google Scholar]
- 3. Cryan J. F. and Holmes A.(2005). The ascent of mouse: advances in modelling human depression and anxiety. Nat Rev Drug Discov 4(9): 775-790. [DOI] [PubMed] [Google Scholar]
- 4. Deacon R. M.(2006). Housing, husbandry and handling of rodents for behavioral experiments. Nat Protoc 1(2): 936-946. [DOI] [PubMed] [Google Scholar]
- 5. Ferguson J. N., Young L. J., Hearn E. F., Matzuk M. M., Insel T. R., and Winslow J. T.(2000). Social amnesia in mice lacking the OXT gene. Nat Genet 25(3): 284-288. [DOI] [PubMed] [Google Scholar]
- 6. Goldstein B., and Rosselli F.(2003). Etiological paradigms of depression: The relationship between perceived causes, empowerment, treatment preferences, and stigma. J Ment Heal12 (6), 551-563. [Google Scholar]
- 7. Karlsson S. A., Haziri K., Hansson E., Kettunen P., and Westberg L.(2015). Effects of sex and gonadectomy on social investigation and social recognition in mice. BMC Neurosci 16: 83. [DOI] [PMC free article] [PubMed] [Google Scholar]
- 8. Lander S. S., Linder-Shacham D. and Gaisler-Salomon I.(2017). Differential effects of social isolation in adolescent and adult mice on behavior and cortical gene expression. Behav Brain Res 316: 245-254. [DOI] [PubMed] [Google Scholar]
- 9. Lewis M. and Kim S. J.(2009). The pathophysiology of restricted repetitive behavior. J Neurodev Disord 1(2): 114-132. [DOI] [PMC free article] [PubMed] [Google Scholar]
- 10. McFarlane H. G., Kusek G. K., Yang M., Phoenix J. L., Bolivar V. J. and Crawley J. N.(2008). Autism-like behavioral phenotypes in BTBR T+tf/J mice. Genes Brain Behav 7(2): 152-163. [DOI] [PubMed] [Google Scholar]
- 11. Morato S. and Castrechini P.(1989). Effects of floor surface and environmental illumination on exploratory activity in the elevated plus-maze. Braz J Med Biol Res 22(6): 707-710. [PubMed] [Google Scholar]
- 12. Saunders S. A., and Roy C.(1999). The relationship between depression, satisfaction with life, and social interest. South Pacific J Psychology 11(1): 9-15. [Google Scholar]
- 13. Silverman J. L., Yang M., Lord C. and Crawley J. N.(2010). Behavioural phenotyping assays for mouse models of autism. Nat Rev Neurosci 11(7): 490-502. [DOI] [PMC free article] [PubMed] [Google Scholar]
- 14. Stevenson E. L., and Caldwell H. K.(2014). Lesions to the CA 2 region of the hippocampus impair social memory in mice. Eur J Neurosci 40(9): 3294-3301. [DOI] [PMC free article] [PubMed] [Google Scholar]
- 15. Tejada L. D., and Rissman E. F.(2012). Sex differences in social investigation: effects of androgen receptors, hormones and test partner. J Neuroendocrinol 24(8): 1144-1153. [DOI] [PMC free article] [PubMed] [Google Scholar]
- 16. Ujjainwala A. L., Courtney C. D., Rhoads S. G., Rhodes J. S., and Christian C. A.(2018). Genetic loss of diazepam binding inhibitor in mice impairs social interest. Genes Brain Behav e12442. [DOI] [PubMed] [Google Scholar]
- 17. Wolstenholme J. T., Edwards M., Shetty S. R. J., Gatewood J. D., Taylor J. A., Rissman E. F., and Connelly J. J.(2012). Gestational exposure to bisphenol a produces transgenerational changes in behaviors and gene expression. Endocrinology 153(8): 3828-3838. [DOI] [PMC free article] [PubMed] [Google Scholar]
- 18. White S. W., Oswald D., Ollendick T., and Scahill L.(2009). Anxiety in children and adolescents with autism spectrum disorders. Clin Psychol Rev 29(3): 216-229. [DOI] [PMC free article] [PubMed] [Google Scholar]
- 19. Yang M., Silverman J. L., and Crawley J. N.(2011). Automated three‐chambered social approach task for mice. Curr Protoc Neurosci 56(1): 8-26. [DOI] [PMC free article] [PubMed] [Google Scholar]


