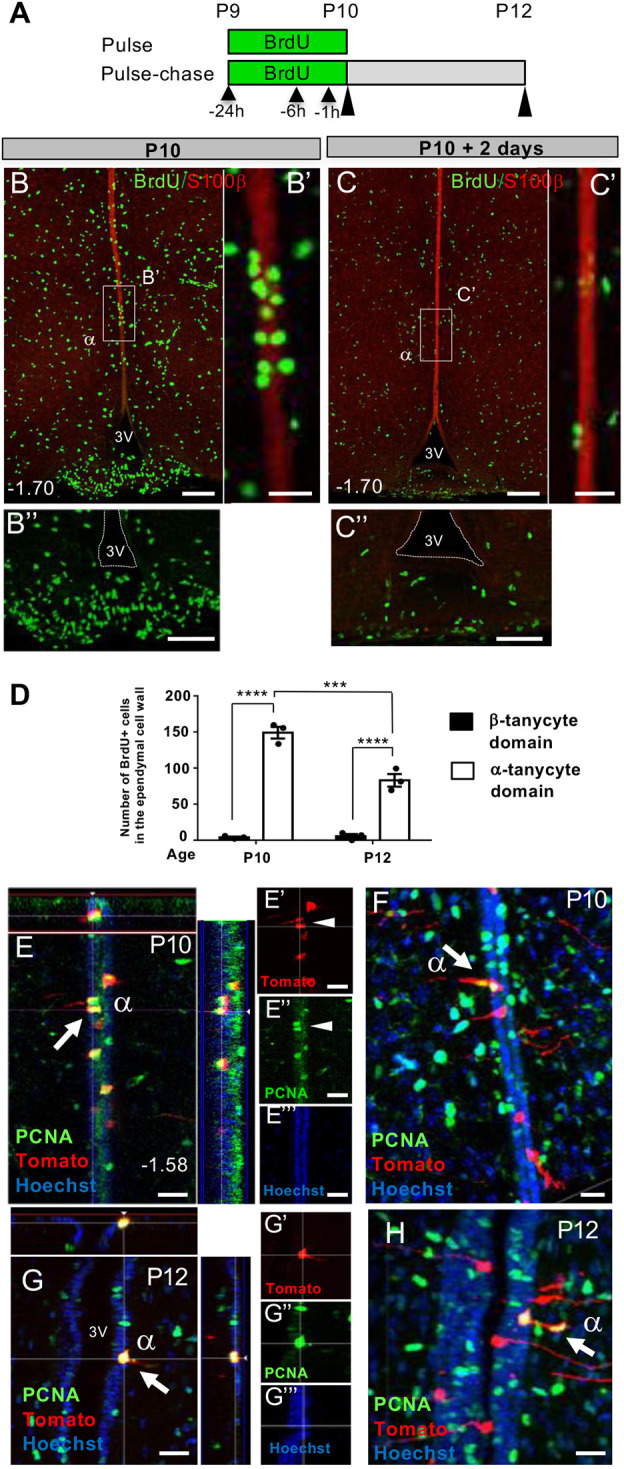
Fig. 5.

Dynamics and appearance of proliferating cells in β- and α- tanycyte cell domains. (A) Experimental paradigm consisting of three BrdU pulses between P9-P10 (black arrowheads) followed by acute (P10) or 2-day chase (P12) (black elongated arrowheads) to assess selective distribution and retention of BrdU-incorporating ependymal cells within β- versus α-tanycyte domains. (B,C″) Coronal images from comparable bregma levels showing a cluster of BrdU+ cells within the α-tanycyte S100β+ cell domain (B,B′), and their disappearance by P12 (C,C′). B″ and C″ show high power images of B and C, showing scarcity of BrdU+ ependymal cells in the β-tanycyte S100β− cell compartment. (D) Quantification of BrdU+ cells in the respective cell domains contained between bregma −1.34 and −2.54. (E-H) Examples of PCNA+/Tom+ α-tanycyte cell pairs at P10 and P12. Cells in E-G (arrow and arrowheads) show symmetric divisions, generating two ependymal daughters, whereas cells in F and H (arrowed) appear to generate at least one parenchymal daughter, suggestive of asymmetric cell division/fate. n=3 at each time point. Data are mean±s.e.m. ***P<0.001, ****P<0.0001 (two-way ANOVA followed by Tukey's test). α, α-tanycyte; 3V, third ventricle. Numbers at the bottom left of each panel indicate bregma coordinates. Scale bars: 100 µm in B,B″,C,C″; 25 µm in B′,C′,E-H.
