Abstract
Mobile monitoring is a strategy to characterize spatially and temporally variable air pollution in areas near sources. EPA’s Geospatial Measurement of Air Pollution (GMAP) vehicle – an all-electric vehicle is outfitted with a number of measurement devices to record real-time concentrations of particulate matter and gaseous pollutants – was used to map air pollution levels near the Port of Charleston in South Carolina. High-resolution monitoring was performed along driving routes near several port terminals and rail yard facilities, recording geospatial coordinates and concentrations of pollutants including black carbon, size-resolved particle count ranging from ultrafine to coarse (6 nm–20 μm), carbon monoxide, and nitrogen dioxide. Additionally, a portable meteorological station was used to characterize local conditions. The primary objective of this work was to characterize the impact of port facilities on local scale air quality. The study determined that elevated concentration measurements of black carbon and PM correlated to periods of increased port activity and a significant elevation in concentration was observed downwind of ports. However, limitations in study design prevented a more complete analysis of the port effect.
Keywords: Air quality, Mobile monitoring, Near-source, Seaport, Particulate
1. Introduction
The effect of port facilities on air quality is particularly difficult to characterize because of the inherent multimodal nature of the facilities. Emissions sources include ocean going vessels (OGV) hoteling in the terminal and in transit though shipping channels, diesel trucks and rail transporting goods to and from the port, and on-terminal equipment such as cranes and forklifts. Diesel on-terminal equipment and trucks are significant emitters of black carbon (BC) and carbon monoxide (CO) (Ault et al., 2009, Lonati et al., 2010, Dalsøren et al., 2009), while OGV sources tend to be more dominated by sulfates and organic carbon and show a much smaller BC/PM ratio (Moldanová et al., 2009).
Previous research has shown that elevated levels of these pollutants can persist several hundred meters from a traffic-related emission source (Zhou and Levy, 2007) and heavy diesel trucks servicing port facilities lead to greatly increased pollutant concentrations (Kozawa et al., 2009). Long-term exposure to these pollutants has been linked to serious health concerns such as asthma, lung cancer, and birth defects (Salam et al., 2008, HEI, 2010, Rosenbaum et al., 2010).
Due to the complexity of the port area, novel techniques must be used to assess the impact of these facilities. Improvements in high-resolution air monitoring instruments and GPS technology have helped to make near-real-time mobile monitoring an effective technique to spatially and temporally characterize air pollution in areas near sources. Continuous spatial sampling of emissions has been utilized in a number of previous studies (Crosman et al., 2017, Zwack et al., 2011, Khlystov et al., 2004). EPA’s Geospatial Measurement of Air Pollution (GMAP) vehicle, an all-electric vehicle equipped to measure highly time resolved concentrations of particulate and gaseous pollutants, has previously been utilized to map air pollution trends in near-roadway environments (Bowker et al., 2007, Baldauf et al., 2008, Hagler et al., 2010, Hagler et al., 2012).
This paper represents an effort to expand the use of the GMAP vehicle and assess its utility in near-port air quality assessment. Specifically, high-resolution measurements were performed along driving routes near several port terminals and rail yard facilities around the Port of Charleston in South Carolina. The GMAP vehicle recorded geospatial coordinates and measurements of pollutants including BC, size-resolved particle count ranging from ultrafine to coarse (6 nm–20 μm), carbon monoxide (CO), and nitrogen dioxide (NO2). A portable meteorological station was used to characterize local conditions. Port activity data were provided by the Port Authority of Charleston and include counts of ships and trucks and port service operations such as cranes and forklifts during the sampling time periods. These data are analyzed to characterize the impact of port activity on local scale air quality.
2. Experimental methods
2.1. Measurement instrumentation
EPA’s Geospatial Measurement of Air Pollution (GMAP) vehicle has been used in previous studies to perform mobile emissions monitoring near various source types such as roadways (Bowker et al., 2007, Baldauf et al., 2008, Hagler et al., 2010, Hagler et al., 2012). This paper utilizes the techniques from these studies applied to seaport facilities. In the present study, a mobile measurement campaign was conducted around the Port of Charleston in South Carolina from February 20, 2014 to March 13, 2014. Fig. 1 shows EPA’s GMAP vehicle, an all-electric converted PT Cruiser designed for driving-mode high-resolution mobile sampling along roadways. The vehicle is fully electric to avoid any self-contamination during measurement. It is outfitted with an array of on-board equipment to measure concentrations of various pollutants. Ambient air is sampled from a tube extending outside of the side of the vehicle. Measured pollutants include particulate matter, NO2, CO, CO2, and BC. Vehicle latitude, longitude, and elevation are recorded with on-board Global Positioning System (GPS). Pollutant and GPS measurements are taken continuously at a 1 Hz sampling rate. Additionally, a portable sampling station was used to capture 3D wind speed and direction. The data from the instrumentation was recorded automatically using a data logger (PC). A detailed summary of this instrumentation is found in Table 1. More information about the vehicle and instrumentation specifics can be found in Hagler et al., 2010.
Figure 1.
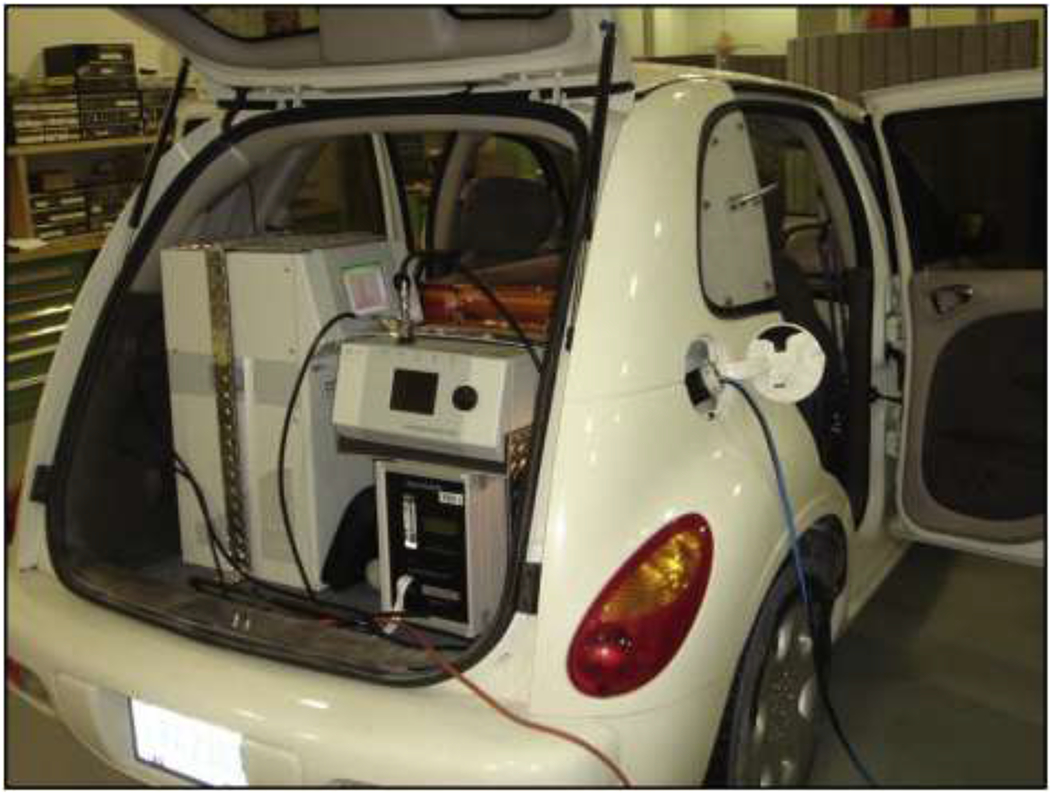
EPAs all-electric GMAP vehicle outfitted with various sampling instrumentation.
Table 1.
Port of Charleston measurement campaign mobile monitoring and stationary instrumentation.
| Measurement | Sampling Rate | Instrument | Stationary/Mobile |
|---|---|---|---|
| NO2 | 1s | Visible (450 nm) absorption Cavity Attenuated Phase Shift Spectroscopy (CAPS, Aerodyne Research, Inc., Billerica, MA, USA) | Mobile |
| Carbon monoxide (CO) | 1 s | Quantum cascade laser (QCL, Aerodyne Research, Inc., Billerica, MA, USA) | Mobile |
| Particle number concentration (size range 5.6–560 nm, 32 channels) | 1 s | Engine Exhaust Particle Sizer (EEPS, Model 3090, TSI, Inc., Shoreview, MN, USA) | Mobile |
| Particle number concentration (size range 0.5–20 μm, 52 channels) | 1 s | Aerodynamic Particle Sizer (APS, Model 3321, TSI, Inc., Shoreview, MN, USA) | Mobile |
| Black carbon | 1-5 s | Single-channel Aethalometer (Magee Scientific, AE-42, Berkeley, CA, USA) | Mobile |
| Longitude and latitude | 1 s | Global positioning system (Crescent R100, Hemisphere GPS, Scottsdale, AZ, USA) | Mobile |
| 3D wind speed and direction | 1 s | Ultrasonic anemometer (RM Young, Model, Traverse City, MI, USA) | Stationary |
2.2. Experimental design
Sampling occurred over 24 sessions. During each session, the GMAP vehicle was driven continuously along one of four pre-determined routes based on roadway access, lack of obstructions, and proximity to the facility of interest. Routes were also designed to include at least one residential neighborhood. Three of the routes were selected for their proximity to different port terminals: Wando Welch Terminal, Columbus Street/Union Pier Terminals, and Veteran’s Terminal. The final route was near the Bennett Rail Yard. While the port is the main focus of this work, a significant amount of rail activity is in service to the port, and the rail yard has a potential impact on local air quality. Fig. 2 shows the Charleston port area and the facilities of interest. Each route requires approximately 30 min to complete. Vehicle battery allowed for approximately 3–4 h of continuous sampling, allowing for multiple laps per session. Of the 24 sampling sessions, 10 were conducted at the Wando Welch terminal, 6 at the Columbus St/Union Pier terminals, 4 at Veteran’s Terminal, and 4 at the Bennett Rail Yard. Sampling was conducted at a variety of times to observe concentration levels at a variety of port activity levels. Sampling each session started at one of four times: early morning (4 a.m.), morning (9 a.m.), afternoon (1 p.m.), or evening (7 p.m.). A full accounting of sampling days and times can be found in Supplemental information.
Figure 2.
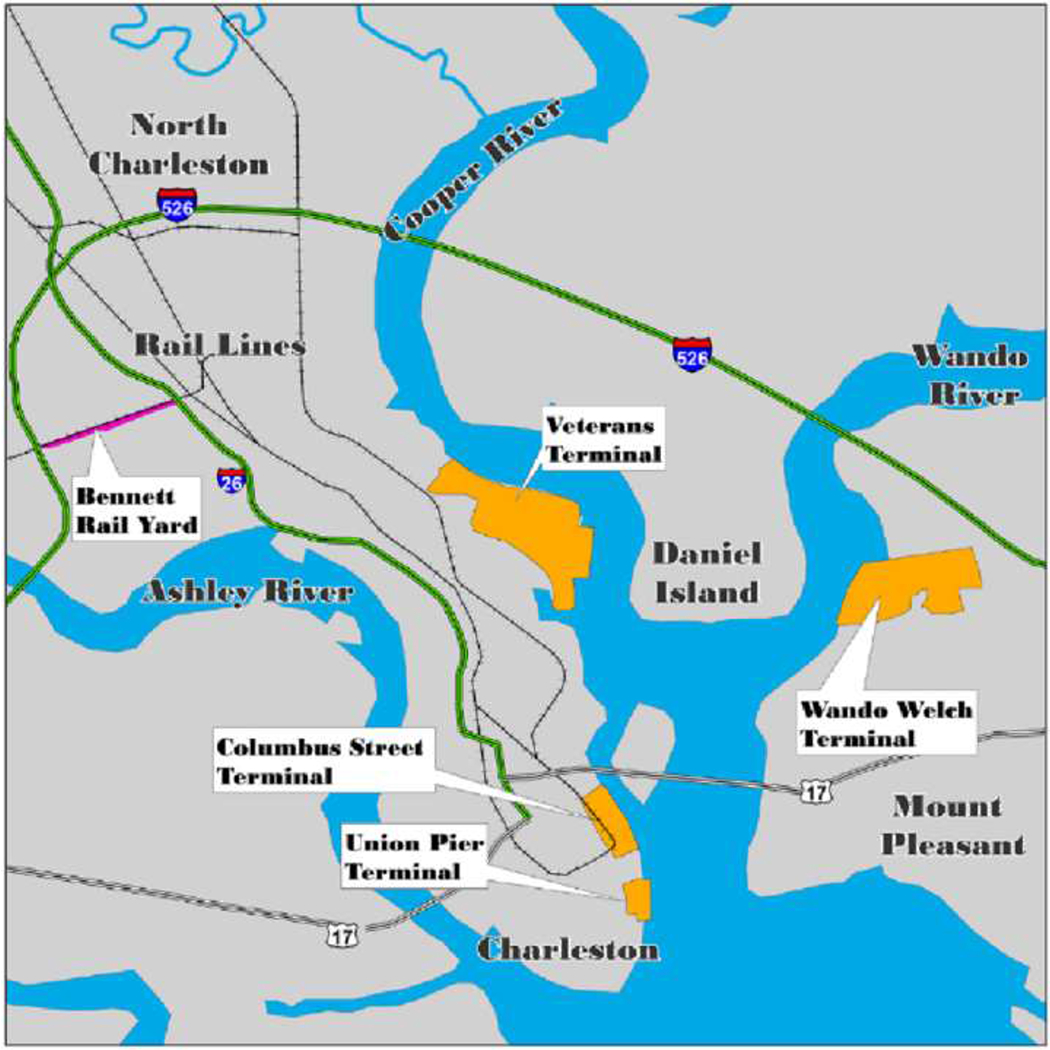
Map of the Charleston port area showing the Wando Welch terminal, the Columbus Street terminal, Veteran’s Terminal, and the Bennett Rail Yard.
Within residential neighborhoods, the vehicle driver aimed to never exceed a target speed of 35 mph with the average being significantly lower. The average recorded driving speed in neighborhood zones during the study was 15.14 mph. The vehicle was driven at highway speeds while on the highway for safety reasons.
2.3. Data processing and analysis
In this study, raw data are processed in a number of ways. Measurement data is first adjusted for travel time of pollutants through the inlet tubing. This time was determined empirically for each instrument in a controlled environment to mimic the actual measurement conditions. The recorded measurement time stamps are adjusted by this lag time. In this way, pollutant concentration and geospatial positioning data are temporally aligned. PM2.5 and PM10 concentrations were estimated from the aerodynamic particle sizer measurement bins by assuming spherical particles at 1.5 g-cm−3 density (Hagler et al., 2012). BC concentration was processed using Aethalometer Optimized Noise-reduction Algorithm (ONA) (Hagler et al., 2011).
While driving, sampling periods can be impacted by unavoidable exhaust plumes from leading vehicles, leading to measurements which are non-representative of average on-road concentration. A screening algorithm was developed (Hagler et al., 2010, Hagler et al., 2011) to identify these periods. The algorithm is designed to detect quick, large spikes in CO concentration as an indicator of vehicle exhaust. Specifically, the algorithm flags time periods where measured CO concentrations double or more within 1 s. The flagged periods were verified via visual inspection of recorded video from a front-facing hood-mounted camera. Approximately 2.5% of the data was removed in this manner. In general, removed data occurred primarily during periods of greater vehicle density such as traffic stops, and highway entrance and exit ramps. However, in general, no correlation was found between vehicle speed and measured concentration.
Measurement data is supplemented by port activity data (counts of crane activity and hoteling ships) supplied by the Port of Charleston port authority.
3. Results and discussion
3.1. Spatially and temporally averaged concentration distribution
To visualize the results, the entire set of measurements were averaged over 15 m increments. That is, all measurements within a 15 m radius of a specified latitude/longitude, spaced evenly along the driving route, were averaged together. 15 m was selected as it represents approximately the average driving distance of the vehicle per second on the highway. The spatially averaged concentrations for PM2.5 are shown in Fig. 3. Other pollutants show similar trends. It is clear that the measured concentrations are generally highest along the major roadways and highways, often by an order of magnitude or more when compared to residential areas. It is difficult to separate the contribution of the roadway from that of the port terminal or rail yard along the roadways. Furthermore, while a significant portion of highway traffic is likely attributable to port activity (e.g. heavy diesel trucks transporting cargo), it isn’t possible to reasonably estimate the actual amount. As such, further analysis will focus on measured concentration along smaller roads within residential neighborhood roads to isolate the effect of port-related activity. Fig. 4 shows wind roses during the sampling at each of the four sites for reference.
Figure 3.
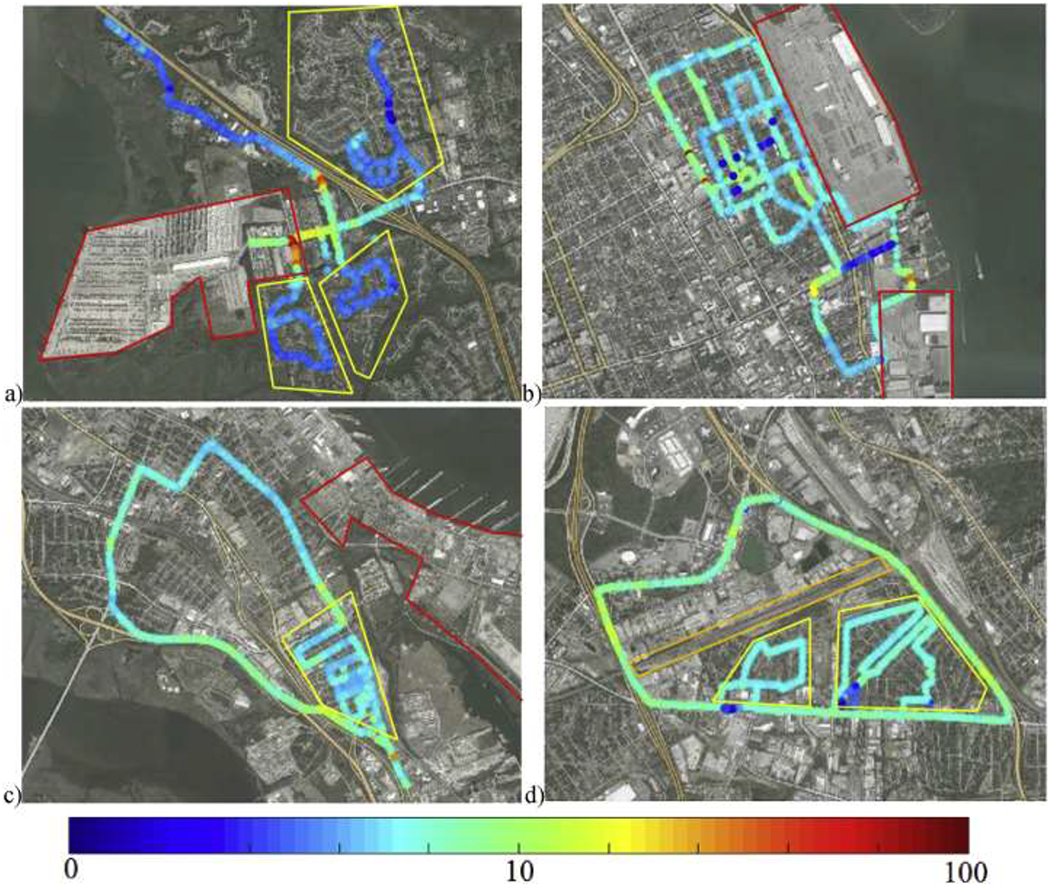
Measured PM2.5 concentrations (μg/m3) along driving routes at a) Wando Welch terminal, b) Columbus Stree/Union Pier terminals, c) Vertan’s Terminal, and d) Bennett Rail Yard. Port areas outlined in red, rail yard outlined in orange, neighborhood regions outlined in yellow.
Figure 4.
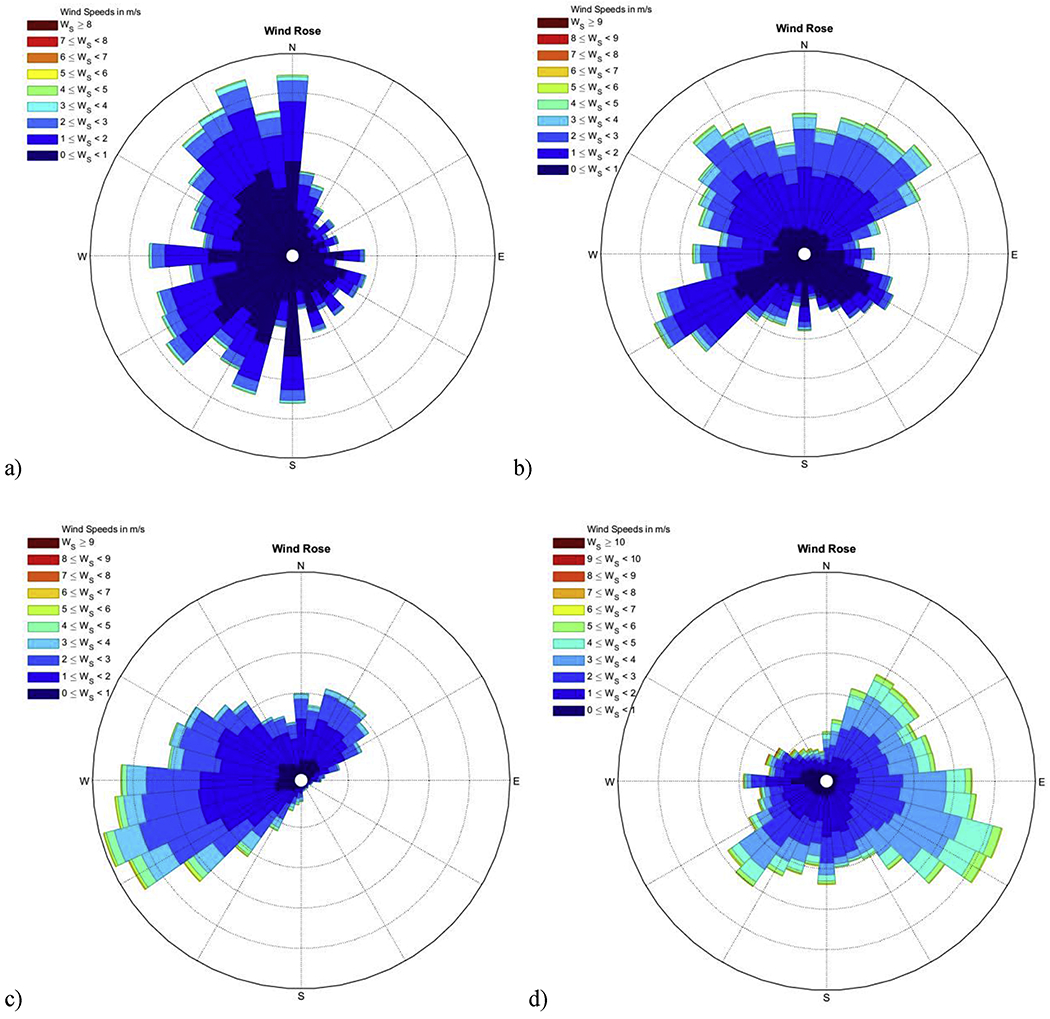
Wind rose plots showing wind speed and direction during entire measurement campaign at a) Wando Welch terminal, b) Columbus Stree/Union Pier terminals, c) Vertan’s Terminal, and d) Bennett Rail Yard.
Fig. 5 shows concentration distributions of all recorded pollutant measurements for each hour of the day at Wando Welch terminal in the neighborhood regions as depicted in Fig. 3. Wando Welch terminal is shown as it represents the most complete data set in terms of sampling at multiple times of day. In general, concentrations seem to be highest in the morning and afternoon. This may partially correlate to traffic patterns (morning and evening rush hour periods). Afternoon concentration increases may also be related to convective mixing, consistent with the general changes in atmospheric stability during morning and afternoon sampling (see Supplemental information Table S1). Much of the traffic in this area is due to trucks moving in and out of the port facility. The highest concentrations around the Wando Welch terminal are observed along the roadway leading directly into the port facility, as seen in Fig. 3a. During sampling, the GMAP driver noted that early morning had a high volume of diesel trucks moving into and out of the port, consistent with the very high concentration of BC observed during that time.
Figure 5.
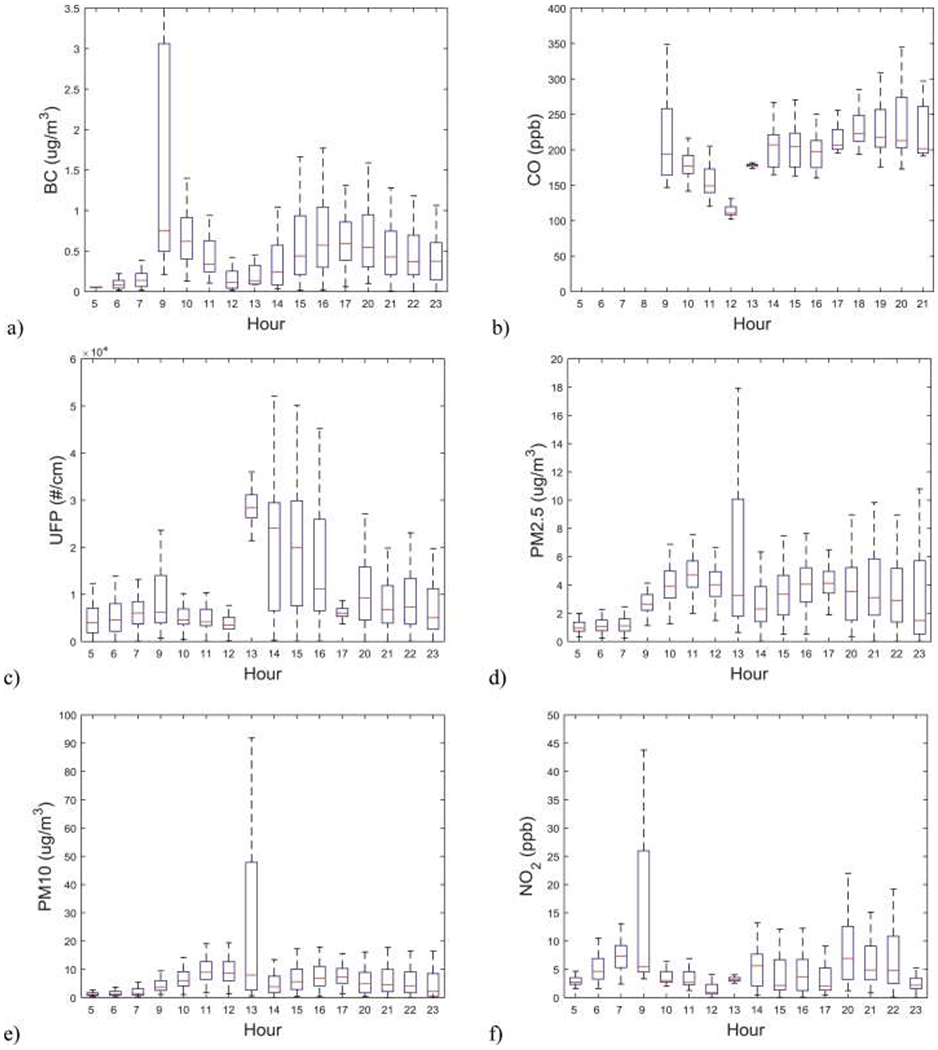
Concentration distributions at Wando Welch terminal of measured a) BC, b) CO, c) UFP d) PM2.5, e) PM10, and f) NO2. Major distribution lines show 5, 25, 50, 75, and 95 percentiles.
3.2. Background characterization and port impact
A wide range of meteorological conditions were recorded by nearby stationary sampling during the study. We were interested in isolating the effect of the port on local neighborhoods. For each neighborhood area, a local “background” concentration was defined by observing measurements during periods of time when the neighborhood was upwind of the port or rail facility. This is compared with measurements when the neighborhood is downwind. Fig. 6 shows this comparison for a) PM2.5, b) CO, c) NO2, and d) BC at each of the measurement site neighborhood locations. Comparing downwind to upwind median concentration at Wando Welch terminal shows a significant increase in observed concentrations of CO (10%), NO2 (83%) and BC (48%). Likewise, a significant increase in median concentration is observed downwind of the Bennett Rail Yard for PM2.5 (19%), CO (12%), NO2 (40%). No strong difference is observed for any pollutants at either Columbus Street or Veteran’s Terminal.
Figure 6.
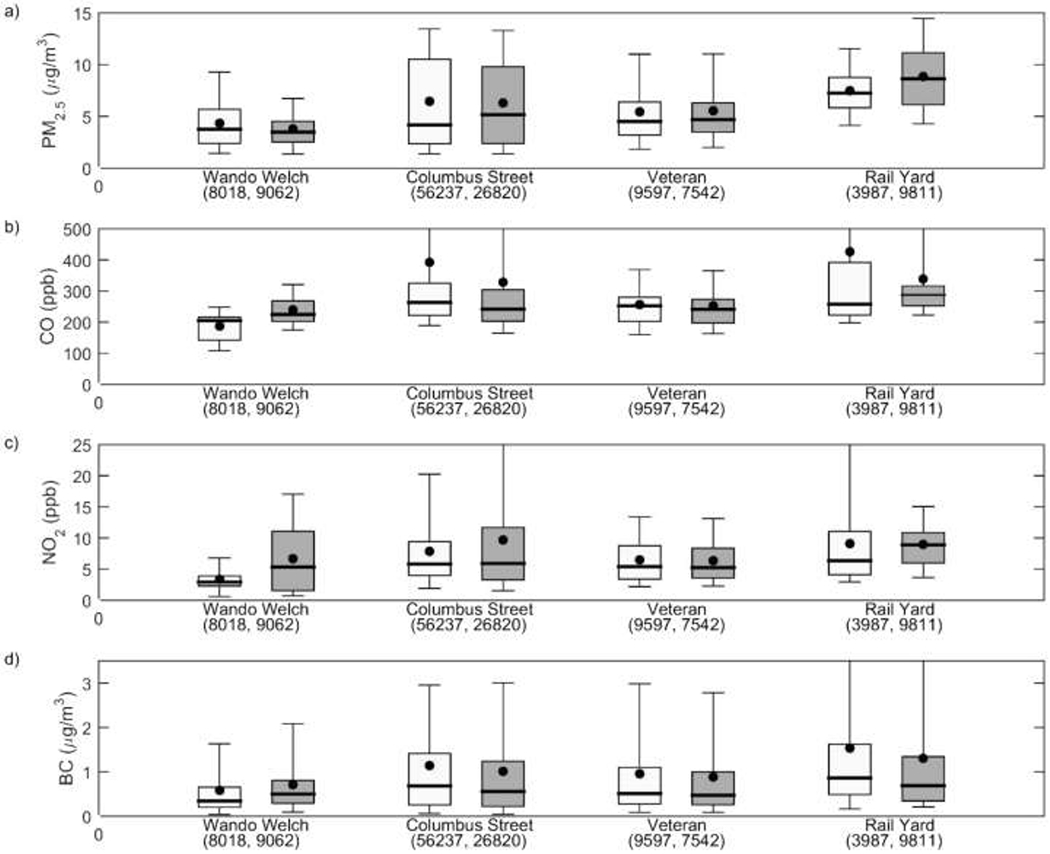
Concentration measurements for each sampling location residential area when location is upwind of source (white) and downwind of source (grey) for pollutants a) PM2.5, b) CO, c) NO2, and d) BC. Major distribution lines show 5, 25, 50, 75, and 95 percentiles. Number of samples given in parentheses.
Isolating port effect at Wando Welch is easier because there are no other major emission sources upwind of the port facility and there are no major emission sources in the background wind direction. It is harder to isolate the port effect at the other locations due to a number of nearby sources such as major roadways. The Wando Welch neighborhood route is also in close proximity to the port. the Veteran’s Terminal neighborhood is over a kilometer away from the port facility, diminishing the impact of port emissions, and immediately on the far side of the neighborhood are three major roadways (Route 52, Route 78, and I-26). As such, this neighborhood’s air quality is dominated by the nearby roadways and no conclusions about port activity can be made.
3.3. External data comparison
3.3.1. Air Quality System database
The Air Quality System (AQS) contains data collected by EPA and state agencies from air pollution and meteorological measurement and has undergone quality assurance control by EPA’s Office of Air Quality Planning and Standards (OAQPS). The GMAP data was compared to the AQS data in order to establish that the data collected during the study is reasonable and consistent with outside measurement. Three monitoring stations were identified near the port area. These stations are located in downtown Charleston, near the rail yard in North Charleston, and further north near the Charleston airport. Measurements of PM2.5 were available at all three sites and measurements of PM10 were available at the rail yard site. Fig. 7a and b shows the comparison of the GMAP mean concentration data over the entire sampling session each day of the campaign with the AQS data averaged over the same period of time. While the GMAP measurement data generally follows the same trends as the AQS data for both PM2.5 and PM10, it is slightly lower in magnitude, particularly for the PM2.5. For PM2.5 measurements, the fractional bias between the GMAP and the AQS Downtown, AQS Rail Yard, and AQS Airport is 61%, 57%, and 47% respectively. For PM10, the fraction bias between GMAP and the AQS measurements is 19%. One explanation for this is that the aerodynamic particle sizer used to measure and compute particle masses has a lower bound of 0.5 μm. Thus, some mass is being excluded from the PM measurements. Additionally, APS mass measurements are only an estimation of real mass, as it requires certain assumptions such as spherical particles. Previous research has found that a significant amount of PM2.5 mass is accounted for by particles smaller than 0.5 μm (Heyder et al., 1996). The PM10 mass is dominated by larger particles, which creates a lesser impact on this measurement.
Figure 7.
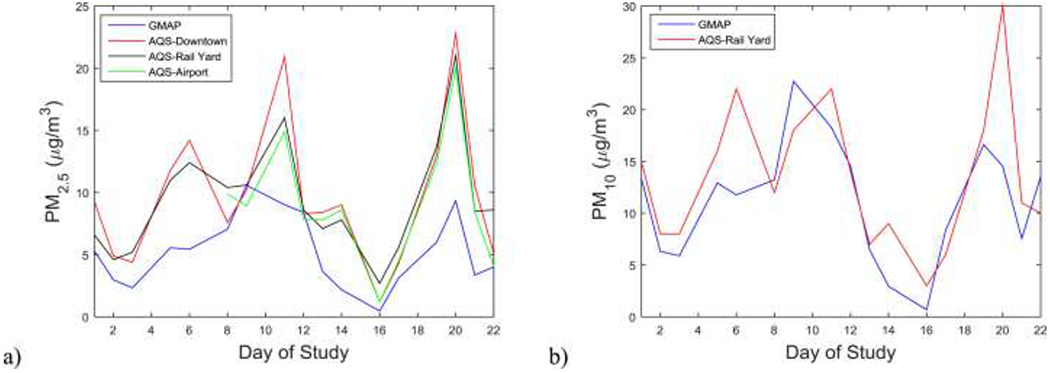
Comparison of GMAP data with data from AQS database for a) PM2.5 and b) PM10.
3.3.2. Port activity data
The port authority supplied information on number of hotelling ships and number of cranes in operation during 9 of the 10 sampling sessions at the Wando Welch terminal (every session excluding the one on February 20). Furthermore, the sessions on March 12 and March 13 were excluded due to lack of data with wind conditions blowing from the background direction. Note that while cranes at Wando Wech terminal are all electric, it is assumed their operation can be used as a proxy for overall port operation, including other non-electric on-terminal equipment and diesel trucks loading and unloading cargo. In general, absolute concentration measurements are correlated with regional background as shown in Fig. 7. For this analysis, we are concerned with the percent elevation of BC concentration over local “background” concentration in the southern Wando Welch neighborhood as defined in Section 3.2. In general, there is a light correlation between concentration increase and port activity, with coefficient of determination R2 = 0.57 between crane counts and BC concentration increase (see Table 2).
Table 2.
Counts of hoteling ships and cranes in operation and percent increase in BC measurements downwind of Wando Welch terminal compared to local background during sampling periods with available data.
| Sampling Day | Ship Count | Crane Count | BC Concentration Percent Increase |
|---|---|---|---|
| 2/21 | 3 | 8 | 33.1 |
| 2/25 | 1 | 1 | 11.5 |
| 2/27 | 2 | 2 | 5.9 |
| 3/2 | 2 | 4 | 3.6 |
| 3/5 | 3 | 7 | 61.2 |
| 3/7 | 2 | 4 | 19.4 |
3.4. Future study design considerations
In general, it is challenging to characterize the air quality near-source facilities as they exist in busy urban areas with a variety of emissions sources and are dependent on the contributions from various sources, only some of which can be attributed to port activity. In future near-source studies it is important to recognize the limitations and advantages of the methodology and design studies accordingly. Two primary considerations in data collection are distance from the source of interest and proximity to confounding sources.
As concentration decays exponentially away from a source, further than several hundred meters away it becomes difficult to distinguish between emissions from the source of interest and background concentration. It is also essential to be able to isolate the source of interest from confounding sources. This issue is particularly important in mobile monitoring campaigns that are concerned with non-roadway sources, as the measurements are necessarily recorded on roadways themselves. While traversing these roadways, the measurement contribution from the source are insignificant compared with on-road vehicular sources. As such, future studies should aim to minimize traveling time along high trafficked roads. It may be necessary to find complimentary measurement methods such as stationary sampling to fill in gaps which mobile monitoring alone cannot.
Furthermore, ports studies should consider measurement of sulfates and organic carbon, which are a significant component of OGV exhaust (Moldanová et al., 2009). BC is a more significant constituent of diesel truck particulate, and not sufficiently sensitive to OGV emissions. These measurements serve to better isolate OGV contribution. Additionally, the sporadic nature of port activity should be sufficiently documented. Additionally, due to the sporadic activity found in port facilities, foreknowledge of expected ship arrival times would be useful in structuring sampling periods to create a balanced study design, one where there is significant measurement during periods of high and low port activity.
However, mobile monitoring does confer some advantages over stationary sampling. Of primary benefit is the increased spatial characterization of an area. This is particularly helpful in differentiating source contributions since the vehicle can be driven in many directions around and between various sources. In addition, the flexibility afforded to a mobile vehicle allows the measurement to be tailored to specific meteorological conditions (for example, always sampling downwind of a source of interest).
4. Conclusion
This study showcases an early attempt to quantify the direct impact of port related activity on local scale air quality. EPA’s geospatial measurement of air pollution (GMAP) vehicle and a portable sampling station were utilized to record measurements of various pollutant concentrations, GPS location data, and meteorological information to map spatial and temporal distribution of the pollutants.
In general, the measured pollutant concentrations were much higher on major roadways, which is expected as highways represent a major emission source in urban environments. As such, measured concentrations along major roadways will be dominated by vehicular traffic, which may or may not be related to port activity. Observing concentrations along less trafficked roads such as those in residential neighborhoods gives more insight into the effect of port terminal emissions. During periods of time where wind was blowing from the direction of the port terminal measured concentrations of CO, NO2, and BC were elevated significantly over background, suggesting a significant port effect. Comparison of measured results with port activity data also shows a correlation between port activity and significant elevation of pollutant concentration above background. This work clearly demonstrates that ports can have a significant impact on air quality in nearby communities. Collected data was verified by a comparison with long term ambient air pollution data from the Air Quality System (AQS) database. In general, the mobile measurement concentrations were found to be somewhat lower than those recorded in the AQS database, but followed the general trends in ambient pollutant concentrations.
While the collected data were sufficient to show significant port effect was observed in this study, study design could be improved in future work. In general, the variability in meteorological characteristics and sporadic nature of port-related emissions necessitates a longer sampling period. While the initial goal of the study design was to measure port air quality under various times and locations to better spatially map the area, the shorter temporal resolution of the data at each terminal worked against the analysis. Furthermore, the data collected while travelling on major roadways, which represented a large percentage of total sampling time, was not useful in determining port impact. In future mobile monitoring studies, it will be important to be cognizant of the limitations of mobile measurements in mapping spatial and temporal gradients of air quality, and to design studies to efficiently obtain sufficient data to achieve specific research goals. Despite these limitations in the current study, we believe mobile monitoring has the potential to be a useful tool in near-port assessment.
Supplementary Material
Highlights.
Air quality measurements near seaport terminals using a mobile monitoring vehicle.
Continuous spatial and temporal characterization of air quality.
Favorable comparison with external air quality measurement.
Significant contribution from port terminal on pollutant concentrations observed.
References
- Ault et al., 2009, Ault AP, Moore MJ, Furutani H, Prather KA Impact of emissions from the Los Angeles port region on San Diego air quality during regional transport events. Environ. Sci. Technol, 43 (10) (2009), pp. 3500–3506 [DOI] [PubMed] [Google Scholar]
- Baldauf et al., 2008, Baldauf R, Thoma E, Khlystov A, Isakov V, Bowker G, Long T, Snow R Impacts of noise barriers on near-road air quality. Atmos. Environ, 42 (32) (2008), pp. 7502–7507 [Google Scholar]
- Bowker et al., 2007, Bowker GE, Baldauf R, Isakov V, Khlystov A, Petersen W The effects of roadside structures on the transport and dispersion of ultrafine particles from hig`hways. Atmos. Environ, 41 (37) (2007), pp. 8128–8139 [Google Scholar]
- Crosman et al., 2017, Crosman ET, Jacques AA, Horel JD A novel approach for monitoring vertical profiles of boundary-layer pollutants: utilizing routine news helicopter flights. Atmos. Pollut. Res. (2017), 10.1016/j.apr.2017.01.013, In Press [DOI] [Google Scholar]
- Dalsøren et al., 2009, Dalsøren SB, Eide MS, Endresen Ø, Mjelde A, Gravir G, Isaksen IS Update on emissions and environmental impacts from the international fleet of ships: the contribution from major ship types and ports. Atmos. Chem. Phys, 9 (6) (2009), pp. 2171–2194 [Google Scholar]
- Hagler et al., 2010, Hagler G, Thoma E, Baldauf R High-resolution mobile monitoring of carbon monoxide and ultrafine particle concentrations in a near-road environment. J. Air Waste Manag. Assoc, 60 (3) (2010), pp. 328–333 [DOI] [PubMed] [Google Scholar]
- Hagler et al., 2011, Hagler GS, Yelverton TL, Vedantham R, Hansen AD, Turner JR Post-processing method to reduce noise while preserving high time resolution in aethalometer real-time black carbon data. Aerosol Air Qual. Res, 11 (5) (2011), pp. 539–546 [Google Scholar]
- Hagler et al., 2012, Hagler G, Lin M, Khlystov A, Baldauf R, Isakov I, Faircloth J, Jackson L Field investigation of roadside vegetative and structural barrier impact on near-road ultrafine particle concentrations under a variety of wind conditions. Sci. Total Environ, 419 (2012), pp. 7–15 [DOI] [PubMed] [Google Scholar]
- HEI, 2010, HEITraffic-related Air Pollution: a Critical Review of the Literature on Emissions, Exposure, and Health Effects. Health Effects Institute, Boston, MA: (2010) [Google Scholar]
- Heyder et al., 1996, Heyder J, Brand P, Heinrich J, Peters A, Scheuh G, Tuch T, Wichmann E Size Distribution of Ambient Particles and its Relevance to Human Health Second colloquium on particulate air pollution and health, Park City, Utah: (1996), pp. 1–3 [Google Scholar]
- Khlystov et al., 2004, Khlystov A, Stanier C, Pandis SN An algorithm for combining electrical mobility and aerodynamic size distributions data when measuring ambient aerosol special issue of aerosol science and technology on findings from the fine particulate matter supersites program. Aerosol Sci. Technol, 38 (S1) (2004), pp. 229–238 [Google Scholar]
- Kozawa et al., 2009, Kozawa KH, Fruin SA, Winer AM Near-road air pollution impacts of goods movement in communities adjacent to the Ports of Los Angeles and Long Beach. Atmos. Environ, 43 (18) (2009), pp. 2960–2970 [Google Scholar]
- Lonati et al., 2010, Lonati G, Cernuschi S, Sidi S Air quality impact assessment of at-berth ship emissions: case-study for the project of a new freight port. Sci. Total Environ, 409 (1) (2010), pp. 192–200 [DOI] [PubMed] [Google Scholar]
- Moldanová et al., 2009, Moldanová J, Fridell E, Popovicheva O, Demirdjian B, Tishkova V, Faccinetto A, Focsa C Characterisation of particulate matter and gaseous emissions from a large ship diesel engine. Atmos. Environ, 43 (16) (2009), pp. 2632–2641 [Google Scholar]
- Rosenbaum et al., 2010, Rosenbaum A, Hartley S, Holder C Analysis of diesel particulate matter health risk disparities in selected US harbor areas. Am. J. Public Health, 101 (S1) (2010), pp. S217–S223 [DOI] [PMC free article] [PubMed] [Google Scholar]
- Salam et al., 2008, Salam MT, Islam T, Gilliand FD Recent evidence for adverse effects of residential proximity to traffic sources on asthma. Curr. Opin. Pulm. Med, 14 (1) (2008), pp. 3–8 [DOI] [PubMed] [Google Scholar]
- Zhou and Levy, 2007, Zhou Y, Levy J Factors influencing the spatial extent of mobile source air pollution impacts: a meta-analysis. BMC Public Health., 7 (1) (2007), p. 89. [DOI] [PMC free article] [PubMed] [Google Scholar]
- Zwack et al., 2011, Zwack LM, Paciorek CJ, Spengler JD, Levy JI Characterizing local traffic contributions to particulate air pollution in street canyons using mobile monitoring techniques. Atmos. Environ, 45 (15) (2011), pp. 2507–2514 [Google Scholar]
Associated Data
This section collects any data citations, data availability statements, or supplementary materials included in this article.


