

Abstract
BACKGROUND
Higher serum urate levels are associated with an increased risk of diabetic kidney disease. Lowering of the serum urate level with allopurinol may slow the decrease in the glomerular filtration rate (GFR) in persons with type 1 diabetes and early-to-moderate diabetic kidney disease.
METHODS
In a double-blind trial, we randomly assigned participants with type 1 diabetes, a serum urate level of at least 4.5 mg per deciliter, an estimated GFR of 40.0 to 99.9 ml per minute per 1.73 m2 of body-surface area, and evidence of diabetic kidney disease to receive allopurinol or placebo. The primary outcome was the baseline-adjusted GFR, as measured with iohexol, after 3 years plus a 2-month washout period. Secondary outcomes included the decrease in the iohexol-based GFR per year and the urinary albumin excretion rate after washout. Safety was also assessed.
RESULTS
A total of 267 patients were assigned to receive allopurinol and 263 to receive placebo. The mean age was 51.1 years, the mean duration of diabetes 34.6 years, and the mean glycated hemoglobin level 8.2%. The mean baseline iohexol-based GFR was 68.7 ml per minute per 1.73 m2 in the allopurinol group and 67.3 ml per minute per 1.73 m2 in the placebo group. During the intervention period, the mean serum urate level decreased from 6.1 to 3.9 mg per deciliter with allopurinol and remained at 6.1 mg per deciliter with placebo. After washout, the between-group difference in the mean iohexol-based GFR was 0.001 ml per minute per 1.73 m2 (95% confidence interval [CI], −1.9 to 1.9; P= 0.99). The mean decrease in the iohexol-based GFR was −3.0 ml per minute per 1.73 m2 per year with allopurinol and −2.5 ml per minute per 1.73 m2 per year with placebo (between-group difference, −0.6 ml per minute per 1.73 m2 per year; 95% CI, −1.5 to 0.4). The mean urinary albumin excretion rate after washout was 40% (95% CI, 0 to 80) higher with allopurinol than with placebo. The frequency of serious adverse events was similar in the two groups.
CONCLUSIONS
We found no evidence of clinically meaningful benefits of serum urate reduction with allopurinol on kidney outcomes among patients with type 1 diabetes and early-to-moderate diabetic kidney disease. (Funded by the National Institute of Diabetes and Digestive and Kidney Diseases and others; PERL ClinicalTrials.gov number, NCT02017171.)
The estimated lifetime risk of diabetic kidney disease among patients with type 1 diabetes is as high as 60%.1 Intensive glucose control was widely implemented to reduce the incidence of microalbuminuria after the Diabetes Control and Complications Trial,2 but longer follow-up suggested that intensified glucose control delays but does not eliminate the risk of progression of diabetic kidney disease to end-stage kidney disease.3 In fact, the annual incidence of end-stage kidney disease among persons with type 1 diabetes in the United States has been increasing, albeit in a delayed fashion, as compared with earlier cohorts.4 Although blood-pressure control5,6 and, more specifically, renin–angiotensin system inhibition7–9 slow the progression of relatively advanced diabetic kidney disease, evidence of preservation of the glomerular filtration rate (GFR) by these interventions at earlier stages is limited.10–13 Thus, new treatments, especially for early diabetic kidney disease, are needed.
Serum urate is a potential target, on the basis of evidence from animal models and observational studies involving humans.14 Higher levels of serum urate, even within the normal range, predicted albuminuria14–16 and early decline in the GFR as well as a higher rate of cardiovascular events and higher mortality in cohorts of patients with type 1 diabetes.14,17,18 Moreover, reduction in the serum urate level slowed the decline in the GFR in two small clinical trials involving participants with moderate chronic kidney disease, approximately 25% of whom had diabetes.19–21 In the Preventing Early Renal Loss in Diabetes (PERL) trial, we tested whether reduction of the serum urate level with allopurinol therapy could slow the decline in GFR in persons with type 1 diabetes, early-to-moderate diabetic kidney disease, and a serum urate level of at least 4.5 mg per deciliter (270 μmol per liter).22
METHODS
TRIAL DESIGN AND OVERSIGHT
The rationale and design of this double-blind, multicenter, randomized, placebo-controlled clinical trial of allopurinol have been published previously.22 The trial, which was supported by the National Institute of Diabetes and Digestive and Kidney Diseases (NIDDK) and JDRF (previously known as the Juvenile Diabetes Research Foundation), was conducted at 16 sites in the United States, Canada, and Denmark. The first author served as the sponsor-investigator (according to the Food and Drug Administration, a person who initiates and conducts an investigation and under whose immediate direction the investigational drug is administered or dispensed). Members of the steering committee designed the trial, supervised its conduct, and were responsible for reporting the results. Analyses were performed by the trial statistical team, which comprised three authors. Five of the authors wrote the initial draft of the manuscript, and all the authors contributed to revisions. The decision to submit the manuscript for publication was made jointly by all the authors, who also vouch for the accuracy and completeness of the data and for the fidelity of the trial to the protocol (available with the full text of this article at NEJM.org). The iohexol that was used for assessing the iohexol-based GFR was donated by GE Healthcare, which had no role in the trial design or conduct or in the data collection or analysis but which reviewed the manuscript to ensure that no confidential information was disclosed.
PATIENTS
Included in the trial were patients with type 1 diabetes; an estimated GFR of 40.0 to 99.9 ml per minute per 1.73 m2 of body-surface area; evidence of diabetic kidney disease, defined as a history of or the presence of albuminuria (urinary albumin excretion rate, 20 to 3333 μg per minute) or evidence of a decline in the GFR of at least 3 ml per minute per 1.73 m2 per year in the previous 3 to 5 years; and a serum urate level of at least 4.5 mg per deciliter (corresponding to the median value in a population of patients with similar characteristics17).22 Inclusion and exclusion criteria are summarized in Table S1 in the Supplementary Appendix, available at NEJM.org.
TRIAL PROCEDURES
Eligible participants entered a 9-week run-in phase during which, if indicated, renin–angiotensin system inhibitors were introduced or adjusted (to be at least equivalent to 10 mg of ramipril or 300 mg of irbesartan) and the blood pressure was targeted to no higher than 140/90 mm Hg. Participants were then randomly assigned to receive either oral placebo or allopurinol (at a dose of 100 mg per day for 4 weeks, with the dose adjusted thereafter to 400 mg per day if the estimated GFR was ≥50 ml per minute per 1.73 m2, to 300 mg per day if the estimated GFR was 25 to 49 ml per minute per 1.73 m2, or to 200 mg per day if the estimated GFR was 15 to 24 ml per minute per 1.73 m2). Randomization was stratified according to site, serum urate level (≤6.0 vs.>6.0 mg per deciliter [≤360 vs. >360 μmol per liter]), and glycated hemoglobin level (≤7.8% vs. >7.8%), with the use of permuted blocks of two or four. The intervention period lasted 3 years plus a 2-month washout period.
Trial visits (which occurred every 3 to 4 months) included measurements of blood pressure, serum creatinine, and glycated hemoglobin as well as safety evaluations. The GFR was measured by plasma disappearance of iohexol (iohexol-based GFR)23 immediately before randomization, midway through the trial (at 80 weeks), at the end of the intervention period (at 156 weeks), and after the washout period (at 164 weeks).
The trial was conducted in accordance with the principles of the Declaration of Helsinki, the international ethical guidelines of the Council for International Organizations of Medical Sciences, and the Good Clinical Practice guidelines of the International Council for Harmonisation. The protocol was reviewed by all local institutional review boards and the NIDDK-appointed data and safety monitoring board. All the participants provided written informed consent.
OUTCOMES
The primary outcome was the iohexol-based GFR after 3 years plus the 2-month washout period, with adjustment for the baseline iohexol-based GFR. This outcome was selected because studies have indicated that the measured GFR was more sensitive for the detection of GFR change than the GFR estimating equations24,25 and because our goal was to ascertain effects that are independent of the possible transient renal hemodynamic effects of allopurinol.26 Secondary outcomes were the following: the baseline-adjusted iohexol-based GFR after the 3-year intervention period; the iohexol-based GFR time trajectory as estimated from measurements conducted at baseline, at mid-trial, at the end of the intervention, and at the end of the washout period; the baseline- adjusted serum creatinine–based estimated GFR (assessed with the Chronic Kidney Disease Epidemiology Collaboration equation27) at 4 months; the estimated GFR time trajectory with the use of serum creatinine levels obtained at intervals of 3 to 4 months; doubling of the serum creatinine level or progression to end-stage kidney disease in a time-to-event analysis; the baseline-adjusted urinary albumin excretion rate after washout; the baseline-adjusted urinary albumin excretion rate after 3 years; and fatal or nonfatal cardiovascular events (defined as death from cardiovascular causes, nonfatal myocardial infarction, nonfatal stroke, coronary-artery bypass grafting, or percutaneous coronary intervention) in a time-to-event analysis.
STATISTICAL ANALYSIS
On the basis of data from the Joslin Kidney Study,17 we estimated that 180 participants per group would provide the trial with 80% power to detect a prespecified effect of 3 ml per minute per 1.73 m2 on the primary outcome, assuming a two-sided type I error of 5% and a standard deviation of the residual error of 10.1 ml per minute per 1.73 m2. To account for a trial discontinuation rate of up to 5% per year from withdrawal, death, or progression to end-stage kidney disease and for a discontinuation rate of allopurinol or placebo of up to 2% per year among participants completing the trial, we aimed to randomly assign 240 patients per group to maintain adequate power. When this number was reached, it was decided, in agreement with the data and safety monitoring board and the NIDDK, to randomly assign participants who were still in the run-in period to the trial groups, which brought the total to 530 participants.
The primary analysis was conducted in the intention-to-treat population, which included all the patients who had undergone randomization. A secondary analysis was conducted in the per-protocol population, which included participants who had a mean exposure to allopurinol or placebo of at least 80% over the 3-year trial period and who had no major protocol deviations. Multiple imputation methods were applied28 with the use of fully conditional specification29 to account for missing values for continuous outcomes, baseline covariates, and postrandomization variables of interest (see the Supplementary Statistical Methods section in the Supplementary Appendix).
The effect of allopurinol on the primary outcome was evaluated with the use of a linear model for correlated errors with a general or unstructured covariance matrix with the following covariates: stratification variables, baseline value of the dependent variable, kidney phenotype (albuminuric diabetic kidney disease vs. normoalbuminuria with declining kidney function), and baseline albumin excretion rate (see the Supplementary Statistical Methods section). The robustness of the results was assessed by a tipping-point sensitivity analysis.30 Secondary outcomes were analyzed by means of linear regression (for outcomes at a single time point), a linear model with correlated errors (for the iohexol-based GFR at the end of the intervention period), mixed-effects models (for longitudinal measures of the postrandomization iohexol-based GFR and estimated GFR), and a proportional-hazards model (for time-to-event end points). Albumin excretion rates were log-transformed.
Since there were no interim analyses of the primary outcome, the nominal alpha level for the primary outcome was set at 0.05. For secondary outcomes, 95% confidence intervals are reported, without P values. The confidence intervals are not adjusted for multiplicity and should not be used to infer treatment effects. Prespecified subgroup analyses were performed for possible heterogeneity in the effects of allopurinol treatment on the primary outcome by adding appropriate interaction terms to the model for the primary analysis.
RESULTS
PATIENTS
Of 1625 persons screened, 1016 were ineligible, withdrew, or were lost to follow-up before the run-in phase, 609 entered the run-in phase, and 530 finished the run-in phase and were randomly assigned to receive either allopurinol (267 patients) or placebo (263 patients) (Fig. S1). The clinical characteristics of the patients at baseline were well balanced between the two groups (Table 1 and Table S2). The mean age of the patients was 51.1 years, and the mean duration of diabetes was 34.6 years. The mean iohexol-based GFR was 68.0 ml per minute per 1.73 m2, and the mean estimated GFR was 74.7 ml per minute per 1.73 m2. The mean serum urate level was 6.1 mg per deciliter (360 μmol per liter), and the mean glycated hemoglobin level was 8.2%. A total of 90.0% of the patients were treated with renin– angiotensin inhibitors.
Table 1.
Characteristics of the Trial Participants at Baseline.*
| Characteristic | Placebo (N = 263) | Allopurinol (N = 267) | Total (N = 530) |
|---|---|---|---|
| Age — yr | 51.8±10.6 | 50.4±11.2 | 51.1±10.9 |
| Male sex — no. (%) | 168 (63.9) | 183 (68.5) | 351 (66.2) |
| Race — no. (%)† | |||
| White | 216 (82.1) | 230 (86.1) | 446 (84.2) |
| Black | 30 (11.4) | 28 (10.5) | 58 (10.9) |
| Other | 17 (6.5) | 9 (3.4) | 26 (4.9) |
| Diabetes duration — yr | 35.3±12.5 | 33.8±12.2 | 34.6±12.3 |
| Body-mass index | 29.5±5.9 | 29.5±6.1 | 29.5±6.0 |
| Glycated hemoglobin — % | 8.2±1.3 | 8.2±1.3 | 8.2±1.3 |
| Serum urate — mg/dl‡ | 6.1±1.5 | 6.1±1.5 | 6.1±1.5 |
| Blood pressure — mm Hg‡ | |||
| Systolic | 126.3±13.6 | 125.6±14.7 | 126.0±14.2 |
| Diastolic | 71.3±10.0 | 71.2±10.4 | 71.2±10.2 |
| Iohexol-based GFR — ml/min/1.73 m2‡ | 67.3±16.7 | 68.7±17.1 | 68.0±16.9 |
| Serum creatinine–based estimated GFR — ml/min/1.73 m2‡ | 74.0±19.4 | 75.4±18.7 | 74.7±19.1 |
| Median urinary albumin excretion rate (IQR) — µg/min§ | 43.0 (9.0–198.0) | 41.1 (7.7–216.0) | 41.6 (8.5–207.5) |
| Use of renin–angiotensin system inhibitor — no. (%) | 230 (87.5) | 247 (92.5) | 477 (90.0) |
Plus–minus values are means ±SD. Data on body-mass index (the weight in kilograms divided by the square of the height in meters) were missing for three participants in the placebo group and for two in the allopurinol group, on the glycated hemoglobin level for two in the allopurinol group, on the iohexol-based glomerular filtration rate (GFR) for one in the placebo group, and on the urinary albumin excretion rate for two in the placebo group. To convert the values for serum urate to micromoles per liter, multiply by 59.48. IQR denotes interquartile range.
Race was reported by the patient.
Values were obtained at the visit before randomization.
The values are based on geometric means of the albumin excretion rates obtained at the two visits before randomization.
TRIAL FOLLOW-UP AND ADHERENCE
A total of 62 participants (23.2%) in the allopurinol group and 46 (17.5%) in the placebo group did not complete the trial owing to voluntary withdrawal, loss to follow-up, death, progression to end-stage kidney disease, or other reasons (Fig. S1). A total of 10 patients in the allopurinol group died, as compared with 4 in the placebo group; 6 and 2 patients, respectively, had progression to end-stage kidney disease. A total of 14 patients (5.2%) in the allopurinol group and 19 (7.2%) in the placebo group completed the trial but discontinued allopurinol or placebo before 3 years for protocol-mandated reasons (e.g., rash) or on their own initiative. Data on the completeness of the iohexol-based GFR measurements obtained during the trial are provided in the Supplementary Appendix.
The median adherence to the assigned regimen (assessed as the percentage of tablets taken) was 93.8% (interquartile range, 86.3 to 97.4), with 85.4% of the participants having at least 80% adherence, and 94.9% of the patients having at least 70% adherence. The serum urate level, which remained at baseline levels in the placebo group, decreased progressively in the allopurinol group from 6.1 mg per deciliter at baseline to 3.7 mg per deciliter (220 μmol per liter) at 16 weeks and remained at that level for the duration of the intervention period (mean, 3.9 mg per deciliter [230 μmol per liter], equivalent to a 36% reduction from the baseline value); after the washout period, the serum urate level returned to a near-baseline value (mean, 5.9 mg per deciliter [350 μmol per liter]) (Fig. 1A). The values for the glycated hemoglobin level, systolic and diastolic blood pressure, and body-mass index remained similar to the baseline values in the two groups (Fig. S2).
Figure 1. Serum Urate and Iohexol-based Glomerular Filtration Rate (GFR) Trajectories.
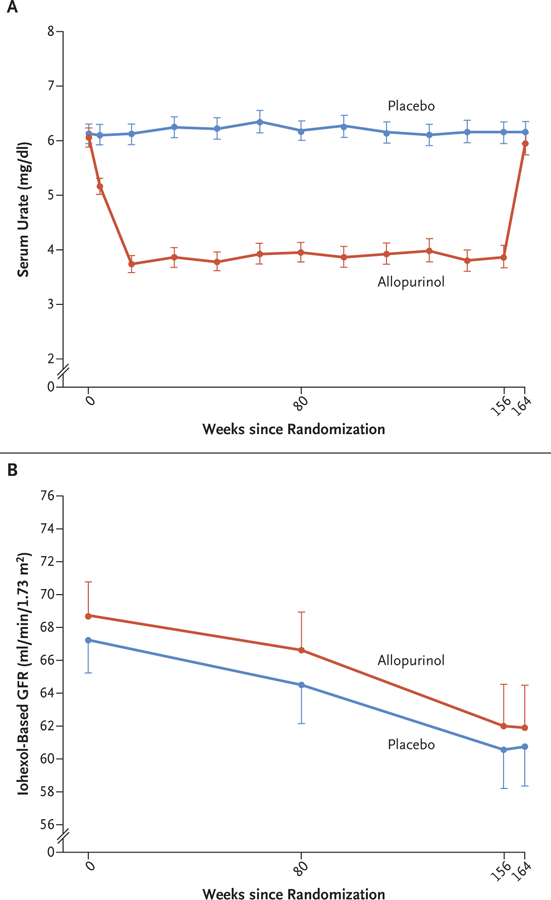
The mean levels of serum urate (Panel A) and the mean iohexol-based GFR (Panel B) in the two groups are shown at different time points during the trial. I bars indicate 95% confidence intervals. The mean serum urate values are shown for participants with available levels at each time point. The mean iohexol-based GFR values are shown for the entire intention-to-treat population, with missing values imputed as described in the Methods section. The intervention period ended at week 156 after randomization, and the 2-month washout period ended at week 164. To convert the values for serum urate to micromoles per liter, multiply by 59.48.
RESULTS OF ALLOPURINOL TREATMENT ON PRIMARY AND SECONDARY OUTCOMES
The iohexol-based GFR in the intention-to-treat population decreased at similar rates in the allopurinol group and the placebo group (Fig. 1B). When values were adjusted for the baseline values, the mean iohexol-based GFR at the end of the 2-month washout period (the primary outcome) was virtually identical in the two groups (61.2 ml per minute per 1.73 m2 in each group; between-group difference, 0.001 ml per minute per 1.73 m2; 95% confidence interval [CI], −1.9 to 1.9) (Table 2). These results were supported by a tipping-point sensitivity analysis, which indicated that a very large deviation, on the order of 9 ml per minute per 1.73 m2, from the imputed values in the allopurinol group at the visit at which the primary outcome was assessed would have been necessary to overturn these neutral findings (see the Supplementary Appendix).
Table 2.
Effect of Allopurinol on Primary and Secondary Outcomes.*
| Outcome | Placebo (N = 263) | Allopurinol (N = 267) | Allopurinol Effect (95% CI)† |
|---|---|---|---|
| Primary outcome | |||
| Baseline-adjusted iohexol-based GFR at end of the 2-mo washout period (95% CI) — ml/min/1.73 m2 | 61.2 (58.1 to 64.2) | 61.2 (58.1 to 64.2) | 0.001 (−1.9 to 1.9)‡ |
| Secondary outcomes | |||
| Baseline-adjusted iohexol-based GFR at end of the intervention period (95% CI) — ml/min/1.73 m2 | 61.0 (57.9 to 64.0) | 61.3 (58.3 to 64.3) | 0.3 (−1.7 to 2.3) |
| Baseline-adjusted estimated GFR at 4 mo after randomization (95% CI) — ml/min/1.73 m2 | 70.0 (67.1 to 72.9) | 70.3 (67.3 to 73.3) | 0.3 (−1.6 to 2.2) |
| Slope of GFR (95% CI) — ml/min/1.73 m2/yr | |||
| Iohexol-based | −2.5 (−3.1 to −1.8) | −3.0 (−3.7 to −2.3) | −0.6 (−1.5 to 0.4) |
| Estimated | −2.1 (−2.6 to −1.6) | −2.4 (−2.9 to −1.8) | −0.3 (−1.0 to 0.5) |
| Urinary albumin excretion rate (95% CI) — μg/min | |||
| At end of the washout period | 31.7 (19.5 to 51.6) | 42.9 (24.7 to 74.4) | 1.4 (1.0 to 1.8) |
| At end of the intervention period | 37.4 (25.3 to 55.5) | 47.9 (32.5 to 70.6) | 1.3 (1.0 to 1.6) |
| Serum creatinine doubling or progression to end-stage kidney disease — no. (%)§ | 11 (4.2) | 13 (4.9) | 1.2 (0.5 to 2.9) |
| Fatal or nonfatal cardiovascular event — no. (%) | 9 (3.4) | 15 (5.6) | 1.9 (0.8 to 4.5) |
Data for continuous outcomes are adjusted means, except for outcomes involving the urinary albumin excretion rate, for which they are adjusted geometric means.
For GFR outcomes, the allopurinol effect is the estimated difference between the allopurinol group and the placebo group; for urinary albumin excretion rate outcomes, it is the ratio between the allopurinol group and the placebo group; and for the time-to-event analyses of serum creatinine doubling or progression to end-stage kidney disease and of fatal or nonfatal cardiovascular events, it is the hazard ratio for the events with allopurinol as compared with placebo.
P = 0.99.
Two patients in the placebo group and six in the allopurinol group had progression to end-stage kidney disease.
There was no evidence of a difference between the groups in a secondary analysis conducted in the per-protocol population (Table S3). In this population, the baseline-adjusted iohexol-based GFR at the end of the trial was 63.5 ml per minute per 1.73 m2 in the allopurinol group and 62.0 ml per minute per 1.73 m2 in the placebo group (between-group difference, 1.5 ml per minute per 1.73 m2; 95% CI, −0.7 to 3.8). Prespecified subgroup analyses of the primary outcome in the intention-to-treat population did not reveal significant heterogeneity in response to allopurinol (Fig. 2).
Figure 2. Prespecified Subgroup Analyses of the Effect of Allopurinol on the Primary Outcome.
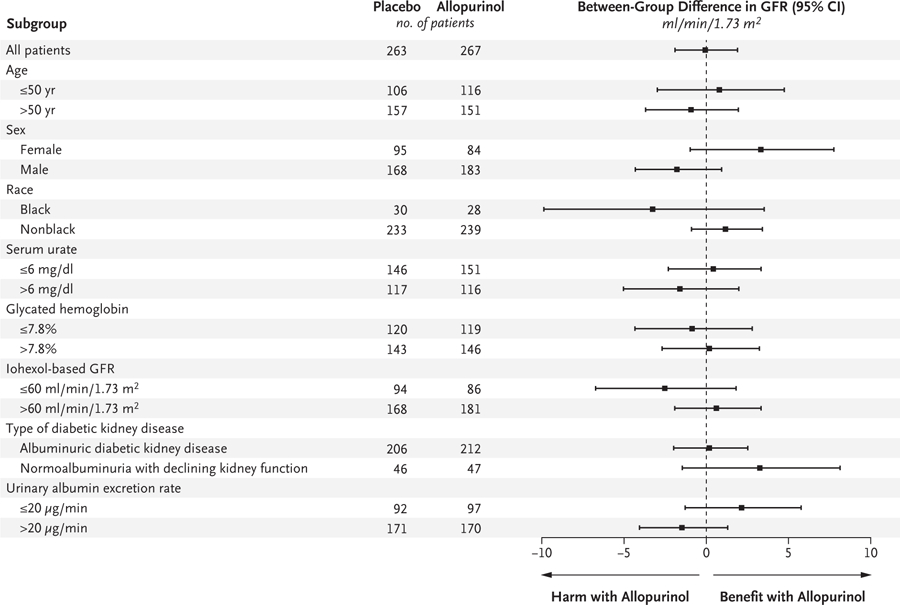
The mean differences in the primary outcome (the iohexol-based GFR at the end of the 2-month washout period) between the allopurinol group and the placebo group are shown in prespecified subgroups. Positive values denote a higher iohexol-based GFR in the allopurinol group than in the placebo group (i.e., benefit with allopurinol); negative values denote a lower iohexol-based GFR in the allopurinol group than in the placebo group (i.e., harm with allopurinol). Race was reported by the patient.
We did not find evidence of clinically meaningful effects with regard to the secondary outcomes of the baseline-adjusted iohexol-based GFR at the end of the intervention period or at 4 months, the slope of the iohexol-based GFR, and the slope of the estimated GFR (Table 2). The urinary albumin excretion rate was 40% (95% CI, 0 to 80) higher at the end of the washout period and 30% (95% CI, 0 to 60) higher at the end of the intervention period in the allopurinol group than in the placebo group. Results in the time-to-event analyses of serum creatinine doubling or progression to end-stage kidney disease and of fatal or nonfatal cardiovascular events were inconclusive owing to small numbers of events.
SAFETY OF ALLOPURINOL TREATMENT
There were 354 serious adverse events; 171 serious adverse events occurred in the allopurinol group and 183 occurred in the placebo group (Table S4). The percentages of participants with at least one serious adverse event were similar in the two groups (93 of 267 patients [34.8%] in the allopurinol group and 82 of 263 [31.2%] in the placebo group), as were the percentages of patients who discontinued allopurinol or placebo because of such events (16 patients [6.0%] and 11 patients [4.2%], respectively). Although such events were uncommon, there were numerically more fatal serious adverse events in the allopurinol group than in the placebo group (in 10 patients vs. 4). No major imbalances between the two groups were observed in the distribution of serious adverse events according to body system (Table S5).
DISCUSSION
This randomized clinical trial showed no evidence of a clinically meaningful benefit of serum urate lowering with allopurinol on kidney outcomes in patients with type 1 diabetes and early-to-moderate diabetic kidney disease who were treated, as indicated, with renin–angiotensin system inhibitors. Despite 3 years of sustained serum urate reduction, there was no evidence of a difference between the allopurinol group and the placebo group in the primary outcome, the baseline-adjusted iohexol-based GFR after a 2-month washout period. In addition, we found no evidence of a clinically meaningful benefit with regard to secondary outcomes, including the iohexol-based GFR at the end of the intervention period, the iohexol-based and estimated GFR slopes, and serum creatinine doubling or progression to end-stage kidney disease in a time-to-event analysis. Prespecified subgroup analyses did not show heterogeneity in the effect of allopurinol on the primary outcome. Therefore, a reduction in the serum urate level by allopurinol did not appear to effectively alter the progression of diabetic kidney disease at early-to-moderate stages in persons with type 1 diabetes.
Several features of the trial make this conclusion robust. First, the rate of kidney-function decline (mean overall iohexol-based GFR slope in the placebo group, −2.5 ml per minute per 1.73 m2 per year) was consistent with clinically significant progression of diabetic kidney disease,31 which confirms the suitability of this trial population for the study of interventions to reduce the decline in renal function. Second, this population provided the trial with more than 80% power to detect a clinically meaningful treatment effect on GFR (i.e., a decline in GFR that was 1 ml per minute per 1.73 m2 per year slower with allopurinol than with placebo, which is equivalent to an approximately 9-year postponement of end-stage kidney disease in this population). Third, adherence to the trial intervention was high, leading to a sustained reduction of 36% in the serum urate level in the allopurinol group during the intervention period. Fourth, other factors that potentially influence GFR decline, such as glycemia, blood pressure, and renin–angiotensin inhibition, were balanced between the two groups at baseline and throughout the trial. Fifth, the results for the secondary outcomes were consistent with those for the primary outcome. In fact, for the urinary albumin excretion rate, there was the suggestion of a worse outcome in allopurinol-treated participants than in those who received placebo. However, independent validation of this finding in other cohorts of patients with diabetic kidney disease is necessary before safety concerns for allopurinol are raised in this regard.
The findings of our trial differ from those of two smaller trials that had, in part, provided the impetus for our trial. Siu et al.21 randomly assigned 51 patients (24% of whom had diabetes) to receive allopurinol or placebo for 12 months. At baseline, the mean serum urate level was more than 9.5 mg per deciliter (560 μmol per liter), and the mean serum creatinine level more than 1.6 mg per deciliter (140 μmol per liter). They found less decline in kidney function (defined as an increase of ≥40% in the serum creatinine level or end-stage kidney disease) in the allopurinol group than in the placebo group. Goicoechea et al.19,20 randomly assigned 113 patients (21% of whom had diabetes; the mean age of the patients was approximately 20 years older than in our trial) to receive allopurinol or placebo for 24 months. At the end of this period, the estimated GFR had increased from baseline by 1.3 ml per minute per 1.73 m2 in the allopurinol group, whereas it had decreased by 3.3 ml per minute per 1.73 m2 in the placebo group. Among these patients overall, the mean estimated GFR at baseline was approximately 40 ml per minute per 1.73 m2, and the mean serum urate level was 7.6 mg per deciliter (450 μmol per liter). Thus, in addition to the participants being older in their trial than those in ours, the baseline GFR was lower and the serum urate level higher in both these earlier trials than in ours.19–21 Although it is possible that a reduction in the serum urate level might have been more effective in slowing the decline in GFR in persons who had more advanced chronic kidney disease or higher serum urate levels (or both) than the patients in our cohort, we found no effect modification by these factors in our secondary analyses. Another recent trial, CKD-FIX (Controlled Trial of Slowing of Kidney Disease Progression from the Inhibition of Xanthine Oxidase),32 did not show a beneficial effect of allopurinol therapy on the estimated GFR decline in persons who had a lower estimated GFR at baseline (mean, 31.7 ml per minute per 1.73 m2) and a higher serum urate level at baseline (mean, 8.2mg per deciliter [490 μmol per liter]) than the patients in our trial.
Our findings might be considered to be inconsistent with observational studies that have indicated that elevated serum urate levels are strong and independent predictors of albuminuria and early GFR decline in persons with type 1 and type 2 diabetes.14 Population-based association studies, however, cannot prove causation. Recent studies with the use of mendelian randomization methods in large population-based cohorts, including one with type 1 diabetes, showed no causal effects of the serum urate level on the estimated GFR or on the risk of chronic kidney disease, despite finding positive associations between the serum urate level and these outcomes.33,34 One explanation may be that other traits that are associated with serum urate levels (e.g., by means of transcriptional co-regulation35) are causally related to diabetic kidney disease.
Our trial had many strengths, including adequate power, a rigorous protocol, and high participant adherence, which resulted in sustained reduction in the serum urate level in the allopurinol group. However, some potential limitations should be acknowledged. If urate promotes kidney damage with long-term exposure, a trial of longer duration might be necessary to reveal differences between groups, although the virtually identical primary outcome in the two groups in this trial makes this unlikely. Treatment with renin–angiotensin system inhibitors, except if contraindicated or considered to be unnecessary, was a trial eligibility criterion. Although a reduction in the serum urate level with allopurinol therapy may provide benefit in the absence of these drugs,36 it was not possible to test this because renin–angiotensin system inhibitors, as used in this trial, represent the standard of care.12
Although our trial of serum urate reduction in patients with diabetic kidney disease was large, data on the primary outcome were missing and were imputed in approximately 20% of the participants. However, given the results of a sensitivity analysis supporting the robustness of the imputation process, we think the effect of those missing data was limited. Also, there were relatively small participant numbers within certain clinical strata, which limited the power of subgroup analyses to detect heterogeneity in allopurinol effects. Given the preponderance of white patients in this trial, the results may not be fully applicable to other races or ethnic groups. Similarly, the results should not be generalized to patients with other stages of diabetic kidney disease; to patients with type 2 diabetes, in whom increased serum urate may relate to other processes, such as the metabolic syndrome37; or to patients with other causes of chronic kidney disease. However, the similarly neutral results of CKD-FIX32 make it unlikely that reduction in the serum urate level would benefit persons with these other conditions.
Despite achieving full enrollment and participant completion targets and observing a sustained 36% reduction in the serum urate level throughout this 3-year trial, we did not find evidence of a clinically meaningful benefit of allopurinol treatment on kidney outcomes among patients with type 1 diabetes and early-to-moderate diabetic kidney disease who were treated with renin–angiotensin system inhibitors.
Supplementary Material
Acknowledgments
Supported by grants from the NIDDK (R03-DK-094484, R34- DK-097808, UC4-DK-101108, P30-DK-036836, and P30-DK-020572), the JDRF (17-2012-377), the National Center for Advancing Translational Sciences (UL1-TR-002494, UL1-TR- 001422, UL1-TR-002556, UL1-TR-002319, and UL1-TR- 001105), and the National Institute on Aging (Claude Pepper Center grant number, P30-AG-024824).
Dr. Doria reports receiving grant support, paid to Joslin Diabetes Center, from Sanofi-Aventis US; Dr. Pop-Busui, receiving grant support, paid to the University of Michigan, from AstraZeneca and consulting fees from Bayer, Boehringer Ingelheim, and Novo Nordisk; Dr. Lingvay, receiving advisory board fees and consulting fees from AstraZeneca, advisory board fees from Boehringer Ingelheim, consulting fees from Eli Lilly, Intarcia Therapeutics, Janssen Global Services, Target Pharma Solutions, and Valeritas Holdings, grant support, paid to her institution, from Mylan Pharmaceuticals and Pfizer, grant support, paid to the University of Texas Southwestern, advisory board fees, consulting fees, and travel support from Novo Nordisk, and advisory board fees from Sanofi US Services; Dr. Rossing, receiving advisory board fees from Astellas Pharma, Boehringer Ingelheim, and Sanofi US Services, advisory board fees and fees for serving on a steering committee from AstraZeneca, Bayer HealthCare, and Novo Nordisk, consulting fees from Eli Lilly, and fees for serving on a steering committee from Gilead Sciences; Dr. Aron-on, receiving grant support and consulting fees from AstraZeneca Canada, Becton Dickinson Technologies, Boehringer Ingelheim, Eli Lilly, Janssen Global Services, Novo Nordisk, and Sanofi US Services, grant support from Bausch Health, Bayer, Dexcom, Insulet, Kowa American, Medpace, Tandem Diabetes Care, Xeris Pharmaceuticals, and Zealand Pharma, and consulting fees from Gilead Sciences, HTL-STREFA, and Merck; Dr. Caramori, receiving advisory board fees and presentation fees, paid to her institution, from Bayer; Dr. Crandall, receiving grant support from Abbott Diabetes Care; Dr. de Boer, receiving advisory fees from Boehringer Ingelheim, George Clinical, Goldfinch Bio, and Ironwood Pharmaceuticals; Dr. Goldfine, being employed by Novartis; Dr. Hirsch, receiving consulting fees from Abbott Diabetes Care, Bigfoot Biomedical, and Roche Diabetes Care and grant support, paid to the University of Washington, from Medtronic MiniMed; Dr. Karger, receiving grant support, paid to the University of Minnesota, from Kyowa Kirin and Siemens; Dr. Maahs, receiving consulting fees from Abbott Diabetes Care, grant support, paid to Stanford University, from Dexcom and Tandem Diabetes Care, and advisory board fees from Eli Lilly, Medtronic USA, Novo Nordisk, and Sanofi Pasteur; Dr. Molitch, receiving consulting fees and fees for serving as an expert witness from Janssen Biotech, fees for serving on a data and safety monitoring committee from Merck and Pfizer, and grant support, paid to Northwestern University, from Novartis and Novo Nordisk; Dr. Perkins, receiving consulting fees from Boehringer Ingelheim; Dr. Polsky, receiving grant support from Dexcom, Daisome Pharmaceuticals, Eli Lilly, Lexicon Pharmaceuticals, and Sanofi US Services, and grant support and advisory board fees from Medtronic MiniMed; Dr. Rosas, receiving grant support and advisory board fees from Bayer Health-Care Pharmaceuticals, grant support from Gilead Sciences, Idorsia, Ironwood Pharmaceuticals, and Janssen Pharmaceuticals, and advisory board fees from Reata Pharmaceuticals; Dr. Senior, receiving advisory board fees from Abbott Canada, AstraZeneca Canada, Boehringer Ingelheim, Eli Lilly, Janssen Biotech, Merck, and Sanofi Pasteur, grant support, paid to the University of Alberta, from Allergan, and grant support, paid to the University of Alberta, and advisory board fees from Novo Nordisk; Dr. Tuttle, receiving consulting fees from AstraZeneca, Boehringer Ingelheim, Eli Lilly, Gilead Sciences, Goldfinch Bio, and Novo Nordisk and honoraria from Bayer; Dr. Wallia, receiving grant support from Novo Nordisk; and Dr. Weinstock, receiving grant support, paid to the Research Foundation of SUNY, from Boehringer Ingelheim, Dexcom, Diasome Pharmaceuticals, Eli Lilly, Insulet, Medtronic MiniMed, Mylan Pharmaceuticals, Oramed Pharmaceuticals, and Tolerion and consulting fees from InsuLogix. No other potential conflict of interest relevant to this article was reported.
Footnotes
The full list of the PERL Study Group members is provided in the Supplementary Appendix, available at NEJM.org.
The views expressed in this article are solely the responsibility of the authors and do not necessarily represent the official views of the National Institutes of Health (NIH), the National Institute of Diabetes and Digestive and Kidney Diseases (NIDDK), the National Institute on Aging, JDRF, or GE Healthcare.
A data sharing statement provided by the authors is available with the full text of this article at NEJM.org.
Disclosure forms provided by the authors are available with the full text of this article at NEJM.org.
We thank the patients for participating in this long and demanding trial; the data and safety monitoring board members (Linda Fried, Ananda Basu, Melanie Blank, Tom Greene, Lawrence Holzman, Charity G. Moore Patterson, and John Sedor); NIH officers Teresa Jones, Robert Star, and Michael Flessner and regulatory program specialist Catherine Carr for guidance; the staff of Green Mountain Pharmaceuticals and Belmar Pharmacy (Lakewood, CO) for preparing and distributing allopurinol and placebo; all the research coordinators (Daphne Adelman, Gayatri Anupindi, Cathy Bagne, Mary Bates, Karen Belanger, Emily Boone, Jane Bulger, Leslie Cham, Jing H. Chao, Mary Ann Clear-waters, Mary Jane Clifton, Hector Com, Kristie DeHaan, Tineke Dineen, Amy Dunlop, Sara Eischen, C. Marcelo Falappa, Lestat Feliciano, Birgit Fink, Benjamin Flagg, Victoria Gage, Jason Gensler, Anne Goodling, Monica Hartmuller, Jessie Arman Hermann, Madeleine Hermans, Xinli Huang, Karen Hyams, Marla Inducil, Lone Jelstrup, Florence John, Yvette Kowalski, Vesta Lai, Lee-Ann Langkaas, Diane Larsen, Virginia Leone, Camilla Levister, Dawn Lum, Caroline Lyster, Maria Maione, Elaine Massaro, Jennifer McCance, Christine Mendonca, Sara R. Meyers, Joan Milton, Cindy A. Murphy, Andrej Orszag, Cynthia Plunkett, Carmyn Polk, Laurentiu Pop, Frederik Persson, Danielle Powell, Chinmaya Rajderkar, Clementina Ramos Garrido, Carol Recklein, Marilyn Richardson, Nicole Robinson, Lauri Schafer, Michelle Smith, Anna-Kay Thompson, Lindsey Towers, Josephine Tse, Joanie Tsougrianis, Victoria Tully, Sara Vecchi, Katherine Wilder, Tanisha Wilma, and Brittany Williams); Trudy Strand and Debra Conboy for leading the team of coordinators; Donna DiFranco, Glen Feak, Vasundhara Goplani, Eric Henricks, Lisa Holloway, Navasuja Kumar, Brooke Kilyanek, Ariane Nguyen, and Yi-Miau Tsai for work at the data coordinating center; Theresa Christiansen for serving as the trial pharmacologist; Massimo Pietropaolo for serving as the trial medical monitor; Annie Lukkari, Catherine Leiendecker Foster, and the staff of the Advanced Research and Diagnostic Laboratory at the University of Minnesota for laboratory measurements; and Geert Molen-berghs and Rod Little for comments and suggestions on the statistical analytic approaches.
Contributor Information
A. Doria, Research Division, Joslin Diabetes Center, and the Department of Medicine, Harvard Medical School, Boston
A.T. Galecki, Division of Geriatrics, Institute of Gerontology, University of Michigan, Ann Arbor; Department of Biostatistics, School of Public Health, University of Michigan, Ann Arbor
C. Spino, Department of Biostatistics, School of Public Health, University of Michigan, Ann Arbor; Statistical Analysis of Biomedical and Educational Research (SABER), University of Michigan, Ann Arbor
R. Pop-Busui, Department of Internal Medicine, Metabolism, Endocrinology, and Diabetes, University of Michigan, Ann Arbor
D.Z. Cherney, Departments of Medicine, Physiology, and Pharmacology and Toxicology, University of Toronto; Pharmacology and Toxicology, University of Toronto; Division of Nephrology, University Health Network
I. Lingvay, Departments of Medicine and Population and Data Sciences, University of Texas Southwestern Medical Center, Dallas
A. Parsa, Division of Kidney, Urologic, and Hematologic Diseases, National Institute of Diabetes and Digestive and Kidney Diseases, Bethesda, MD
P. Rossing, Steno Diabetes Center, and the Department of Clinical Medicine, University Copenhagen, Copenhagen
R.J. Sigal, Departments of Medicine, Cardiac Sciences, and Community Health Sciences, Faculties of Medicine and Kinesiology, University of Calgary, Calgary, AB
M. Afkarian, Division of Nephrology, Department of Medicine, University of California, Davis, California
R. Aronson, LMC Diabetes and Endocrinology, Toronto
M.L. Caramori, Departments of Medicine and Pediatrics, University of Minnesota, Minneapolis
J.P. Crandall, Division of Endocrinology and Fleischer Institute for Diabetes and Metabolism, Albert Einstein College of Medicine, New York
I.H. de Boer, Department of Medicine, University of Washington
T.G. Elliott, BCDiabetes, Vancouver, Canada
A.B. Goldfine, Research Division, Joslin Diabetes Center, and the Department of Medicine, Harvard Medical School, Boston
J.S. Haw, Department of Medicine, Emory University, Atlanta
I.B. Hirsch, Department of Medicine, University of Washington
A.B. Karger, Laboratory Medicine and Pathology, University of Minnesota, Minneapolis
D.M. Maahs, Department of Pediatrics and Stanford Diabetes Research Center, Stanford University, Palo Alto, California
J.B. McGill, Division of Endocrinology, Metabolism, and Lipid Research, Washington University School of Medicine, St. Louis
M.E. Molitch, Division of Endocrinology, Metabolism, and Molecular Medicine, Northwestern University Feinberg School of Medicine, Chicago
B.A. Perkins, Division of Endocrinology and Metabolism, University of Toronto; Division of Endocrinology and Metabolism, University of Toronto; and Lunenfeld–Tanenbaum Research Institute, Sinai Health System, Toronto
S. Polsky, Barbara Davis Center for Diabetes, University of Colorado, Aurora
M. Pragnell, JDRF (Juvenile Diabetes Research Foundation), New York
W.N. Robiner, Departments of Medicine and Pediatrics, University of Minnesota, Minneapolis
S.E. Rosas, Research Division, Joslin Diabetes Center, and the Department of Medicine, Harvard Medical School, Boston
P. Senior, Division of Endocrinology, University of Alberta, Edmonton, Canada
K.R. Tuttle, Nephrology Division , University of Washington; Institute of Translational Health Sciences, Kidney Research Institute, Seattle, Washington; Providence Health Care, Spokane, Washington
G.E. Umpierrez, Department of Medicine, Emory University, Atlanta
A. Wallia, Division of Endocrinology, Metabolism, and Molecular Medicine, Northwestern University Feinberg School of Medicine, Chicago
R.S. Weinstock, Department of Medicine, State University of New York Upstate Medical University, Syracuse
C. Wu, Division of Geriatrics, Institute of Gerontology, University of Michigan, Ann Arbor
M. Mauer, Departments of Medicine and Pediatrics, University of Minnesota, Minneapolis
REFERENCES
- 1.Costacou T, Orchard TJ. Cumulative kidney complication risk by 50 years of type 1 diabetes: the effects of sex, age, and calendar year at onset. Diabetes Care 2018;41:426–33. [DOI] [PMC free article] [PubMed] [Google Scholar]
- 2.The DCCT/EDIC Research Group. Intensive diabetes therapy and glomerular filtration rate in type 1 diabetes. N Engl J Med 2011;365:2366–76. [DOI] [PMC free article] [PubMed] [Google Scholar]
- 3.de Boer IH. Kidney disease and related findings in the Diabetes Control and Complications Trial/Epidemiology of Diabetes Interventions and Complications Study. Diabetes Care 2014;37:24–30. [DOI] [PMC free article] [PubMed] [Google Scholar]
- 4.Rosolowsky ET, Skupien J, Smiles AM, et al. Risk for ESRD in type 1 diabetes remains high despite renoprotection. J Am Soc Nephrol 2011;22:545–53. [DOI] [PMC free article] [PubMed] [Google Scholar]
- 5.Leslie RD. United Kingdom Prospective Diabetes Study (UKPDS): what now or so what? Diabetes Metab Res Rev 1999; 15:65–71. [DOI] [PubMed] [Google Scholar]
- 6.UK Prospective Diabetes Study Group. Efficacy of atenolol and captopril in reducing risk of macrovascular and microvascular complications in type 2 diabetes: UKPDS 39. BMJ 1998;317:713–20. [PMC free article] [PubMed] [Google Scholar]
- 7.Brenner BM, Cooper ME, de Zeeuw D, et al. Effects of losartan on renal and cardiovascular outcomes in patients with type 2 diabetes and nephropathy. N Engl J Med 2001;345:861–9. [DOI] [PubMed] [Google Scholar]
- 8.Lewis EJ, Hunsicker LG, Bain RP, Rohde RD. The effect of angiotensin-converting–enzyme inhibition on diabetic nephropathy. N Engl J Med 1993;329:1456–62. [DOI] [PubMed] [Google Scholar]
- 9.Lewis EJ, Hunsicker LG, Clarke WR, et al. Renoprotective effect of the angio- tensin-receptor antagonist irbesartan in patients with nephropathy due to type 2 diabetes. N Engl J Med 2001;345:851–60. [DOI] [PubMed] [Google Scholar]
- 10.Mathiesen ER, Hommel E, Hansen HP, Smidt UM, Parving HH. Randomised controlled trial of long term efficacy of captopril on preservation of kidney function in normotensive patients with insulin dependent diabetes and microalbuminuria. BMJ 1999;319:24–5. [DOI] [PMC free article] [PubMed] [Google Scholar]
- 11.Mauer M, Zinman B, Gardiner R, et al. Renal and retinal effects of enalapril and losartan in type 1 diabetes. N Engl J Med 2009;361:40–51. [DOI] [PMC free article] [PubMed] [Google Scholar]
- 12.National Kidney Foundation. KDOQI clinical practice guideline for diabetes and CKD: 2012 update. Am J Kidney Dis 2012;60:850–86. [DOI] [PubMed] [Google Scholar]
- 13.Tanamas SK, Saulnier PJ, Fufaa GD, et al. Long-term effect of losartan on kid- ney disease in American Indians with type 2 diabetes: A follow-up analysis of a randomized clinical trial. Diabetes Care 2016;39:2004–10. [DOI] [PMC free article] [PubMed] [Google Scholar]
- 14.Mauer M, Doria A. Uric acid and diabetic nephropathy risk. Contrib Nephrol 2018;192:103–9. [DOI] [PMC free article] [PubMed] [Google Scholar]
- 15.Hovind P, Rossing P, Tarnow L, Johnson RJ, Parving HH. Serum uric acid as a predictor for development of diabetic nephropathy in type 1 diabetes: an inception cohort study. Diabetes 2009;58:1668–71. [DOI] [PMC free article] [PubMed] [Google Scholar]
- 16.Jalal DI, Rivard CJ, Johnson RJ, et al. Serum uric acid levels predict the development of albuminuria over 6 years in patients with type 1 diabetes: findings from the Coronary Artery Calcification in Type 1 Diabetes study. Nephrol Dial Transplant 2010;25:1865–9. [DOI] [PMC free article] [PubMed] [Google Scholar]
- 17.Ficociello LH, Rosolowsky ET, Niewczas MA, et al. High-normal serum uric acid increases risk of early progressive renal function loss in type 1 diabetes: results of a 6-year follow-up. Diabetes Care 2010;33:1337–43. [DOI] [PMC free article] [PubMed] [Google Scholar]
- 18.Pilemann-Lyberg S, Hansen TW, Tofte N, et al. Uric acid is an independent risk factor for decline in kidney function, cardiovascular events, and mortality in patients with type 1 diabetes. Diabetes Care 2019;42:1088–94. [DOI] [PubMed] [Google Scholar]
- 19.Goicoechea M, de Vinuesa SG, Verdalles U, et al. Effect of allopurinol in chronic kidney disease progression and cardiovascular risk. Clin J Am Soc Nephrol 2010;5:1388–93. [DOI] [PMC free article] [PubMed] [Google Scholar]
- 20.Goicoechea M, Garcia de Vinuesa S, Verdalles U, et al. Allopurinol and progression of CKD and cardiovascular events: long-term follow-up of a randomized clinical trial. Am J Kidney Dis 2015; 65:543–9. [DOI] [PubMed] [Google Scholar]
- 21.Siu YP, Leung KT, Tong MK, Kwan TH. Use of allopurinol in slowing the progression of renal disease through its ability to lower serum uric acid level. Am J Kidney Dis 2006;47:51–9. [DOI] [PubMed] [Google Scholar]
- 22.Afkarian M, Polsky S, Parsa A, et al. Preventing Early Renal Loss in Diabetes (PERL) study: a randomized double-blinded trial of allopurinol — rationale, design, and baseline data. Diabetes Care 2019;42: 1454–63. [DOI] [PMC free article] [PubMed] [Google Scholar]
- 23.Gaspari F, Perico N, Remuzzi G. Measurement of glomerular filtration rate. Kidney Int Suppl 1997;63:S151–S154. [PubMed] [Google Scholar]
- 24.Gaspari F, Perico N, Matalone M, et al. Precision of plasma clearance of iohexol for estimation of GFR in patients with renal disease. J Am Soc Nephrol 1998;9:310–3. [DOI] [PubMed] [Google Scholar]
- 25.Ruggenenti P, Gaspari F, Cannata A, et al. Measuring and estimating GFR and treatment effect in ADPKD patients: results and implications of a longitudinal cohort study. PLoS One 2012;7(2):e32533. [DOI] [PMC free article] [PubMed] [Google Scholar]
- 26.Bove M, Cicero AFG, Borghi C. The effect of xanthine oxidase inhibitors on blood pressure and renal function. Curr Hypertens Rep 2017;19:95. [DOI] [PubMed] [Google Scholar]
- 27.Levey AS, Stevens LA, Schmid CH, et al. A new equation to estimate glomerular filtration rate. Ann Intern Med 2009;150: 604–12. [DOI] [PMC free article] [PubMed] [Google Scholar]
- 28.Rubin DB. Multiple imputation for nonresponse in surveys. New York: John Wiley, 1987. [Google Scholar]
- 29.van Buuren S Multiple imputation of discrete and continuous data by fully conditional specification. Stat Methods Med Res 2007;16:219–42. [DOI] [PubMed] [Google Scholar]
- 30.O’Kelly M, Ratitch B. Clinical trials with missing data: a guide for practitioners. New York: John Wiley, 2014. [Google Scholar]
- 31.Perkins BA, Ficociello LH, Ostrander BE, et al. Microalbuminuria and the risk for early progressive renal function decline in type 1 diabetes. J Am Soc Nephrol 2007;18:1353–61. [DOI] [PubMed] [Google Scholar]
- 32.Badve SV, Pascoe EM, Tiku A, et al. Effects of allopurinol on the progression of chronic kidney disease. N Engl J Med 2020;382:2504–13. [DOI] [PubMed] [Google Scholar]
- 33.Ahola AJ, Sandholm N, Forsblom C, Harjutsalo V, Dahlström E, Groop PH. The serum uric acid concentration is not causally linked to diabetic nephropathy in type 1 diabetes. Kidney Int 2017;91:1178–85. [DOI] [PubMed] [Google Scholar]
- 34.Jordan DM, Choi HK, Verbanck M, et al. No causal effects of serum urate levels on the risk of chronic kidney disease: a Mendelian randomization study. PLoS Med 2019;16(1):e1002725. [DOI] [PMC free article] [PubMed] [Google Scholar]
- 35.Tin A, Marten J, Halperin Kuhns VL, et al. Target genes, variants, tissues and transcriptional pathways influencing human serum urate levels. Nat Genet 2019; 51:1459–74. [DOI] [PMC free article] [PubMed] [Google Scholar]
- 36.Mazzali M, Kanellis J, Han L, et al. Hyperuricemia induces a primary renal arteriolopathy in rats by a blood pressure-independent mechanism. Am J Physiol Renal Physiol 2002;282:F991–F997. [DOI] [PubMed] [Google Scholar]
- 37.Yuan H, Yu C, Li X, et al. Serum uric acid levels and risk of metabolic syndrome: a dose-response meta-analysis of prospective studies. J Clin Endocrinol Metab 2015;100:4198–207. [DOI] [PubMed] [Google Scholar]
Associated Data
This section collects any data citations, data availability statements, or supplementary materials included in this article.