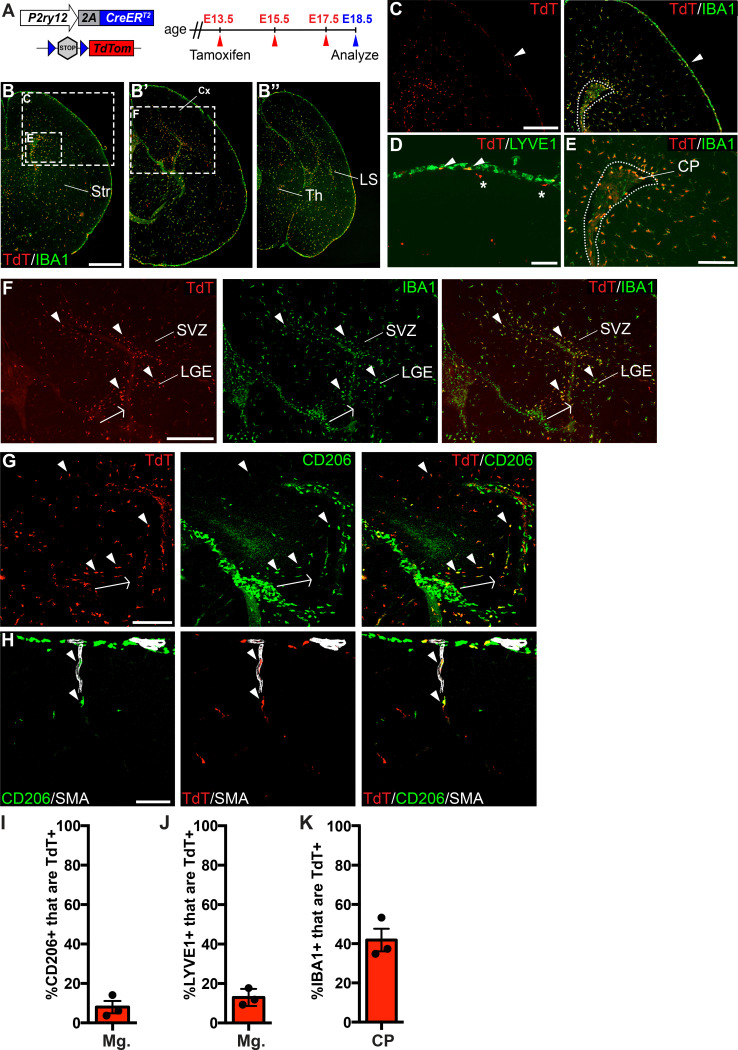
Figure 3. P2ry12-CreER recombination in the embryonic brain.
(A) Diagram of P2ry12-CreER; Rosa26Ai14 embryonic tamoxifen induction regimen. Pregnant mice were induced with tamoxifen at E13.5, E15.5 and E17.5. Embryos were collected at E18.5. (B) Recombination in the E18.5 brain, shown in three images, arranged rostral (B) to caudal (B’’). (C) P2ry12-CreER; Rosa26Ai14 recombination in the developing cerebral cortex. Recombination was seen primarily in the parenchyma of the brain, with low levels of recombination in the meninges (arrowhead). This is quantified in I and J. (D) Recombination in LYVE1+ cells of the embryonic meninges (arrowheads). Recombination in microglia is noted with asterisks. (E) Recombination in IBA1+ cells of the choroid plexus, quantified in K. (F) Recombination was most concentrated in IBA1+ cells of the hippocampal and cortical SVZ (arrowheads). (G) CD206 staining of recombined cells of the hippocampal SVZ and cortical SVZ. CD206 expression was lower, and coexpression with TdT less frequent, with greater distance from the hippocampus. (H) Recombination was observed in SMA-adjacent CD206+ perivascular macrophages at E18.5 (arrowheads). (I–J) Quantification of recombination in meningeal CD206+ (I) and LYVE1+ (J) macrophages. (K) Quantification of recombination in embryonic choroid plexus IBA1+ macrophages. Cx = Cortex, LGE = lateral ganglionic eminence, LS = Lateral migratory stream, Str = Striatum, Th = Thalamus, SVZ = Subventricular zone. Scale bars = 800 µm (B), 400 µm (C, F), 100 µm (D, G, H), 200 µm (E).

