

Summary
Cells have many types of actin structures, which must assemble from a common monomer pool. Yet, it remains poorly understood how monomers are distributed to and shared between different filament networks. Simplified model systems suggest that monomers are limited and heterogeneous, which alters actin network assembly through biased polymerization and internetwork competition. However, less is known about how monomers influence complex actin structures, where different networks competing for monomers overlap and are functionally interdependent. One example of this is the leading edge of migrating cells, which contains filament networks generated by multiple assembly factors. The leading edge dynamically switches between the formation of different actin structures, such as lamellipodia or filopodia, by altering the balance of these assembly factors’ activities. Here we sought to determine how the monomer binding protein profilin 1 (PFN1) controls the assembly and organization of actin in mammalian cells. Actin polymerization in PFN1 knockout cells was severely disrupted, particularly at the leading edge, where both Arp2/3 and Mena/VASP-based filament assembly was inhibited. Further studies showed that in the absence of PFN1, Arp2/3 no longer localizes to the leading edge and Mena/VASP is non-functional. Additionally, we discovered that discrete stages of internetwork competition and collaboration between Arp2/3 and Mena/VASP networks exist at different PFN1 concentrations. Low levels of PFN1 caused filopodia to form exclusively at the leading edge, while higher concentrations inhibited filopodia and favored lamellipodia and pre-filopodia bundles. These results demonstrate that dramatic changes to actin architecture can be made simply by modifying PFN1 availability.
Keywords: Actin, monomer, assembly, polymerization, profilin, leading edge, lamellipodia, filopodia, Arp2/3, Mena/VASP
Graphical Abstract
Introduction
To divide, move, and communicate, cells rely on a dynamic actin cytoskeleton that can rapidly assemble and adapt. This is achieved by the polymerization of actin monomers into filaments, the construction of large filament networks, and the disassembly of these networks back into monomers. To meet the demands of actin network assembly, cells maintain a large monomer reserve [1, 2]. Several factors complicate how monomers are distributed to different actin structures within the cell [3]. Monomers can undergo biased assembly into specific networks through interactions with polymerases and monomer-binding proteins [4, 5]. Monomers can also be subcellularly localized [6, 7] or recycled back to structures from where they originated [8]. Actin isoforms can exhibit differential assembly [9], dynamics [10], and regulation by post-translational modifications [11]. Finally, the monomer/filament ratio is in homeostasis [12], which causes networks competing for monomers to alter their growth based on the activity or expression level of different assembly factors [4, 5, 12, 13]. Thus, the rules that govern how monomers are allocated are complicated, with many details remaining undefined.
Monomer-binding proteins control the localization of monomers and their assembly into filaments [3]. Of these, the most conserved and abundantly expressed is profilin. In Acanthamoeba cells, most monomers are profilin-bound [14]. Profilin to actin expression ratios suggest a similar phenomenon in mammalian cells [15]. Profilin prevents spontaneous nucleation and facilitates nucleotide exchange to generate the polymerization competent form of actin [16, 17]. Profilin also directs monomers to the fastgrowing (barbed) ends of actin filaments [18] by interacting with formins [19, 20] and Mena/VASP [21, 22] and enhancing their ability to polymerize actin. Although profilin has been shown to suppress branching of the multi-component assembly factor Arp2/3 [4, 5, 23, 24], it can supply monomers to Arp2/3-driven networks through interactions with WASP-family proteins [25-27]. Thus formins, Mena/VASP, and Arp2/3 all utilize profilin-actin [27-29], which can cause internetwork competition [5, 30].
Monomer competition has largely been inferred from experimental systems where actin networks are spatially and functionally distinct. These include biochemical assays [12, 31] and in vivo experiments in yeast, where monomers polymerize into either Arp2/3-driven patches or formin-based cables [32]. Metazoan cells, however, contain actin structures where complex filament architectures are constructed by multiple assembly factors. For example, actin filaments at the leading edge of a migrating mammalian cell are simultaneously assembled by Arp2/3, formins, and Mena/VASP. Varying assembly factor activity can result in the formation of different actin structures, such as lamellipodia or filopodia [33-36]. It remains poorly understood how the monomer pool regulates the assembly and organization of these types of actin superstructures, where networks competing for monomers overlap and are functionally interdependent.
In this study, we dissect how actin assembly factors collectively construct complex actin networks through Profilin 1 (PFN1). Using PFN1 knockout/rescue experiments, we demonstrate that PFN1 controls the majority of actin polymerization in neuronal cells, determines the monomer to filament set point, and facilitates homeostatic interplay between different actin networks. These properties extend to PFN1’s regulation of actin at the leading edge, where it coordinates the localization and activity of different actin assembly factors in a concentration-dependent manner and determines which leading edge structures assemble. Thus, monomer distribution through PFN1 is a major determinant of actin assembly, organization, and homeostasis in cells and is a critical regulator of complex actin architectures.
Results
The majority of actin assembly in CAD cells is PFN1-dependent
We knocked out the PFN1 gene with CRISPR/Cas9 in Cath.a differentiated (CAD) cells. CAD cells were chosen for this study because we have previously characterized how their monomer pool influences actin network behavior [6, 8, 10, 37] and because PFN1 is the predominant profilin isoform. PFN2 is expressed approximately 10-fold less than PFN1, while PFN3 and PFN4 are not expressed. Importantly, PFN2 expression doesn’t change upon PFN1 deletion (Data S1), which is consistent with studies showing that these isoforms cannot compensate for each other [38]. Additionally, very few other actin-binding proteins are differentially expressed when PFN1 is knocked out (Data S1, Figure. S1). Loss of PFN1 was verified by western blot (Figures. 1A, B). The actin cytoskeleton is drastically altered in PFN1 KO cells, but can be rescued with physiologically relevant expression levels of GFP-PFN1 (Figures. 1A, B).
Figure 1. The majority of actin assembly in CAD cells is PFN1-dependent.

(A) Western blot for profilin 1 (PFN1) of control (Ctrl) and PFN1 knockout (KO) CAD cells transfected with GFP or GFP- PFN1 (PFN1). (B) Representative images of the actin cytoskeleton in control and PFN1 KO cells transfected with GFP or GFP-PFN1. Actin filaments were labeled with Alexa568-phalloidin. Scale bar, 10 μm. (C) Western blot for actin in control and PFN1 KO cells expressing GFP or GFP-PFN1. Cell lysates were subjected to ultracentrifugation to separate monomers and filaments. Actin monomers (G-actin, designated as ‘G’) remain in the supernatant while filaments (F-actin, designated as ‘F’) sediment to the pellet. (D) Quantification of the G/F-actin ratio from (C). Individual data points are plotted along with the mean and 95% confidence intervals. Number of biological replicates is as follows: control + GFP (n = 6), PFN1 KO + GFP (n = 8), and PFN1 KO + GFP-PFN1 (n = 6). (E) Control and PFN1 KO cells transfected with GFP, GFP-PFN1 (GFP-PFN1WT), or the non-actin binding PFN1 mutant R88E (GFP-PFN1R88E). Actin filaments have been labeled with Alexa568-phalloidin. The images are scaled identically and pseudocolored based on the included lookup table to convey relative fluorescent intensities. Scale bar, 10 μm. (F) Quantification of mean Alexa568-phalloidin intensity in control and KO cells expressing GFP, GFP-PFN1R88E (R88E), or GFP-PFN1 (WT). Data are plotted relative to control cells expressing GFP. For control cells expressing GFP, GFP-PFNR88E or GFP-PFN1WT, n = 475, 166, and 206, respectively. For PFN1 KO cells expressing GFP, GFP-PFNR88E or GFP-PFN1WT, n = 446, 206, and 443, respectively. (G) Correlation between GFP and phalloidin intensity for cells in (E). Intensities were normalized to the mean of each data set.
Box-and-whisker plots in D,F denote 95th (top whisker), 75th (top edge of box), 25th (bottom edge of box), and 10th (bottom whisker) percentiles and the median (bold line in box). p values plotted relative to control + GFP, unless otherwise indicated. **** indicates p ≤ 0.0001, n.s. = not significant (p > 0.05). p values were generated by ANOVA followed by Tukey’s post hoc test (comparison of ≥ 3 conditions).
We first sought to determine how actin polymerization is disrupted in the absence of PFN1. Western blot quantification of monomer and filament-containing cellular fractions revealed that the ratio of monomeric to polymerized actin is 3:1 in PFN1 KO cells (Figures. 1C, D), and can be rescued to the control cell ratio by expressing GFP-PFN1 (Figures. 1C, D). Quantitative image analysis of cells labeled with fluorescent phalloidin was then used to measure relative amounts of actin filaments. Filament levels in PFN1 KO cells were reduced more than 50% in comparison to control cells (Figures. 1E, F). This phenotype could be rescued by expression of wild-type GFP-PFN1 but not the non-actin binding R88E mutant [39] (Figures. 1E, F). Conversely, overexpressing PFN1 in control cells caused an increase in filamentous actin (Figures. 1E, F). While knocking out PFN1 caused a 25% (±5) reduction in actin expression (Figure. S2), this was insufficient to explain the substantially larger decrease in polymerized actin levels in PFN1 KO cells (Figures. 1E, F) and the reciprocal increase in the monomer/filament ratio (Figures. 1C, D). The substantial inability of actin to polymerize in PFN1 KO cells is likely due to a combinatorial increase in filament capping [40], loss of barbed-end polymerase activity [20, 21], decrease in actin nucleotide exchange [17], and increase in monomer sequestering by thymosin β-4 [41].
We also performed a correlation analysis between PFN1 expression and actin polymerization to determine if actin assembly scaled with PFN1 expression in individual cells. In control and KO cells, there is a modest but significant positive correlation between actin filament levels and PFN1 expression, but not with expression of GFP or GFP-PFN1R88E (Figure. 1G). Interestingly, the R88E mutant had a slightly dominant negative effect on actin polymerization, most likely due to binding poly-L-proline residues but not actin [39]. These results demonstrate that the PFN1 expression level helps to determine the monomer/filament ratio.
PFN1 controls the assembly and architecture of filament networks at the leading edge
PFN1 KO cells had significantly altered networks at the leading edge (Figure. 2A). To quantify this change, we measured relative filamentous actin in the leading edge vs. the rest of the cell (Figures. 2B, C, see Materials and Methods for details). In control and PFN1 KO cells rescued with EGFP-PFN1, the percentage of total polymerized actin at the leading edge was approximately 60%, but was reduced by half in PFN1 KO cells rescued with GFP or GFP-PFN1R88E (Figures. 2B, C). To determine if this was due to reduced filament assembly, we labeled sites of active polymerization [42] (see Material and Methods for details). PFN1 KO cells have approximately 50% fewer actively polymerizing filaments at the leading edge than control cells (Figures. 2D, E). Thus, the largest defects in actin assembly of PFN1 KO cells were at the leading edge.
Figure 2. PFN1 controls the assembly and architecture of filament networks at the leading edge.

(A) Representative confocal super-resolution images of control and PFN1 KO cells expressing GFP, GFP-PFN1R88E, or GFP-PFN1WT and labeled with Alexa568-phalloidin. Insets highlight actin at the leading edge. Inset scale bar, 5 μm. Scale bar for whole cell, 10 μm. (B) Representative segmentation of the lamellipodia from the cell center for control and PFN1 KO cells expressing GFP, GFP-PFN1R88E, or GFP-PFN1WT (C) Lamellipodia sum intensity normalized to total cellular F-actin for control and PFN1 KO cells expressing GFP, GFP-PFN1R88E (R88E), or GFP-PFN1WT (WT) and labeled with Alexa568-phalloidin. For control cells n= 32, for PFN1 KO cells expressing GFP, GFP-PFNR88E or GFP-PFN1WT, n = 35, 26, 28, respectively. (D) Confocal images showing actin filaments (Phalloidin) and barbed ends (Rhodamine Actin) in control and PFN1 KO cells. Cells were gently permeabilized and incubated with rhodamine actin in polymerization buffer for 60 s to label actin filament barbed ends. They were then fixed and incubated with Alexa488-phalloidin to label actin filaments. Black scale bar, 10 μm. Red scale bar, 2 μm (E) Quantification of barbed ends in control and PFN1 KO cells by measuring sum rhodamine actin fluorescence. Fluorescence intensity is plotted relative to control cells. For control cells n = 30, for PFN1 KO cells, n = 25.(F) Representative confocal super-resolution images of the leading edge of control and PFN1 KO cells expressing GFP, GFP-PFN1R88E, or GFP-PFN1WT and labeled with Alexa568-phalloidin. Results from linear array segmentation analysis are outlined in red. Scale bar, 5 μm. (H and I). (G) Linescan analysis of the leading edge of control and PFN1 KO cells expressing GFP, GFP-PFN1R88E, or GFP-PFN1WT labeled with Alexa568-phalloidin. The transparent bands depict 95% confidence intervals. For all conditions, n = 400 lines drawn from 20 cells. (H and I) Quantification of linear arrays at the leading edge of control and PFN1 KO cells expressing GFP, GFP-PFN1R88E or GFP-PFN1WT. Linear array area and density measurements of control cells expressing GFP (n = 5075 arrays, 28 cells), GFP-PFN1R88E (n = 1937 arrays, 17 cells) or GFP-PFN1WT (n = 2813 arrays, 20 cells) and PFN1 KO cells expressing GFP (n = 1559 arrays, 15 cells), GFP-PFN1R88E (n = 1903 arrays, 25 cells) or GFP-PFN1WT (n = 2688 arrays, 15 cells). Area measures the size of individual arrays. Density was measured by normalizing the linear array count to the cell perimeter.
Box-and-whisker plots in C,E,H,I denote 95th (top whisker), 75th (top edge of box), 25th (bottom edge of box), and 10th (bottom whisker) percentiles and the median (bold line in box). p values plotted relative to control + GFP, unless otherwise indicated. **** indicates p ≤ 0.0001, *** p ≤ 0.001, ** indicates p ≤ 0.01, n.s. = not significant (p > 0.05). p values were generated by either a two-tailed student’s t-test (comparison of two conditions) or by ANOVA followed by Tukey’s post hoc test (comparison of ≥ 3 conditions). For (H) Dunn’s post hoc test was used to generate p-values after normality of the data was assessed.
See also Figure S5.
The architecture of actin filament networks at the leading edge of PFN1 KO cells was also dramatically altered (Figures. 2F). Linescan analysis (see Figure. S5 for a schematic on how linescan analysis was performed) revealed that lamellipodia were smaller and contained less actin in PFN1 KO cells (Figures. 2A-C,G). We also quantified pre-filopodia bundles actin structures (see Materials and Methods for details), which are the predominant products of formins and Mena/VASP [33, 34, 43]. Here, they are referred to as linear filament arrays. Linear array area and density were both substantially reduced in PFN1 KO cells (Figures. 2H, I). All leading edge phenotypes in PFN1 KO cells could be rescued by expressing GFP-PFN1WT but not GFP-PFN1R88E (Figures. 2A-C,F-I). PFN1 overexpression in control cells reduced lamellipodia (Figures. 2G) and increased the size of linear arrays (Figure. 2H), further demonstrating that PFN1 expression alters the assembly of different actin networks.
PFN1 maintains homeostasis between Arp2/3 dependent and independent networks
In yeast, there is a monomer/filament set point which creates internetwork homeostasis, where inhibiting Arp2/3-driven actin patches causes a reciprocal increase of formin-based actin cables [4, 12]. To determine if PFN1 was needed to maintain internetwork homeostasis in mammalian cells, we measured polymerized actin levels after assembly factor inhibition. As predicted by previous work [4, 5], filament levels were maintained in control cells after inhibition of Arp2/3 (Figure. 3A) with the small molecule inhibitor CK-666 [44]. However, inhibiting Arp2/3 in PFN1 KO cells caused a significant reduction in polymerized actin (Figure. 3B). Thus, Arp2/3-based networks can assemble without PFN1, but monomers are no longer able to undergo compensatory network assembly when Arp2/3 is inhibited.
Figure 3. PFN1 maintains homeostasis between Arp2/3 dependent and independent networks.

(A-D) Representative images and quantification of mean Alexa568-phalloidin intensity in control and PFN1 KO cells, where Arp2/3 or Mena/VASP were inhibited. The images are scaled identically and pseudocolored based on the included lookup table to convey relative fluorescent intensities. Scale bar, 10 μm. (A,B) Control and PFN1 KO cells were pre-treated with control (CK-689) or Arp2/3 (CK-666) small molecule inhibitors for 1 hour prior to fixation and labeling with Alexa568-phalloidin. (A) For control cells n = 154 for CK-689 and 93 for CK-666. (B) For PFN1 KO cells n = 111 for CK-689 and 119 for CK-666. (C,D) Control and PFN1 KO cells were transfected with the Mena/VASP targeted and mitochondria sequestering construct FP4 mito, or its AP4 mito control, for 16 hour prior to fixation and labeling with Alexa568-phalloidin. (C) For control cells n = 89 for AP4 mito and n = 94 for FP4 mito. (D) For PFN1 KO cells n = 79 for AP4 mito and n = 96 for FP4 mito.
Box-and-whisker plots in A,B,C,D denote 95th (top whisker), 75th (top edge of box), 25th (bottom edge of box), and 10th (bottom whisker) percentiles and the median (bold line in box). **** indicates p ≤ 0.0001, n.s. = not significant (p > 0.05). p values were generated by ANOVA followed by Tukey’s post hoc test (comparison of ≥ 3 conditions).
See also Figure S3
We also induced loss of function of Mena/VASP proteins by targeting them to mitochondria (Figure. S3) with the FP4-Mito construct [45]. FP4-Mito did not alter actin polymerization levels in PFN1 KO cells (Figure. 3D) but did reduce actin filaments by 30% in control cells by comparison to expression of the AP4-Mito control vector (Figure. 3C). This result supports prior work demonstrating that Mena/VASP requires profilin-actin for its polymerase activity [21]. Also, it demonstrates that unlike with Arp2/3, actin assembly by Mena/VASP is not in homeostasis with other networks, suggesting an exclusive use of PFN1-actin.
PFN1 is necessary for Arp2/3 and Mena/VASP activity at the leading edge
Next, we sought to understand how PFN1 contributes to Arp2/3 and Mena/VASP activity at the leading edge. Immunocytochemistry demonstrated that Arp2/3 and Mena both localized to the cell periphery in control cells (Figures. 4A-C), as expected. However, despite no change in expression levels (Figure. S4), Arp2/3 and Mena distribution was dramatically altered in PFN1 KO cells. Arp2/3 was substantially depleted from the leading edge (Figures. 4A-B) and exhibited a higher colocalization with punctate actin structures in the cell center. Mena’s leading edge localization was significantly increased (Figures. 4A, C). Experiments where Arp2/3 was inactivated revealed a significant loss of polymerized actin from the cell center, but not the leading edge in both control and PFN1 KO cells (Figures. 4G, H), indicating that Arp2/3 is still functional without PFN1. The opposite was true for Mena/VASP proteins, where inducing their loss of function with FP4-Mito only depleted leading edge actin in the presence of PFN1 (Figures. 4I, J), indicating that despite their enhanced localization to the cell edge in PFN1 KO cells (Figures. 4A, C), they are not participating in actin assembly.
Figure 4. Arp2/3 is depleted from the leading edge and Mena/VASP is inert in PFN1 KO cells.

(A) Representative images of ARPC2 and Mena immunolabeling in control and PFN1 KO cells. Scale bar, 10 μm. (B) Linescan analysis of ARPC2 immunolabeling at the leading edge of control and PFN1 KO cells expressing GFP or GFP-PFN1. The transparent bands depict 95% confidence intervals. For all conditions n = 300 linescans from 15 cells. (C) Linescan analysis of Mena immunolabeling at the leading edge of control and PFN1 KO cells expressing GFP or GFP-PFN1. The transparent bands depict 95% confidence intervals. For all conditions n = 400 linescans from 20 cells. (D) Representative confocal super-resolution images of control and PFN1 KO cells stained for ARPC2 and labeled with Alexa568-phalloidin. Scale bar, 10 μm. Insets highlight the colocalization of ARPC2 and phalloidin at the interior of PFN1 KO cells but not in control cells. (E) Scatterplots displaying overlap of ARPC2 and phalloidin intensity at the leading edge (L.E.) and cell center (C.C.) of control and PFN1 KO cells. (F) Quantification of Mander’s overlap coefficient for phalloidin with ARPC2 at the L.E. and C.C. of control and PFN1 KO cells. N=20 for both control and PFN1 KO cells. (G) Representative confocal super-resolution images of the leading edge of control and PFN1 KO cells that were pre-treated with control (CK-689) or Arp2/3 (CK-666) small molecule inhibitors for 1 hr prior to fixation and labeling with Alexa568-phalloidin. Scale bar 10 μm. (H) Lamellipodia sum intensity normalized to total cellular F-actin for control and PFN1 KO cells treated with CK-689 or 666 and labeled with Alexa568-phalloidin. For control cells treated with CK-689, CK-666, n = 26, 30 respectively. For PFN1 KO cells treated with CK-689, CK-666, n=28, 32, respectively. (I) Representative confocal super-resolution images of the leading edge of control and PFN1 KO cells expressing the Mena/VASP binding and mitochondria-sequestering FP4-Mito or its control AP4-Mito. Cells expressed the DNA vectors for 16 hrs before they were fixed and labeled with Alexa568-phalloidin. (J). Lamellipodia sum intensity normalized to total cellular F-actin for control and PFN1 KO cells expressing AP4- or FP4-Mito and labeled with Alexa568-phalloidin. For control + AP4-Mito, PFN1KO + AP4-Mito, and PFN1 KO + FP4-Mito n =15 ; For control + FP4-mito, n = 20.
Box-and-whisker plots in F,H,J denote 95th (top whisker), 75th (top edge of box), 25th (bottom edge of box), and 10th (bottom whisker) percentiles and the median (bold line in box). **** indicates p ≤ 0.0001, ** indicates p ≤ 0.01, n.s. = not significant (p > 0.05). p values were generated by ANOVA followed by Tukey’s post hoc test (comparison of ≥ 3 conditions).
See also Figure S4.
As Arp2/3 is depleted from the leading edge, it was not surprising that there was no effect of CK-666 on leading edge actin morphology in PFN1 KO cells (Figures. 5A-C). However, inhibiting Arp2/3 in control cells dramatically increased the size of linear arrays (Figures. 5A, B), but not their density (Figures. 5A, C). Live imaging of cells expressing Lifeact-mRuby demonstrated that actin retrograde flow rates were reduced in PFN1 KO cells by approximately 50% (Figures. 5D, E), which could be explained by the fewer number of polymerizing filaments [46] (Figures. 2D,E). However, Arp2/3 inhibition only altered retrograde flow rates in the presence of PFN1 (Figures. 5F, G). Therefore, the effects of Arp2/3 inhibition on the leading edge architecture (Figures. 5A-C) and dynamics (Figures. 5F, G) of PFN1 KO cells were negligible, which corresponds with its inability to localize there (Figures. 4A, B).
Figure 5. PFN1 alters leading edge architecture and dynamics through Arp2/3 and Mena/VASP.

(A) Representative confocal super-resolution images of the leading edge of control and PFN1 KO cells that were pre-treated with control (CK-689) or Arp2/3 (CK-666) small molecule inhibitors for 1 hr prior to fixation and labeling with Alexa568-phalloidin. Results from linear array segmentation analysis are outlined in red. Scale bar, 2 μm. (B and C) Linear array area and density measurements of control and PFN1 KO cells treated with CK-689 or CK-686 as depicted in (A). For control + CK-689, n = 3846 arrays, 25 cells; For control + CK-666, n = 4777 arrays, 30 cells; for PFN1 KO + CK-689, n = 2078 arrays, 29 cells; for PFN1 KO + CK-666, n = 2856 arrays, 23 cells. Area measures the size of individual linear arrays. Density was measured by normalizing the linear array count to the cell perimeter. (D) Representative kymographs of lamellipodia retrograde flow in control and PFN1 KO cells expressing Lifeact-mRuby and either GFP, GFP-PFN1R88E (R88E), or GFP-PFN1WT (WT). (E) Quantification of retrograde flow from kymographs as depicted in (D). For control cells n = 170 measurements from 17 cells. For PFN1 KO cells n = 310 measurements from 31 cells for GFP; n = 100 measurements from 10 cells for R88E; and n = 180 measurements from 18 cells for WT. (F) Representative kymographs of lamellipodia retrograde flow in control and PFN1 KO cells expressing Lifeact-mRuby and treated with CK-689 or CK-666 for 60 minutes prior to imaging. (G) Quantification of retrograde flow from kymographs as depicted in (F). For control + CK-689 and control + CK-666 n = 70 measurements, 7 cells; for PFN1 KO + CK-689 n = 80 measurements, 8 cells; for PFN1 KO + CK-666 n = 120 measurements, 12 cells. (H) Representative confocal super-resolution images of the leading edge of control and PFN1 KO cells expressing the Mena/VASP mitochondria-sequestering FP4-Mito or its control AP4-Mito. Cells expressed the DNA vectors for 16 hrs before they were fixed and labeled with Alexa568-phalloidin. Results from linear array segmentation analysis are outlined in red. Scale bar, 2 μm. (I and J) Linear array area and density measurements of control and PFN1 KO cells expressing AP4-mito or FP4-mito as depicted in (H). For control + AP4-mito, n =1928 arrays, 15 cells; For control + FP4-mito, n = 962 arrays, 20 cells; For PFN1 + AP4-mito, n = 853 arrays, 15 cells; For PFN1 + AP4-mito, n = 961 arrays, 15 cells. (K) Representative confocal super-resolution images of the leading edge of control and PFN1 KO cells expressing AP4- or FP4-Mito and labeled with Alexa568-phalloidin. Scale bar, 5 μm. (L) Linescan analysis of the leading edge of control and PFN1 KO cells expressing AP4- or FP4-Mito, and then labeled with Alexa568-phalloidin. For control cells expressing AP4-Mito, 320 lines were drawn from 16 cells; for control cells expressing FP4-Mito 400 lines were drawn from 20 cells; for PFN1 KO cells expressing AP4-Mito and FP4-Mito, 300 lines were drawn from 15 cells. The transparent bands depict 95% confidence intervals. (M) Representative kymographs of lamellipodia retrograde flow in control cells expressing Lifeact-mRuby and either AP4-mito or FP4-Mito. (N) Quantification of retrograde flow from kymographs as depicted in (M). For control + AP4-mito n =100 measurements, 10 cells; for control + FP4-Mito n = 90 measurements, 9 cells.
Box-and-whisker plots in B,E,G,I,N denote 95th (top whisker), 75th (top edge of box), 25th (bottom edge of box), and 10th (bottom whisker) percentiles and the median (bold line in box). Data in C,J are plotted as median with interquartile range. p values plotted relative to control, unless otherwise indicated. **** indicates p ≤ 0.0001, *** p ≤ 0.001, n.s. = not significant (p > 0.05). p values were generated by either a two-tailed student’s t-test (comparison of two conditions) or by ANOVA followed by Tukey’s post hoc test (comparison of ≥ 3 conditions). For (B,I) Dunn’s post hoc test was used to generate p-values after normality of the data was assessed.
See also Figures S3, S5.
Similarly, inhibiting Mena/VASP with FP4-Mito significantly reduced the size and density of linear arrays at the leading edge of control, but not PFN1 KO cells (Figures. 5H-J). Additionally, we used linescan analysis to compare the intensity profiles in the lamellipodia of control and PFN1 KO cells expressing FP4-Mito. FP4-Mito expression in control cells severely depleted lamellipodial actin in a manner that was nearly identical to knocking out PFN1, while it had no additional effect on the lamellipodia of PFN1 KO cells Figures. 5K, L). Together with the analysis of the percentage of actin found at the leading edge (Figures. 4I, J), these data indicate that leading edge-localized Mena is inert in PFN1-depleted cells, which corroborate previous work showing that Mena requires profilin-actin [21, 47]. Though, unlike Arp2/3, Mena/VASP did not contribute to retrograde flow (Figures. 5M, N). This may be due to the flexibility of the longer Mena/VASP generated filaments, which are less suited for force production than dendritic actin networks [48, 49].
PFN1 exhibits a concentration-dependent regulation of Arp2/3 and Mena/VASP network assembly
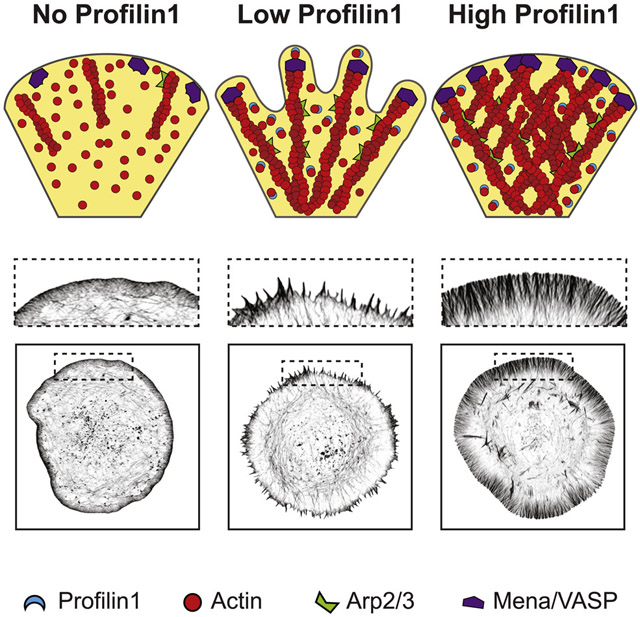
Since Arp2/3 and Mena/VASP are both affected by the loss of PFN1, we next sought to understand how PFN1 supplies monomers to leading edge networks mediated by these assembly factors. We used electroporation to introduce defined amounts of PFN1 protein into cells. With fluorescently labeled dextran, we demonstrated that the amount of delivered protein was linearly proportional to its bath concentration in the electroporation chamber (Figures. 6A, B). Moreover, the variability in electroporation efficiency was low, allowing for control of delivered material (Figures. 6A-D). We are able to introduce PFN1 protein into cells at discrete concentrations up to physiological levels of rescue (Figures. 6C, D). Modulating the PFN1 concentration in PFN1 KO cells had dramatic effects on lamellipodia architecture. At 20 μM PFN1, the lamellipodia was virtually eliminated and caused the cells to send out numerous filopodia protrusions (Figures. 6E-G, I). At intermediate concentrations (50 μM) of PFN1, the lamellipodia returned and filopodia protrusions subsided (Figures. 6E-I). The 100 μM concentration, which completely rescued PFN1 protein expression to control levels (Figures. 6C, D), restored the size and architecture of the lamellipodia to strongly resemble control cells (Figures. 6E, H). Measuring the cell’s perimeter/area ratio, which is significantly increased when filopodia are present, confirmed the biphasic regulation of filopodia by PFN1 concentration (Figures. 6I). At higher PFN1 concentrations, filopodia subside and linear arrays primarily exist as filament bundles within the lamellipodia network (Figures. 6F,G,I). Along with previous experiments (Figures. 2F-I), this highlights the sensitivity of leading edge actin architecture to the availability of PFN1-actin. Thus, PFN1 expression levels can determine the type and amount of actin structures that form at the leading edge.
Figure 6. PFN1 concentration determines which actin structures assemble at the leading edge.

(A) Representative images of cells electroporated with 40 kDa Dextran-FITC. The Dextran-FITC bath concentration in the electroporation chamber is indicated. Images are scaled identically and pseudocolored based on the included lookup table to convey relative fluorescent intensities. Scale bar, 10 μm. (B) Quantification of mean cellular 10 or 40kDa Dextran-FITC fluorescence as a function of its bath concentration in the electroporation chamber. Individual data points are plotted along with the mean and 95% confidence intervals. The R2 value is the linear fit through the mean value of fluorescence intensity for each bath concentration. (B) For 10kDa Dextran FITC n = 42, 59, 53, 69 for 20 μM, 50 μM, 100 μM, 200 μM, respectively. For 40kDa Dextran FITC n = 42, 27, 36, 39 for 20 μM, 50 μM, 100 μM, 200 μM, respectively. (C) Western blot of profilin 1 in control and PFN1 KO cells after electroporation with the designated concentration of purified profilin 1. The concentrations reflect the bath concentration of profilin 1 in the electroporation chamber. (D) Quantification of profilin 1 expression levels from (C). Profilin 1 expression was normalized to GAPDH. Four biological replicates were used for each condition. Individual data points are plotted along with the mean and 95% confidence intervals. (E) Representative confocal super-resolution images of the leading edge of control and PFN1 KO cells after electroporation with the designated concentration of purified PFN1 and then labeled with Alexa568-phalloidin. Insets highlight actin architecture at the leading edge. Scale bar, 5 μm. (H) Linescan analysis of Alexa568-phalloidin fluorescence intensity at the leading edge of cells depicted in (E). Only regions containing a lamellipodia were analyzed. The transparent bands depict 95% confidence intervals. For all conditions, n = 400 linescans from 20 cells. (F and G) Linear array area and density measurements of control and PFN1 KO cells electroporated with the designated concentration of purified profilin 1 as depicted in (E). For control cells n = 5652 arrays, 27 cells. For PFN1 KO cells + 0 μM n = 2609 arrays, 27 cells. For PFN1 KO cells + 20 μM n = 3732 arrays, 34 cells. For PFN1 KO cells + 50 μM n = 5265 arrays, 35 cells. For PFN1 KO cells + 100 μM n = 4943 arrays, 30 cells. (H) Linescan analysis of Alexa568-phalloidin fluorescence intensity at the leading edge of cells depicted in (E). (I) Quantification of filopodia at the leading edge in control and PFN1 KO cells after electroporation with the designated concentration of purified PFN1 as depicted in (A). Filopodia were quantified by taking a ratio of the cell perimeter to the cell area. Higher ratios reflect more filopodia protrusions. For control cells n = 35. For PFN1 KO cells electroporated with 0 μM, 20 μM, 50 μM, and 100 μM n = 29, 36, 25, and 34, respectively. (J) Representative confocal images of PFN1 KO cells electroporated with the indicated concentration of purified profilin 1 and immunolabeled for Arp2/3 with an ARPC2 antibody. Scale bar, 10 μm. (K) Linescan analysis of ARPC2 fluorescence intensity at the leading edge of cells depicted in (J). The transparent bands depict 95% confidence intervals. For all conditions, n = 400 linescans from 20 cells.
Box-and-whisker plots in F,G,I denote 95th (top whisker), 75th (top edge of box), 25th (bottom edge of box), and 10th (bottom whisker) percentiles and the median (bold line in box). Data in B,D are plotted as median with interquartile range. p values plotted relative to control + 0 μM profilin 1 protein, unless otherwise indicated. **** indicates p ≤ 0.0001, *** p ≤ 0.001, ** indicates p ≤ 0.01, n.s. = not significant (p > 0.05). p values were generated by ANOVA followed by Tukey’s post hoc test (comparison of ≥ 3 conditions). For (F) Dunn’s post hoc test was used to generate p-values after normality of the data was assessed.
See also Figure S5.
Since Arp2/3 localization at the leading edge is severely reduced in PFN1 KO cells (Figures. 4A, B) and low concentrations of PFN1 favor formation of filopodia over lamellipodia (Figures. 6 E-I), we wanted to determine how PFN1 concentration affects Arp2/3 localization to the leading edge. Surprisingly, we found the majority of Arp2/3 returns to the leading edge upon introduction of a low (20 μM) PFN1 concentration (Figures. 6J, K), despite no change in lamellipodia size in comparison to PFN1 KO cells (Figure. 6H). While Arp2/3 localization continued to increase with higher PFN1 concentrations (Figures. 6J, K), 20 μM was sufficient to recall the majority of Arp2/3 back to the leading edge.
Discovering a PFN1 concentration that potently stimulated the production of filopodia-like protrusions allowed us to determine whether their formation was dependent on Arp2/3. To test this, we combined controlled PFN1 delivery with CK-666-mediated inhibition of Arp2/3 Figures. 7A-C). When PFN1 concentration was limited to cause a strong induction of filopodia, there was no difference in leading edge architecture after Arp2/3 inhibition, demonstrating these structures are Arp2/3-independent. Through Arp2/3 inhibition, we also show that the filopodia seen at low PFN1 concentrations (Figures. 6E, I) are not the result of the dissolution of a dendritic network to reveal stable filopodia [50], but rather due to the selective polymerization of specific structures. At 20 μM PFN1, CK-666 had no effect on the perimeter/area ratio (Figures. 7A, C) or lamellipodia actin as measured by linescan analysis of fluorescently-labeled actin filaments (Figures. 7A, B). However, when cells were given 100 μM PFN1 and treated with CK-666, the actin structures that form are highly affected by Arp2/3 inactivation: the lamellipodia is severely decreased (Figure. 7B) and large filopodia form (Figure. 7C), demonstrating a shift toward actin assembly through formins and Mena/VASP. These data corroborate other studies showing PFN1 is crucial for homeostasis upon Arp2/3 inhibition [4, 5], but demonstrate a concentration-dependent effect. We next tested the reliance of Mena/VASP-driven actin assembly on PFN1 concentration. At both 20 and 100 μM PFN1, loss of function of Mena/VASP through FP4-Mito prevented both induction of lamellipodia (Figures. 7D, E) and filopodia (Figures. 7D, F). In stark contrast to Arp2/3, Mena/VASP inhibition hinders actin assembly regardless of PFN1 concentration (Figures. 7D-F), suggesting it is a necessary precursor for other types of leading edge networks.
Figure 7. PFN1 exhibits concentration-dependent regulation of Arp2/3 and Mena/VASP network assembly.

(A) Representative confocal super-resolution images of the leading edge of PFN1 KO cells after electroporation with 20 or 100 μM of profilin 1 protein and then treatment with CK-689 or CK-666. Cells were labeled with Alexa568-phalloidin. Scale bar, 5 μm. (B) Quantification of lamellipodia at the leading edge in PFN1 KO cells by linescan analysis of phalloidin fluorescence intensity at the leading edge of cells depicted in (A). The transparent bands depict 95% confidence intervals. For all conditions, n = 200 linescans from 10 cells. Lines were drawn in between arrays (See Figure. S5). (C) Filopodia were quantified by taking a ratio of the cell perimeter to the cell area. Higher ratios reflect more filopodia protrusions. For PFN1 KO cells electroporated with 20 μM n=10, 15 for cells treated with CK-689 and CK-666, respectively. For PFN1 KO cells electroporated with 100 pμM n = 10, 15 for cells treated with CK-689 and CK-666, respectively. (D) Representative confocal super-resolution images of the leading edge of PFN1 KO cells after they were electroporated with either AP4- or FP4-Mito and the designated concentration of purified profilin 1. Cells were then labeled with Alexa568-phalloidin. Scale bar, 5 μm. (E) Linescan analysis of phalloidin fluorescence intensity at the leading edge of cells depicted in (D). The transparent bands depict 95% confidence intervals. For all conditions, n = 300 linescans from 15 cells. Lines were drawn in between arrays (See Figure. S5). (F) Quantification of filopodia at the leading edge in PFN1 KO cells after electroporation with the AP4- or FP4-Mito construct and then with 20 or 100 μM of profilin 1 protein. Filopodia were quantified by taking a ratio of the cell perimeter to the cell area. Higher ratios reflect more filopodia protrusions. For PFN1 KO cells expressing AP4-Mito and electroporated with 20 μM n=23, for PFN1 KO cells expressing FP4-Mito and 20μM, AP4-Mito and 20μM, FP4-Mito and 100μM, n=15 cells.
Box-and-whisker plots in C,F denote 95th (top whisker), 75th (top edge of box), 25th (bottom edge of box), and 10th (bottom whisker) percentiles and the median (bold line in box). **** indicates p ≤ 0.0001, *** p ≤ 0.001, n.s. = not significant (p > 0.05). p values were generated by ANOVA followed by Tukey’s post hoc test (comparison of ≥ 3 conditions).
See also Figures S3, S5.
Discussion
For decades, profilin has been defined as an inhibitor of de novo filament assembly, by preventing spontaneous nucleation and restricting polymerization to the barbed ends of existing filaments [51]. However, profilin’s effect on actin nucleation and assembly in cells has been more perplexing. While recent work in yeast has shown that profilin can suppress Arp2/3-mediated branching [4], much less is known about how profilin controls internetwork dynamics in the mammalian cellular environment, where discrete actin networks are simultaneously assembling in the same space. In this study, we sought to understand how PFN1 tunes the assembly of leading edge actin networks in mammalian cells. We found that PFN1 is necessary for both Arp2/3 and Mena/VASP function at the leading edge. Additionally, we show that PFN1 concentration can modulate competition and collaboration between the assembly of linear arrays and dendritic networks.
Actin assembly by Arp2/3 and Mena/VASP at the leading edge is severely altered without PFN1. In PFN1 KO cells, Arp2/3 does not localize to the leading edge (Figures. 4A, B) and Mena/VASP is non-functional (Figures. 3D, 5H-L). By carefully modulating PFN1 concentration (Figures. 6C, D), we were able to delineate discrete stages of leading edge actin assembly. While low concentrations of PFN1 favor the formation of linear networks in an Arp2/3-independent manner, higher PFN1 concentrations allow both linear and dendritic networks to form (Figures. 6E-I, 7A-C). Arp2/3’s depletion from the leading edge and the generation of dendritic networks at high PFN1 concentrations indicates a collaborative relationship, although one that is potentially indirect. For instance, the formation of linear arrays at low PFN1 concentrations creates Arp2/3 binding sites, allowing the complex to re-localize (Figures. 6J, K). This is reminiscent of filopodia/veil motility first identified in neuronal growth cones, where filopodia provide the initial step of membrane protrusions, followed by Arp2/3-based dendritic networks [52].
Even though Arp2/3 is present at the leading edge at low PFN1 concentrations (Figures. 6J, K), the fact that dendritic networks do not assemble (Figures. 7A-C) is likely due to an inability to compete for PFN1-actin. Dendritic network assembly does not require PFN1-mediated delivery, as nucleation promoting factors for Arp2/3 contain both proline-rich binding sites to accept profilin-actin as well as WH2 domains to bind naked monomers [26, 27]. In contrast, Mena/VASP’s reliance on PFN1 is in line with studies showing VASP needs profilin to bind barbed ends and elongate filaments [21] and binds to profilin-actin with higher affinity than monomers [29]. How PFN1-actin is utilized by these different assembly factors is manifested as a competition between dendritic and linear networks that appears biphasic. At high PFN1 concentrations, dendritic networks subside and the leading edge is dominated by linear arrays (Figures. 2G-I). Additionally, PFN1 overexpression caused linear arrays to grow larger but did not increase their density (Figures. 2H, I), suggesting that the number of filament bundles is limited by space and competition for resources from dendritic networks [12, 53]. Conversely, filopodia assembly is abated when Arp2/3 is active (Figures. 7A-C) and the formation of dendritic networks increases (Figures. 6H, I). These results help reconcile studies where PFN1 has been shown to both inhibit [5] and enhance [27] Arp2/3-based network assembly.
The leading edge must balance the assembly of diverse actin networks from a common monomer pool in order to generate forces, explore the extracellular space, and move through complex physical environments. Our results demonstrate that a cell could dramatically change its leading edge actin architecture simply by modulating PFN1 gene expression or through phosphorylation-mediated alterations in actin binding [54, 55]. High PFN1 and Mena/VASP expression in the neuronally-derived cells used in this study could explain why the majority of actin polymerization is PFN1-dependent, including Arp2/3-mediated assembly at the leading edge. Cells with low expression of PFN1, Mena/VASP, and formins, may be more reliant on PFN1-independent actin assembly (Figure. 3B). This may explain why PFN1 and Mena/VASP negatively regulate Arp2/3 networks and cell motility in fibroblasts [5, 45]. Further studies are needed to elucidate the precise combinations of PFN1-interacting assembly factors that result in the generation of different actin networks. Ultimately, PFN1 concentration and assembly factor expression could be used to predict which types of actin assembly will occur.
Star Methods
Resource Availability
Lead contact
Further information and requests for resources and reagents should be directed and will be fulfilled by the Lead Contact, Eric Vitriol (evitriol@ufl.edu).
Materials availability
Plasmids generated for this study are available from the lead contact by request.
Data and Code Availability
The published article includes all datasets generated and analyzed during this study. This study did not generate code.
Experimental Model and Subject Details
Cath.-a-differentiated (CAD) cells (purchased from Sigma-Aldrich) were cultured in DMEM/F12 medium (Gibco) supplemented with 8% fetal calf serum, 1% L-Glutamine, and 1% penicillin-streptomycin. Prior to imaging, CAD cells were plated on coverslips coated with 10 μg/mL Laminin (Sigma-Aldrich). DMEM/F12 medium without phenol red (Gibco) supplemented with 15mM HEPES was used for live-cell imaging. CAD cells are a unique mouse neuroblastoma cell line that differentiate into a neuronal-like cell morphology upon serum withdrawal [56]. We routinely use serum withdrawal to validate CAD cells by ensuring their capacity to undergo neuronal differentiation as evidenced by the formation of long (> 100 μm), narrow projections after 2 days. Cell lines were also routinely tested for mycoplasma using the Universal Detection Kit (ATCC). PFN1 KO cells were generated with CRISPR/Cas9 by transfecting CAD cells with the constructs described above. One week after transfection, selection for cells modified by CRISPR/Cas9 was performed with 10 μg/mL puromycin (Santa Cruz Biotechnology). This concentration was chosen as it kills 100% of cells that do not have the puromycin resistance gene within 24 hours [8, 10, 37]. Puromycin was removed 24 hours prior to experiments that required transfection.
Method Details
DNA constructs
The following DNA constructs were used in this study: EGFP-PFN1 (Plasmid #56438, Addgene), Lifeact mRuby (pN1-Lifeact-mRuby, provided by Roland Wedlich-Soldner, Max-Planck Institute of Biochemistry), pEGFP-C1 EGFP β-actin, pMSCV EGFP-FP4-Mito and EGFP-AP4 mito (provided by Alpha Yap) [33, 45]. EGFP-PFN1R88E was generated from EGFP-PFN1 with site-directed mutagenesis (Q5 New England Biolabs) using the following primers: AATGGATCTTGAAACCAAGAGCACC (forward) and GTAAATTCCCCG-TCTTGC (reverse). Mutagenesis was confirmed by sequencing (Genewiz). PFN1 KO cells were generated with the pCRISPR-CG02 vector (Genecopoeia) containing an sgRNA targeting TCGACAGCCTTATGGCGGAC in the mouse PFN1 gene and the puromycin donor plasmid pDonor-D01 (Genecopoeia) for selection. Control knock-out cells were generated using the same vectors and a scrambled sgRNA control targeting GGCTTCGCGCCGTAGTCTTA. All constructs were prepared for transfection using the GenElute HP Endotoxin-Free Plasmid Maxiprep Kit (Sigma-Aldrich).
RNA-seq analysis
Total RNA was extracted from wild-type PFN1 knockout cells (four biological replicates per condition) and total RNA was used as input to generate strand-specific, rRNA-depleted RNA-seq libraries using the KAPA stranded RNA-seq Kit with RiboErase HMR (Kapa Biosystems). All steps were performed according to the manufacturer’s protocol except for the use of custom Illumina-compatible index primers to allow multiplexing. Paired-end, 36 bp sequencing of the final libraries was performed using an Illumina NextSeq500. Gene expression analysis was performed as previously described [57]. Briefly, reads were de-multiplex based on sample specific barcodes and mapped to the human genome (hg19) using OLego [58]. Uniquely mapped reads were assigned to genomic features and counted using Quantas [59]. TMM normalization and identification of differentially expressed genes ws computed using edgeR [60]. Final gene lists were filtered (∣log2 fold change∣ ≥ 1; adjusted P ≤ 0.01) to identify significant changes. See Data S1.
Protein purification
Human profilin 1 protein was purified as described [61]. Briefly, profilin 1 plasmids were cloned between NdeI and EcoRI sites of pMW172, a pET derivative [62, 63] and were expressed in Rosetta pRARE2 BL21(DE3) cells. Cells were grown in terrific broth to OD600 = 0.5 at 37 °C, then induced with IPTG for 3 h at 37 °C. Pellets were resuspended in 50 mM Tris HCl (pH 8.0), 10 mg/mL DNase I, 20 mg/mL PMSF, 1× protease inhibitor cocktail, and 10 mM DTT. Cells were lysed with 150 mg/mL lysozyme and sonicated at 4 °C. The cell lysate was clarified by centrifugation at 20,000 × g. The supernatant was passed over at QHighTrap column (GE Healthcare, Marlborough, MA) equilibrated in 50 mM Tris-HCl (pH 8.0), 1 M KCl, 10 mM DTT and the flow-through (containing PFN1) was collected and then applied to a Superdex 75 (10/300) gel filtration column (GE Healthcare) equilibrated in 50 mM Tris (pH 8.0), 50 mM KCl, 10 mM DTT. Fractions containing Profilin were pooled, aliquoted, and stored at 80 °C. Thawed Profilin aliquots were pre-cleared at 279,000 × g before use.
DNA and protein electroporation
The Neon Transfection System (Invitrogen) was used to introduce DNA constructs and purified protein into cells using the 10 μL transfection kit. Briefly, cells were grown to a confluency of 70-80%, trypsinized and pelleted by centrifugation. The pellet was rinsed with DPBS and resuspended in a minimum amount of buffer R (Invitrogen) with a total of 1μg of DNA or designated concentration of protein. Cells transfected with DNA constructs were given 14-18 hours after transfection before further experimental procedures were performed. For the 0 μM concentration in protein transfections, cells were transfected with an equivalent amount of protein buffer. For protein electroporation, cells were given 2.5 hours to adhere on laminin coated coverslips before experiments were performed. In the combined protein electroporation and Arp2/3 inhibition experiment, cells were given 1 hour to adhere, media was changed and cells were treated for an additional hour with CK-666. In the combined protein electroporation and Mena/VASP inhibition experiment, cells were transfected with either the EGFP-FP4-Mito or EGFP-AP4-Mito construct, and then after 30 hours were re-electroporated with the indicated protein bath concentration. A single 1400 v 20 ms pulse was used for both DNA and protein electroporation. This protocol routinely gave > 99% transfection efficiency.
Western blots
Adherent cells were harvested with a cell scraper in RIPA buffer with complete EDTA-free Protease Inhibitor Cocktail Roche (Millipore Sigma). Whole cell lysates were prepared by membrane disruption using repeated passage through a 27 gauge needle. Protein content was then assessed with Pierce BCA Protein Assay Kit (Thermo Fisher) and diluted in SDS buffer stained with Orange G (40% glycerol, 6% SDS, 300 mM Tris HCl, pH 6.8). 10μg samples were evenly loaded on an SDS-PAGE gel (Novex 4-20% Tris-Glycine Mini Gels, Thermo Fisher, or 15% gel as indicated). Protein was transferred to a PVDF membrane (0.2 micron, Immobilon) and blocked in 5% Bovine Serum Albumin (BSA) (Sigma-Aldrich) for 20 mins. All antibodies were diluted in 5% BSA and 0.1% Tween-20 (Fisher Scientific). Primary antibodies were incubated at 4°C overnight and secondary antibodies (Li-Cor; Abcam) were incubated for 2 hours at room temperature. Actin (pan, β, ɣ), profilin, ARPC2, Mena and GAPDH from whole cell lysate were detected with Li-Cor fluorescent antibodies on an Odyssey detection system (Li-Cor) or via X-ray film after incubation with a developing reagent (Thermo Fisher), as indicated. WesternSure Pre-Stained Chemiluminescent Protein Ladder (Li-Cor) was used as a molecular weight marker. The following antibodies/dilutions were used: rabbit anti-Profilin-1 (C56B8, 1:1000 dilution, Cell Signaling Technology); rabbit anti-Pan Actin (4968, 1:1000 dilution, Cell Signaling Technology); rabbit anti-GAPDH (2118, 1:3000 dilution, Cell Signaling Technology), Mouse anti-beta-actin (Clone 4C2, 1:1000, EMD Millipore) Mouse anti-gamma-actin (Clone 2C3, 1:10000, EMD Millipore) rabbit anti-ARPC2 (p34-Arc, 1:1000 dilution, EMD Millipore) and mouse anti-Mena (clone A351F7D9, 1:500 dilution, EMD Millipore). For secondary antibodies, goat anti-rabbit Alexa Fluor™ 680 (Li-Cor) was used at 1:3500 dilution for imaging on the Li-Cor Odyssey detection system and goat anti-rabbit HRP (Abcam) was used for X-ray detection. For quantitative westerns, antibody detection was determined to be in the linear range by loading increasing lysate concentration as a function of signal (Figures. S2, S4).
Actin monomer/filament ratio measurements
Cells were collected in lysis and F-actin stabilization buffer (LAS01, Cytoskeleton Inc.) at 37°C in the presence of Halt Protease Inhibitor Cocktail (Thermo Fisher) and 10mM ATP (Cytoskeleton Inc). Cells were harvested via cell scraper and incubated at 37°C for 10 minutes. Unbroken cells and debris were pelleted at room temperature at 250 g for 3 mins and the supernatant was then immediately centrifuged at 150,000 g at 37°C for 1 hour in a swinging bucket rotor. The supernatant was carefully removed and the pellet was resuspended in a volume of F-actin depolymerization buffer (FAD-02, Cytoskeleton Inc.) matching the volume of the supernatant. All samples were then incubated on ice for 1 hour with periodic trituration and SDS buffer stained with Orange G (40% glycerol, 6% SDS, 300 mM Tris HCl, pH 6.8) was then added to each sample. Samples were then analyzed by western blot.
Microscopy
Most images were acquired with a Nikon A1R+ laser scanning confocal microscope with a GaAsP multi-detector unit. The microscope is also equipped with total internal reflection fluorescence (TIRF) and an ORCA-Flash 4.0 sCMOS camera. All confocal and TIRF imaging was performed with an Apo TIRF 60X 1.49 NA objective. Deconvolution-based super-resolution confocal microscopy [64] w[64]as performed by using zoom settings higher than the Nyquist criteria, resulting in oversampled pixels (0.03 μm). Confocal z-stacks were created and then deconvolved with Nikon Elements software using the Landweber algorithm (15 iterations, with spherical aberration correction) to create images with approximately 150 nm resolution [65]. Live cell imaging was performed using TIRF. All cells analyzed for retrograde flow were non-motile. For live cell imaging, a stage incubator with CO2 and temperature control (Tokai Hit) was used. Low resolution images for measuring total actin levels (Figure. 1) and electroporation efficiency (Figure. 6A,B) were taken with an EVOS XL digital inverted microscope objective (Life Technologies) equipped with a Plan Neoflour 20X 0.5 N.A. objective.
Pharmacological inhibition of Arp2/3
To inhibit Arp2/3, cells were treated with 50 μM of the Arp2/3 inhibitor CK-666 or its control analog CK-689 (Sigma-Aldrich) for 1 hour. Stock solutions of 40 mM CK-666 and 100mM CK-689 were prepared in DMSO.
Immunofluorescence
Cells were fixed with 4% electron microscopy grade paraformaldehyde (Electron Microscopy Sciences) for 10 min at RT and then permeabilized for 3 minutes with 0.1% Tween-20. Cells were then washed three times with PBS and stained overnight at 4°C with primary antibodies diluted in PBS. They were then washed twice with PBS for 5 min, incubated with secondary antibodies (diluted 1:1000) for 1 hr at room temperature in PBS. Actin filaments were stained with Alexa Fluor 488 phalloidin or Alexa Fluor 568 phalloidin (diluted 1:100, Life Technologies) for 30 min at room temperature in immunofluorescence staining buffer. Cells were washed three times with PBS before mounting with Prolong Diamond (Life Technologies). The following antibodies were used: Rabbit anti-ARPC2 (p34-Arc, EMD Millipore) and mouse anti-Mena (clone A351F7D9, EMD Millipore) were used at a 1:500 dilution, anti-mouse IgG 647 and anti-rabbit IgG 568 (Life Technologies) were used at 1:1000 dilution.
Fluorescent labeling of active polymerization
To label sites of active polymerization, cells were plated on coverslips that were pre-incubated with 10 μg/mL Poly-D-Lysine (Sigma-Aldrich) for one hour and then washed with PBS prior to laminin coating. Barbed ends were labeled using a protocol adapted from Chan et al [66]. Briefly, a stock solution of permeabilization buffer (20 mM HEPES, 138 mM KCl, 4 mM MgCl2, 3 mM EGTA, and 1% BSA, pH 7.4) was prepared. Immediately prior to use, 0.025% saponin and 1 mM ATP were added followed by 0.45 μM rhodamine actin (Cytoskeleton Inc). The culture medium was carefully removed by pipette and enough permeabilization buffer was added to cover cells. After 1 minute, permeabilization buffer was gently removed by pipette, rinsed briefly with 1X PBS and immediately fixed in 4% paraformaldehyde in cytoskeleton stabilization buffer [67] for 10 min. After carefully washing in 1X PBS 3 times, samples were incubated with phalloidin-488 or phalloidin-568 (diluted 1:100, Life Technologies) for 20 min at room temperature. Cells were imaged using identical conditions for comparison.
Quantification and Statistical Analysis
Quantification of total actin filaments per cell:
Cells were transfected with GFP or a GFP-PFN1 construct, and then fixed and labeled with Alexa568-phalloidin. Images were taken on the EVOS XL microscope using identical illumination and camera exposure conditions. Image files were imported into ImageJ, the background was subtracted, and cells were segmented by fluorescence intensity-based thresholding using the phalloidin channel. Mean GFP and Alexa568-phalloidin values were used to assess relative PFN1 and F-actin levels in each cell. At least three biological replicates were performed per condition.
Quantification of retrograde flow:
Cells transfected with Lifeact-mRuby were plated onto laminin-coated coverslips for 90 minutes and then imaged with TIRF microscopy at 1 frame/s. Images were exported into ImageJ for analysis. Ten kymographs were generated per cell where fiduciary markers were clearly visible at the leading edge. Retrograde flow was calculated by measuring the distance and time that fiduciary markers traveled in the kymograph and solving for rate. Two-three biological replicates were performed per condition.
Quantification of actin and actin-binding proteins in the lamellipodia:
Cells labeled with Alexa568-phalloidin or immunolabeled for Arp2/3 and Mena were imaged using confocal microscopy. Images were exported into ImageJ for analysis. A maximum intensity projection was made for each confocal z-stack. Lines ten pixels in width were drawn perpendicular to the cell edge and fluorescence intensity was measured along the line. 20 lines were drawn per cell. If filopodia or linear arrays were present, lines were drawn in between these structures (See Figure. S5). Three biological replicates were performed per condition.
Quantification of linear arrays in the lamellipodia:
Cells labeled with Alexa568-phalloidin were imaged using confocal deconvolution super-resolution microscopy. Images were deconvolved using Nikon Elements software and then imported into ImageJ for analysis. Confocal z-stacks were converted into a single maximum intensity projection image and the lamellipodia of the cell was manually thresholded. The “Tubeness” ImageJ plugin [68] was used for linear array segmentation on the thresholded lamellipodia. Images were convolved with a sigma value three times the minimum voxel separation. The convolved image was binarized and the Analyze Particle function was used to threshold objects with low circularity (0.0-0.3) and an area measurement greater than 0.1 μm. Filament density was calculated by normalizing the number of segmented arrays to the perimeter of the cell. Three biological replicates were performed per condition.
Quantification of F-actin and Arp2/3 colocalization:
Cells labeled with Alexa647-phalloidin and rabbit anti-ARPC2 were imaged using confocal deconvolution super-resolution microscopy. Images were converted into a single maximum intensity projection image. The lamellipodia was segmented from the rest of the cell and scatterplots of both signals were made to show signal distribution. We used Mander’s overlap coefficient, which takes into account the contribution of each fluorophore to the colocalized signals [69], to measure colocalization of F-actin and Arp2/3 in the cell interior and at the lamellipodia.
Quantification of F-actin in the leading edge versus the cell center:
Cells labeled with Alexa568-phalloidin were imaged using confocal deconvolution super-resolution microscopy. Images were deconvolved using Nikon Elements software and then imported into ImageJ for analysis. Confocal z-stacks were converted into a single maximum intensity projection image and the lamellipodia of the cell was manually segmented. Integrated density of the whole cell, lamellipodia, and area outside the lamellipodia (the cell center) were measured. Percentages of actin in the leading edge or cell center (which are the inverse of the other) were expressed as ratios to the sum intensity of the whole cell.
One biological replicate indicates cells collected from the same passage and each analyzed data set contained 2-4 biological replicates. After normalization for each replicate, all linear regressions and Pearson correlations were performed on whole datasets. All statistics are indicated in figure legends. Significance was assessed by either a two-tailed student’s t-test (comparison of two conditions) or by ANOVA followed by Tukey’s post hoc test (comparison of ≥ 3 conditions) using Graphpad Prism 8 software. Normality of the data was assessed using D’agostino-Pearson and Dunn’s post hoc test was used in place of Tukey’s with nonparametric datasets, as indicated. Error is reported as plus or minus standard error of the mean, unless otherwise indicated.
Data S1 Expression profiling of CAD cells with and without PFN1. Related to STAR Methods.
Supplementary Material
KEY RESOURCES TABLE
| REAGENT or RESOURCE | SOURCE | IDENTIFIER |
|---|---|---|
| Antibodies | ||
| Mouse anti-Mena (clone A351F7D9) | EMD Millipore | Cat# MAB2635 |
| Rabbit anti-Profilin-1 (C56B8) | Cell Signaling Technology | Cat# 3246S |
| Rabbit anti-Pan Actin (4968) | Cell Signaling Technology | Cat# 4968S |
| Rabbit anti-GAPDH (2118) | Cell Signaling Technology | Cat# 2118S |
| Mouse anti-beta-actin (Clone 4C2) | EMD Millipore | Cat# MABT825 |
| Mouse anti-gamma-actin (Clone 2C3) | EMD Millipore | Cat# MABT824 |
| Rabbit anti-ARPC2 (p34-Arc) | EMD Millipore | Cat# 07-227-I |
| Goat anti-rabbit Alexa Fluor 680 | Li-Cor | P/N: 926-68021 |
| Bacterial and Virus Strains | ||
| N/A | ||
| Biological Samples | ||
| N/A | ||
| Chemicals, Peptides, and Recombinant Proteins | ||
| CK-666 Arp2/3 inhibitor | Sigma-Aldrich | CAS: 442633-00-3 |
| CK-689, inactive control for CK-666 | Sigma-Aldrich | CAS: 170930-46-8 |
| Rhodamine-actin | Cytoskeleton, Inc | Cat. # AR05-C |
| Profilin-1 | [61] | N/A |
| cOmplete Protease Inhibitor Cocktail | Roche | Cat#11697498001 |
| Prolong Diamond Antifade Mountant with DAPI | Invitrogen | REF#P36962 |
| 4-20% Tris glycine gels | Invitrogen | Cat#XP04200BOX |
| 16% Paraformaldehyde | Electron Microscopy Sciences | CAT# 15710 |
| Puromycin dihydrochloride | Santa Cruz Biotechnology | CAS 53-79-2 |
| Laminin from Engelbreth-Holm-Swarm murine sarcoma basement membrane | Sigma-Aldrich | Cat# L2020-1MG |
| Alexa Fluor Phalloidin 568 | Thermo-Fisher | A12380 |
| Alexa Fluor Phalloidin 488 | Thermo-Fisher | A12379 |
| WesternSure Pre-Stained Chemiluminescent Protein Ladder | Li-Cor | P/N 926-98000 |
| Dimethyl sulfoxide (DMSO) | Sigma-Aldrich | D2650 |
| Critical Commercial Assays | ||
| Pierce Bicinchoninic acid assay | Thermo Scientific | Cat#232225 |
| Maxi Prep Kit | Sigma-Aldrich | NA 0410-1KT |
| Q5 Site-Directed Mutagenesis | New England BioLabs | E0554S |
| Deposited Data | ||
| Data S1 | This paper | GEO: GSE149870 |
| Experimental Models: Cell Lines | ||
| Cath.a differentiated cells | ATCC | CRL-11179 |
| Experimental Models: Organisms/Strains | ||
| Oligonucleotides | ||
| sgRNA TCGACAGCCTTATGGCGGAC targeting mouse PFN1 | This paper | N/A |
| sgRNA GGCTTCGCGCCGTAGTCTTA scramble | Genecopoeia | N/A |
| Primer: PFN1-R88E Forward: AATGGATCTTGAAACCAAGAGCACC Reverse: GTAAATTCCCCG-TCTTGC | This paper | N/A |
| Recombinant DNA | ||
| Plasmid: EGFP-PFN1 | Addgene | Plasmid #56438 |
| Plasmid: EGFP-PFN1-R88E | This Paper | Mutagenesis from Plasmid #56438 |
| Plasmid: pN1-Lifeact mRuby (pN1-Lifeact-mRuby, provided by | Roland Wedlich-Soldner, Max-Planck Institute of Biochemistry [70] | N/A |
| Plasmid: pCRISPR-CG02 | Genecopoeia | N/A |
| Plasmid: pDonor-D01 | Genecopoeia | N/A |
| Plasmid: pEGFP-C1 | Addgene | #54759 |
| Plasmid: pMSCV EGFP-FP4-Mito | Alpha Yap, University of Queensland Australia [45] | N/A |
| Plasmid: pMSCV EGFP-AP4-Mito | Alpha Yap, University of Queensland Australia [45] | N/A |
| Software and Algorithms | ||
| Tubeness Algorithm | [68] | https://www.longair.net/edinburgh/imagej/tubeness/ |
| NIS-Elements AR | Nikon | No direct download |
| Fiji ImageJ | NIH Image | https://imagej.net/Fiji |
| Graphpad Prism 8 | Graphpad | https://www.graphpad.com/scientific-software/prism/ |
| Other | ||
| Neon Transfection System | Invitrogen | MPK5000S |
Acknowledgements
We would like to thank Dr. Alpha Yap and Suzie Verma for the generous gift of the EGFP-FP4-Mito and EGFP-AP4-Mito DNA constructs. This project was supported by a National Institutes of Health (NIH) Maximizing Investigators' Research Award for Early Stage Investigators (R35GM133485) to J.L.H.-R. and an NIH Pathway to Independence Award (R00 NS087104) to E.A.V. The authors also wish to thank the anonymous reviewers for their insight and suggestions.
Footnotes
Publisher's Disclaimer: This is a PDF file of an unedited manuscript that has been accepted for publication. As a service to our customers we are providing this early version of the manuscript. The manuscript will undergo copyediting, typesetting, and review of the resulting proof before it is published in its final form. Please note that during the production process errors may be discovered which could affect the content, and all legal disclaimers that apply to the journal pertain.
Declaration of Interests
The authors declare no conflict of interest.
References
- 1.Koestler SA, Rottner K, Lai F, Block J, Vinzenz M, and Small JV (2009). F- and G-actin concentrations in lamellipodia of moving cells. PLoS One 4, e4810. [DOI] [PMC free article] [PubMed] [Google Scholar]
- 2.Tilney LG (1976). The polymerization of actin. II. How nonfilamentous actin becomes nonrandomly distributed in sperm: evidence for the association of this actin with membranes. J. Cell Biol 69, 51–72. [DOI] [PMC free article] [PubMed] [Google Scholar]
- 3.Skruber K, Read T-A, and Vitriol EA (2018). Reconsidering an active role for G-actin in cytoskeletal regulation. J. Cell Sci 131. [DOI] [PMC free article] [PubMed] [Google Scholar]
- 4.Suarez C, Carroll RT, Burke TA, Christensen JR, Bestul AJ, Sees JA, James ML, Sirotkin V, and Kovar DR (2015). Profilin regulates F-actin network homeostasis by favoring formin over Arp2/3 complex. Dev. Cell 32, 43–53. [DOI] [PMC free article] [PubMed] [Google Scholar]
- 5.Rotty JD, Wu C, Haynes EM, Suarez C, Winkelman JD, Johnson HE, Haugh JM, Kovar DR, and Bear JE (2015). Profilin-1 serves as a gatekeeper for actin assembly by Arp2/3-dependent and -independent pathways. Dev. Cell 32, 54–67. [DOI] [PMC free article] [PubMed] [Google Scholar]
- 6.Lee CW, Vitriol EA, Shim S, Wise AL, Velayutham RP, and Zheng JQ (2013). Dynamic localization of G-actin during membrane protrusion in neuronal motility. Curr. Biol 23, 1046–1056. [DOI] [PMC free article] [PubMed] [Google Scholar]
- 7.Lei W, Myers KR, Rui Y, Hladyshau S, Tsygankov D, and Zheng JQ (2017). Phosphoinositide-dependent enrichment of actin monomers in dendritic spines regulates synapse development and plasticity. J. Cell Biol 216, 2551–2564. [DOI] [PMC free article] [PubMed] [Google Scholar]
- 8.Vitriol EA, McMillen LM, Kapustina M, Gomez SM, Vavylonis D, and Zheng JQ (2015). Two functionally distinct sources of actin monomers supply the leading edge of lamellipodia. Cell Rep. 11, 433–445. [DOI] [PMC free article] [PubMed] [Google Scholar]
- 9.Perrin BJ, and Ervasti JM (2010). The actin gene family: function follows isoform. Cytoskeleton (Hoboken) 67, 630–634. [DOI] [PMC free article] [PubMed] [Google Scholar]
- 10.Kapustina M, Read T-A, and Vitriol EA (2016). Simultaneous quantification of actin monomer and filament dynamics with modeling-assisted analysis of photoactivation. J. Cell Sci 129, 4633–4643. [DOI] [PMC free article] [PubMed] [Google Scholar]
- 11.Terman JR, and Kashina A (2013). Post-translational modification and regulation of actin. Curr. Opin. Cell Biol 25, 30–38. [DOI] [PMC free article] [PubMed] [Google Scholar]
- 12.Burke TA, Christensen JR, Barone E, Suarez C, Sirotkin V, and Kovar DR (2014). Homeostatic actin cytoskeleton networks are regulated by assembly factor competition for monomers. Curr. Biol 24, 579–585. [DOI] [PMC free article] [PubMed] [Google Scholar]
- 13.Rotty JD, and Bear JE (2014). Competition and collaboration between different actin assembly pathways allows for homeostatic control of the actin cytoskeleton. Bioarchitecture 5, 27–34. [DOI] [PMC free article] [PubMed] [Google Scholar]
- 14.Kaiser DA, Vinson VK, Murphy DB, and Pollard TD (1999). Profilin is predominantly associated with monomeric actin in Acanthamoeba. J. Cell Sci 112 (Pt 21), 3779–3790. [DOI] [PubMed] [Google Scholar]
- 15.Funk J, Merino F, Venkova L, Heydenreich L, Kierfeld J, Vargas P, Raunser S, Piel M, and Bieling P (2019). Profilin and formin constitute a pacemaker system for robust actin filament growth. Elife 8. [DOI] [PMC free article] [PubMed] [Google Scholar]
- 16.Kotila T, Kogan K, Enkavi G, Guo S, Vattulainen I, Goode BL, and Lappalainen P (2018). Structural basis of actin monomer re-charging by cyclase-associated protein. Nat. Commun 9, 1892. [DOI] [PMC free article] [PubMed] [Google Scholar]
- 17.Goldschmidt-Clermont PJ, Machesky LM, Doberstein SK, and Pollard TD (1991). Mechanism of the interaction of human platelet profilin with actin. J. Cell Biol 113, 1081–1089. [DOI] [PMC free article] [PubMed] [Google Scholar]
- 18.Tilney LG, Bonder EM, Coluccio LM, and Mooseker MS (1983). Actin from Thyone sperm assembles on only one end of an actin filament: a behavior regulated by profilin. J. Cell Biol 97, 112–124. [DOI] [PMC free article] [PubMed] [Google Scholar]
- 19.Bestul AJ, Christensen JR, Grzegorzewska AP, Burke TA, Sees JA, Carroll RT, Sirotkin V, Keenan RJ, and Kovar DR (2015). Fission yeast profilin is tailored to facilitate actin assembly by the cytokinesis formin Cdc12. Mol. Biol. Cell 26, 283–293. [DOI] [PMC free article] [PubMed] [Google Scholar]
- 20.Romero S, Le Clainche C, Didry D, Egile C, Pantaloni D, and Carlier M-F (2004). Formin is a processive motor that requires profilin to accelerate actin assembly and associated ATP hydrolysis. Cell 119, 419–429. [DOI] [PubMed] [Google Scholar]
- 21.Hansen SD, and Mullins RD (2010). VASP is a processive actin polymerase that requires monomeric actin for barbed end association. J. Cell Biol 191, 571–584. [DOI] [PMC free article] [PubMed] [Google Scholar]
- 22.Pasic L, Kotova T, and Schafer DA (2008). Ena/VASP proteins capture actin filament barbed ends. J. Biol. Chem 283, 9814–9819. [DOI] [PMC free article] [PubMed] [Google Scholar]
- 23.Machesky LM, Mullins RD, Higgs HN, Kaiser DA, Blanchoin L, May RC, Hall ME, and Pollard TD (1999). Scar, a WASp-related protein, activates nucleation of actin filaments by the Arp2/3 complex. Proc. Natl. Acad. Sci. USA 96, 3739–3744. [DOI] [PMC free article] [PubMed] [Google Scholar]
- 24.Blanchoin L, Pollard TD, and Mullins RD (2000). Interactions of ADF/cofilin, Arp2/3 complex, capping protein and profilin in remodeling of branched actin filament networks. Curr. Biol 10, 1273–1282. [DOI] [PubMed] [Google Scholar]
- 25.Yarar D, D’Alessio JA, Jeng RL, and Welch MD (2002). Motility determinants in WASP family proteins. Mol. Biol. Cell 13, 4045–4059. [DOI] [PMC free article] [PubMed] [Google Scholar]
- 26.Chereau D, Kerff F, Graceffa P, Grabarek Z, Langsetmo K, and Dominguez R (2005). Actin-bound structures of Wiskott-Aldrich syndrome protein (WASP)-homology domain 2 and the implications for filament assembly. Proc. Natl. Acad. Sci. USA 102, 16644–16649. [DOI] [PMC free article] [PubMed] [Google Scholar]
- 27.Bieling P, Hansen SD, Akin O, Li T-D, Hayden CC, Fletcher DA, and Mullins RD (2018). WH2 and proline-rich domains of WASP-family proteins collaborate to accelerate actin filament elongation. EMBO J. 37, 102–121. [DOI] [PMC free article] [PubMed] [Google Scholar]
- 28.Kovar DR, Harris ES, Mahaffy R, Higgs HN, and Pollard TD (2006). Control of the assembly of ATP- and ADP-actin by formins and profilin. Cell 124, 423–435. [DOI] [PubMed] [Google Scholar]
- 29.Chereau D, and Dominguez R (2006). Understanding the role of the G-actin-binding domain of EnaA/ASP in actin assembly. J. Struct. Biol 155, 195–201. [DOI] [PubMed] [Google Scholar]
- 30.Suarez C, and Kovar DR (2016). Internetwork competition for monomers governs actin cytoskeleton organization. Nat. Rev. Mol. Cell Biol 17, 799–810. [DOI] [PMC free article] [PubMed] [Google Scholar]
- 31.Antkowiak A, Guillotin A, Boiero Sanders M, Colombo J, Vincentelli R, and Michelot A (2019). Sizes of actin networks sharing a common environment are determined by the relative rates of assembly. PLoS Biol. 17, e3000317. [DOI] [PMC free article] [PubMed] [Google Scholar]
- 32.Moseley JB, and Goode BL (2006). The yeast actin cytoskeleton: from cellular function to biochemical mechanism. Microbiol. Mol. Biol. Rev 70, 605–645. [DOI] [PMC free article] [PubMed] [Google Scholar]
- 33.Bear JE, Svitkina TM, Krause M, Schafer DA, Loureiro JJ, Strasser GA, Maly IV, Chaga OY, Cooper JA, Borisy GG, et al. (2002). Antagonism between Ena/VASP proteins and actin filament capping regulates fibroblast motility. Cell 109, 509–521. [DOI] [PubMed] [Google Scholar]
- 34.Yang C, Czech L, Gerboth S, Kojima S, Scita G, and Svitkina T (2007). Novel roles of formin mDia2 in lamellipodia and filopodia formation in motile cells. PLoS Biol. 5, e317. [DOI] [PMC free article] [PubMed] [Google Scholar]
- 35.Mejillano MR, Kojima S, Applewhite DA, Gertler FB, Svitkina TM, and Borisy GG (2004). Lamellipodial versus filopodial mode of the actin nanomachinery: pivotal role of the filament barbed end. Cell 118, 363–373. [DOI] [PubMed] [Google Scholar]
- 36.Svitkina TM, and Borisy GG (1999). Arp2/3 complex and actin depolymerizing factor/cofilin in dendritic organization and treadmilling of actin filament array in lamellipodia. J. Cell Biol 145, 1009–1026. [DOI] [PMC free article] [PubMed] [Google Scholar]
- 37.Vitriol EA, Wise AL, Berginski ME, Bamburg JR, and Zheng JQ (2013). Instantaneous inactivation of cofilin reveals its function of F-actin disassembly in lamellipodia. Mol. Biol. Cell 24, 2238–2247. [DOI] [PMC free article] [PubMed] [Google Scholar]
- 38.Witke W, Sutherland JD, Sharpe A, Arai M, and Kwiatkowski DJ (2001). Profilin I is essential for cell survival and cell division in early mouse development. Proc. Natl. Acad. Sci. USA 98, 3832–3836. [DOI] [PMC free article] [PubMed] [Google Scholar]
- 39.Ezezika OC, Younger NS, Lu J, Kaiser DA, Corbin ZA, Nolen BJ, Kovar DR, and Pollard TD (2009). Incompatibility with formin Cdc12p prevents human profilin from substituting for fission yeast profilin: insights from crystal structures of fission yeast profilin. J. Biol. Chem 284, 2088–2097. [DOI] [PMC free article] [PubMed] [Google Scholar]
- 40.Pernier J, Shekhar S, Jegou A, Guichard B, and Carlier M-F (2016). Profilin Interaction with Actin Filament Barbed End Controls Dynamic Instability, Capping, Branching, and Motility. Dev. Cell 36, 201–214. [DOI] [PMC free article] [PubMed] [Google Scholar]
- 41.Safer D, Elzinga M, and Nachmias VT (1991). Thymosin beta 4 and Fx, an actin-sequestering peptide, are indistinguishable. J. Biol. Chem 266, 4029–4032. [PubMed] [Google Scholar]
- 42.Symons MH, and Mitchison TJ (1991). Control of actin polymerization in live and permeabilized fibroblasts. J. Cell Biol 114, 503–513. [DOI] [PMC free article] [PubMed] [Google Scholar]
- 43.Breitsprecher D, Kiesewetter AK, Linkner J, Urbanke C, Resch GP, Small JV, and Faix J (2008). Clustering of VASP actively drives processive, WH2 domain-mediated actin filament elongation. EMBO J. 27, 2943–2954. [DOI] [PMC free article] [PubMed] [Google Scholar]
- 44.Nolen BJ, Tomasevic N, Russell A, Pierce DW, Jia Z, McCormick CD, Hartman J, Sakowicz R, and Pollard TD (2009). Characterization of two classes of small molecule inhibitors of Arp2/3 complex. Nature 460, 1031–1034. [DOI] [PMC free article] [PubMed] [Google Scholar]
- 45.Bear JE, Loureiro JJ, Libova I, Fässler R, Wehland J, and Gertler FB (2000). Negative regulation of fibroblast motility by EnaA/ASP proteins. Cell 101, 717–728. [DOI] [PubMed] [Google Scholar]
- 46.Van Goor D, Hyland C, Schaefer AW, and Forscher P (2012). The role of actin turnover in retrograde actin network flow in neuronal growth cones. PLoS One 7, e30959. [DOI] [PMC free article] [PubMed] [Google Scholar]
- 47.Barzik M, Kotova TI, Higgs HN, Hazelwood L, Hanein D, Gertler FB, and Schafer DA (2005). Ena/VASP proteins enhance actin polymerization in the presence of barbed end capping proteins. J. Biol. Chem 280, 28653–28662. [DOI] [PMC free article] [PubMed] [Google Scholar]
- 48.Mogilner A, and Edelstein-Keshet L (2002). Regulation of actin dynamics in rapidly moving cells: a quantitative analysis. Biophys. J 83, 1237–1258. [DOI] [PMC free article] [PubMed] [Google Scholar]
- 49.Pollard TD, and Borisy GG (2003). Cellular motility driven by assembly and disassembly of actin filaments. Cell 112, 453–465. [DOI] [PubMed] [Google Scholar]
- 50.Korobova F, and Svitkina T (2008). Arp2/3 complex is important for filopodia formation, growth cone motility, and neuritogenesis in neuronal cells. Mol. Biol. Cell 19, 1561–1574. [DOI] [PMC free article] [PubMed] [Google Scholar]
- 51.Pollard TD, and Cooper JA (1984). Quantitative analysis of the effect of Acanthamoeba profilin on actin filament nucleation and elongation. Biochemistry 23, 6631–6641. [DOI] [PubMed] [Google Scholar]
- 52.Mongiu AK, Weitzke EL, Chaga OY, and Borisy GG (2007). Kinetic-structural analysis of neuronal growth cone veil motility. J. Cell Sci 120, 1113–1125. [DOI] [PubMed] [Google Scholar]
- 53.Mohapatra L, Lagny TJ, Harbage D, Jelenkovic PR, and Kondev J (2017). The Limiting-Pool Mechanism Fails to Control the Size of Multiple Organelles. Cell Syst. 4, 559–567.e14. [DOI] [PMC free article] [PubMed] [Google Scholar]
- 54.Fan Y, Arif A, Gong Y, Jia J, Eswarappa SM, Willard B, Horowitz A, Graham LM, Penn MS, and Fox PL (2012). Stimulus-dependent phosphorylation of profilin-1 in angiogenesis. Nat. Cell Biol 14, 1046–1056. [DOI] [PMC free article] [PubMed] [Google Scholar]
- 55.Sathish K, Padma B, Munugalavadla V, Bhargavi V, Radhika KVN, Wasia R, Sairam M, and Singh SS (2004). Phosphorylation of profilin regulates its interaction with actin and poly (L-proline). Cell Signal. 16, 589–596. [DOI] [PubMed] [Google Scholar]
- 56.Qi Y, Wang JK, McMillian M, and Chikaraishi DM (1997). Characterization of a CNS cell line, CAD, in which morphological differentiation is initiated by serum deprivation. J. Neurosci 17, 1217–1225. [DOI] [PMC free article] [PubMed] [Google Scholar]
- 57.Thomas JD, Sznajder ŁJ, Bardhi O, Aslam FN, Anastasiadis ZP, Scotti MM, Nishino I, Nakamori M, Wang ET, and Swanson MS (2017). Disrupted prenatal RNA processing and myogenesis in congenital myotonic dystrophy. Genes Dev. 31, 1122–1133. [DOI] [PMC free article] [PubMed] [Google Scholar]
- 58.Wu J, Anczuków O, Krainer AR, Zhang MQ, and Zhang C (2013). OLego: fast and sensitive mapping of spliced mRNA-Seq reads using small seeds. Nucleic Acids Res. 41, 5149–5163. [DOI] [PMC free article] [PubMed] [Google Scholar]
- 59.Zhang Y, Chen K, Sloan SA, Bennett ML, Scholze AR, O’Keeffe S, Phatnani HP, Guarnieri P, Caneda C, Ruderisch N, et al. (2014). An RNA-sequencing transcriptome and splicing database of glia, neurons, and vascular cells of the cerebral cortex. J. Neurosci 34, 11929–11947. [DOI] [PMC free article] [PubMed] [Google Scholar]
- 60.Robinson MD, McCarthy DJ, and Smyth GK (2010). edgeR: a Bioconductor package for differential expression analysis of digital gene expression data. Bioinformatics 26, 139–140. [DOI] [PMC free article] [PubMed] [Google Scholar]
- 61.Henty-Ridilla JL, Juanes MA, and Goode BL (2017). Profilin Directly Promotes Microtubule Growth through Residues Mutated in Amyotrophic Lateral Sclerosis. Curr. Biol 27, 3535–3543.e4. [DOI] [PMC free article] [PubMed] [Google Scholar]
- 62.Boopathy S, Silvas TV, Tischbein M, Jansen S, Shandilya SM, Zitzewitz JA, Landers JE, Goode BL, Schiffer CA, and Bosco DA (2015). Structural basis for mutation-induced destabilization of profilin 1 in ALS. Proc. Natl. Acad. Sci. USA 112, 7984–7989. [DOI] [PMC free article] [PubMed] [Google Scholar]
- 63.Eads JC, Mahoney NM, Vorobiev S, Bresnick AR, Wen KK, Rubenstein PA, Haarer BK, and Almo SC (1998). Structure determination and characterization of Saccharomyces cerevisiae profilin. Biochemistry 37, 11171–11181. [DOI] [PubMed] [Google Scholar]
- 64.Wilson T (2011). Resolution and optical sectioning in the confocal microscope. J. Microsc 244, 113–121. [DOI] [PubMed] [Google Scholar]
- 65.Osking Z, Ayers JI, Hildebrandt R, Skruber K, Brown H, Ryu D, Eukovich AR, Golde TE, Borchelt DR, Read T-A, et al. (2019). ALS-Linked SOD1 Mutants Enhance Neurite Outgrowth and Branching in Adult Motor Neurons. iScience 11, 294–304. [DOI] [PMC free article] [PubMed] [Google Scholar]
- 66.Chan AY, Raft S, Bailly M, Wyckoff JB, Segall JE, and Condeelis JS (1998). EGF stimulates an increase in actin nucleation and filament number at the leading edge of the lamellipod in mammary adenocarcinoma cells. J. Cell Sci 111 (Pt 2), 199–211. [DOI] [PubMed] [Google Scholar]
- 67.Small JV, and Celis JE (1978). Filament arrangements in negatively stained cultured cells: the organization of actin. Cytobiologie 16, 308–325. [PubMed] [Google Scholar]
- 68.Sato Y, Nakajima S, Shiraga N, Atsumi H, Yoshida S, Koller T, Gerig G, and Kikinis R (1998). Three-dimensional multi-scale line filter for segmentation and visualization of curvilinear structures in medical images. Med Image Anal 2, 143–168. [DOI] [PubMed] [Google Scholar]
- 69.Zinchuk V, Zinchuk O, and Okada T (2007). Quantitative colocalization analysis of multicolor confocal immunofluorescence microscopy images: pushing pixels to explore biological phenomena. Acta Histochem. Cytochem 40, 101–111. [DOI] [PMC free article] [PubMed] [Google Scholar]
- 70.Riedl J, Crevenna AH, Kessenbrock K, Yu JH, Neukirchen D, Bista M, Bradke F, Jenne D, Holak TA, Werb Z, et al. (2008). Lifeact: a versatile marker to visualize F-actin. Nat. Methods 5, 605–607. [DOI] [PMC free article] [PubMed] [Google Scholar]
Associated Data
This section collects any data citations, data availability statements, or supplementary materials included in this article.
Supplementary Materials
Data Availability Statement
The published article includes all datasets generated and analyzed during this study. This study did not generate code.