

Abstract
Objective
To compare hospital‐community partnerships among safety‐net hospitals relative to non–safety‐net hospitals, and explore whether hospital‐community partnerships are associated with reductions in readmission rates.
Data Sources
Data from four nationwide hospital‐level datasets for 2015‐2016, including American Hospital Association (AHA) annual survey, Hospital Inpatient Prospective Payment System (IPPS) data, CMS Hospital Compare, and County Health Rankings National (CHRN) data.
Study Design
We first examined how safety‐net hospitals partner with nine different community providers, and how the overall and individual partnership patterns differ from those in non–safety‐net hospitals. We then explored their association with 30‐day readmission rates by diagnosis and hospital wide.
Data Collection/Extraction Methods
We included 1979 hospitals across 50 US states.
Principal Findings
Safety‐net hospitals were more engaged in hospital‐community partnerships, especially with local public health, local governments, social services, nonprofits, and insurance companies, relative to their non–safety‐net peers. However, we found that such partnerships were not significantly related to reductions in readmission rates. The findings indicated that merely partnering with various community organizations may not be associated with readmission rate reduction.
Conclusions
Before promoting partnerships with various community organizations for its own sake, further prospective, longitudinal, and evidence‐based guidance derived from the study of hospital‐community partnerships is needed to make meaningful recommendations aimed at readmission rate reduction in safety‐net hospitals.
Keywords: hospital readmission, hospital‐community partnership, safety‐net systems
What This Study Adds.
Hospital readmissions disproportionally affect safety‐net hospitals since their patient populations often lack medical and social supports necessary to assure effective transitional care.
Although various hospital‐community partnerships have been recommended to safety‐net hospitals, no empirical study has explored which hospital‐community partnerships are implemented at safety‐net hospitals, or whether they are associated with reduced readmission rates.
This study contrasts patterns of hospital‐community partnerships of safety‐net hospitals with those of non–safety‐net hospitals using data on 1979 US hospitals and nine categories of different community partner organizations, exploring associations with 30‐day readmission rates.
Safety‐net hospitals were more engaged with community partnerships, but partnership was not significantly associated with reduced readmissions. Further research is needed to build evidence‐based guidelines for the formation and implementation of hospital‐community partnerships to reduce readmissions.
1. INTRODUCTION
Reducing avoidable hospital readmissions has been a national priority for improving quality of care and reducing health care costs in the United States for over a decade with the policy change under the Hospital Readmission Reduction Program (HRRP). 1 Hospital‐community partnerships have been suggested as an effective strategy to decrease hospital readmissions 2 , 3 in addition to improving other outcomes, such as avoidable hospitalization, 4 cost containment, 4 , 5 and clinical outcomes. 6 , 7 Particularly, some types of these initiatives have been designed and implemented in the United States on the notion that interventions embedded within a hospital are often insufficient to reduce readmissions effectively. 3 , 8 For instance, State Action on Avoidable Rehospitalizations (STAAR) initiatives build mutual trust among patients, hospitals, and community partners to improve communication and care transitions. 9 The Community‐based Care Transitions Program (CCTP), created by Section 3026 of the Affordable Care Act, also promotes hospital‐community partnerships for improving care transitions from the hospital to other settings in order to reduce readmissions. 10
Hospitals serving socioeconomically disadvantaged populations especially need to engage community partners in postdischarge care to build mediating structures. 11 , 12 These hospitals are often referred to as safety‐net hospitals, defined as “providers that organize and deliver a significant level of both health care and other health‐related services to the uninsured, Medicaid, and other vulnerable populations.” 13 (p.5) Since patients at safety‐net hospitals are often faced with poor socioeconomic resources (eg, social support, housing stability, transportation, and nutrient‐rich food), they are restricted in recovery and appropriate postdischarge care. 14 Moreover, safety‐net hospitals typically have limited financial resources and heavily depend on public funds, 15 which limits their capacity to provide coordinated transitions of care interventions for these vulnerable populations. 16 Due to these characteristics, “safety‐net hospitals are 30 percent more likely to have 30‐day hospital readmission rates above the national average, compared with non–safety‐net hospitals,” 11 (p.1) and as a result, they are also more likely to be subject to more payment penalties under HRRP. 17 The disproportionate impact is exacerbated when safety‐net hospitals serve disadvantaged patients with pneumonia, myocardial infarction, heart failure, and chronic obstructive pulmonary disease (COPD), since these patients have higher readmission rates due to multiple factors, including lack of integrated postdischarge care. 18 , 19
Previous research emphasized the importance of hospital‐community partnership to enhance quality of care and improve access to care at safety‐net hospitals. 20 , 21 Studies found that a transitional care intervention in safety‐net hospitals led by community health workers (CHWs), including coaching, telephone outreach, and medication management, reduced readmissions and total costs. 5 , 22 Besides CHWs, a hospital guide commissioned by the Agency for Healthcare Research and Quality (AHRQ) also presented collaboration with cross‐setting partners as an important way of reducing readmissions among Medicaid patients. 23 This report emphasized that partnering with diverse stakeholders, such as postacute, community‐based, and social services, helps hospitals implement transitional care after discharge more effectively and leverage additional available resources through community partnerships. Hospital‐community partnership also brings integrated care interventions for patients with chronic diseases and promotes coordination among levels of care throughout communities. 24 Although hospital‐community partnership has been well recognized as an effective means of overcoming barriers, empirical evidence is sparse on which community providers are more engaged in partnership with safety‐net hospitals, and whether these partnerships are associated with reductions in readmission rates. Using four nationwide datasets, this study identifies hospital‐community partnerships at safety‐net hospitals, compares them to non–safety‐net hospitals, and examines associations between partnerships and avoidable 30‐day readmission rates.
2. METHODS
2.1. Data
We used four nationwide hospital‐level datasets for 2015 and 2016: US hospitals reporting hospital‐community partnerships for population health improvement initiatives in the 2015 American Hospital Association (AHA) annual survey, 25 disproportionate share hospital (DSH) index from the 2015 Hospital Inpatient Prospective Payment System (IPPS), 26 risk‐adjusted unplanned 30‐day readmission rates from CMS Hospital Compare in 2016, 27 and community socioeconomic factors from 2016 County Health Rankings National (CHRN) data. 28 To derive the study sample, we set the hospitals participating in HRRP (N = 4767) as our population and narrowed down to the eligible acute care hospitals that are subject to IPPS (N = 3476). IPPS is the payment system for the operating costs of acute care hospital inpatient stays. If hospitals have a high percentage of vulnerable patient population, they receive a percentage add‐on payment, referred to as the DSH adjustment, applied to the DRG‐adjusted base payment rate. For this study, DSH index is the key variable used to categorize safety‐net hospitals. Among the hospitals identified with the DSH index, we only included hospitals providing the full list of control variables (N = 2742). In this set of hospitals, we finalized our sample hospitals that responded to hospital‐community partnership questions through AHA survey (N = 1979). The flow diagram of the study sample can be found in Appendix S1.
The sample includes 1,979 hospitals, mostly general acute care hospitals that treat readmission‐related diseases identified by CMS including but not limited to acute myocardial infarction (AMI), chronic obstructive pulmonary disease (COPD), heart failure (HF), pneumonia (PN), stroke (STK), total hip and knee arthroplasty (THA), and coronary artery bypass graft surgery (CABG).
2.2. Hospital‐community partnerships and safety‐net hospitals
As hospital‐community partnership has received more attention, AHA, Health Research and Educational Trust (HRET), and Robert Wood Johnson Foundation (RWJF) collaborated to conduct 50 interviews with hospital and community leaders from 25 diverse communities 29 to create the 2015 AHA Population Health Survey. In this survey questionnaire, hospital chief executive officers were asked about the extent to which hospitals partner with 43 community organizations (response rate was 22 percent, 1417 hospitals). After this pilot study with survey validation, AHA expanded this study to all member US hospitals via their annual survey, by including a condensed version of the questions which ask about hospital‐community partnership with nine representative community organizations. With a larger sample and higher response rate (60 percent, 3503 hospitals), we used this annual survey to identify key community providers partnered with hospitals.
The AHA annual survey asks about the extent to which a hospital partners with nine different community partners for population health improvement initiatives: (1) health care providers outside their hospitals, (2) local public health organizations, (3) local social service agencies, (4) local/state government, (5) nonprofit organizations, (6) faith‐based organizations, (7) insurance companies, (8) schools, and (9) local businesses. Though the objectives of these partnerships are not limited to readmission reduction, this survey allows us to measure hospitals’ comprehensive efforts to partner with various community organizations for their community health improvement.
We coded hospital‐community partnerships as a binary variable (yes/no) and then conducted polychoric principal component analysis (PCA) 30 to draw a single common component among the nine types of hospital‐community partnerships. The common component represents a measure of hospital‐community partnership effort.
To identify safety‐net hospitals, we used Medicare Disproportionate Share Hospital (DSH) index for each hospital from the 2015 IPPS database. DSH index indicates the proportion of vulnerable patients that a hospital serves, defined as DSH index = (Medicare Supplemental Security Income Days/Total Medicare Days) + (Medicaid, non‐Medicare Days/Total Patient Days). Following Berenson and Shih's study, 12 we divided hospitals into quartiles, defining the fourth‐quartile hospitals as safety‐net hospitals. To focus our research questions, we derived a dichotomized variable, measuring safety‐net hospitals (hospitals in the 4th quartile of DSH) and non–safety‐net hospitals (hospitals within the 1st through 3rd quartiles of DSH), considering that previous studies have used the DSH index to measure safety‐net hospital as a dichotomous variable. 17 , 31 , 32 , 33
2.3. Readmission rates
We used 30‐day hospital readmission rates published through CMS Hospital Compare in 2016. CMS publicly reports hospital‐wide 30‐day readmission rates on their Hospital Compare website, 27 based on admissions and discharges from July 2013 to June 2016.
In addition to hospital‐wide all‐cause 30‐day readmission rates, we focused on patient cohorts with seven diagnoses in accordance with the Hospital Readmission Reduction Program (HRRP): AMI, COPD, heart failure (HF), pneumonia (PN), stroke, THA, and CABG. By using risk‐adjusted readmission rates, the regression models assured relatively standardized comparison across hospitals without statistical noise. 34
2.4. Other hospital and community factors
Environmental factors at the community and hospital level can also be associated with hospital‐community partnerships and 30‐day readmission rates. 35 , 36 We used hospital‐ and county‐level environmental factors to control for their effects on the 30‐day readmission rates. County‐level environmental factors include percentage of uninsured population, the number of primary care physician per 100,000 population, and median household income (log) using County Health Rankings National Data in 2016. These county‐level environmental factors reflect patients’ social determinants of health that are closely related to 30‐day readmissions. 36 , 37 , 38 , 39 Hospital characteristics were also accounted for, including the number of total employees per 10 beds, the percentage of full‐time registered nurses (RNs), teaching hospitals, rural hospitals, market concentration as a Herfindahl index at the health service area (HSA) level, 40 specialty hospital, and hospital ownership (public, nonprofit, and for‐profit) from 2015 AHA survey data. Previous studies have reported that some hospital characteristics, including ownership and teaching status, were significantly associated with hospital readmission rates. 37 , 41 , 42 These organizational characteristics can leverage providers’ capabilities to reduce 30‐day readmissions. 43 For descriptive statistics and detailed measurements of each variable, see Appendix S2.
2.5. Statistical analysis
We conducted a Kruskal‐Wallis test 44 as a one‐way analysis of variance to determine whether each hospital‐community partnership and risk‐adjusted 30‐day readmission rates were significantly different between safety‐net hospitals and non–safety‐net hospitals. We then examined whether safety‐net hospitals are more engaged in partnerships with various community organizations than non–safety‐net hospitals. We first conducted a feasible generalized least‐squares (FGLS) model by regressing overall hospital‐community partnerships on DSH quartiles, using the non–safety‐net hospitals (hospitals within the 1st through 3rd quartiles of DSH) as a baseline. We conducted FGLS models with the consideration of heteroskedasticity because the overall hospital‐community partnership was not normally distributed. Next, we analyzed logit models for individual hospital‐community partnerships, which are coded as binary variables, to identify which community providers are more engaged in partnership with safety‐net hospitals, compared to non–safety‐net hospitals.
We explored our second question of whether such hospital‐community partnership in safety‐net hospitals was associated with reduced 30‐day readmission rates. Using the dichotomized measure of safety‐net hospitals as previously described, we analyzed the interaction effects between the overall hospital‐community partnership and safety‐net hospitals on 30‐day readmissions. We hypothesized that safety‐net hospitals may be willing to collaborate with various community organizations to reduce readmission rates to serve their vulnerable patient populations, and those efforts may reduce their disease‐specific and hospital‐wide 30‐day readmissions. We used ordinary least‐squares (OLS) models for this analysis since 30‐day readmission rates by diagnosis had a relatively normal distribution and our models satisfied diagnosis tests for OLS assumptions.
3. RESULTS
The total number of hospitals in the analysis was 1,979 across 50 states, and 494 hospitals in each quartile of DSH index. The distribution of DSH index indicated safety‐net hospitals in the 4th quartile have a relatively wide range of DSH index (0.34‐0.99). The descriptive statistics also showed that hospital‐community partnership and readmission rates at the safety‐net hospitals were higher than non–safety‐net hospitals (Table 1). The Kruskal‐Wallis test results also indicated that, among the nine community partners, safety‐net hospitals collaborate significantly more with local public health agencies, social services agencies, state/local governments, and insurance companies. Readmission rates were also significantly different between safety‐net versus non–safety‐net hospitals: Safety‐net hospitals have a significantly higher readmission rates than non–safety‐net peers, except CABG‐specific 30‐day readmission rates.
TABLE 1.
Descriptive statistics for hospital‐community partnership and 30‐day readmission rates by DSH quartiles
| Overall (N = 1979) |
Non–safety‐net 1st‐3rd quartiles of DSH (combined) (N = 1485) |
Safety‐net 4th quartile of DSH (N = 494) |
Kruskal‐Wallis Test | |
|---|---|---|---|---|
| DSH index range | 0‐0.33 | 0.34‐0.99 |
| Hospital‐community partnership (yes) | N (%) | N (%) | N (%) | P‐value |
|---|---|---|---|---|
| (1) Providers outside your system | 1596 (80.7) | 1188 (80.0) | 408 (82.6) | .206 |
| (2) Local public health agencies | 1611 (81.5) | 1190 (80.1) | 421 (85.2) | .012* |
| (3) Local social services agencies | 1550 (78.3) | 1141 (76.8) | 409 (82.9) | .005** |
| (4) State/local governments | 1374 (69.4) | 1008 (67.9) | 366 (74.1) | .009** |
| (5) Nonprofit organizations | 1585 (80.1) | 1177 (79.3) | 408 (82.6) | .108 |
| (6) Faith‐based organizations | 1232 (62.3) | 909 (61.2) | 323 (65.4) | .097 |
| (7) Insurance companies | 1293 (65.3) | 949 (64.0) | 344 (70.0) | .021* |
| (8) Schools | 1510 (76.3) | 1123 (75.6) | 387 (78.3) | .218 |
| (9) Local businesses | 1511 (76.3) | 1135 (76.4) | 376 (76.1) | .886 |
| 30‐d readmission rates by diagnosis | N | Mean (SD) | Mean (SD) | P‐value |
|---|---|---|---|---|
| (1) AMI | 1186 | 16.19 (0.80) | 16.47 (0.89) | .000*** |
| (2) CABG | 592 | 13.66 (1.21) | 13.86 (1.26) | .065 |
| (3) COPD | 1527 | 19.74 (1.28) | 20.10 (1.68) | .001** |
| (4) HF | 1531 | 21.41 (1.56) | 22.11 (1.68) | .000*** |
| (5) THA | 1392 | 4.38 (0.56) | 4.47 (0.59) | .019* |
| (6) Pneumonia (PN) | 1558 | 16.81 (1.38) | 17.39 (1.47) | .000*** |
| (7) Stroke | 1335 | 12.11 (0.99) | 12.56 (1.09) | .000*** |
| (8) Hospital wide | 1642 | 15.14 (0.83) | 15.67 (1.01) | .000*** |
Since hospital‐community partnership was measured as dichotomized variable (Yes/No), the number and the percentage of ‘yes’ responses were reported here.
P < .05.
P < .01.
P < .001.
We visualized the overall hospital‐community partnership and hospital‐wide readmission rates by DSH index divided by quartiles to see the patterns for these. Figure 1 shows that the first quartile hospitals, with the least proportion of vulnerable population, had significantly lower levels of community partnerships, while hospitals in the second and third had a similar pattern of partnerships. Safety‐net hospitals in the 4th quartile have a relatively high level of partnership. Hospital‐wide 30‐day readmission rates show a similar pattern. The first quartile had the lowest readmission rates, while second and third quartiles had modestly increased readmission rates. The readmission rates, however, exponentially increased within the fourth‐quartile safety‐net hospitals. Both the overall hospital‐community partnership engagement and 30‐day readmission rates are inflated at safety‐net hospitals.
FIGURE 1.
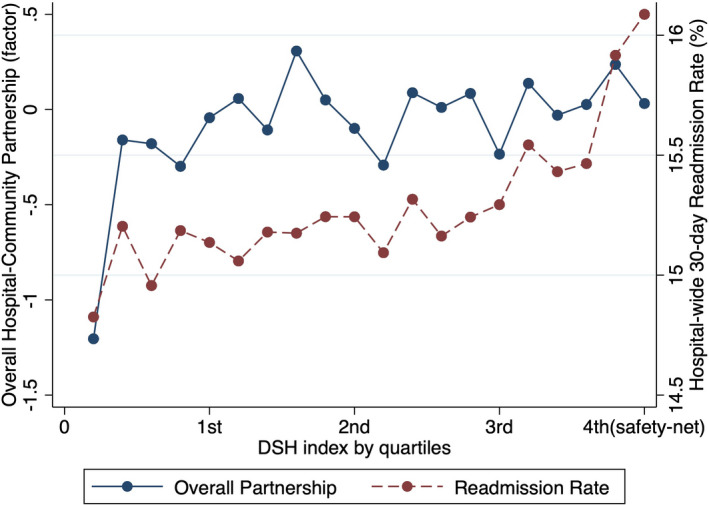
Hospital‐community partnership and 30‐day readmission rates by DSH index quartiles [Color figure can be viewed at wileyonlinelibrary.com].
Note: The hospitals within the 1st to 3rd quartiles indicate non–safety‐net hospitals, and hospitals in the 4th quartile refer to safety‐net hospitals
To closely examine the pattern of hospital‐community partnerships at the safety‐net hospitals, we first conducted FGLS model for overall partnership while controlling other organizational and environmental factors (Table 2). When comparing to the non–safety‐net peers, safety‐net hospitals had significantly more community partners (P < .01).
TABLE 2.
The impact of DSH quartiles on overall and individual hospital‐community partnership
| Overall hospital‐community partnership | (1) | (2) | (3) | (4) | (5) | (6) | (7) | (8) | (9) | |
|---|---|---|---|---|---|---|---|---|---|---|
| Providers outside your system | Local public health agencies | Local social services agencies | State/local gov'ts | Nonprofit org. | Faith‐based org | Insurance companies | Schools | Local business | ||
|
FGLS b (SE) |
Odds ratio (95% CI) | Odds ratio (95% CI) | Odds ratio (95% CI) | Odds ratio (95% CI) | Odds ratio (95% CI) | Odds ratio (95% CI) | Odds ratio (95% CI) | Odds ratio (95% CI) | Odds ratio (95% CI) | |
| Baseline: non–safety‐net hospitals | ||||||||||
| Safety‐net hospitals (D) | 0.234** (0.08) | 1.250 (0.92, 1.69) | 1.790*** (1.31, 2.45) | 1.789*** (1.33, 2.41) | 1.466** (1.14, 1.89) | 1.484* (1.09, 2.01) | 1.239 (0.97, 1.58) | 1.376* (1.07, 1.77) | 1.235 (0.94, 1.62) | 1.111 (0.85, 1.45) |
| Total employees per 10 beds | 0.001 (0.00) | 1.002 (1.00, 1.01) | 1.001 (1.00, 1.01) | 0.998 (0.99, 1.00) | 1.003 (1.00, 1.01) | 1.001 (1.00, 1.00) | 0.997 (0.99, 1.00) | 0.999 (0.99, 1.00) | 1.002 (1.00, 1.01) | 0.998 (0.99, 1.00) |
| Registered RN | 0.009* (0.00) | 1.002 (0.99, 1.02) | 1.005 (0.99, 1.02) | 1.002 (0.99, 1.02) | 1.012 (1.00, 1.02) | 1.004 (0.99, 1.02) | 1.019** (1.01, 1.03) | 1.004 (0.99, 1.02) | 1.011 (1.00, 1.02) | 1.015* (1.00, 1.03) |
| Teaching hospitals | 0.283*** (0.08) | 1.653*** (1.23, 2.22) | 1.582** (1.18, 2.13) | 1.652*** (1.25, 2.19) | 1.340* (1.06, 1.70) | 1.687*** (1.25, 2.28) | 1.424** (1.13, 1.79) | 1.569*** (1.24, 1.98) | 1.432** (1.10, 1.86) | 1.294* (1.00, 1.67) |
| Rural hospitals | −0.380** (0.12) | 0.615** (0.44, 0.85) | 0.652* (0.47, 0.91) | 0.605** (0.44, 0.83) | 0.730* (0.55, 0.97) | 0.550*** (0.40, 0.76) | 0.741* (0.56, 0.98) | 0.759 (0.57, 1.00) | 0.863 (0.63, 1.18) | 0.789 (0.58, 1.07) |
| Market concentration | −0.227* (0.10) | 0.643* (0.44, 0.94) | 1.207 (0.83, 1.76) | 1.023 (0.71, 1.47) | 0.933 (0.68, 1.27) | 0.743 (0.51, 1.09) | 0.565*** (0.42, 0.77) | 0.483*** (0.35, 0.66) | 0.907 (0.65, 1.27) | 1.101 (0.79, 1.54) |
| Specialty hospital | −1.070*** (0.27) | 0.373*** (0.22, 0.64) | 0.344*** (0.20, 0.59) | 0.226*** (0.13, 0.39) | 0.307*** (0.18, 0.52) | 0.276*** (0.16, 0.47) | 0.359*** (0.21, 0.62) | 0.279*** (0.16, 0.48) | 0.378*** (0.23, 0.63) | 0.290*** (0.17, 0.48) |
| Public hospital | 0.709*** (0.19) | 3.057*** (2.01, 4.65) | 1.754** (1.16, 2.65) | 1.784** (1.20, 2.66) | 1.840** (1.27, 2.68) | 1.741** (1.17, 2.59) | 1.792** (1.24, 2.59) | 1.802** (1.24, 2.61) | 1.841** (1.25, 2.71) | 1.103 (0.75, 1.62) |
| Nonprofit hospital | 1.125*** (0.16) | 3.910*** (2.85, 5.37) | 3.115*** (2.26, 4.30) | 3.051*** (2.23, 4.18) | 2.239*** (1.67, 2.99) | 4.073*** (2.95, 5.63) | 4.064*** (3.02, 5.47) | 2.665*** (1.99, 3.57) | 3.027*** (2.24, 4.10) | 2.137*** (1.56, 2.92) |
| Per uninsured | −0.018* (0.01) | 0.963** (0.94, 0.99) | 0.957*** (0.93, 0.98) | 0.957*** (0.93, 0.98) | 0.981 (0.96, 1.00) | 0.964** (0.94, 0.99) | 1.000 (0.98, 1.02) | 0.956*** (0.94, 0.98) | 0.978 (0.96, 1.00) | 0.972* (0.95, 0.99) |
| PCP rate | 0.000 (0.00) | 1.000 (0.99, 1.00) | 0.999 (0.99, 1.00) | 0.998 (0.99, 1.00) | 1.000 (1.00, 1.00) | 1.001 (1.00, 1.01) | 0.998 (0.99, 1.00) | 0.999 (1.00, 1.00) | 0.998 (0.99, 1.00) | 0.997 (0.99, 1.00) |
| Median income(log) | 0.226 (0.16) | 0.878 (0.49,1.57) | 1.319 (0.72, 2.40) | 1.569 (0.89, 2.78) | 1.490 (0.92, 2.42) | 1.441 (0.79, 2.61) | 1.626* (1.02, 2.60) | 1.119 (0.70, 1.80) | 0.995 (0.59, 1.68) | 1.074 (0.64, 1.81) |
| Pseudo‐R 2 | .085 | .105 | .102 | .114 | .057 | .134 | .091 | .086 | .064 | .057 |
| N | 1979 | 1979 | 1979 | 1979 | 1979 | 1979 | 1979 | 1979 | 1979 | 1979 |
Safety‐net hospitals (D) indicate that it is a dummy variable that safety‐net (4th quartile of DSH) is 1 and otherwise (1st‐3rd quartiles of DSH) 0. Public and nonprofit hospital dummy variables set for‐profit hospitals as their baseline. For overall partnership model, FGLS model was estimated since dependent variable was continuous, a common component of partnerships measured by polychoric PCA. For other individual partnership models, logit models were estimated; odds ratios reported.
P < .05.
P < .01.
P < .001, two‐tailed test.
Next, we conducted logit models for individual partnership to identify community partners that are more engaged in partnership with safety‐net hospitals (Table 2). The results showed that safety‐net hospitals are more likely to partner with local public health agencies, local social services agencies, state/local governments, nonprofit organizations, and insurance companies, compared to their non–safety‐net peers. Teaching hospitals and hospitals located in urban areas were significantly engaged in hospital‐community partnerships, particularly with health care providers outside of hospitals, public health agencies, social services agencies, state/local governments, nonprofit organizations, and faith‐based organizations. Public and nonprofit hospitals had more community partners compared to their for‐profit counterparts, and general hospitals also had more community partnerships relative to specialty hospitals. Interestingly, hospitals had more community partners when their market concentration is lower and their county had a lower percentage of uninsured population. Hospital size (the total employees per 10 beds) was not associated with hospital‐community partnership, and the percentage of registered nurses is only positively related to partnering with faith‐based organizations and local business.
We shifted our focus to the readmission rates and examined whether such hospital‐community partnerships at the safety‐net hospitals were associated with reduced 30‐day readmission rates. We analyzed the interaction effects between the overall hospital‐community partnership and safety‐net hospitals on 30‐day readmissions, setting non–safety‐net hospitals as a baseline. Interestingly, as noted in Table 3, the overall hospital‐community partnerships were not associated with reduced disease‐specific readmissions, nor hospital‐wide readmissions. The interaction terms were not significant at the 5 percent significant level. To further investigate, we follow other previous research methods that closely look into the top 5 percent DSH index hospitals which have the most difficulties in reducing readmission rates under HRRP. 12 , 36 Since safety‐net hospitals had a wide range of DSH index (0.34‐0.99), the distributions of hospital‐community partnership and 30‐day readmissions can be dramatically different at the hospitals with top 5 percent DSH index. We divided hospitals into 20 percentile groups and defined the top group (top 5 percent) as the safety‐net hospitals using a dichotomized measure. As noted in Appendix S3, this additional analysis indicated that hospitals serving the most disadvantaged patients (top 5 percent of DSH index) were more engaged in overall hospital‐community partnerships, and these partnerships were associated with reduced all‐cause hospital‐wide readmission (P < .05), but this significant effect was not consistently shown across disease‐specific readmissions. The sensitivity analysis between hospital‐community partnership and DSH index also supported the finding that hospital‐community partnerships were not significantly associated with readmission reductions (see Appendix S4).
TABLE 3.
The interaction effect of overall hospital‐community partnership and safety‐net hospitals on 30‐day readmission rates
| DV: readmission rates | (1) | (2) | (3) | (4) | (5) | (6) | (7) | (8) |
|---|---|---|---|---|---|---|---|---|
| AMI | CABG | COPD | HF | THA | PN | STK | Hospital wide | |
| b (SE) | b (SE) | b (SE) | b (SE) | b (SE) | b (SE) | b (SE) | b (SE) | |
| Overall partnership | −0.006 (0.017) | −0.042 (0.038) | 0.001 (0.022) | −0.019 (0.027) | −0.004 (0.010) | 0.007 (0.024) | −0.003 (0.019) | 0.009 (0.014) |
| Safety‐net hospitals (D) | 0.317*** (0.063) | 0.239 (0.126) | 0.393*** (0.087) | 0.803*** (0.107) | 0.087* (0.041) | 0.644*** (0.094) | 0.431*** (0.074) | 0.537*** (0.057) |
| Overall partnership × Safety‐net hospitals (D) | 0.027 (0.035) | −0.054 (0.077) | 0.061 (0.047) | 0.096 (0.057) | −0.006 (0.022) | 0.049 (0.049) | 0.069 (0.041) | 0.055 (0.030) |
| Constant | 17.996*** (1.269) | 17.238*** (2.910) | 21.799*** (1.780) | 27.220*** (2.203) | 4.685*** (0.818) | 22.349*** (1.919) | 11.844*** (1.493) | 18.209*** (1.167) |
| Adj. R‐squared | .028 | .018 | .037 | .052 | .037 | .054 | .046 | .085 |
| N | 1186 | 592 | 1527 | 1531 | 1392 | 1558 | 1335 | 1642 |
Controls were included in the model, but not presented here. Included control variables were the number of total employees per 10 beds, the percentage of full‐time registered nurses (RNs), teaching hospitals, rural hospitals, market concentration, specialty hospital, hospital ownership (public, nonprofit, and for‐profit), the percentage of uninsured population, PCP rate, and median income (log). Safety‐net hospitals (D) indicate that it is a dummy variable that safety‐net (4th quartile of DSH) is 1 and otherwise (1st‐3rd quartiles of DSH) 0. The sample size power calculation supported the nonsignificant interaction between community partnership and readmission rates in safety‐net hospitals.
P < .05.
P < .01.
P < .001; OLS with robust standard errors; two‐tailed test.
4. DISCUSSION
This study stitched together data across four major datasets (AHA annual survey, IPPS, CMS Hospital Compare, and CHRN) which enabled the creation of a descriptive inventory of the patient populations served and the types of hospital‐community partnerships that are currently implemented in this broad sample of data across the United States. The linked dataset revealed how the patterns of hospital‐community partnerships and 30‐day readmission rates vary depending on the proportion of vulnerable populations in hospitals. Examining these patterns across the spectrum of the hospital DSH indexes indicates that safety‐net hospitals are more likely to be engaged in hospital‐community partnerships than their non–safety‐net peers, particularly with local public agencies, social services agencies, state/local governments, nonprofit organizations, and insurance companies. This study provided the first empirical evidence on the unique patterns of hospital‐community partnerships of safety‐net hospitals using a large set of US hospitals. Our findings indicate that safety‐net hospitals were likely to share responsibility for care processes with community partners. Local public health agencies, social services agencies, state/local governments, nonprofit organizations, and insurance companies partnering with safety‐net hospitals may support improved care for vulnerable populations. The transitional care programs with Meals on Wheels or local transportation agencies provide good examples of postdischarge care assistance through community partnerships. 45
A deeper dive into the interaction effects between hospital‐community partnerships and 30‐day readmission rates showed that there is no significant reduction in disease‐specific nor hospital‐wide readmission at the safety‐net hospitals compared to non–safety‐net peers, despite their efforts to engage in community partnerships. This is an interesting finding, implying that merely partnering with community organizations for population health improvement initiatives may not significantly reduce 30‐day readmissions. Although the hospital‐community partnership measure in this study is not targeting readmission reduction specifically, this finding highlights that hospitals’ generic partnerships with community organizations may be not associated with reduced readmission rates.
Safety‐net hospitals have sought help through their communities and revitalized community partnerships throughout traditional (eg, outside health care providers or public health agencies) to nontraditional organizations (eg, local business or insurance companies). However, our findings indicate that without meticulous, rigorously validated designs and evidence‐based guidance for processes and structural features of partnerships, particularly aiming for readmission reduction, effectiveness of such partnerships in readmission reduction is of questionable merit and/or effect. Existing studies also have supported that merely implementing hospital‐community partnerships did not effectively reduce readmissions. One empirical study in US nursing homes provides related insights that merely communicating with civic groups was not related to quality improvement, but more intense levels of civic participation (ie, use of their feedback in decision‐making processes) were positively associated with improved quality. 46 Another randomized clinical trial study of patients with heart failure found that an intensive transitional care intervention did not reduce 30‐day readmission compared to usual care. 47 The type and nature of these myriad partnerships being implemented deserve to be rigorously and formally scrutinized to study their structures, contents, activities, and participation levels on care processes (ie, preoperative, during, or postoperative care) to ensure effective, efficient engagement between the partners and the hospitals, before promoting generic partnerships with community organizations. Particularly, despite the increased attention on hospital‐community partnership, there is still a lack of evidence on how to build an effective partnership targeting readmission reductions. Given that patients in safety‐net hospitals often face access barriers to receiving effective transitional care, and their unmet needs were not fully incorporated in CMS’s risk‐adjusted models, 48 , 49 evidence‐based study of hospital‐community partnerships is needed to better understand and articulate what, if anything, can be affected through hospital‐community partnerships in the context of 30‐day readmission rates.
This study, like many others in its domain, has limitations. First, the AHA survey broadly focused on partnerships for population health improvement initiatives, not specifically aiming for readmission reduction. This broad measure of hospital‐community partnerships may comprehensively include all types of efforts for population health, but may limit an understanding of the specific partnerships that may bring a meaningful change in readmission reduction. In addition, the data merging process limited the number of hospitals in our sample to 1,979 which did not include the full list of hospitals subject to HRRP. This limitation in data availability may limit our ability to detect significant associations between partnerships and readmission reduction.
Second, this study is very likely affected by an omitted variable bias since we could not include all of the variables that affect readmission rates given the data availability. A study found that the percentage of residents who never married, the number of Medicare beneficiaries, low educated patients, and retirement areas in the county level were significantly associated with readmission rates. 37 Patient‐level factors (eg, cognitive status, disability, self‐management skills, and frailty) may also independently influence the risk of readmission. 49 , 50 , 51 Future studies may need to consider these variables to build a comprehensive model.
Third, results are clouded by the fact that the current datasets cannot provide patient‐level data. Researchers working with this level of data cannot easily examine whether any given patient at a hospital in this set directly received the potential benefits from the hospital's community partnership. This design also does not explore how the hospital‐community partnerships are developed and what services they provide. Further qualitative studies could supplement this design by investigating what types of content, activities, and stakeholders were involved in these partnerships, and how those programs improved the communitywide approach to reduce readmission rates. These further studies could be the next series of moving forward steps to build evidence‐based hospital‐community partnership programs for readmission reduction, especially for safety‐net hospitals.
Lastly, with the current datasets, we cannot determine when and how any given hospital‐community partnership was implemented. Typically, a hospital‐community partnership is comprised of several moving parts, and it is reasonable to assume that each part has a different impact on the outcome. 52 With the given cross‐sectional data, there is no direct way to derive the mechanism of effects. Further studies using panel datasets with multiple years and randomized controlled trials are needed to examine the effects of hospital‐community partnerships more rigorously, and perhaps more importantly, to build evidence‐based guidelines for the formation of effective hospital‐community partnerships to take meaningful steps toward reducing hospital readmission rates.
Hospital readmissions disproportionally affect safety‐net hospitals since their patient populations often have lack of medical and social supports that are necessary to assure effective transitional care. 53 Although various hospital‐community partnerships have been designed and implemented on the notion that interventions embedded within a hospital are not enough to reduce readmission rates effectively, no study has explored which hospital‐community partnerships are implemented at safety‐net hospitals, nor whether they are reducing readmission rates. Our findings indicate that safety‐net hospitals are more likely to engage in partnerships with public agencies, social services agencies, state/local governments, nonprofits, and insurance companies that may facilitate communitywide medical and social supports that their vulnerable patients need in the care transition. However, this study suggests that merely partnering with community organizations may not effectively reduce hospital readmissions. The findings provide policy implications that, despite their efforts in partnering with community organizations, safety‐net hospitals tend to be still penalized more, probably because of their sicker and poorer patient populations who are more likely to be rehospitalized irrespective of their generic hospital‐community partnership. Further research is needed to build evidence‐based guidelines for the formation and implementation of hospital‐community partnerships to reduce readmissions.
Supporting information
Author Matrix
Appendix S1‐S4
ACKNOWLEDGMENTS
Joint Acknowledgment/Disclosure Statement: The authors thank the Senior Scientific Writer of the Houston Methodist Research Institute Center for Outcomes Research, Jacob M. Kolman, for his valuable review and editorial support and Center for Outcomes Research Associate Research Professor of Biostatistics, Susan Xu, for her comments on the methods and statistical analysis. This study was internally supported by the Houston Methodist Research Institute (HMRI), Center for Outcomes Research, through which the AHA dataset and STATA program were purchased. The Center for Outcomes Research is a partnership between Houston Methodist and Texas A&M University School of Public Health. The efforts of all authors, contributors, and acknowledged were supported internally as part of the ongoing investment of the HMRI to support research consistent with the mission of the Center for Outcomes Research to “lead health outcomes by design.” No external funder or core grant account was involved in this research.
Cheon O, Baek J, Kash BA, Jones SL. An exploration of community partnerships, safety‐net hospitals, and readmission rates. Health Serv Res. 2020;55:531–540. 10.1111/1475-6773.13287
REFERENCES
- 1. Boccuti C, Casillas G. Aiming for Fewer Hospital U‐turns: The Medicare Hospital Readmission Reduction Program. San Francisco, CA: Henry J Kaiser Family Foundation; 2017. [Google Scholar]
- 2. Kripalani S, Theobald CN, Anctil B, Vasilevskis EE. Reducing hospital readmission rates: current strategies and future directions. Annu Rev Med. 2014;65:471‐485. [DOI] [PMC free article] [PubMed] [Google Scholar]
- 3. Heaton PC, Frede S, Kordahi A, et al. Improving care transitions through medication therapy management: a community partnership to reduce readmissions in multiple health‐systems. J Am Pharm Assoc. 2019;59(3):319‐328. [DOI] [PubMed] [Google Scholar]
- 4. Berkowitz SA, Parashuram S, Rowan K, et al. Association of a care coordination model with health care costs and utilization: the Johns Hopkins Community Health Partnership (J‐CHiP). JAMA Netw Open. 2018;1(7):e184273. [DOI] [PMC free article] [PubMed] [Google Scholar]
- 5. Galbraith AA, Meyers DJ, Ross‐Degnan D, et al. Long‐term impact of a postdischarge community health worker intervention on health care costs in a safety‐net system. Health Serv Res. 2017;52(6):2061‐2078. [DOI] [PMC free article] [PubMed] [Google Scholar]
- 6. Chwastiak LA, Jackson SL, Russo J, et al. A collaborative care team to integrate behavioral health care and treatment of poorly‐controlled type 2 diabetes in an urban safety net primary care clinic. Gen Hosp Psychiatry. 2017;44:10‐15. [DOI] [PubMed] [Google Scholar]
- 7. Garcia‐Aymerich J, Hernandez C, Alonso A, et al. Effects of an integrated care intervention on risk factors of COPD readmission. Respir Med. 2007;101(7):1462‐1469. [DOI] [PubMed] [Google Scholar]
- 8. Feldman JD, Otting RI, Otting CM, Witry MJ. A community pharmacist–led service to facilitate care transitions and reduce hospital readmissions. J Am Pharm Assoc. 2018;58(1):36‐43. [DOI] [PubMed] [Google Scholar]
- 9. Rutherford P, Nielsen GA, Taylor J, Bradke P, Coleman E. How‐to Guide: Improving Transitions from the Hospital to Community. Cambridge, MA: Institute for Healthcare Improvement; 2012. [Google Scholar]
- 10. Centers for Medicare & Medicaid Services . Community‐based Care Transitions Program. Fact sheet. Washington, DC: CMS; 2015. [Google Scholar]
- 11. Fawcett S, Schultz J, Watson‐Thompson J, Fox M, Bremby R. Building multisectoral partnerships for population health and health equity. Prev Chronic Dis. 2010;7(6):A118. [PMC free article] [PubMed] [Google Scholar]
- 12. Berenson J, Shih A. Higher readmissions at safety‐net hospitals and potential policy solutions. Issue Brief. 2012;34:1‐16. [PubMed] [Google Scholar]
- 13. Cunningham PJ, Felland L. Environmental Scan to Identify the Major Research Questions and Metrics for Monitoring the Effects of the Affordable Care Act on Safety Net Hospitals. Washington, D.C.: Center for Studying Health System Change; 2013. [Google Scholar]
- 14. Kripalani S, Henderson LE, Jacobson TA, Vaccarino V. Medication use among inner‐city patients after hospital discharge: patient‐reported barriers and solutions. Mayo Clin Proc. 2008;83(5):529‐535. [DOI] [PubMed] [Google Scholar]
- 15. Neuhausen K, Davis AC, Needleman J, Brook RH, Zingmond D, Roby DH. Disproportionate‐share hospital payment reductions may threaten the financial stability of safety‐net hospitals. Health Aff. 2014;33(6):988‐996. [DOI] [PMC free article] [PubMed] [Google Scholar]
- 16. Mead KH, Brantley E, Zur J, Goldberg DG. Collaboration across the safety net in the era of health reform: opportunities or obstacles? Med Care Res Rev. 2016;74(3):286‐310. [DOI] [PubMed] [Google Scholar]
- 17. Gilman M, Adams EK, Hockenberry JM, Wilson IB, Milstein AS, Becker ER. California safety‐net hospitals likely to be penalized by ACA value, readmission, and meaningful‐use programs. Health Aff. 2014;33(8):1314‐1322. [DOI] [PubMed] [Google Scholar]
- 18. Prieto‐Centurion V, Gussin HA, Rolle AJ, Krishnan JA. Chronic obstructive pulmonary disease readmissions at minority‐serving institutions. Ann Am Thorac Soc. 2013;10(6):680‐684. [DOI] [PMC free article] [PubMed] [Google Scholar]
- 19. Calvillo‐King L, Arnold D, Eubank KJ, et al. Impact of social factors on risk of readmission or mortality in pneumonia and heart failure: systematic review. J Gen Intern Med. 2013;28(2):269‐282. [DOI] [PMC free article] [PubMed] [Google Scholar]
- 20. Felland LE, Ginsburg PB, Kishbauch GM. Improving health care access for low‐income people: lessons from ascension health's community collaboratives. Health Aff. 2011;30(7):1290‐1298. [DOI] [PubMed] [Google Scholar]
- 21. Ku L, Jones E, Shin P, Byrne FR, Long SK. Safety‐net providers after health care reform: lessons from Massachusetts. Arch Intern Med. 2011;171(15):1379‐1384. [DOI] [PubMed] [Google Scholar]
- 22. Galbraith AA, Meyers DJ, Ross‐Degnan D, et al. Long‐term impact of a postdischarge community health worker intervention on health care costs in a safety‐net system. Health Serv Res. 2017;52(6):2061‐2078. [DOI] [PMC free article] [PubMed] [Google Scholar]
- 23. Agency for Healthcare Research and Quality . Designing and Delivering Whole‐person Transitional Care. Rockville, MD: Agency for Healthcare Research and Quality; 2017. [Google Scholar]
- 24. Casas A, Troosters T, Garcia‐Aymerich J, et al. Integrated care prevents hospitalizations for exacerbations in COPD patients. Eur Respir J. 2006;28:123‐130. [DOI] [PubMed] [Google Scholar]
- 25. American Hospital Association . 2015 American Hospital Association Annual Survey. 2015.
- 26. Inpatient Prospective Payment System (IPPS) . Hospital Inpatient Prospective Payment System Database. 2015.
- 27. Centers for Medicare & Medicaid Services (US) . Hospital Compare Data. 2016. https://data.medicare.gov/data/hospital‐compare. Accessed May 10, 2018.
- 28. County Health Ranking National Data . County Health Rankings National Data. 2016.
- 29. Health Research & Educational Trust . Creating Effective Hospital‐community Partnerships to Build a Culture of Health. Chicago, IL: Health Research & Educational Trust; 2016. [Google Scholar]
- 30. Kolenikov S, Angeles G. Socioeconomic status measurement with discrete proxy variables: is principal component analysis a reliable answer? Rev Income Wealth. 2009;55(1):128‐165. [Google Scholar]
- 31. Chatterjee P, Joynt KE, Orav EJ, Jha AK. Patient experience in safety‐net hospitals: implications for improving care and value‐based purchasing. Arch Intern Med. 2012;172(16):1204‐1210. [DOI] [PubMed] [Google Scholar]
- 32. Bazzoli GJ, Thompson MP, Waters TM. Medicare payment penalties and safety net hospital profitability: minimal impact on these vulnerable hospitals. Health Serv Res. 2018;53(5):3495‐3506. [DOI] [PMC free article] [PubMed] [Google Scholar]
- 33. Vaz LE, Kleinman KP, Kawai AT, et al. Impact of Medicare’s hospital‐acquired condition policy on infections in safety net and non–safety net hospitals. Infect Control Hosp Epidemiol. 2015;36(6):649‐655. [DOI] [PubMed] [Google Scholar]
- 34. Press MJ, Matthew JP, Scanlon DP, et al. Limits of readmission rates in measuring hospital quality suggest the need for added metrics. Health Aff. 2013;32(6):1083‐1091. [DOI] [PubMed] [Google Scholar]
- 35. Robinson S, Howie‐Esquivel J, Vlahov D. Readmission risk factors after hospital discharge among the elderly. Popul Health Manag. 2012;15(6):338‐351. [DOI] [PubMed] [Google Scholar]
- 36. Kind AJ, Jencks S, Brock J, et al. Neighborhood socioeconomic disadvantage and 30‐day rehospitalization: a retrospective cohort study. Ann Intern Med. 2014;161(11):765‐774. [DOI] [PMC free article] [PubMed] [Google Scholar]
- 37. Herrin J, St. Andre J, Kenward K, Joshi MS, Audet AMJ, Hines SC. Community factors and hospital readmission rates. Health Serv Res. 2015;50(1):20‐39. [DOI] [PMC free article] [PubMed] [Google Scholar]
- 38. Wan TT, Ortiz J, Du A, Golden AG. Contextual, organizational and ecological effects on the variations in hospital readmissions of rural Medicare beneficiaries in eight southeastern states. Health Care Manag Sci. 2017;20(1):94‐104. [DOI] [PMC free article] [PubMed] [Google Scholar]
- 39. Hu J, Gonsahn MD, Nerenz DR. Socioeconomic status and readmissions: evidence from an urban teaching hospital. Health Aff. 2014;33(5):778‐785. [DOI] [PubMed] [Google Scholar]
- 40. Castle NG. Nursing home closures and quality of care. Medical Care Res Rev. 2005;62(1):111‐132. [DOI] [PubMed] [Google Scholar]
- 41. Krumholz HM, Merrill AR, Schone EM, et al. Patterns of hospital performance in acute myocardial infarction and heart failure 30‐day mortality and readmission. Circ Cardiovasc Qual Outcomes. 2009;2(5):407‐413. [DOI] [PubMed] [Google Scholar]
- 42. Conner KO, Meng H, Marino V, Boaz TL. Individual and organizational factors associated with hospital readmission rates: evidence from a US National sample. J Appl Gerontol. 2019. 10.1177/0733464819870983 [Epub ahead of print] [DOI] [PubMed] [Google Scholar]
- 43. Cheon O, Song M, Mccrea AM, Meier KJ. Health care in America: the relationship between subjective and objective assessments of hospitals. Int Public Manag J. 2019;1‐27. [Google Scholar]
- 44. Sawilowsky S, Fahoome G. Kruskal‐Wallis Test. Encyclopedia of Statistics in Behavioral Science. Hoboken, NJ: John Wiley and Sons Ltd; 2005. [Google Scholar]
- 45. Hung D, Truong Q, Yakir M, Nicosia F. Hospital‐community partnerships to aid transitions for older adults: applying the care transitions framework. J Nurs Care Qual. 2018;33(3):221‐228. [DOI] [PubMed] [Google Scholar]
- 46. Amirkhanyan AA, Cheon O, Davis JA, Meier KJ, Wang F. Citizen participation and its impact on performance in US nursing homes. Am Rev Public Adm. 2019;49(7):840‐854. [Google Scholar]
- 47. Van Spall HG, et al. Effect of patient‐centered transitional care services on clinical outcomes in patients hospitalized for heart failure: the PACT‐HF Randomized Clinical Trial. JAMA. 2019;321(8):753‐761. [DOI] [PMC free article] [PubMed] [Google Scholar]
- 48. Roberts ET, Zaslavsky AM, Barnett ML, Landon BE, Ding L, McWilliams JM. Assessment of the effect of adjustment for patient characteristics on hospital readmission rates: implications for pay for performance. JAMA Intern Med. 2018;178(11):1498‐1507. [DOI] [PMC free article] [PubMed] [Google Scholar]
- 49. Joynt KE, Zuckerman R, Epstein AM. Social risk factors and performance under Medicare’s value‐based purchasing programs. Cir Cardiovasc Qual Outcomes. 2017;10(5):e003587. [DOI] [PubMed] [Google Scholar]
- 50. Barnett ML, Hsu J, McWilliams JM. Patient characteristics and differences in hospital readmission rates. JAMA Intern Med. 2015;175(11):1803‐1812. [DOI] [PMC free article] [PubMed] [Google Scholar]
- 51. Arbaje AI, Wolff JL, Yu Q, Powe NR, Anderson GF, Boult C. Postdischarge environmental and socioeconomic factors and the likelihood of early hospital readmission among community‐dwelling Medicare beneficiaries. Gerontologist. 2008;48(4):495‐504. [DOI] [PubMed] [Google Scholar]
- 52. Mitchell SM, Shortell SM. The governance and management of effective community health partnerships: a typology for research, policy, and practice. Milbank Q. 2000;78(2):241‐289. [DOI] [PMC free article] [PubMed] [Google Scholar]
- 53. Joynt KE, Jha AK. Characteristics of hospitals receiving penalties under the Hospital Readmissions Reduction Program. JAMA. 2013;309(4):342‐343. [DOI] [PubMed] [Google Scholar]
Associated Data
This section collects any data citations, data availability statements, or supplementary materials included in this article.
Supplementary Materials
Author Matrix
Appendix S1‐S4