

Abstract
We employed Mendelian randomization (MR) to evaluate the causal relationship between leukocyte telomere length (LTL) and amyotrophic lateral sclerosis (ALS) with summary statistics from genome-wide association studies (n = ~ 38,000 for LTL and ~ 81,000 for ALS in the European population; n = ~ 23,000 for LTL and ~ 4,100 for ALS in the Asian population). We further evaluated mediation roles of lipids in the pathway from LTL to ALS. The odds ratio per standard deviation decrease of LTL on ALS was 1.10 (95% CI 0.93–1.31, p = 0.274) in the European population and 0.75 (95% CI 0.53–1.07, p = 0.116) in the Asian population. This null association was also detected between LTL and frontotemporal dementia in the European population. However, we found that an indirect effect of LTL on ALS might be mediated by low density lipoprotein (LDL) or total cholesterol (TC) in the European population. These results were robust against extensive sensitivity analyses. Overall, our MR study did not support the direct causal association between LTL and the ALS risk in neither population, but provided suggestive evidence for the mediation role of LDL or TC on the influence of LTL and ALS in the European population.
Subject terms: Computational biology and bioinformatics, Genetics, Medical research, Neurology, Risk factors
Introduction
Amyotrophic lateral sclerosis (ALS) is an adult-onset fatal multisystem neurodegenerative disease, leading to substantial public health threat although it is relatively rare worldwide. However, the cause and pathogenesis underlying ALS mostly remains unknown, with few replicable and definitive risk factors and scarce drugs available1–4. The number of ALS cases is predicted to increase dramatically due to population aging in the coming years5, which would further aggravate the ALS-associated social and economic burden. Therefore, the identification of its risk factors can provide better understanding of ALS and has the potential to pave the way for therapeutic intervention.
In the past few years the role of telomere in various complex diseases has attracted much attention6. Progressive telomere shortening occurs in all dividing normal cells due to incomplete synthesis of DNA lagging-strand, oxidative damage and other factors, which ultimately leads to cellular growth arrest or apoptosis that is thought to be an initial proliferative barrier to tumor development in humans7. Indeed, recent studies suggested that leukocyte telomere length (LTL) was widely relevant to age-related diseases and disorders (e.g. many types of cancer and coronary heart disease)8–11. In particular, it was demonstrated that shorter LTL was associated with various neurodegenerative disorders. For example, a latest study showed LTL at baseline and 18 months was shorter in patients of Parkinson's disease (PD) compared to healthy controls12, although prior studies found nonsignificant association between LTL and PD (Table 1). In addition, telomere shortening was recognized as an indicator of progression for Alzheimer’s disease (AD) (Table 1).
Table 1.
Estimated effect sizes of shorter LTL on neurodegenerative diseases in previous studies.
| NDD | OR/HR (95% CI, p) | N (case/control) | Country | References |
|---|---|---|---|---|
| PD | 0.70 (0.38–1.28, 0.246) | 956/1,284 | EUR and Asian | 74 |
| PD | 0.91 (0.71–1.16, 0.450) | 96/172 | USA | 75 |
| PD | 0.99 (0.77–1.27, 0.535) | 131/115 | Finland | 76 |
| PD | 0.99 (0.88–1.12, 0.875) | 408/809 | USA | 77 |
| PD | 1.30 (0.76–2.17, 0.340) | 28/27 | Japan | 78 |
| ALS | 0.89 (0.68–1.16, 0.400) | 6,100/7,125 | EUR | 9 |
| ALS | 0.92 (0.87–0.97, 0.008) | 1,241/335 | UK | 14 |
| AD | 1.03 (1.01–1.05, 0.012) | 71,880/383,378 | EUR | 79 |
| AD | 1.05 (1.01–1.09, 0.010) | 71,880/383,378 | EUR | 80 |
| AD | 1.19 (1.02–1.41, 0.030) | 17,008/37,154 | EUR | 9 |
| AD | 1.35 (1.12–1.67, 0.002) | 25,580/48,466 | EUR | 81 |
| AD | 1.35 (1.11–1.67, 0.003) | 25,580/48,466 | EUR | 82 |
| AD | 2.70 (1.69–4.17, 1.47E−05) | 860/2,022 | Multiethnic | 83 |
| Dementia | 1.20 (1.00–1.47, 0.058) | 190/1,469 | Multiethnic | 84 |
| Dementia | 5.26 (1.85–14.3, 0.002) | 20/151 | UK | 85 |
NDD neurodegenerative disease, PD Parkinson’s disease, ALS amyotrophic lateral sclerosis, AD Alzheimer’s disease, OR odds ratio, HR hazard ratio, CI confidence internal, p p value, N sample size, EUR European.
However, the knowledge about the relationship between LTL and ALS is very limited. Previous studies proposed that telomerase inhibition could be a pathogenetic contributor to the neurodegeneration in ALS13. A recent study14, along with ALS animal models15, offered some evidence that shorter LTL likely decreased the risk of ALS (Table 1). However, it remains uncertain whether such association is causal or not. Because it is rather challenging to determinate causal relationship between LTL and ALS via observational studies or randomized controlled trials (RCT), in this study we resort to another novel statistical approach called Mendelian randomization (MR)16,17. Briefly, depending on single nucleotide polymorphisms (SNPs) as instrumental variables, MR can infer the causal association between an exposure (e.g. LTL) and an outcome (e.g. ALS)17,18. The basic idea behind MR is that the two alleles of a genetic variant are randomly allocated during the process of gamete formation under the Mendel’s law; such allocation is analogous to the randomization of subjects in RCT and hence has a powerful control for reverse causality and confounders19 (Supplementary Fig. S1). Furthermore, the recent success of large-scale genome-wide association studies (GWASs)20–24 allows us to choose appropriate SNPs as valid instrumental variables for a variety of exposures for causal inference in MR25–27.
In this study we aim to investigate whether there exists a causal association between LTL and the risk of ALS. To achieve such goal, we conducted the two-sample MR analysis with summary statistics publicly available from GWASs with ~ 38,000 individuals for LTL and ~ 81,000 individuals for ALS in the European population, and with ~ 23,000 individuals for LTL and ~ 4,100 individuals for ALS in the Asian population. Additionally, we further explored the mediation role of lipids in the relationship between LTL and ALS with network MR analysis given the evidence that blood lipids may be relevant to ALS.
Materials and methods
GWAS data sources for LTL, ALS and other relevant traits
We first obtained genetic data for LTL from the ENGAGE Telomere Consortium21, where a total of ~ 2.3 million SNPs for 37,684 individuals of European ancestry were contained after quality control (Supplementary Text). In this study LTL was measured as a continuous variable, and the linear additive regression was implemented for each genetic variant to detect the association with LTL21. A set of independent associated index SNPs (p < 5.00E−8) were selected as candidate instrumental variables for LTL. To minimize the pleiotropic bias of instruments, we applied a conservative manner28 that was previously undertaken in many MR studies20,29–32. Specifically, we would remove index SNPs that were located within 1 Mb of ALS-associated locus (Supplementary Table S1) and that may be potentially related to ALS if their Bonferroni-adjusted p values were less than 0.05. Finally, we reserved seven SNPs to serve as instrumental variables. To estimate the causal effect of LTL on ALS, we obtained summary statistics from the largest ALS GWAS that contained ~ 10 million SNPs on 80,610 European individuals (20,806 ALS cases and 59,804 controls)20 (https://als.umassmed.edu/). The summary statistics (e.g. marginal effect size, standard error and effect allele) of these instruments are shown in Table 2.
Table 2.
Summary information of instrumental variables for LTL and ALS in the European population.
| SNP | GENE | CHR | BP | A1/A2 | LTL | ALS | PVE | F | ||||||
|---|---|---|---|---|---|---|---|---|---|---|---|---|---|---|
| BETA | SE | p | N | BETA | SE | p | N | |||||||
| rs11125529 | TERT | 2 | 54,329,370 | C/A | − 0.056 | 0.010 | 4.48E−08 | 37,653 | − 0.007 | 0.020 | 0.730 | 80,610 | 8.32E−04 | 31.4 |
| rs10936599 | TERC | 3 | 170,974,795 | T/C | − 0.079 | 0.008 | 2.54E−31 | 37,669 | 0.003 | 0.016 | 0.839 | 80,610 | 3.89E−03 | 147.0 |
| rs7675998 | ZNF208 | 4 | 164,227,270 | A/G | − 0.074 | 0.009 | 4.35E−16 | 34,694 | − 0.005 | 0.016 | 0.747 | 80,610 | 1.94E−03 | 67.6 |
| rs2736100 | NAF1 | 5 | 1,339,516 | A/C | − 0.078 | 0.009 | 4.38E−19 | 25,842 | 0.010 | 0.014 | 0.493 | 80,610 | 2.90E−03 | 75.1 |
| rs9420907 | ACYP2 | 10 | 105,666,455 | A/C | − 0.069 | 0.010 | 6.90E−11 | 37,653 | 0.050 | 0.019 | 0.011 | 80,610 | 1.26E−03 | 47.6 |
| rs8105767 | RTEL1 | 19 | 22,007,281 | A/G | − 0.048 | 0.008 | 1.11E−09 | 37,499 | 0.006 | 0.015 | 0.683 | 80,610 | 9.59E−04 | 36.0 |
| rs755017 | OBFC1 | 20 | 61,892,066 | A/G | − 0.062 | 0.011 | 6.71E−09 | 37,113 | − 0.005 | 0.022 | 0.831 | 80,610 | 8.55E−04 | 31.8 |
SNP the label of single-nucleotide polymorphism that served as instrumental variable, CHR chromosome, BP base position, A1 effect allele, indicates the allele that is associated with shorter LTL, explaining why all the BETA estimates are negative, A2 alternative allele, BETA SNP effect size, SE standard error of the SNP effect size, p and N are respectively the p value and sample size, PVE proportion of variance explained by the SNP (i.e. 86, where and are the estimated effect size and variance for instrument i; F: F statistic (i.e. 87,88, where Ni is the sample size for instrument i and k is the number of instruments). Both of PVE and F statistic are calculated to validate the issue of weak instruments.
In addition, since ALS and frontotemporal dementia (FTD) often represent a continuous disease spectrum with comorbidity in up to 50% cases, and share common genetic mechanisms33–35, we also explored the causal association between LTL and FTD with MR approaches (Table 3). We removed index SNPs that were associated with FTD36 and reserved six instruments as one instrument was missing in the FTD GWAS data set (Supplementary Tables S2-S3). Furthermore, we attempted to validate whether the identified relationship between LTL and ALS in the European population also holds in the Asian population. Therefore, we performed additional MR analyses with another two GWAS datasets in which both LTL22 and ALS37 were conducted on the Asian individuals (Supplementary Text). Note that, the two sets of index SNPs of LTL from the two populations share no common instruments (Table 2 and Supplementary Table S4).
Table 3.
GWAS data sets used in our MR analysis in the present study.
| Traits | Pop | k1/k0 | N (case/control) | Data source |
|---|---|---|---|---|
| ALS | EUR | 80,610 (20,806/59,804) | AVS20 | |
| HDL | EUR | 85/87 | 93,561 | GLGC61 |
| LDL | EUR | 78/78 | 89,138 | GLGC61 |
| TC | EUR | 86/86 | 93,845 | GLGC61 |
| TG | EUR | 53/54 | 90,263 | GLGC61 |
| LTL | EUR | 7/7 | 37,684 | ENGAGE21 |
| FTD | EUR | 12,928 (3,526/9,402) | IFGC36 | |
| HDL | EUR | 79/87 | 93,561 | GLGC61 |
| LDL | EUR | 66/78 | 89,138 | GLGC61 |
| TC | EUR | 76/86 | 93,845 | GLGC61 |
| TG | EUR | 47/54 | 90,263 | GLGC61 |
| LTL | EUR | 6/7 | 37,684 | ENGAGE21 |
| ALS | Asian | 4,084 (1,234/2,850) | Benyamin37 | |
| HDL | Asian | 30/31 | 70,657 | Kanai89 |
| LDL | Asian | 21/22 | 72,866 | Kanai89 |
| TC | Asian | 31/32 | 128,305 | Kanai89 |
| TG | Asian | 26/26 | 105,597 | Kanai89 |
| LTL | Asian | 8/10 | 23,096 | SCHS22 |
Here k1 is the final number of instruments employed in the analysis while k0 is the number of candidate instruments.
ALS amyotrophic lateral sclerosis, FTD frontotemporal dementia, HDL high density lipoprotein, LDL low density lipoprotein, TC total cholesterol, TG triglycerides, LTL leukocyte telomere length, Pop population, EUR European, AVS the ALS Variant Server, IFGC International FTD-Genomics Consortium, GLGC Global Lipids Genetics Consortium, ENGAGE European Network for Genetic and Genomic Epidemiology, SCHS Singapore Chinese Health Study.
We note that the ALS cases were sporadic and the European-ALS GWAS adjusted the effect of age in the association analysis (Supplementary Text). The latter indicates that the confounding effect due to age on the causal effect estimation was removed. In addition, given the fact that LTL would shorten progressively with age, to facilitate the explanation of our results, we thus made a sign transformation for effect sizes of those used instrumental variables so that the causal relationship corresponds to shorter LTL.
Causal effect estimation via two-sample Mendelian randomization
We implemented the two-sample MR to estimate the causal effect of LTL on ALS via inverse-variance weighted (IVW) methods38–41 (Supplementary Text). We also employed the weighted median method42, likelihood-based approach43, leave-one-out (LOO) analysis44, MR-PRESSO test45 and MR-Egger regression38,46 as part of sensitivity analyses to validate the robustness of our results. As a supplementary analysis, we further implemented the generalized summary based Mendelian Randomization (GSMR) method47 by leveraging possible linkage disequilibrium among instruments, and applied the HEIDI-outlier approach to detect pleiotropic instrumental variables.
Mediation analysis to explore the mediation effect of lipids between LTL and ALS/FTD
In our MR analysis, we attempted to provide deeper insight into the relationship between LTL and ALS/FTD by conducting mediation analysis although non-significant causal associations were identified in neither population. Because previous studies showed LTL was associated with blood lipid levels48–52 (as would be also confirmed by our results; see below for details), and because there existed evidence for potential causal associations between lipids and ALS3,53,54, we further investigated whether the effect of LTL on ALS/FTD might be mediated through lipids55–59 by implementing network MR analysis60 with the lipid trait (e.g. HDL, LDL, TC or TG)61 as mediator (Supplementary Fig. S2 and Supplementary Text). Besides LTL, in the network MR analysis each of lipids should also have a set of instrumental variables (Table 3). The details of selecting instrumental variables for lipids were described elsewhere53. To make the estimated causal effects comparable between the European and Asian populations, following prior work53 we unified the units of lipid in the two populations (Supplementary Text). The summary statistics of instruments for lipids are displayed in Supplementary Tables S5-S9.
Results
Causal effect of LTL on ALS and FTD
A total of seven instrumental variables of LTL were employed in the European population (Table 2). All the selected instruments collectively explain about 1.26% phenotypic variation of LTL and all the F statistics are above 10 (ranging from 31.4 to 147.0 with an average of 62.3) (Table 2), which rules out the possibility of weak instrument bias28,39,62. With the fixed-effects IVW method, we observe that the odds ratio (OR) per standard deviation (SD) decrease of LTL (~ 30 base pair per year) on ALS is 1.10 (95% confidence interval [CI] 0.93–1.31, p = 0.274) in the European population and 0.75 (95% CI 0.53–1.07, p = 0.116) in the Asian population (Table 4). We also fail to detect statistically significant causal relationship between LTL and FTD in the European population, with the OR per SD decrease of LTL on FTD estimated to be 0.81 (95% CI 0.44–1.48, p = 0.498) (Table 4).
Table 4.
Association of LTL with the risk of ALS or FTD in the European and Asian populations.
| Method | ALS-european | FTD-european | ALS-asian |
|---|---|---|---|
| OR (95% CI, p) | OR (95% CI, p) | OR (95% CI, p) | |
| IVW-random | 1.10 (0.92–1.32, 0.284) | 0.81 (0.44–1.48, 0.498) | 0.75 (0.53–1.07, 0.116) |
| IVW-fixed | 1.10 (0.93–1.31, 0.274) | 0.81 (0.44–1.48, 0.498) | 0.75 (0.53–1.07, 0.116) |
| MR-Egger | 1.02 (0.32–3.29, 0.964) | 0.40 (0.01–14.71, 0.516) | 0.61 (0.24–1.56, 0.241) |
| Weighted Median | 1.06 (0.85–1.32, 0.624) | 0.73 (0.35–1.52, 0.400) | 0.67 (0.43–1.05, 0.082) |
| Likelihood | 1.10 (0.92–1.32, 0.290) | 0.81 (0.44–1.48, 0.496) | 0.75 (0.53–1.07, 0.115) |
| GSMR | 1.10 (0.93–1.31, 0.274) | 0.81 (0.44–1.48, 0.498) | 0.73 (0.51–1.05, 0.086)a |
The intercept of the MR-Egger regression is 0.006 (95% CI − 0.079–0.090, p = 0.872), 0.055 (95% CI − 0.214–0.323, p = 0.601) or 0.026 (95% CI − 0.076–0.128, p = 0.552), respectively.
aSeven instruments were finally employed because the genotype of rs41309367 on gene RTEL1 was missing in the 1,000 Genomes Project.
We now validated the causal effect of LTL on ALS estimated above through various sensitivity analyses. Here, we mainly focused on the relationship between LTL and ALS in the European population (Table 4). The weighted median and maximum likelihood methods generate similar null causal effect estimates. In particular, the OR is estimated to be 1.06 (95% CI 0.85–1.32, p = 0.624) by the weighted median method and 1.10 (95% CI 0.92–1.32, p = 0.290) by the maximum likelihood approach. Both the LOO (Supplementary Table S10) and MR-PRESSO analyses indicate that no instrument outliers exist (see also Fig. 1). The MR-Egger regression provides little evidence of horizontal pleiotropy as its intercept is not significantly deviated from zero (0.006, 95% CI − 0.079–0.090, p = 0.872). The results of sensitivity analyses for LTL and ALS in the Asian population as well as for LTL and FTD in the European population are summarized in Supplementary Tables S11-S12.
Figure 1.

Relationship between effect sizes on LTL and ALS/FTD for SNPs served as instrumental variables. Results are shown for seven SNPs of ALS (a) and six SNPs of FTD (b) in the European population. Results are also displayed for eight SNPs of ALS in the Asian population (c). In each panel, horizontal/vertical lines represent the 95% confidence intervals.
Finally, we conducted GSMR with genotypes of 503 European individuals or 504 Asian individuals in the 1,000 Genomes Project as reference panel63. It is shown that GSMR generates consistent causal effect estimates with previous results (Table 4), again supporting the null association between LTL and ALS/FTD. In addition, the HEIDI-outlier approach does not detect any instruments that exhibit apparent pleiotropic effects, implying the observed association between LTL and ALS/FTD would be not confounded by pleiotropy.
Mediation analysis of the role between LTL, lipids and ALS/FTD
Although we do not find statistically significant evidence that LTL causally influences ALS/FTD in the direct biological pathway, we cannot fully exclude the probability that LTL may impact ALS/FTD via other indirect pathways. We selected six or eight index association SNPs to serve as instrumental variables for LTL on lipids in the European and Asian populations, respectively. In the European population, the causal effects per SD decrease of LTL on HDL and TG are 0.08 (95% CI 0.03–0.14, p = 0.005) and − 0.10 (95% CI − 0.15 to − 0.04, p = 0.001), respectively (Table 5). However, HDL and TG are not associated with ALS, implying there may be no indirect effects of LTL on ALS mediated by HDL or TG.
Table 5.
Three directions of the relation with exposure to mediator, mediator to outcome and exposure to outcome.
| Pop | Exposure | Mediator | a | SE (a) | p | Mediator | Outcome | b | SE (b) | p | Exposure | Outcome | c | SE (c) | p |
|---|---|---|---|---|---|---|---|---|---|---|---|---|---|---|---|
| EUR | LTL | HDL | 0.082 | 0.029 | 0.005 | HDL | ALS | 0.013 | 0.039 | 0.743 | LTL | ALS | 0.097 | 0.089 | 0.274 |
| LTL | LDL | − 0.060 | 0.031 | 0.057 | LDL | ALS | − 0.110 | 0.031 | 3.41E−04 | LTL | ALS | 0.097 | 0.089 | 0.274 | |
| LTL | TC | − 0.059 | 0.031 | 0.052 | TC | ALS | − 0.098 | 0.032 | 0.002 | LTL | ALS | 0.097 | 0.089 | 0.274 | |
| LTL | TG | − 0.095 | 0.028 | 0.001 | TG | ALS | − 0.045 | 0.044 | 0.309 | LTL | ALS | 0.097 | 0.089 | 0.274 | |
| LTL | HDL | 0.082 | 0.029 | 0.005 | HDL | FTD | − 0.035 | 0.125 | 0.786 | LTL | FTD | − 0.208 | 0.308 | 0.498 | |
| LTL | LDL | − 0.060 | 0.031 | 0.057 | LDL | FTD | − 0.139 | 0.107 | 0.196 | LTL | FTD | − 0.208 | 0.308 | 0.498 | |
| LTL | TC | − 0.059 | 0.031 | 0.052 | TC | FTD | − 0.142 | 0.104 | 0.172 | LTL | FTD | − 0.208 | 0.308 | 0.498 | |
| LTL | TG | − 0.095 | 0.028 | 0.001 | TG | FTD | − 0.018 | 0.140 | 0.898 | LTL | FTD | − 0.208 | 0.308 | 0.498 | |
| Asian | LTL | HDL | − 0.020 | 0.022 | 0.366 | HDL | ALS | 0.108 | 0.129 | 0.404 | LTL | ALS | − 0.284 | 0.180 | 0.116 |
| LTL | LDL | 0.003 | 0.023 | 0.898 | LDL | ALS | − 0.234 | 0.131 | 0.073 | LTL | ALS | − 0.284 | 0.180 | 0.116 | |
| LTL | TC | − 0.002 | 0.014 | 0.911 | TC | ALS | − 0.276 | 0.214 | 0.197 | LTL | ALS | − 0.284 | 0.180 | 0.116 | |
| LTL | TG | 0.018 | 0.014 | 0.214 | TG | ALS | 0.160 | 0.195 | 0.414 | LTL | ALS | − 0.284 | 0.180 | 0.116 |
Pop population, EUR European, LTL leukocyte telomere length, HDL high density lipoprotein, LDL low density lipoprotein, TC total cholesterol, TG triglycerides, ALS amyotrophic lateral sclerosis, FTD frontotemporal dementia, p p value,
The effect size and the standard error of the relationship with Exposure to Mediator, Mediator to Outcome and Exposure to Outcome are denoted as a, b, c and SE(a), SE(b), SE(c), respectively.
The marginally significant causal association between LTL and LDL/TC and the significant causal association between LDL/TC and ALS in the European population are shown in bold.
On the other hand, the causal effect per SD decrease of LTL on LDL and TC are − 0.06 (95% CI − 0.12–0.00, p = 0.057) and − 0.06 (95% CI − 0.12–0.00, p = 0.052), respectively, both of which are marginally significant at the level of 0.05. Moreover, in the European population these two lipids are causally associated with ALS: the ORs per SD decrease of LDL (~ 37.0 mg/dL) and TC (~ 42.6 mg/dL) on ALS are − 0.11 (95% CI − 0.17 to − 0.05, p = 3.41E−04) and − 0.10 (95% CI − 0.16 to − 0.04, p = 0.002), respectively. Therefore, based on the basic principle of the classical mediation inference, we can reasonably state that there likely exists potential indirect effect of LTL on ALS mediated by LDL (ab = 0.007 and p = 0.079) or TC (ab = 0.006 and p = 0.092) (Table 6). More specifically, in terms of the suggestive evidence of mediation effects displayed above, in the European population we can conclude that shorter LTL can reduce the LDL/TC level, which in turn results in the lower risk of ALS. However, we fail to repeat such mediation association for ALS in the Asian population or for FTD in the European population (Tables 5, 6).
Table 6.
Mediation analysis of the role between telomere length, lipids and ALS/FTD.
| Pop | Exposure | Mediator | Outcome | ab (Sab) | 95% CI | Z | p |
|---|---|---|---|---|---|---|---|
| EUR | LTL | HDL | ALS | 0.001 (0.003) | − 0.005–0.007 | 0.354 | 0.724 |
| LTL | LDL | ALS | 0.007 (0.004) | − 0.001–0.014 | 1.754 | 0.079 | |
| LTL | TC | ALS | 0.006 (0.003) | − 0.001–0.013 | 1.682 | 0.092 | |
| LTL | TG | ALS | 0.004 (0.004) | − 0.004–0.012 | 1.021 | 0.307 | |
| LTL | HDL | FTD | − 0.003 (0.010) | − 0.022–0.016 | − 0.298 | 0.766 | |
| LTL | LDL | FTD | 0.008 (0.007) | − 0.005–0.022 | 1.194 | 0.232 | |
| LTL | TC | FTD | 0.008 (0.007) | − 0.005–0.022 | 1.227 | 0.220 | |
| LTL | TG | FTD | 0.002 (0.013) | − 0.023–0.027 | 0.134 | 0.893 | |
| Asian | LTL | HDL | ALS | − 0.002 (0.002) | − 0.006–0.002 | − 1.048 | 0.295 |
| LTL | LDL | ALS | − 0.001 (0.004) | − 0.009–0.008 | − 0.157 | 0.875 | |
| LTL | TC | ALS | 0.001 (0.002) | − 0.004–0.005 | 0.223 | 0.824 | |
| LTL | TG | ALS | 0.003 (0.003) | − 0.003–0.009 | 0.916 | 0.360 |
Pop population, EUR European, LTL leukocyte telomere length, HDL high density lipoprotein, LDL low density lipoprotein, TC total cholesterol, TG triglycerides, ALS amyotrophic lateral sclerosis, FTD frontotemporal dementia, ab the mediation effect, Sab standard error of the mediation effect, CI, Z and p represent confidence internal, Z statistic and p value, respectively.
The marginally significant mediated effect of LTL on the risk of ALS by LDL or TC are shown in bold.
Finally, we examined whether the lack of detectable non-zero causal effect of LTL on ALS is due to the lack of statistical power. We calculated the statistical power to detect an OR of 1.10 or 1.20 (approximately equal the estimated causal effects above) per SD decrease of LTL on the risk of ALS following an analytic approach (https://cnsgenomics.shinyapps.io/mRnd/)64. It is shown the estimated statistical power is only 15% or 44% (Fig. 2), indicating we have low to moderate power to identify such causal effect with current sample sizes if LTL is indeed causally associated with the risk of ALS.
Figure 2.
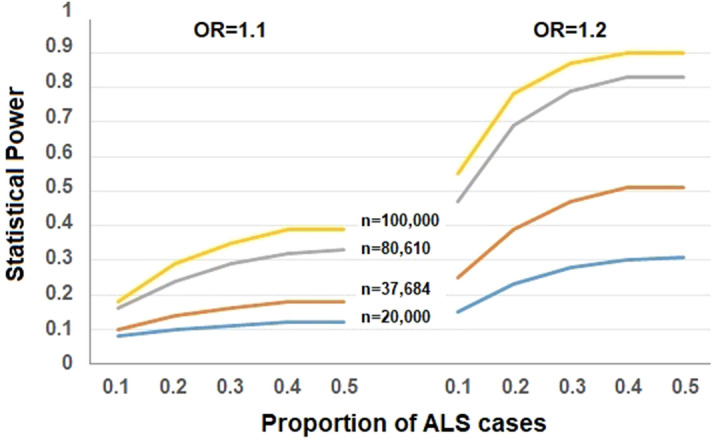
Statistical power calculation for the causal effect of LTL on ALS estimated with the method proposed in64. In the calculation, the total phenotypic variance explained by instrumental variables was 1.26% and the proportion of ALS cases varied from 0.1 to 0.5, the significance level was 0.05, the sample size was 20,000, 37,684, 80,610 or 100,000, and the OR = 1.10 or 1.20.
Discussion
In the present study we have implemented a comprehensive two-sample MR analysis to dissect whether there exists causal relationship between LTL and the risk of ALS. To our knowledge, this is the first MR study to investigate the relationship between LTL and ALS using statistical genetic approaches via summary statistics available from large-scale GWAS. We found that an indirect effect of LTL on ALS might be mediated by LDL or TC, although our MR analysis did not support the existence of direct causal association between LTL and ALS/FTD. These findings were robust to the choice of statistical methods and were carefully validated through various sensitivity analyses.
Our results are not fully consistent with those in previous studies (Table 1). For example, previous studies displayed distinct association in direction and magnitude between LTL and ALS in the European population9,14. Compared to those prior work, our study has the advantage of larger sample size (20,806/59,804 vs. 6,100/7,125 and 1,241/335) and thus holds higher power. In addition, we recognize that the estimated causal effect of shorter LTL on ALS had an opposite direction in the two populations although they were non-significant in neither population. Given the substantial difference of ALS in clinical features and molecular mechanisms between European and Asian populations65–69, this finding may not be unexpected. As little has been known about the causal factors for ALS to date1, our study therefore contributes considerably to the research area on the relationship between LTL and the risk of ALS, and has potential implication for the therapeutic intervention of ALS.
Besides revealing the null causal relationship between LTL and ALS in the two populations, our study also, at least in part, offers empirical evidence for several questions that were previously unanswered. First, we also validated that the causal association did not hold between LTL and FTD, which might be partly due to the fact that FTD and ALS share extensive similarities in clinical manifestation and genetic foundation33–35. Second, unlike previous studies, the mediation analysis was performed, which provided suggestive evidence supporting the mediation role of LDL or TC in the causal pathway from LTL to ALS in the European population. Therefore, interventions by targeting LDL or TC can be considered as a potential promising manner to counteract the effect of LTL changes on the risk of ALS.
Of course, our study is not without drawbacks. In addition to the general MR limitations similar to other work (e.g. the linear effect assumption), other potential shortcomings should be mentioned17,18,70. First, in our study telomere length measured in blood leukocytes was employed; however, LTL may be not representative of telomere length in tissues that are most relevant to ALS. Second, we note that the Asian-ALS GWAS and the European-FTD GWAS did not adjust the effect of age in their association analyses (Supplementary Text), which may bias our estimates because telomere length would become short with age. However, we cannot examine the causal effect between LTL and ALS/FTD stratified by the age group1,6 as it is impossible for us to obtain individual-level GWAS datasets due to privacy concerns. Third, as C9orf72, TARDBP and FUS are known to be the most common mutated genes in ALS71–73. Removing ALS patients with mutations in those genes and performing additional sensitivity analysis can shed new lights on the relationship between LTL and ALS in more general population of sporadic ALS cases (note that excluding those special ALS cases might lead to the reduction of statistical power because of decreased sample size). Again, we cannot conduct such analysis as individual datasets are not accessible. Fourth, as shown above, our MR analysis has only limited statistical power; in addition, our mediation analysis showed that the mediated effect of LTL on the risk of ALS by LDL or TC was only marginally significant. Therefore, studies with larger sample size are required to validate our results in both the European and Asian populations.
Conclusions
Our MR study did not support the causal association between LTL and the risk of ALS in neither the European population nor the Asian population, but provided suggestive evidence supporting the mediation role of LDL or TC on the influence of LTL and ALS in the European population.
Supplementary information
Acknowledgements
We thank the ENGAGE Telomere Consortium, AVS, IFGC and all other GWAS consortium studies for making summary statistics datasets publicly available for us and are grateful to all the investigators and participants who contributed to those studies. Further acknowledgements for IFGC can be found in the Supplementary Acknowledgment. This study was supported by Youth Foundation of Humanity and Social Science funded by Ministry of Education of China (18YJC910002), the Natural Science Foundation of Jiangsu (BK20181472), the China Postdoctoral Science Foundation (2018M630607 and 2019T120465), the QingLan Research Project of Jiangsu for Outstanding Young Teachers, the Six-Talent Peaks Project in Jiangsu of China (WSN-087), the Social Development Project of Xuzhou (KC19017), the Project funded by Postdoctoral Science Foundation of Xuzhou Medical University, the National Natural Science Foundation of China (81402765), the Statistical Science Research Project from National Bureau of Statistics of China (2014LY112) and the Priority Academic Program Development of Jiangsu Higher Education Institutions (PAPD) for Xuzhou Medical University.
Author contributions
P.Z. and H.Z. conceived the idea for the study. P.Z. and Y.G. obtained the data. P.Z. and Y.G. cleared up the datasets; P.Z., T.W. and Y.G. performed the data analyses. P.Z., T.W., Y.G. and X.Y. interpreted the results of the data analyses. The IFGC Consortium provided the FTD summary data that was used in this study. All the authors reviewed the manuscript.
Competing interests
The authors declare no competing interests.
Footnotes
Publisher's note
Springer Nature remains neutral with regard to jurisdictional claims in published maps and institutional affiliations.
These authors contributed equally: Yixin Gao and Ting Wang.
A list of authors and their affiliations appears at the end of the paper.
Contributor Information
Huashuo Zhao, Email: hszhao@xzhmu.edu.cn.
Ping Zeng, Email: zpstat@xzhmu.edu.cn.
International FTD-Genomics Consortium (IFGC):
Raffaele Ferrari, Dena G. Hernandez, Michael A. Nalls, Jonathan D. Rohrer, Adaikalavan Ramasamy, John B. J. Kwok, Carol Dobson-Stone, William S. Brooks, Peter R. Schofield, Glenda M. Halliday, John R. Hodges, Olivier Piguet, Lauren Bartley, Elizabeth Thompson, Eric Haan, Isabel Hernández, Agustín Ruiz, Mercè Boada, Barbara Borroni, Alessandro Padovani, Carlos Cruchaga, Nigel J. Cairns, Luisa Benussi, Giuliano Binetti, Roberta Ghidoni, Gianluigi Forloni, Diego Albani, Daniela Galimberti, Chiara Fenoglio, Maria Serpente, Elio Scarpini, Jordi Clarimón, Alberto Lleó, Rafael Blesa, Maria Landqvist Waldö, Karin Nilsson, Christer Nilsson, Ian R. A. Mackenzie, Ging-Yuek R. Hsiung, David M. A. Mann, Jordan Grafman, Christopher M. Morris, Johannes Attems, Timothy D. Griffiths, Ian G. McKeith, Alan J. Thomas, Pietro Pietrini, Edward D. Huey, Eric M. Wassermann, Atik Baborie, Evelyn Jaros, Michael C. Tierney, Pau Pastor, Cristina Razquin, Sara Ortega-Cubero, Elena Alonso, Robert Perneczky, Janine Diehl-Schmid, Panagiotis Alexopoulos, Alexander Kurz, Innocenzo Rainero, Elisa Rubino, Lorenzo Pinessi, Ekaterina Rogaeva, Peter St George-Hyslop, Giacomina Rossi, Fabrizio Tagliavini, Giorgio Giaccone, James B. Rowe, Johannes C. M. Schlachetzki, James Uphill, John Collinge, Simon Mead, Adrian Danek, Vivianna M. Van Deerlin, Murray Grossman, John Q. Trojanowski, Julie van der Zee, Marc Cruts, Christine Van Broeckhoven, Stefano F. Cappa, Isabelle Leber, Didier Hannequin, Véronique Golfier, Martine Vercelletto, Alexis Brice, Benedetta Nacmias, Sandro Sorbi, Silvia Bagnoli, Irene Piaceri, Jørgen E. Nielsen, Lena E. Hjermind, Matthias Riemenschneider, Manuel Mayhaus, Bernd Ibach, Gilles Gasparoni, Sabrina Pichler, Wei Gu, Martin N. Rossor, Nick C. Fox, Jason D. Warren, Maria Grazia Spillantini, Huw R. Morris, Patrizia Rizzu, Peter Heutink, Julie S. Snowden, Sara Rollinson, Anna Richardson, Alexander Gerhard, Amalia C. Bruni, Raffaele Maletta, Francesca Frangipane, Chiara Cupidi, Livia Bernardi, Maria Anfossi, Maura Gallo, Maria Elena Conidi, Nicoletta Smirne, Rosa Rademakers, Matt Baker, Dennis W. Dickson, Neill R. Graff-Radford, Ronald C. Petersen, David Knopman, Keith A. Josephs, Bradley F. Boeve, Joseph E. Parisi, William W. Seeley, Bruce L. Miller, Anna M. Karydas, Howard Rosen, John C. van Swieten, Elise G. P. Dopper, Harro Seelaar, Yolande A. L. Pijnenburg, Philip Scheltens, Giancarlo Logroscino, Rosa Capozzo, Valeria Novelli, Annibale A. Puca, Massimo Franceschi, Alfredo Postiglione, Graziella Milan, Paolo Sorrentino, Mark Kristiansen, Huei-Hsin Chiang, Caroline Graff, Florence Pasquier, Adeline Rollin, Vincent Deramecourt, Thibaud Lebouvier, Dimitrios Kapogiannis, Luigi Ferrucci, Stuart Pickering-Brown, Andrew B. Singleton, John Hardy, and Parastoo Momeni
Supplementary information
is available for this paper at 10.1038/s41598-020-68848-9.
References
- 1.Al-Chalabi A, Hardiman O. The epidemiology of ALS: a conspiracy of genes, environment and time. Nat. Rev. Neurol. 2013;9:617–628. doi: 10.1038/nrneurol.2013.203. [DOI] [PubMed] [Google Scholar]
- 2.Armon C. Smoking is a cause of amyotrophic lateral sclerosis. High low-density lipoprotein cholesterol levels? Unsure. Ann. Neurol. 2019;85:465–469. doi: 10.1002/ana.25468. [DOI] [PubMed] [Google Scholar]
- 3.Bandres-Ciga S, et al. Shared polygenic risk and causal inferences in amyotrophic lateral sclerosis. Ann. Neurol. 2019;85:470–481. doi: 10.1002/ana.25431. [DOI] [PMC free article] [PubMed] [Google Scholar]
- 4.Zhan Y, Fang F. Smoking and amyotrophic lateral sclerosis: a mendelian randomization study. Ann. Neurol. 2019;85:482–484. doi: 10.1002/ana.25443. [DOI] [PubMed] [Google Scholar]
- 5.Arthur KC, et al. Projected increase in amyotrophic lateral sclerosis from 2015 to 2040. Nat. Commun. 2016;7:12408. doi: 10.1038/ncomms12408. [DOI] [PMC free article] [PubMed] [Google Scholar]
- 6.Kong CM, Lee XW, Wang X. Telomere shortening in human diseases. FEBS J. 2013;280:3180–3193. doi: 10.1111/febs.12326. [DOI] [PubMed] [Google Scholar]
- 7.Shay JW, Wright WE. Telomeres and telomerase: three decades of progress. Nat. Rev. Genet. 2019;20:299–309. doi: 10.1038/s41576-019-0099-1. [DOI] [PubMed] [Google Scholar]
- 8.Zhu H, Belcher M, van der Harst P. Healthy aging and disease: role for telomere biology? Clin. Sci. (Lond.) 2011;120:427–440. doi: 10.1042/CS20100385. [DOI] [PMC free article] [PubMed] [Google Scholar]
- 9.Haycock PC, et al. Association between telomere length and risk of cancer and non-neoplastic diseases a Mendelian randomization study. Jama Oncol. 2017;3:636–651. doi: 10.1001/jamaoncol.2016.5945. [DOI] [PMC free article] [PubMed] [Google Scholar]
- 10.Zhang C, et al. Genetic determinants of telomere length and risk of common cancers: a Mendelian randomization study. Hum. Mol. Genet. 2015;24:5356–5366. doi: 10.1093/hmg/ddv252. [DOI] [PMC free article] [PubMed] [Google Scholar]
- 11.Zhan Y, et al. Exploring the causal pathway from telomere length to coronary heart disease: a network Mendelian randomization study. Circ. Res. 2017;121:214–219. doi: 10.1161/CIRCRESAHA.116.310517. [DOI] [PubMed] [Google Scholar]
- 12.Martin-Ruiz C, et al. Senescence and inflammatory markers for predicting clinical progression in Parkinson's disease: the ICICLE-PD study. J. Parkinsons Dis. 2020;10:193–206. doi: 10.3233/JPD-191724. [DOI] [PMC free article] [PubMed] [Google Scholar]
- 13.De Felice B, et al. Telomerase expression in amyotrophic lateral sclerosis (ALS) patients. J. Hum. Genet. 2014;59:555–561. doi: 10.1038/jhg.2014.72. [DOI] [PubMed] [Google Scholar]
- 14.Al Khleifat A, et al. Telomere length is greater in ALS than in controls: a whole genome sequencing study. Amyotroph. Lateral. Scler. Frontotemporal. Degener, 2019;20:1–6. doi: 10.1080/21678421.2019.1586951. [DOI] [PMC free article] [PubMed] [Google Scholar]
- 15.Linkus B, et al. Telomere shortening leads to earlier age of onset in ALS mice. Aging (Albany N. Y.) 2016;8:382–393. doi: 10.18632/aging.100904. [DOI] [PMC free article] [PubMed] [Google Scholar]
- 16.Fall T, et al. The role of adiposity in cardiometabolic traits: a Mendelian randomization analysis. PLoS Med. 2013;10:e1001474. doi: 10.1371/journal.pmed.1001474. [DOI] [PMC free article] [PubMed] [Google Scholar]
- 17.Sleiman PM, Grant SF. Mendelian randomization in the era of genomewide association studies. Clin. Chem. 2010;56:723–728. doi: 10.1373/clinchem.2009.141564. [DOI] [PubMed] [Google Scholar]
- 18.Paternoster L, Tilling K, Davey Smith G. Genetic epidemiology and Mendelian randomization for informing disease therapeutics: conceptual and methodological challenges. PLoS Genet. 2017;13:e1006944. doi: 10.1371/journal.pgen.1006944. [DOI] [PMC free article] [PubMed] [Google Scholar]
- 19.Haycock PC, et al. Best (but oft-forgotten) practices: the design, analysis, and interpretation of Mendelian randomization studies. Am. J. Clin. Nutr. 2016;103:965–978. doi: 10.3945/ajcn.115.118216. [DOI] [PMC free article] [PubMed] [Google Scholar]
- 20.Nicolas A, et al. Genome-wide analyses identify KIF5A as a novel ALS gene. Neuron. 2018;97:1268–1283. doi: 10.1016/j.neuron.2018.02.027. [DOI] [PMC free article] [PubMed] [Google Scholar]
- 21.Codd V, et al. Identification of seven loci affecting mean telomere length and their association with disease. Nat. Genet. 2013;45:422–427. doi: 10.1038/ng.2528. [DOI] [PMC free article] [PubMed] [Google Scholar]
- 22.Dorajoo R, et al. Loci for human leukocyte telomere length in the Singaporean Chinese population and trans-ethnic genetic studies. Nat. Commun. 2019;10:2491. doi: 10.1038/s41467-019-10443-2. [DOI] [PMC free article] [PubMed] [Google Scholar]
- 23.Visscher PM, et al. 10 Years of GWAS discovery: biology, function, and translation. Am. J. Hum. Genet. 2017;101:5–22. doi: 10.1016/j.ajhg.2017.06.005. [DOI] [PMC free article] [PubMed] [Google Scholar]
- 24.Welter D, et al. The NHGRI GWAS Catalog, a curated resource of SNP-trait associations. Nucleic Acids Res. 2014;42:D1001–1006. doi: 10.1093/nar/gkt1229. [DOI] [PMC free article] [PubMed] [Google Scholar]
- 25.Zeng P, Wang T, Zheng J, Zhou X. Causal association of type 2 diabetes with amyotrophic lateral sclerosis: new evidence from Mendelian randomization using GWAS summary statistics. BMC Med. 2019;17:225. doi: 10.1186/s12916-019-1448-9. [DOI] [PMC free article] [PubMed] [Google Scholar]
- 26.Yu, X. et al. Relationship between birth weight and chronic kidney disease: evidence from systematics review and two-sample Mendelian randomization analysis. Hum. Mol. Genet. ddaa074 (2020). [DOI] [PubMed]
- 27.Yu x, et al. Alcohol drinking and amyotrophic lateral sclerosis: an instrumental variable causal inference. Ann. Neurol. 2020;88:195–198. doi: 10.1002/ana.25721. [DOI] [PubMed] [Google Scholar]
- 28.Zeng P, Zhou X. Causal association between birth weight and adult diseases: evidence from a Mendelian randomization analysis. Front. Genet. 2019;10:618. doi: 10.3389/fgene.2019.00618. [DOI] [PMC free article] [PubMed] [Google Scholar]
- 29.Zhao JV, Schooling CM. Effect of linoleic acid on ischemic heart disease and its risk factors: a Mendelian randomization study. BMC Med. 2019;17:61. doi: 10.1186/s12916-019-1293-x. [DOI] [PMC free article] [PubMed] [Google Scholar]
- 30.Tyrrell J, et al. Height, body mass index, and socioeconomic status: mendelian randomisation study in UK Biobank. Br. Med. J. 2016;352:i582–i582. doi: 10.1136/bmj.i582. [DOI] [PMC free article] [PubMed] [Google Scholar]
- 31.Larsson SC, Burgess S, Michaëlsson K. Association of genetic variants related to serum calcium levels with coronary artery disease and myocardial infarction. JAMA. 2017;318:371–380. doi: 10.1001/jama.2017.8981. [DOI] [PMC free article] [PubMed] [Google Scholar]
- 32.Ahmad OS, et al. A Mendelian randomization study of the effect of type-2 diabetes on coronary heart disease. Nat. Commun. 2015;6:1–11. doi: 10.1038/ncomms8060. [DOI] [PMC free article] [PubMed] [Google Scholar]
- 33.Diekstra FP, et al. C9orf72 and UNC13A are shared risk loci for amyotrophic lateral sclerosis and frontotemporal dementia: a genome-wide meta-analysis. Ann. Neurol. 2014;76:120–133. doi: 10.1002/ana.24198. [DOI] [PMC free article] [PubMed] [Google Scholar]
- 34.Lattante S, Ciura S, Rouleau GA, Kabashi E. Defining the genetic connection linking amyotrophic lateral sclerosis (ALS) with frontotemporal dementia (FTD) Trends Genet. 2015;31:263–273. doi: 10.1016/j.tig.2015.03.005. [DOI] [PubMed] [Google Scholar]
- 35.Karch CM, et al. Selective genetic overlap between amyotrophic lateral sclerosis and diseases of the frontotemporal dementia spectrum. JAMA Neurol. 2018;75:860–875. doi: 10.1001/jamaneurol.2018.0372. [DOI] [PMC free article] [PubMed] [Google Scholar]
- 36.Ferrari R, et al. Frontotemporal dementia and its subtypes: a genome-wide association study. Lancet Neurol. 2014;13:686–699. doi: 10.1016/S1474-4422(14)70065-1. [DOI] [PMC free article] [PubMed] [Google Scholar]
- 37.Benyamin B, et al. Cross-ethnic meta-analysis identifies association of the GPX3-TNIP1 locus with amyotrophic lateral sclerosis. Nat. Commun. 2017;8:611. doi: 10.1038/s41467-017-00471-1. [DOI] [PMC free article] [PubMed] [Google Scholar]
- 38.Bowden J, et al. Assessing the suitability of summary data for two-sample Mendelian randomization analyses using MR-Egger regression: the role of the I-2 statistic. Int. J. Epidemiol. 2016;45:1961–1974. doi: 10.1093/ije/dyw220. [DOI] [PMC free article] [PubMed] [Google Scholar]
- 39.Burgess S, Small DS, Thompson SG. A review of instrumental variable estimators for Mendelian randomization. Stat. Methods Med. Res. 2017;26:2333–2355. doi: 10.1177/0962280215597579. [DOI] [PMC free article] [PubMed] [Google Scholar]
- 40.Hartwig FP, Davey Smith G, Bowden J. Robust inference in summary data Mendelian randomization via the zero modal pleiotropy assumption. Int. J. Epidemiol. 2017;46:1985–1998. doi: 10.1093/ije/dyx102. [DOI] [PMC free article] [PubMed] [Google Scholar]
- 41.Yavorska OO, Burgess S. Mendelian randomization: an R package for performing Mendelian randomization analyses using summarized data. Int. J. Epidemiol. 2017;46:1734–1739. doi: 10.1093/ije/dyx034. [DOI] [PMC free article] [PubMed] [Google Scholar]
- 42.Bowden J, Smith GD, Haycock PC, Burgess S. Consistent estimation in Mendelian randomization with some invalid instruments using a weighted median estimator. Genet. Epidemiol. 2016;40:304–314. doi: 10.1002/gepi.21965. [DOI] [PMC free article] [PubMed] [Google Scholar]
- 43.Burgess S, Butterworth A, Thompson SG. Mendelian randomization analysis with multiple genetic variants using summarized data. Genet. Epidemiol. 2013;37:658–665. doi: 10.1002/gepi.21758. [DOI] [PMC free article] [PubMed] [Google Scholar]
- 44.Noyce AJ, et al. Estimating the causal influence of body mass index on risk of Parkinson disease: a Mendelian randomisation study. PLoS Med. 2017;14:e1002314. doi: 10.1371/journal.pmed.1002314. [DOI] [PMC free article] [PubMed] [Google Scholar]
- 45.Verbanck M, Chen C-Y, Neale B, Do R. Detection of widespread horizontal pleiotropy in causal relationships inferred from Mendelian randomization between complex traits and diseases. Nat. Genet. 2018;50:693–698. doi: 10.1038/s41588-018-0099-7. [DOI] [PMC free article] [PubMed] [Google Scholar]
- 46.Burgess S, Thompson SG. Interpreting findings from Mendelian randomization using the MR-Egger method. Eur. J. Epidemiol. 2017;32:377–389. doi: 10.1007/s10654-017-0255-x. [DOI] [PMC free article] [PubMed] [Google Scholar]
- 47.Zhu Z, et al. Causal associations between risk factors and common diseases inferred from GWAS summary data. Nat. Commun. 2018;9:224. doi: 10.1038/s41467-017-02317-2. [DOI] [PMC free article] [PubMed] [Google Scholar]
- 48.Laimer M, et al. Telomere length increase after weight loss induced by bariatric surgery: results from a 10 year prospective study. Int. J. Obes. (Lond.) 2016;40:773–778. doi: 10.1038/ijo.2015.238. [DOI] [PubMed] [Google Scholar]
- 49.Rehkopf DH, et al. Leukocyte telomere length in relation to 17 biomarkers of cardiovascular disease risk: a cross-sectional study of US adults. PLoS Med. 2016;13:e1002188. doi: 10.1371/journal.pmed.1002188. [DOI] [PMC free article] [PubMed] [Google Scholar]
- 50.Revesz D, Milaneschi Y, Verhoeven JE, Penninx BWJH. Telomere length as a marker of cellular aging is associated with prevalence and progression of metabolic syndrome. J. Clin. Endocrinol. Metab. 2014;99:4607–4615. doi: 10.1210/jc.2014-1851. [DOI] [PubMed] [Google Scholar]
- 51.Al-Attas OS, et al. Adiposity and insulin resistance correlate with telomere length in middle-aged Arabs: the influence of circulating adiponectin. Eur. J. Endocrinol. 2010;163:601–607. doi: 10.1530/EJE-10-0241. [DOI] [PMC free article] [PubMed] [Google Scholar]
- 52.Weng Q, et al. Leukocyte telomere length, lipid parameters and gestational diabetes risk: a case-control study in a Chinese population. Sci. Rep. 2019;9:8483. doi: 10.1038/s41598-019-44968-9. [DOI] [PMC free article] [PubMed] [Google Scholar]
- 53.Zeng P, Zhou X. Causal effects of blood lipids on amyotrophic lateral sclerosis: a Mendelian randomization study. Hum. Mol. Genet. 2019;28:688–697. doi: 10.1093/hmg/ddy384. [DOI] [PMC free article] [PubMed] [Google Scholar]
- 54.Dupuis L, et al. Dyslipidemia is a protective factor in amyotrophic lateral sclerosis. Neurology. 2008;70:1004–1009. doi: 10.1212/01.wnl.0000285080.70324.27. [DOI] [PubMed] [Google Scholar]
- 55.MacKinnon DP, Fairchild AJ, Fritz MS. Mediation analysis. Annu. Rev. Psychol. 2007;58:593–614. doi: 10.1146/annurev.psych.58.110405.085542. [DOI] [PMC free article] [PubMed] [Google Scholar]
- 56.MacKinnon DP. Introduction to statistical mediation analysis. London: Routledge; 2008. [Google Scholar]
- 57.MacKinnon DP, Fairchild AJ. Current directions in mediation analysis. Curr. Dir. Psychol. Sci. 2009;18:16–20. doi: 10.1111/j.1467-8721.2009.01598.x. [DOI] [PMC free article] [PubMed] [Google Scholar]
- 58.Richiardi L, Bellocco R, Zugna D. Mediation analysis in epidemiology: methods, interpretation and bias. Int. J. Epidemiol. 2013;42:1511–1519. doi: 10.1093/ije/dyt127. [DOI] [PubMed] [Google Scholar]
- 59.VanderWeele TJ. Mediation analysis: a Practitioner's guide. Annu. Rev. Public Health. 2016;37:17–32. doi: 10.1146/annurev-publhealth-032315-021402. [DOI] [PubMed] [Google Scholar]
- 60.Burgess S, Daniel RM, Butterworth AS, Thompson SG, Consortium EP-I. Network Mendelian randomization: using genetic variants as instrumental variables to investigate mediation in causal pathways. Int. J. Epidemiol. 2015;44:484–495. doi: 10.1093/ije/dyu176. [DOI] [PMC free article] [PubMed] [Google Scholar]
- 61.Willer CJ, et al. Discovery and refinement of loci associated with lipid levels. Nat. Genet. 2013;45:1274–1283. doi: 10.1038/ng.2797. [DOI] [PMC free article] [PubMed] [Google Scholar]
- 62.Cragg JG, Donald SG. Testing identifiability and specification in instrumental variable models. Economet. Theor. 1993;9:222–240. [Google Scholar]
- 63.The 1000 Genomes Project Consortium A global reference for human genetic variation. Nature. 2015;526:68–74. doi: 10.1038/nature15393. [DOI] [PMC free article] [PubMed] [Google Scholar]
- 64.Brion M-JA, Shakhbazov K, Visscher PM. Calculating statistical power in Mendelian randomization studies. Int. J. Epidemiol. 2013;42:1497–1501. doi: 10.1093/ije/dyt179. [DOI] [PMC free article] [PubMed] [Google Scholar]
- 65.Chio A, et al. Global epidemiology of amyotrophic lateral sclerosis: a systematic review of the published literature. Neuroepidemiology. 2013;41:118–130. doi: 10.1159/000351153. [DOI] [PMC free article] [PubMed] [Google Scholar]
- 66.Liu MS, Cui LY, Fan DS, Assoc CA. Age at onset of amyotrophic lateral sclerosis in China. Acta Neurol. Scand. 2014;129:163–167. doi: 10.1111/ane.12157. [DOI] [PubMed] [Google Scholar]
- 67.Ogaki K, et al. Analysis of C9orf72 repeat expansion in 563 Japanese patients with amyotrophic lateral sclerosis. Neurobiol. Aging. 2012;33(2527):e2511–2526. doi: 10.1016/j.neurobiolaging.2012.05.011. [DOI] [PubMed] [Google Scholar]
- 68.Diez Roux AV, et al. Race/ethnicity and telomere length in the Multi-Ethnic Study of Atherosclerosis. Aging Cell. 2009;8:251–257. doi: 10.1111/j.1474-9726.2009.00470.x. [DOI] [PMC free article] [PubMed] [Google Scholar]
- 69.Davidson EM, et al. Consideration of ethnicity in guidelines and systematic reviews promoting lifestyle interventions: a thematic analysis. Eur. J. Public Health. 2014;24:508–513. doi: 10.1093/eurpub/ckt093. [DOI] [PubMed] [Google Scholar]
- 70.Sheehan NA, Didelez V, Burton PR, Tobin MD. Mendelian randomisation and causal inference in observational epidemiology. PLoS Med. 2008;5:e177. doi: 10.1371/journal.pmed.0050177. [DOI] [PMC free article] [PubMed] [Google Scholar]
- 71.Zou ZY, et al. Genetic epidemiology of amyotrophic lateral sclerosis: a systematic review and meta-analysis. J. Neurol. Neurosurg. Psychiatry. 2017;88:540–549. doi: 10.1136/jnnp-2016-315018. [DOI] [PubMed] [Google Scholar]
- 72.Renton AE, Chio A, Traynor BJ. State of play in amyotrophic lateral sclerosis genetics. Nat. Neurosci. 2014;17:17–23. doi: 10.1038/nn.3584. [DOI] [PMC free article] [PubMed] [Google Scholar]
- 73.Onesto E, et al. Gene-specific mitochondria dysfunctions in human TARDBP and C9ORF72 fibroblasts. Acta Neuropathol. Commun. 2016;4:47. doi: 10.1186/s40478-016-0316-5. [DOI] [PMC free article] [PubMed] [Google Scholar]
- 74.Forero DA, et al. Telomere length in Parkinson's disease: a meta-analysis. Exp. Gerontol. 2016;75:53–55. doi: 10.1016/j.exger.2016.01.002. [DOI] [PMC free article] [PubMed] [Google Scholar]
- 75.Wang H, et al. Telomere length and risk of Parkinson's disease. Mov. Disord. 2008;23:302–305. doi: 10.1002/mds.21867. [DOI] [PMC free article] [PubMed] [Google Scholar]
- 76.Eerola J, et al. No evidence for shorter leukocyte telomere length in Parkinson's disease patients. J. Gerontol. A Biol. Sci. Med. Sci. 2010;65:1181–1184. doi: 10.1093/gerona/glq125. [DOI] [PubMed] [Google Scholar]
- 77.Schurks M, et al. Telomere length and Parkinson's disease in men: a nested case-control study. Eur. J. Neurol. 2014;21:93–99. doi: 10.1111/ene.12252. [DOI] [PMC free article] [PubMed] [Google Scholar]
- 78.Guan JZ, et al. A percentage analysis of the telomere length in Parkinson's disease patients. J. Gerontol. A Biol. Sci. Med. Sci. 2008;63:467–473. doi: 10.1093/gerona/63.5.467. [DOI] [PubMed] [Google Scholar]
- 79.Gao K, et al. Exploring the causal pathway from telomere length to Alzheimer's disease: an update Mendelian randomization study. Front. Psychiatry. 2019;10:843. doi: 10.3389/fpsyt.2019.00843. [DOI] [PMC free article] [PubMed] [Google Scholar]
- 80.Guo YF, Yu HN. Leukocyte telomere length shortening and Alzheimer's disease etiology. J. Alzheimers Dis. 2019;69:881–885. doi: 10.3233/JAD-190134. [DOI] [PubMed] [Google Scholar]
- 81.Zhan Y, et al. Telomere length shortening and Alzheimer disease—a Mendelian randomization study. JAMA Neurol. 2015;72:1202–1203. doi: 10.1001/jamaneurol.2015.1513. [DOI] [PubMed] [Google Scholar]
- 82.Zhan Y, Hagg S. Telomere length shortening in Alzheimer's disease: procedures for a causal investigation using single nucleotide polymorphisms in a Mendelian randomization study. Methods Mol. Biol. 2018;1750:293–306. doi: 10.1007/978-1-4939-7704-8_20. [DOI] [PubMed] [Google Scholar]
- 83.Forero DA, et al. Meta-analysis of telomere length in Alzheimer's disease. J. Gerontol. A Biol. Sci. Med. Sci. 2016;71:1069–1073. doi: 10.1093/gerona/glw053. [DOI] [PMC free article] [PubMed] [Google Scholar]
- 84.Honig LS, Kang MS, Schupf N, Lee JH, Mayeux R. Association of shorter leukocyte telomere repeat length with dementia and mortality. Arch. Neurol. 2012;69:1332–1339. doi: 10.1001/archneurol.2012.1541. [DOI] [PMC free article] [PubMed] [Google Scholar]
- 85.Martin-Ruiz C, et al. Telomere length predicts poststroke mortality, dementia, and cognitive decline. Ann. Neurol. 2006;60:174–180. doi: 10.1002/ana.20869. [DOI] [PubMed] [Google Scholar]
- 86.Shim H, et al. A multivariate genome-wide association analysis of 10 LDL subfractions, and their response to statin treatment, in 1868 Caucasians. PLoS ONE. 2015;10:e0120758. doi: 10.1371/journal.pone.0120758. [DOI] [PMC free article] [PubMed] [Google Scholar]
- 87.Burgess S, Thompson SG, Collaboration CCG. Avoiding bias from weak instruments in Mendelian randomization studies. Int. J. Epidemiol. 2011;40:755–764. doi: 10.1093/ije/dyr036. [DOI] [PubMed] [Google Scholar]
- 88.Burgess S, Thompson SG. Improving bias and coverage in instrumental variable analysis with weak instruments for continuous and binary outcomes. Stat. Med. 2012;31:1582–1600. doi: 10.1002/sim.4498. [DOI] [PubMed] [Google Scholar]
- 89.Kanai M, et al. Genetic analysis of quantitative traits in the Japanese population links cell types to complex human diseases. Nat. Genet. 2018;50:390–400. doi: 10.1038/s41588-018-0047-6. [DOI] [PubMed] [Google Scholar]
Associated Data
This section collects any data citations, data availability statements, or supplementary materials included in this article.