

Abstract
Linseed is one of the most important oil seed crop in the central highlands of Ethiopia for which yield enhancement is the major breeding purposes and genotypic variability is important for selection in any breeding programs. However, shortage of improved varieties’ that provides optimum seed yield is one of the major constraints of the crop. Therefore, this study was carried out to assess the genetic variability and association among quantitative traits of 36 linseed genotypes. The experiment was conducted in 2018 main cropping season by using simple lattice design. The analysis of variances reveled highly significant difference among the genotype for most of traits considered in present study. High phenotypic and genotypic coefficient of variation was recorded for tiller per plant, harvest index, oil yield (kg ha−1), and seed yield (ton ha-1) number of capsules per plant. High heritability along with genetic advance was observed for seed yield (tones ha-1), oil yield (kg ha-1) harvest index which indicates selection of these traits at early generation would be effective. Oil yield (kg ha−1) harvest index and number of capsules plant −1 showed highly significant positive with seed yield (ton ha−1). Cluster analysis revealed that 36 linseed genotypes were grouped into two clusters and four genotypes remain ungrouped. The maximum inter clusters distance was observed between clusters II and the local check. The data set was reduced into four significant principal components (PCs) that comprise (80%) of the variance. The first PC accounted for 34% of the variances that implies greater proportion of variable information explained by PC1. The traits, which contributed more to PC1, were seed yield per plant, primary branches per plant, secondary branches per plant and plant height showed positive association and had positive direct effect on seed yield. This indicates that any improvement of oil yield and harvest index would result in substantial increase on seed.
Keywords: Genotype, Genetic advance, Genetic variability, Heritability, Linseed
1. Introduction
Linseed (Linum usitatissimum L., 2n = 30) is an important oilseed and fiber crop which belongs to the family Linaceae and genus linum. It is believed that this crop species were originated from Linum angustifolium Huds native to the Mediterranean region (Burako, 2010). Linseed belongs to the family Linaceae of the order Malphigiales; group Fabidae, clade Rosids (Bremer et al., 2009). The genus encompasses more than hundred annual and perennial species. Cultivated flax pertains to the species having two types; one is grown for oil (linseed) and the other for fiber. It is one of the widely grown and economically important oil seed crop for industrial use. Almost all the species are annual herbs while some are shrubs. There are strong indications that Linum was originated in India, from where it spread north world and west world, to Ethiopia also (Wakjira et al., 2004).
Linseed is an important oilseed crop which is the only species in Linaceae family with economic values (Tadesse et al., 2010). It has nutrients and pharmaceutical uses and used for edible and lightening purposes and also in animal fat and poultry diets (Khan et al., 2013). Linseed contains 30–45% oil, making it an important industrial crop. Linseed contains oil 40%, carbohydrate 28%, protein 21%, water 7.4% and also different mineral 3.4% making it an important industrial crop. It has high unsaturated fatty acids, especially Linolenic acid (Khan et al., 2010). Proper understanding of association of different traits, provide more reliable selection criterion to achieve a high seed yield (Akbar et al., 2003a). Linseed oil is rich in omega-3 fatty acid, especially alpha-linoleic acid (C18:3) that was beneficial for reducing of heart disease, inflammatory, bowel disease, arthritis and variety of other health conditions. It also contains a group of chemicals called lignins that play a significant role in the prevention of cancer. The major linseed growing countries of the world are Canada, China, USA, Ethiopia and India. As study conducted by Tadeusz Zaj et al., 2005 Canada is the highest share in the production of linseed across the world (43.8%), followed by China (15.0%), USA (8.89%), India (7.95%) and Ethiopia (7.10%), whereas Europe accounts for (12.1%) of the production (Mulusew et al., 2013). Linseed is second largest both in area and total production. It accounts for 30% of the total oil seed production of the country in Ethiopia. According to the Central Statistical Authority (2018) the area coverage was 79044.51 ha−1 of land with production of 882096.51 tons and productivity of 1.11 tons ha−1. Ethiopia is considered to be the secondary center of diversity, and now the 5th major producer of linseed in the world after Canada, China, United States and India (Wakjira, 2007). The major Linseed growing areas in Ethiopia are located at altitudes ranging from 1800 to 2800 masl although it is uncommonly grown at altitude as low as 1680 masl or as high as 3430masl. It is an annual field crop that is largely grown in temperate climates (Mansby et al., 2000) and cool tropics including the highlands (>2500 masl) of Ethiopia. The crop performs best in altitudes ranging from 2200 to 2800 masl. It is the second most important oil crop in the highlands of Ethiopia in terms of area and production (Wakjira, 2004). Linseed requires cool temperatures during its growing period to produce good yields. The mean temperature can range from 10 to 30 °C although the crop grows best within 21 and 22 °C. Linseed is a major oilseed and rotation crop for barley in higher elevations of Arsi, Bale, Gojam, Gondar, Wello, Shewa and Wollega and high yields of wheat, barley and Tef followed by linseed (Getinet and Nigussie, 1997). It is an important rotational crop for cereals and pulses in Ethiopia.
Currently, the national productivity of linseed seed is 10 qt ha−1 and in West Shewa where this study was conducted, almost near to the national productivity (CSA, 2018). The Low productivity of the crop is due to biotic and abiotic stress such as; its high sensitivity to fungal diseases, seed bat insect, weed competition and its limited response to inputs (Negash et al., 2012). Therefore, there is an urgent need to increase the productivity to narrow the present yield gap and develop high yielding varieties. A character which has higher range of genetic variability, high heritability and high genetic advance would be an effective to improve economic yields (Aytac and Kinaci, 2009). Therefore, knowledge of the extent and pattern of variability, particularly of genetic variability present in a population of a given crop is essential for further improvement of the crop. Similarly, information on the extent and nature of interrelationship among characters help in formulating efficient scheme of multiple trait selection. Besides this, knowledge of the naturally occurring diversity in a population helps to identify diverse groups of genotypes that can be used for hybridization program. In Ethiopia, the information on these aspects in linseed is very limited. Therefore, there is a need to generate information on phenotypic and genotypic variances as well as heritability and interrelationships of yield and yield related traits among linseed genotypes. The present investigation was carried out to associations among seed yield and yield related traits in linseed.
2. Materials and methods
2.1. Description of the study area
The experiment was conducted during 2018 main cropping season at Holeta Agriculture Research Center which was located from 32.6 km west of Addis Ababa. The research center represents highland agro-ecology of central Oromia and favorable for highland oil crops. It lies at 905′0″N and 44o29′ 0″ E with an average altitude of 2390 m above sea level (masl) .The maximum temperature was ranged between 2 and 22 °C during the growing seasons (June–November), and the minimum temperature (6 °C) occurred during nights while total rainfall varied between 900 and 1000 mm per annum during the 2 growing years. The soil type of the experimental area was sandy soil (Fig. 1).
Fig. 1.

A. Linseed field preparation and cultivation B. Linseed plants bearing a number of flowers in the erect branches. C. Matured crop ready to harvest.
2.2. Experimental material
For this study, 36 linseed landraces collected from various regions of Ethiopia were introduced to Holeta Agricultural Research center (HARC) and evaluated against two standard checks (Bekoji-14 and local check) and the linseed accessions used in the study were obtained from Ethiopian Biodiversity Institute (EBI) (Table 1).
Table 1.
List of linseed accessions collected from different region of Ethiopia.
| Entry |
Acc. No | Genus | Species | Region | Latitude | Longitude | Altitude |
|---|---|---|---|---|---|---|---|
| Code | |||||||
| 1 | 10,101 | Linum | usitatissimum | Oromia | 07-12-00-N | 38-38-00-E | 1980 |
| 2 | 13,503 | Linum | usitatissimum | Amhara | 09-48-00-N | 39-12-00-E | 2650 |
| 3 | 13,504 | Linum | usitatissimum | SNNP | 07–16-00-N | 37-44-00-E | 2580 |
| 4 | 13,506 | Linum | usitatissimum | Amhara | 10-18-00-N | 39-34-00-E | 2930 |
| 5 | 13,507 | Linum | usitatissimum | Amhara | 10-18-00-N | 39-33-00-E | 2900 |
| 6 | 13,508 | Linum | usitatissimum | Amhara | 10-18-00-N | 39-33-00-E | 2900 |
| 7 | 13,509 | Linum | usitatissimum | Oromia | 08-54-00-N | 39-05-00-E | 2210 |
| 8 | 13,511 | Linum | usitatissimum | Oromia | 07-36-00-N | 39-28-00-E | 2800 |
| 9 | 13,512 | Linum | usitatissimum | Oromia | 08-07-00-N | 39-33-00-E | 2640 |
| 10 | 13,515 | Linum | usitatissimum | Oromia | 09-48-00-N | 37-58-00-E | 2490 |
| 11 | 13,517 | Linum | usitatissimum | Oromia | 08-44-00-N | 37-44-00-E | 2480 |
| 12 | 13,519 | Linum | usitatissimum | Oromia | 08-57-00-N | 37-32-00-E | 2420 |
| 13 | 13,537 | Linum | usitatissimum | Oromia | 07-10-00-N | 39-59-00-E | 2530 |
| 14 | 13,548 | Linum | usitatissimum | Oromia | 08-34-00-N | 39-33-00-E | 2700 |
| 15 | 13,568 | Linum | usitatissimum | Amara | 11--06-00-N | 37-53-00-E | 2460 |
| 16 | 13,578 | Linum | usitatissimum | Amhara | 11-03-00-N | 37-56-00-E | 2635 |
| 17 | 13,598 | Linum | usitatissimum | Oromia | 09-04-00-N | 38-52-00-E | 2600 |
| 18 | 13,620 | Linum | usitatissimum | Oromia | 07-40-00-N | 39-12-00-E | 2520 |
| 19 | 13,649 | Linum | usitatissimum | Oromia | 07-28-00-N | 39-15-00-E | 2900 |
| 20 | 13,653 | Linum | usitatissimum | Oromia | 07-46-00-N | 39-15-00-E | 2620 |
| 21 | 13,654 | Linum | usitatissimum | Oromia | 07-47-00-N | 39-18-00-E | 2900 |
| 22 | 13,682 | Linum | usitatissimum | Amhara | 12-32-00-N | 37-01-00-E | 2100 |
| 23 | 207,786 | Linum | usitatissimum | Oromia | 09-17-00-N | 38-04-00-E | 2740 |
| 24 | 207,789 | Linum | usitatissimum | Oromia | 09-31-00-N | 37-58-00-E | 2390 |
| 25 | 207,791 | Linum | usitatissimum | Oromia | 09-38-00-N | 37-47-00-E | 2460 |
| 26 | 208,360 | Linum | usitatissimum | Oromia | 08-46-00-N | 38-22-00-E | 1650 |
| 27 | 208,425 | Linum | usitatissimum | Oromia | 09-23-00-N | 37-55-00-E | 2950 |
| 28 | 208,664 | Linum | usitatissimum | Oromia | 09-18-00-N | 41-48-00-E | 2540 |
| 29 | 208,794 | Linum | usitatissimum | Oromia | 08-18-00-N | 39-20-00-E | 1830 |
| 30 | 212,512 | Linum | usitatissimum | Amara | 09-57-00-N | 38-54-00-E | 1580 |
| 31 | 212,517 | Linum | usitatissimum | Amhara | 10-15-00-N | 39-35-00-E | 3100 |
| 32 | 212,625 | Linum | usitatissimum | Amhara | 11-10-00-N | 39-15-00-E | 2690 |
| 35 | Bekoji 14 | Linum | usitatissimum | Oromia | |||
| 36 | Local check | Linum | usitatissimum | Oromia |
Source: Holeta Agricultural Research Center (2018). Oro = 24, Am = 9, SNNP = 1.
2.3. Experimental design and field lay-out
The experiment was arranged in 6x6 simple lattice designs. Each entry was planted in a plot having 6 rows of 3 m length. Four rows were harvested and two border rows were excluded to avoid the border row effects. The area for each experimental plot was 3 m × 1.2 m = 3.6 m2 and the total experimental area was 17.9 × 25.5 = 456.45 m2. The fertilizer was applied for the crop at the rate of 23/23 kg N / P2O5 kg per ha−1 at the time of planting and seed rate was 25 kg ha −1. All other agronomic managements were applied uniformly in all experimental plots accord to the recommendation of crop. Agronomic, yield and yield related data were collected from four central rows of 10 randomly selected plants. Seed yields were adjusted to moisture content 7%. Data were collected for each and every parameter on the bases of the data were collected under both field and laboratory conditions.
2.4. Data recorded on plant basis
-
•
Plant height (PH): – The average height (in cm) of ten randomly sampled plants. The plant height was measured from the ground to the highest part of plant at the harvesting time.
-
•
Tillers per plant (TPP): – The average number of tillers per plant was counted from ten randomly taken plants.
-
•
Primary branches per plant (PBPP): – The average number of branches on the main stem per plant was counted from ten randomly selected plants.
-
•
Secondary branches per plant (SBPP): – The average number of branches arising from primary branches per plant was counted from ten randomly obtained plants.
-
•
Number of capsules per plant (NCPP): The average number of capsules was counted from ten randomly taken plants.
-
•
Seed Yield per plant (SYPP): The weight of seeds of ten randomly taken plants were measured in grams after moisture was adjusted to 7% and then divided by ten. Adjusted yield is a yield that is determined after the moisture is driven off.
2.5. Data collection on plot basis
-
(1)
Total biomass yield per plot (kg): – The total dry matter weight in kilograms of the above ground plants excluding the oven dried seed.
-
(2)
Harvest index (%):– Seed yield divided by total biomass on plot or plant base and expressed in percentage.
-
(3)
Days to 50% flowering (DF): Days from sowing to the stages when 50% of plants was started flowering.
-
(4)
Days to 90% maturity (DM): – The number of days from date of sowing to stage at which 90% of the plants have reached to physiological maturity. It is the time when 90% of the capsules change their color into brown. The growing time of linseed was calculated as the period from sowing until seed maturity, the day when upper part of plants with their seed capsules had turned into brown colour and seeds rattled in their capsules.
-
(5)
Thousand seed weight (TSW): – The weight (g) of thousand seeds weight from randomly sampled seeds per plot was measured by using sensitive balance.
-
(6)
Seed yield per plot (SYPP): Seed yield per plot was measured in grams after moisture of the seed is adjusted to 7%. It was converted to seed yield (SYH) (kg ha-1) by extrapolating the area of 1.2 m2 to the hectare basis.
-
(7)
Oil content (OC): The proportion of oil in the seed to total oven dried seed weight was measured by nuclear magnetic resonance spectrometer.
-
(8)
Oil yield (OY): The amount of oil in kg ha−1 was obtained by multiplying seed yield by corresponding oil percentage obtained from oil analysis accord to descriptors (Falconer and Mackay., 1996).
-
(9)
OY = OC X SYH where OY = oil yield, OC = oil content, SYH = seed yield per hectare.
3. Statistical analysis
3.1. Analysis of variance
Analysis of variance (ANOVA) was computed for seed yield and other traits as per the methods described by Gomez and Gomez (1984) using SAS computer software (Version 9.3) for simple lattice design. Phenotypic and genotypic correlation and path analysis were carried out by using SAS Software. Major descriptive statistics such as mean range and standard deviation of quantitative traits of accessions were done by using of Microsoft excel. Hierarchal clustering of the average linkage method with Euclidian distance was conducted by MINITAB14 (MINITAB, 2003).
The model for lattice design is: Yil(j) = μ + ti + rj+(b|r)l(j) + eil(j)
Where: Yil(j) is the observation of the treatment i(i = 1---v = k2) in the block l(1 = 1-----k) of the replication j(j = 1---- m). Individual locations ANOVA were computed through following mathematical model. (Table 2).
Table 2.
Variation of source variables of simple lattice design.
| Source of variation | DF | SS | MS | F-value | pr > F |
|---|---|---|---|---|---|
| Replication | (r-1) | SSR | MSR | ||
| Genotype | |||||
| Unadjusted | (K2-1) | SSGU | MSGU | ||
| adjusted | (K2-1) | SSGA | MSGA | ||
| Block within rep(adj) | r(k-1) | SSBA | MSB | ||
| Error | |||||
| Intra block | (k-1) (rk-k-1) | SSE | MSE | ||
| Total | (rk2-1) | TSS |
Key: k = block, G = genotype MSR = mean square of replication MSRA = mean square of genotype adjusted, MSGU = mean square of genotype unadjusted, MSE = environmental variance (error mean square) = σ2e r = numbers of replication.
3.2. Estimation of variance components
Quantitative traits Variance (Phenotypic, genotypic and environmental variances) and respective coefficient of variance were calculated following formula suggested by (Burton and Devane, 1953) as follows:
Individual location
Environmental vaance σ2e = MSe
Where, σ2g = genotypic variance
σ2p = phenotypic variance
σ2e= environmental variance
MSg = Mean square due to genotype / accessions
MSe = Error mean square and
r = numbers of replications
The coefficient of variations at phenotypic, genotypic and environmental level was estimated by using the formula adoptoted by Johnson et al., (1955a)
where σp = Phenotypic standard deviation (σg + σe).
σg = Genotpic standard deviation
σe = Environmental standard deviation
µ = population mean for the characters x;
PCV, GCV, and ECV = phenotypic, Genotypic and environmental coefficient of variation respectively. The PCV and GCV are classified and followed by Siva Subramanian and Madhav Menon (1973), Low: <10%, moderate: 10–20% and high: >20%.
3.3. Estimate of heritability in broad sense
Heritability (h2) in broad sense for all characters were computed formula was adopted by (Allard, 1960)
Where, = genotypic variance
= phenotypic variance
= Error variance
The range of heritability has been classified and suggested by (Johnson and Wichern, 1998)
Low: <40%, medium: high 60–80%, Very high: > 80%.
3.4. Estimation of expected genetic advance
The genetic advance for selection intensity (k) at 5% was estimated by following formula (Allard, 1960, Johnson et al., 1955b).
where EGA represents the expected genetic advance under selection; σph is the phenotypic standard deviation; H2 is heritability in broad sense and k is selection differential (k = 2.06 at 5% selection intensity). The genetic advance as percent of population mean was estimated by following procedure of Johnson et al., (1955a). low < 10% moderate (10–20) and high > 20%.
3.5. Character association analysis
The correlation of traits and their significance were determined by using SAS software (SAS, 2001). Phenotypic and genotypic correlations between yield and yield related traits were estimated and method was described by Kassiani and Saleh (2010) from the corresponding variance and covariance components as follows:
where rpxy = phenotypic correlation coefficient between characters X and Y, rgxy = genotypic correlation coefficients between X and Y pcov x.y and gcovx. y is phenotypic and genotypic covariance between variables × and y, respectively σ2p = phenotypic variance between characters X and Y, σ2g = Genotypic variance between characters X and Y. The calculated phenotypic correlation value was tested for its significance using t-test t =
Where rp = phenotypic correlation; SE (rp) = standard error of phenotypic correlation obtained using in the formula procedure (Sharma, 1998)
Where n is the number of genotypes tested SE is the genotypic correlations at genotypic levels were tested for their significance by using the formula described by Robertson, (1959) as indicated below:
The calculated t = value was compared with the tabulated “t” value at (n-2) the degree of freedom at 5% and 1% level of significance where, n = numbers of genotypes.
where h2x = Heritability of traits ×, h2 y = Heritability of trait y.
3.6. Path- coefficient analyses
Path coefficient analysis was worked out and used the method by Dewey (1959) at phenotypic as well as genotypic level to determine the direct and indirect effect of yield related traits (yield components) on yield. For this purpose, seed yield is used as dependent variable and other characters were used as independent variables, it is common approach.
where rij = mutual association between the independent (i) and the dependent character (j) as measured by the correlation coefficient. Pij = component of direct effects of independent character (i) on dependent character (j) as measured by path coefficient and, Σrikpkj = summation of components of indirect effect of given independent character (i) on the given dependent character (j) via all other independent characters (k).
The contribution of remaining unknown factors (effects) will be measured as the residual effect (RE) which is calculated as:
3.7. Multivariate analysis
Cluster analysis is numerical classification technique that defines groups of clusters of individual. Hierarchal clustering of the average linkage method with Euclidian distance was performed using the MINITAB14 (MINITAB, 2003) software. Data for quantitative traits were standardized to mean of zero and variance of the one before clustering to avoid any partially that may have arisen due to different in measurement scales. The distances between clusters were calculated using the average method and Euclidian distances to estimate which genotype is closest or distant relative to others. Genetic distance between clusters was calculated using the generalized (Mahala Nobis, 1936)
where D2ij = the distance between any two groups i and j xi and xj the vector means of S.
3.8. Principal component analysis
Principle component analysis for 14 standardized quantitative traits was computed by using MINITAB14 Software to identify the most important traits contributing to the variation observed among the accessions. Suggested by Johnson and Wichern (1998), principal components with Eigen values greater than one considered.
PCA were computed using the following formula: Pcl = b|11(x1) + b|12--- b1p (xp) were Pcl = the subject’s the score of principal components 1 (the first component extracted) b1p = the regression coefficient (or weight) for observed variable p, as used in creating component 1and xp = the subject’s score on observed variable.
4. Results
4.1. Variability assessment
4.1.1. Analysis of variance
The analyses of variance of (ANOVA) results are presented in Table 3. Significant difference among accessions showed significant differences for most traits at (P ≤ 0.01) whereas; secondary branches per plant were recorded at (P ≤ 0.05).
Table 3.
Mean squares from analysis of variance for 14 traits of 36 linseed genotypes grown at Holeta Agricultural Research Center in 2018.
| Source of variation | DF | FD | DM | TSW | TBY | SY | OC | OY | SYPP | HI | PBP | SBP | NCB | TPP | PH |
|---|---|---|---|---|---|---|---|---|---|---|---|---|---|---|---|
| Replications | 1 | 46.72** | 78.13** | 0.17** | 0.54** | 0.06** | 8.03** | 23261.00* | 0.04 ns | 3.81 ns | 0.72 ns | 14.045** | 2.61 ns | 0.06 ns | 44.32 ns |
| Treatment | 35 | 97.58** | 226.51** | 1.79** | 2.00** | 0.15** | 3.65** | 18804.81** | 0.08** | 116.75** | 5.29** | 2.27* | 80.16** | 0.30** | 101.11** |
| Unadjusted | 35 | 120.39 | 279.41 | 1.84 | 2.41 | 0.19 | 3.98** | 25238.00** | 0.16** | 144.75** | 8.91** | 5.43** | 155.38** | 0.40** | 160.72** |
| Blocks within Rep. (Adj.) | 10 | 7.34 | 47.66 | 0.88 | 0.54 | 0.02 | 0.89* | 19928.00** | 0.07** | 9.19 | 7.94** | 8.89* | 52.93** | 0.15** | 60.68** |
| Intra Block Error | 35 | 5.16 | 31.11 | 0.49 | 0.44 | 0.02 | 0.34 | 4331.05 | 0.02 | 9.74 | 1.98 | 1.05 | 16.35 | 0.03 | 11.09 |
| RCB Error | 25 | 5.78 | 35.83 | 0.6 | 0.47 | 0.02 | 0.5 | 8787.26 | 0.04 | 9.58 | 3.68 | 3.29 | 26.8 | 0.07 | 25.26 |
| Total | 71 | 62.85 | 156.51 | 1.21 | 1.43 | 0.11 | 2.33 | 17,101 | 0.09 | 76.13 | 6.22 | 4.49 | 89.85 | 0.23 | 92.3 |
| R-square % | 97.11 | 93 | 85.71 | 89.12 | 92.55 | 94.85 | 91.08 | 91.33 | 95.5 | 88.98 | 91.79 | 93.59 | 95.37 | 95.77 | |
| ER to RCBD | 103.32 | 104.8 | 108.96 | 101.23 | 93.06 | 124.8 | 165.81 | 136.27 | 98.39 | 153.22 | 250.47 | 136.89 | 136.89 | 184.59 | |
| LSD (%5) | 4.68 | 11.49 | 1.44 | 1.37 | 0.31 | 1.2 | 135.54 | 0.31 | 6.43 | 2.9 | 2.11 | 8.33 | 0.36 | 6.86 | |
| CV (%) | 2.94 | 3.84 | 13.99 | 12.87 | 14.5 | 1.6 | 17.29 | 20.93 | 14.7 | 17.83 | 20.87 | 16.92 | 16.86 | 4.93 | |
| Mean | 77.14 | 145.21 | 5.00 | 5.16 | 1.03 | 37.36 | 380.59 | 0.71 | 21.22 | 7.89 | 4.91 | 23.9 | 1.04 | 69.53 |
4.2. Mean separation performance of genotypes for morphological characters
Estimates of mean separation for the 14 characters have been depicted below along with character and genotype wise mean value (Appendix Table A).
4.2.1. Phenology and growth parameters
Analysis of variance (ANOVA) showed presence of variation for phenology and growth parameters were varied for accessions to their corresponding traits Appendix Table A. The highest plant height, numbers of capsules per plant, days to flowering, days to maturity, primary branches per plant and secondary branches per plant were recorded on accessions numbers Bekoji-14, 207789, 208360, Acc.208360, 207789 and 13507. However, the lowest were recorded on accession number 13578, 13568, 13578, 13537, 13649 and 13548 respectively for same characters.
4.2.2. Seed yield and yield related parameters
The highest seed yield (tons/ha) was obtained from accession number Bekoji-14 while, the lowest was accession: 207789. The highest thousand seed weight, total biomass per plot, harvest index, seed yield per plant were recorded for Bekoji-14, local check and 13548. (Appendix Table A)
4.2.3. Quality parameters
The highest oil content (%) and oil yield per plot (kg ha−1) were observed in accessions 208425 and Bekoji-14. However, the lowest were shown in accession: 208360 and accession: 207789 had similar characters (Appendix Table A).
4.2.4. Mean performance of landraces for the different quantitative traits
Estimates of mean and range for the 14 characters have been depicted below along with traits and genotype wise mean value present in Table 4.
Table 4.
Estimates of range and mean values of different characters in linseed landraces.
| Traits | Mean ± SEM | Max | Min | Range |
|---|---|---|---|---|
| DF | 77.12(±)2.27 | 104.50 | 57.00 | 57–104.50 |
| DM | 145.21(±)5.58 | 175.00 | 117.50 | 117.5–175.00 |
| TSW | 5.00(±)0.70 | 8.60 | 3.20 | 3.2–8.60 |
| TBY | 5.17(±)0.66 | 7.50 | 2.50 | 2.5–75.50 |
| SY | 1.03(±)0.15 | 1.81 | 0.34 | 0.34–1.81 |
| OC | 37.36(±)0.15 | 40.05 | 33.15 | 33.15–40.05 |
| OY | 380.60(±)65.81 | 687.99 | 121.52 | 121.52–687.99 |
| SYPP | 0.71(±)0.15 | 1.36 | 0.28 | 0.275–1.355 |
| HI | 21.23(±)3.12 | 50.80 | 7.13 | 7.125–50.80 |
| PBP | 7.89(±)1.41 | 13.80 | 5.45 | 5.45–13.80 |
| SBP | 4.91(±)1.02 | 9.65 | 3.20 | 3.2–9.65 |
| NCB | 23.90(±)4.04 | 46.85 | 14.95 | 14.95–46.95 |
| TPP | 1.04(±)0.17 | 2.00 | 0.40 | 0.4–2.00 |
| PH | 67.54(±)3.33 | 88.00 | 47.50 | 47.5–88.00 |
Key: SE = Standard error, DF = Days to flowering, DM = Days to maturity, HI = Harvest index (%) , NCP = Number of capsules per plant, OC = Oil content (%), OY = Oil yield(kgha−1), PH = Plant height (cm),PBP = Primary branches per plant, SBP = Secondary branches per plant, SY = seed yield (ton ha−1), SYPP = Seed yield per plot, TBY = Total biomass yield (ton ha−1), TPP = Tillers per plant and TSW = Thousand seed weight(g).
The knowledge of magnitude of genetic and phenotypic variation in local landraces and the degree of association among characters is important to provide the basis for effective selection. Based on days to flowering and maturity, linseed germplasm collected from different parts of Ethiopia were placed in three groups. When germplasm accessions were grouped on the basis of numbers of days to flowering 22.22% were early (50–70 days), 36.11% were medium (71–78 days) and 46.67% were late flowering (79–104 days). The variation for the germplasm accessions with respect to maturity were very wide and the maximum days needed to reach physiological maturity was 175 days and the minimum days needed was 117.5 days. The range for the number of capsules per plant 14.95–46.95. This range was wide which indicated that the genotype showed variability for this trait. Thousand seed weight ranged from (3.20 g) to (8.60 g). For harvest index the range was from 7.125 to 50.80%. The range for percent oil content in seed was from 33.15 to 40.05%.
4.2.5. Estimation of variance components
The existing variability in the germplasm was estimated for the phenotypic coefficient of variation (PCV), genotypic coefficient variation (GCV), heritability and genetic advance of each character. The result of these parameters was presented in Table 5.
Table 5.
The Estimation of phenotypic coefficients of variation, genotypic coefficients of variation, heritability and genetic advance as a percentage means of the 14 traits studied at Holeta research center in 2018considered as highest number of tillers per plant (39.29%) followed harvest index by (37.47%), seed yield per plot, (31.33%).
| Traits | σ2g | σ2p | GCV (%) | PCV (%) | ECV (%) | H2 (%) | GA at 5% | GAM (%) |
|---|---|---|---|---|---|---|---|---|
| DF | 46.21 | 51.37 | 8.81 | 9.29 | 2.94 | 89.96 | 13.26 | 17.19 |
| DM | 97.70 | 128.81 | 6.81 | 7.82 | 3.84 | 75.85 | 17.70 | 12.19 |
| TSW | 0.65 | 1.14 | 16.13 | 21.36 | 13.99 | 57.06 | 1.25 | 25.05 |
| TBY | 0.78 | 1.22 | 17.12 | 21.41 | 12.87 | 63.89 | 1.45 | 28.13 |
| SY | 0.06 | 0.09 | 24.39 | 28.38 | 14.50 | 73.88 | 0.44 | 43.11 |
| OC | 1.65 | 1.99 | 3.44 | 3.78 | 1.56 | 82.97 | 2.41 | 6.45 |
| OY | 7236.88 | 11567.93 | 22.35 | 28.26 | 17.29 | 62.56 | 138.34 | 36.35 |
| SYPP | 0.03 | 0.05 | 23.32 | 31.33 | 20.93 | 55.39 | 0.25 | 35.68 |
| HI | 53.51 | 63.24 | 34.47 | 37.47 | 14.70 | 84.60 | 13.83 | 65.18 |
| PBP | 1.66 | 3.64 | 16.32 | 24.18 | 17.83 | 45.58 | 1.79 | 22.65 |
| SBP | 0.61 | 1.66 | 15.93 | 26.25 | 20.87 | 36.81 | 0.98 | 19.87 |
| NCB | 31.90 | 48.25 | 23.63 | 29.07 | 16.92 | 66.11 | 9.44 | 39.51 |
| TPP | 0.14 | 0.17 | 35.49 | 39.29 | 16.86 | 81.59 | 0.68 | 65.91 |
| PH | 45.01 | 56.10 | 9.93 | 11.09 | 4.93 | 80.23 | 12.35 | 18.29 |
Key: ECV (%) = environmental coefficient of variation, DF = days to flowering, DM = days to maturity, H2 (%) = broad sense heritability, GA%=genetic advance (%), GAM (%) = genetic advance as percent of mean, GCV (%) = genotypic coefficient of variation, σ2g = genotypic variance, HI = harvest index (%), NCP = number of capsules per plant, OC = oil content (%) OY = oil yield (kg ha-1), PBP = Primary branches per plant, PH (cm) = plant height in centimeter σ2p = phenotypic variance PCV (%) = phenotypic coefficient of variation, SBP = secondary branches per plant, SYPP = seed yield per plot SY = seed yield (tons ha-1), TPP = tillers per plant, TSW], = thousand seed weight and TBY = total biomass yield (tons)
4.2.6. Genotypic and phenotypic coefficient of variation
The phenotypic coefficients of variation (PCV) and genotypic coefficients of variation (GCV) were computed to assess the existing variability in linseed genotypes (Table 5). The genotypic coefficient of variation (GCV) ranged from (3.44%) to (35.49%) and phenotypic coefficient of variation (PCV) ranged from (3.78) to (39.29) %, in the lowest and the highest values were recorded for oil content and tiller per plant respectively, for both genetic parameters. PCV values were considered as highest number of tillers per plant (39.29%) followed harvest index by (37.47%), seed yield per plot, (31.33%) number of capsules per plant (29.07%), seed yield (28.38%) and oil yield (28.26%). The highest GCV (35.49%) was recorded for tiller per plant followed by harvest index (34.47%), seed yield per plot (23.32%), seed yield (24.39%), number capsules per plant (23.64%), oil yield (22.35%), secondary branch per plant (26.25%), primary branch per plant (24.81%), total biomass yield (21.41%) and thousand seed weight (21.36%) respectively. While low GCV values were recorded for plant height (9.93), days to maturity (8.81%), days to flowering (6.81) and oil content (3.44%).
4.2.7. Estimates of heritability in broad sense
Heritability values classified as very high (≥80%), moderate high (60–79%), moderate (40–59%), low (≤40%) according to (Singh, 2001). The estimated heritability for the studied traits was presented (Table 5). Most of the characters expressed high estimates of broad sense heritability. The heritability values were (36.81%) for secondary branches per plant and days to 50% flowering (89.96%). Very high heritability (≥80%) was computed for (89.96%) days to flowering and moderate high heritability (60–79%) was computed for seed yield (73.88%). The moderate heritability (40–59%) was computed for thousand seed weight (57.06%). The low heritability (36.81%) was computed for secondary branches per plant.
4.2.8. Estimate of expected genetic advance
The expected genetic advance as percent of mean was high for tillers per plant (65.91%), harvest index (65.18%), seed yields (43.11%), number of capsules per plant (39.51%), seed yield per plant (35.68%), oil yield (36.35%) total biomass yield (28.13%), thousand seed yield (25.05%) and primary branches per plant (22.65%). Low genetic advance as percent of mean was obtained for, oil content (6.45%). As Johnson et al., (1955b) suggested genetic advance as percent of mean can be categorized as low (0–10%), moderate (10–20%) and high (20% and above).
4.2.9. Character associations
Improvement for a target character can be achieved by indirect selection via other characters that are more heritable and easier to select. This selection strategy requires understanding the interrelationship of the characters among themselves and within the target character.
4.3. Phenotypic and genotypic correlation coefficient
4.3.1. Correlation of seed yield with other characters
Oil yield and number of capsules per plant both at phenotypic and genotypic levels had positive highly significant and significant correlation with seed yield. In addition, at genotypic level, harvest index and seed yield per plant showed positive highly significant and significant correlation with seed yield respectively while at phenotypic level, thousand seed weight and harvest index had positive and negative highly significant correlation with seed yield respectively (Table 6).
Table 6.
Genotypic (above diagonal) and phenotypic (bellow diagonal) correlation coefficients of yield and yield related traits of 36 linseed genotypes tested at Holeta Agricultural Research Center in 2018 cropping season.
| Traits | DF | DM | TSW | TBY | SY | OC | OY | SYPP | HI | PBP | SBP | NCP | TPP |
|---|---|---|---|---|---|---|---|---|---|---|---|---|---|
| DF | 0.59** | −0.17 | 0.05 | −0.14 | −0.30 | −0.19 | −0.10 | −0.08 | 0.35 | 0.30 | 0.21 | 0.35* | |
| DM | 0.54** | 0.18 | −0.13 | 0.05 | 0.09 | 0.09 | −0.01 | 0.22 | 0.16 | 0.19 | 0.21 | 0.12 | |
| TSW | −0.15 | 0.16 | −0.26 | 0.31 | 0.63** | 0.46** | 0.37* | 0.42* | −0.05 | 0.07 | 0.20 | −0.16 | |
| TBY | 0.05 | −0.07 | 0.25** | 0.17 | −0.27 | 0.08 | 0.19 | −0.05 | 0.35* | 0.33* | 0.30 | 0.21 | |
| GY | −0.15 | 0.05 | 0.32** | 0.14 | 0.11 | 0.94** | 0.39* | 0.64** | 0.20 | 0.18 | 0.29 | 0.01 | |
| OC | 0.31** | 0.12 | 0.57** | −0.21 | 0.15 | 0.30 | 0.02 | 0.26 | −0.10 | −0.06 | −0.02 | −0.04 | |
| OY | −0.18 | 0.12 | 0.40** | 0.08 | 0.82** | 0.32** | 0.44** | 0.66** | 0.15 | 0.16 | 0.30 | −0.02 | |
| SYPP | −0.10 | 0.02 | 0.28* | 0.19 | 0.34 | 0.04 | 0.42** | 0.18 | 0.54** | 0.71** | 0.80** | 0.21 | |
| HI | −0.10 | 0.19 | 0.37** | −0.54 | 0.63** | 0.24* | 0.59* | 0.15 | −0.03 | −0.03 | 0.07 | −0.10 | |
| PBP | 0.26* | 0.11 | −0.05 | 0.25* | 0.16 | −0.06 | 0.22 | 0.58** | 0.00 | 0.93** | 0.87** | 0.78** | |
| SBP | 0.19 | 0.16 | 0.04 | 0.26* | 0.16 | −0.01 | 0.29* | 0.71* | −0.01 | 0.87** | 0.93** | 0.61** | |
| NCP | 0.17 | 0.17 | 0.17 | 0.22 | 0.26* | −0.03 | 0.28* | 0.78* | 0.07 | 0.82** | 0.84** | 0.58** | |
| TPP | 0.30* | 0.09 | −0.15 | 0.18 | −0.01 | −0.04 | 0.00 | 0.24* | −0.10 | 0.74** | 0.59** | 0.56** | |
| PH | 0.42** | 0.38** | 0.42** | 0.00 | 0.34** | 0.24* | 0.45* | 0.49* | 0.33** | 0.44** | 0.52** | 0.57** | 0.31** |
Key: * significant P < 0.05 and **highly significant at P < 0.01, probability level respectively, DF = days to flowering, DM = days to maturity, HI = harvest index, NCP = number of capsules per plant, , OC = oil content (%), OY = oil yield (kg ha−1), PH = plant height (cm) PBP = primary branches per plant, SBP = secondary branches per plant, SY = seed yield, SYPP = seed yield per plot, TSW = thousand seed weight(g) TPP = tillers per plant, and TBY = total biomass yield (tons ha−1).
4.3.2. Estimates of correlation among other characters
At phenotypic and genotypic levels, primary branches per plant showed positive and highly significant correlation with secondary branches per plant, number of capsules per plant and tiller per plant. Thousand seed weight and days to maturity had positive and highly significant association with oil content and days to flowering (Table 6). At phenotypic levels, thousand seed weight showed positive and highly significant correlation with total biomass yields, oil content, oil yield, seed yield per plant and harvest index. The total biomass yields also had positive highly significant correlation with harvest index, but significant positive with primary branches per plant and secondary branches per plant (Table 6). Characters like primary branches per plant and secondary branches per plant were highly and positively correlated with number of capsules per plant, tillers per plant and plant height. Seed yield per plant exhibited positive and significant correlation with primary branches per plant, secondary branches per plant, number of capsules per plant, tillers per plant and plant height. Days to flowering showed positive and highly significant association with days to maturity and oil content while significant with primary branches per plant, tillers per plant and plant height. Genotypic association of thousand seed weight with oil content and oil yield showed positive highly significant but had positive significant with seed yield per plant and harvest index. Secondary branches per plant and number of capsules per plant showed positive and significant association with seed yield per plant and primary branches per plant at genotypic level.
4.4. Path coefficient analysis
Path analysis measures direct and indirect contribution of individual attribute towards seed yield (Rajanna et al., 2014). Path coefficient analysis specifies the causes and measures of their relative importance (Shivanna et al., 2007). Such an analysis helps to breeders to identify the characters that could be used as selection criteria in linseed breeding programmers.
4.4.1. Phenotypic path coefficient analysis of seed yield with other traits
Phenotypic path coefficient analysis showed that oil yield (0.72), harvest index (0.26) and number of capsules per plants (0.16) have highest positive direct effect on seed yield. However, plant height (−0.12) followed by seed yield per plants (−0.06) and thousand seed weight had negative phenotypic direct effect on seed yield (Table 7).
Table 7.
Phenotypic path coefficient analysis showing direct bold and diagonal and indirect effects off diagonals for yield and yield related traits in linseed genotypes.
| Traits | TSW | OY | SYPP | HI | NCPP | PH | Pr |
|---|---|---|---|---|---|---|---|
| TSW | −0.02 | 0.28 | −0.02 | 0.09 | 0.03 | −0.05 | 0.33** |
| OY | −0.01 | 0.72 | −0.03 | 0.15 | 0.04 | −0.05 | 0.82** |
| SYPP | 0 | 0.3 | −0.06 | 0.04 | 0.12 | −0.06 | 0.34** |
| HI | −0.01 | 0.41 | −0.01 | 0.26 | 0.01 | −0.04 | 0.63** |
| NCPP | 0 | 0.2 | −0.05 | 0.02 | 0.16 | −0.07 | 0.26* |
| PH | −0.01 | 0.32 | −0.03 | 0.08 | 0.09 | −0.12 | 0.34** |
Key: Residual effects = 0.25*= significant at P < 0.05 ** = highly significant at P < 0.01, HI = harvest index (%), OY = oil yield (kg ha-1), SYPP = seed yield per plant and TSW = thousand seed weight (g).
4.4.2. Genotypic path coefficient analysis of seed yield with other traits
The results of genotypic path coefficient analysis of seed yield with other traits are presented in Table 8. The Maximum positive genotypic direct effect on seed yield was exerted by oil yield kg per hectare (0.95) followed by harvest index (0.03). Traits with highly negative direct effects on seed yield were plant height (- 0.05) and seed yield per plant (-0.01). Oil yield had positive and highly significant (P < 0.01) genotypic correlation coefficient with seed yield (r = 0.95). Seed yield per plant and plant height had positive and highly significant (P < 0.05) genotypic correlation coefficient with seed yield (r = 0.39) had high direct effect on seed yield.
Table 8.
Genotypic path coefficient analysis showing direct bold and diagonal and indirect effects off diagonals for yield and yield related traits in linseed genotypes.
| Traits | OY | SYPP | HI | PH | gr |
|---|---|---|---|---|---|
| OY | 0.95 | 0.00 | 0.02 | −0.02 | 0.94** |
| SYPP | 0.41 | −0.00 | 0.01 | −0.02 | 0.39* |
| HI | 0.62 | 0.00 | 0.03 | −0.02 | 0.64** |
| PH | 0.42 | 0.00 | 0.01 | −0.05 | 0.394* |
Key: Residual effects = 0.33*= significant at P < 0.05 = **, highly significant at P < 0.01, HI = harvest index (%) OY = oil yield, PH = plant height (cm) and SYPP = seed yield per plant.
4.5. Multivariate analysis
Genetic diversity has important role in crop improvement particularly in selection of parents for hybridization. It has been long recognized by several workers that crossing between parents from genetically diversified group especially in quantitative characters would result in desirable segregates for subsequent selection.
4.5.1. Clustering pattern of genotypes
In the present study thirty-six genotypes were grouped into two cluster and four genotypes remain unclustered in (Fig. 2). Cluster I was the largest among all clusters consisting of 25 genotypes (69.4%), followed by III, 7 genotypes (19.4%) including the one check varieties Bekoji −14 in Table 9.
Fig. 2.
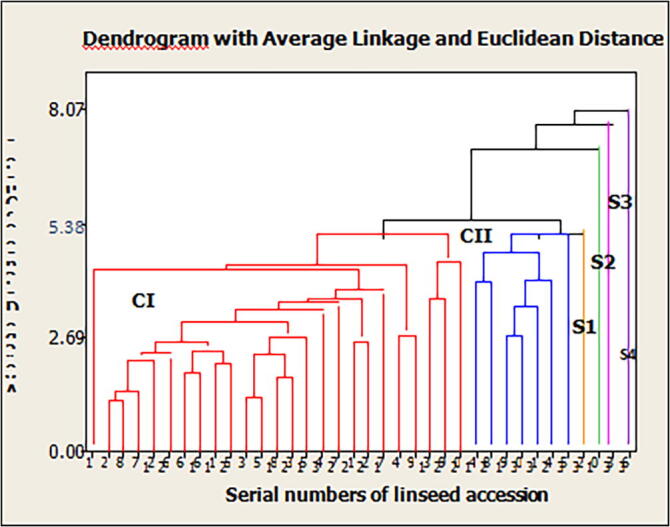
Relationship among 36 linseed genotypes revealed by clusters analysis based on 14 traits.
Table 9.
Distribution of genotypes into six clusters based on D2 analysis for 36 linseed genotypes evaluated at Holeta Agricultural Research Center in 2018.
| Cluster | N | Genotype | |||||
|---|---|---|---|---|---|---|---|
| 25 | Acc.10101 | Acc.13503 | Acc.13504 | Acc.13506 | Acc.13509 | Acc.13512 | |
| I | Acc.13517 | Acc.13548 | Acc.13568 | Acc.13578 | Acc.13511 | Acc.13507 | |
| Acc.13653 | Acc.207786 | Acc.207791 | Acc.212748 | Acc.208425 | Acc.13682 | ||
| Acc.208794 | Acc.13508 | Acc.13519 | Acc.13537 | Acc.13620 | Acc.13548 | ||
| Acc.208360 | |||||||
| S1 | 1 | Acc.13515 | |||||
| II | 7 | cc.212517 | Acc.212512 | Bekoji-14 | Acc.13649 | ||
| Acc.207789 | Acc.208664 | Acc.13649 | |||||
| S2 | 1 | Acc.212625 | |||||
| S3 | 1 | Acc.212747 | |||||
| S4 | 1 | Local Check | |||||
Key: N = numbers of observation within each cluster.
4.5.2. Inter and intra -cluster Euclidian distance and cluster mean for different quantitative characters
Maximum inter- cluster Euclidian distance were recorded between cluster S1 and S4 (11.52) followed by S3 and S4 (10.25) and between S1 and S3 (9.43). Whereas minimum inters cluster distance were recorded between cluster S1 and II (3.89) and between cluster II and S2 (4.25). The intra-cluster distance revealed wider variation within cluster I (4.67) followed by cluster II (3.76) (Table 10). However, no variation has been observed within cluster S1, S2, S3 and S4 (Table 11).
Table 10.
Intra cluster (Diagonal) and Inter (Above diagonal) cluster Euclidean distance for the 36-linseed accession evaluated at Holeta Agricultural Research Center in 2018 cropping season.
| Cluster | I | II | III | IV | V | VI |
|---|---|---|---|---|---|---|
| I | 4.67 | 6.40 | 3.89 | 5.44 | 7.65 | 7.81 |
| II | 0 | 7.71 | 7.07 | 9.43 | 11.52 | |
| III | 3.76 | 4.25 | 6.03 | 5.96 | ||
| IV | 0 | 5.28 | 9.12. | |||
| V | 0 | 10.25 | ||||
| VI | 0 |
Table 11.
Mean value of 14 characters for six clusters of 36 linseed genotypes evaluated at Holeta Agricultural Research Center in 2018.
| Trait | I | S1 | II | S2 | S3 | S4 |
|---|---|---|---|---|---|---|
| DF | 75.26* | 104.50** | 78.64 | 79.50 | 84.00 | 77.00 |
| DM | 142.56 | 175** | 148.93 | 153.00 | 133.00* | 160.00 |
| TSW | 5.03 | 3.2* | 4.87 | 4.26 | 4.2 | 8.6** |
| TBY | 4.88 | 5.00 | 5.98 | 7.5** | 4.79 | 4.59* |
| SY | 0.98 | 0.74 | 1.29 | 0.74 | 0.34* | 1.81** |
| OC | 37.67 | 33.15* | 37.32 | 34.65 | 36.1 | 38** |
| OY | 367.89 | 245.83 | 456.15 | 255.55 | 121.52* | 687.99** |
| SYPP | 0.60 | 0.28* | 1.01 | 0.95 | 1.06 | 1.36** |
| HI | 21.58 | 14.99 | 21.74 | 9.93 | 7.16* | 40.17** |
| PBPP | 6.93 | 6.70* | 10.31 | 8.5 | 13.8** | 9.50 |
| SBPP | 4.11 | 3.60* | 6.79 | 6.25 | 9.65** | 6.9 |
| NCBP | 19.56 | 17.05* | 33.84 | 30.50 | 46.85** | 40.2 |
| TPP | 0.91 | 0.40* | 1.34 | 2.00** | 1.85 | 0.95 |
| PH | 64.39 | 62.00* | 72.91 | 79.25 | 82.00 | 88.00** |
Key: * & ** represented lowest and highest mean value as, respectively DF = days to flowering, DM = days to maturity, HI = harvest index (%), NCPP = number of capsules per plant, OC = oil content (%), OY = oil yield (kg ha-1) , PH = plant height (cm) , PBP = primary branches per plant, (SBP) = secondary branches per plant, SY = seed yield (tons ha-1), SYPP = seed yield per plot, TPP = tillers per plant, TSW = thousand seed weight) and TBY = total biomass yield (tons ha-1)
4.5.3. Principal components analysis
The principal component analysis showed that the gross variability observed among the 36 test genotypes can be explained with four principal components with eigenvalues greater than unity (Table 12). The first four components together accounted for about 80% of the total variation among the genotypes with respect to all the 14 traits evaluated and showed the presence of considerable genetic diversity among the genotypes for most of the traits under consideration. Individually, PC1, PC2, PC3 and PC4 in that order accounted for about 34%, 23%, 13% and 9% of the gross variation among the 36 linseed genotypes evaluated for 14 traits. The traits, which contributed more to PC1, were seed yield per plant, primary branches per plant, secondary branches per plant and plant height. Whereas, for second principal components (PC2), thousand seed weight, seed yield and oil content for the third principal components (PC3), days to flowering, days to maturity and total biomass yield. While for the fourth principal components (PC4), thousand seed weight, seed yield, oil content and oil yield. The first two principal components PC1 and PC2 with values of 34% and 23%, respectively, contributed more than half to the total variation. Therefore, the present study confirmed that the linseed genotypes showed significant variations for the characters studied and it suggested that many opportunities for genetic improvement through selection. This result agrees with previous studies Singh et al. (2015) also reported that the character contributing maximum divergence should be given greater emphasis for deciding the type of cluster for further selection and the choice of pare for hybridization.
Table 12.
Eigenvectors, eigenvalues and percentage of total variance explained by the first six principal components (PC) for 14 characters in 36 linseed genotypes evaluated at Holeta Agriculture Research Center in 2018.
| Traits | PC1 | PC2 | PC3 | PC4 |
|---|---|---|---|---|
| DF | 0.14 | −0.24 | 0.53 | 0.27 |
| DM | 0.15 | 0.02 | 0.55 | 0.15 |
| TSW | 0.16 | 0.38 | 0.09 | −0.39 |
| TBY | 0.11 | −0.26 | −0.37 | 0.21 |
| SY | 0.24 | 0.32 | −0.22 | 0.45 |
| OC | 0.05 | 0.32 | 0.08 | −0.53 |
| OY | 0.25 | 0.38 | −0.19 | 0.31 |
| SYPP | 0.35 | 0.05 | −0.26 | −0.17 |
| HI | 0.14 | 0.42 | 0.14 | 0.24 |
| PBPP | 0.38 | −0.25 | −0.05 | −0.05 |
| SBPP | 0.40 | −0.21 | −0.06 | −0.14 |
| NCPB | 0.42 | −0.124 | −0.08 | −0.14 |
| TPP | 0.26 | −0.27 | 0.06 | −0.09 |
| PH | 0.34 | 0.119 | 0.29 | −0.00 |
| Eigenvalue | 4.82 | 3.23 | 1.87 | 1.28 |
| Total variance Explained (%) | 0.34 | 0.23 | 0.13 | 0.09 |
| Cumulative totalvariance | 0.34 | 0.57 | 0.71 | 0.80 |
| Explained (%) |
Key: Only eigenvectors with values equal to or greater than ± 0.3 are bolded DF = days to flowering, DM = days to maturity, HI = harvest index (%), OC = oil content (%), OY = oil yield (kg ha-1), PH = plant height (cm), PC = principal component, PBP = primary branches per plant, SBP = secondary branches per plant, SYPP = seed yield per plot, SY = seed yield (tons ha-1), TPP = tillers per plant, NCP = number of capsules per plant, TSW(g) = thousand seed weight and TBY = total biomass yield (ton ha-1)
5. Discussion
Plant breeding deals with the management of genetic variability. Hence, the presence of genetic variability in the available genotypes of a crop is of huge value to design selection procedure and to identify superior genotypes. It is, therefore, necessary to classify and utilize this variability systematically for genetic improvement of biological population. Similarly, the assessment of magnitude and direction of association between different seed yield contributing characters, especially with seed yield, is also useful in selecting desired genotypes on the basis of their genotypic values. The analysis of variance of revealed that the tested genotypes were highly variable for implied that there almost all quantitative traits. This is an opportunity to continuous further breeding activities to improve traits of interest. Rajanna et al., 2014, Bindra and Paul, 2016 also found a wide range of genetic variability of economically relevant traits are in confirmation with the results of the present study. A wide range of variation was observed for most of the traits studied in Appendix Table A. The traits such as, days to flowering, days to maturity, thousand seed weight, total biomass yield, seed yield, oil content, oil yield, seed yield per plant, harvest index, primary branches per plant, secondary branches per plant, tillers per plant and plant height manifested very big range in mean performance. The range of variation observed for primary branches per plant and secondary branches per plant was also significant. This result agrees with previous studies (Tadesse et al., 2010). The highest yield was recorded for genotype Bekoji-14 whereas, accession; 207789 gave lowest yield. Generally, highest yield was obtained from the early maturity genotype (175.00) whereas yield for (117.50) the late maturity genotypes was generally low. The highest oil content (%) and oil yield per plot kg ha-1 was recorded for accessions 208425 and Bekoji-14. However, the accessions 208360 and 207789 were shown lowest. This result agrees with previous studies (Wijnands et al., 2009) also indicated the oil content ranging from 35% to 42%.
5.1. Genotypic and phenotypic coefficient of variation
Higher phenotypic and genotypic variance values for tiller per plant, harvest index, seed yield per plant and seed yield relatively intermediate phenotypic and genotypic values for days to flowering, days to maturity and oil content. The high genotypic coefficient of variation for number of capsules per plant was also observed by (Bhateria et al., 2011: Semahegn and Tesfaye, 2013; Vikas and Nandan, 2013) for number of capsules per plant which indicates environmental influence on the performance of these traits was less. While the low GCV value was recorded on, plant height, days of maturity, days to flowers and oil content. The high phenotypic variations were high genetic variability for different traits and less influence of environment. Therefore, selection on the basis of the phenotype alone can be effective for the improvement of these traits. The results are in accordance with findings of Kumar and Rao (2008). The results indicated that phenotypic variances (PV) are greater than genotypic variances (GV). It means that these traits under study were influenced by the environment, as earlier reported by (Manggoel et al., 2012, Khan et al., 2013). All the genetic variations are heritable and can be exploited in any breeding program. Similar findings were also reported by Akbar et al. (2003a). The PCV values were greater than the GCV values for all the traits studied indicating that the apparent variation is not only due to genotypes but, also due to the influence of environment. Therefore, caution has to be exercised in making selection for these characters on the basis of phenotype alone as environmental variation is unpredictable in nature. These investigations were supported by the previous researchers (Akbar et al., 2003a, Kumar et al., 2012, Manggoel et al., 2012, Kumar and Pau, 2016).
5.2. Estimates of heritability in broad sense
The heritability estimate showed broad range of variation (Table 5) among the 14 characters measured. Heritability values classified as very high (≥80%), moderate high (60–79%), moderate (40–59%), low (≤40%) according to (Singh, 2001). Very high heritability (≥80%), was given by, days to flowering and found to be most heritable trait followed by harvest index, oil content, tiller per plant, number of capsules per plant, plant height and days to maturity. This indicates that selection for these traits in genotype would be most effective for the expression of these traits in the succeeding. Therefore, a good improvement can be made if some of these traits are considered as selection criteria in future breeding program. This result agrees with previous studies for days to flowering (Wakjira et al., 2006), plant height and days to maturity (Tyagi et al., 2014). According to Singh (1999), if a heritability of a character is very high, selection for such character is fairly easy as the selected will be transmitted to its progeny. This is because there would be a close correspondence between genotype and phenotype due to a relative smaller contribution of environment to the phenotype. Moderate high heritability (60–79%) was observed on seed yield, days to maturity, number of capsules per plant, total biomass per plant and oil yield. Suggesting possibility of obtaining better yield providing progeny in the future breeding on genetic variability if some of these characters are considered as selection criteria. This result agrees with previous studies (Akbar et al. (2003b)). The ultimate goal of the plant breeder is to have higher genetic advance for the material selected, since it is an indicator for the genetic improvement made in a population under selection (Negash, 2006).
5.3. Estimate of expected genetic advance
According to Johnson et al., (1955b) suggested genetic advance as percent of mean can be categorized as low (0–10%), moderate (10–20%) and high (20% and above). The expected genetic advance as percent of mean was high for thousand seed yield, oil yield and harvest index, total biomass yield, seed yield, seed yield per plant, primary branches per plant, number of capsules per plant, tillers per plant. The estimate of genetic advance as percent of mean was moderate for days to flowering, days to maturity, secondary branches per plant, plant height. This result agrees with previous studies moderate genetic advance for, plant height Satapathi et al., 1987: Misra, 1999). Low genetic advance as percent of mean was obtained for, oil content. This finding is in agreement with the findings of Tadesse (2009) also reported low genetic advance for oil content. The result is more reliable and valuable when expected genetic advance and heritability of corresponding traits are considered together. Thus, high heritability coincided with high genetic advance as percent of mean for seed yield, oil yield, harvest index, indicating presence of additive gene effects for these traits. On the other side, high heritability with low genetic advance as percent of mean was observed for days to flowering and oil content showing the presence of non -additive gene. High heritability coupled with moderate genetic advance was recorded for days to 50% flowering and plant height. These finding are in agreement with the findings of (Vikas and Nandan, 2014) for days to flowering indicating that these characters seems to be more heritable and can be improved through indirect selection as evidenced by (Singh, 2001). The highest genetic advance as percent of mean coupled with the high heritability value implies selection for the trait considered would be effective in early generation due to the likely additive gene action.
5.4. Estimates of correlation among other characters
At phenotypic and genotypic levels, primary branches per plant showed positive and highly significant correlation with secondary branches per plant, number of capsules per plant and tiller per plant. Thousand seed weight and days to maturity had positive and highly significant association with oil content and days to flowerings in Table 6. At phenotypic levels, thousand seed weight showed positive highly significant correlation with total biomass yield, oil content, oil yield, seed yield per plant and harvest index. The total biomass yields also had positive highly significant correlation with harvest index, but significant positive with primary branches per plant and secondary branches per plant in Table 6. Characters like primary branches per plant and secondary branches per plant were highly and positively correlated with number of capsules per plant, tillers per plant and plant height. Seed yield per plant exhibited positive and significant correlation with primary branches per plant, secondary branches per plant, number of capsules per plant, tillers per plant and plant height. Days to flowering showed positive and highly significant association with days to maturity and oil content while significant with primary branches per plant, tillers per plant and plant height. This result suggests that selection of genotypes for high total biomass yield might increase with those traits. These results are in conformation with Tadeusz Zajet al., 2005, correlation study with 105 linseed germplasm showed that seed yield exhibited highly positive and significant correlation with number of capsules per plant, primary branches per plant, secondary branches per plant, tillers per plant and plant height. Genotypic association of thousand seed weight with oil content and oil yield showed positive highly significant but had positive significant with seed yield per plant and harvest index. Secondary branches per plant and number of capsules per plant showed positive and significant association with seed yield per plant and primary branches per plant at genotypic level. Plant height exhibited positive and highly significant genotypic correlation with days to flowering, days to maturity, thousand seed yield, oil yield seed yield per plant, primary branches per plant, secondary branches per plant and number of capsules per plant. Harvest index showed positive and highly significant association with oil yield. These results are in conformation with (Pal et al., 2000: Wakjira and Labuschagne, 2003) showed that seed yield exhibited highly positive significant correlation with number of capsules per plant and secondary branches per plant.
5.5. Phenotypic path coefficient analysis of seed yield with other traits
The path analysis at phenotypic level (Table 7) revealed that oil yield (kg ha−1), which had significant and positive correlation with seed yield. Oil yield (kg ha−1) had exhibited highest positive direct effect followed by harvest index which high significant and positive correlation and number of capsules per plant with significant and positive correlation. Such positive direct effect of numbers of capsule per plant towards seed yield (tons ha−1). Similar reported by (Akbar et al., 2003a: Rahimi et al., 2011: Danish Ibrar et al., 2016). The high magnitude association of oil yield (kg ha−1) with seed yield is the result of their direct effects on seed yield. Whereas, harvest index and number of capsules per plan exerted low direct effects towards seed yield. Path coefficient analysis revealed that importance of oil yield (kg ha−1) as major yield contributing character in linseed. The residual effect at phenotypic level showed about 25% of variation in seed yield to be attributed by 75% characters included in the study.
5.6. Genotypic path coefficient analysis of seed yield with other traits
The results of genotypic path coefficient analysis of seed yield with other traits are presented in (Table 8). Maximum positive genotypic direct effect on seed yield was exerted by oil yield kg per hectare followed by harvest index tone per hectares. Traits with highly negative direct effects on seed yield were plant height and seed yield per plant. Oil yield (kgha−1) had positive and highly significant (P ≤ 0.01) genotypic correlation coefficient with seed yield had the highest direct effect on seed yield and harvest index tone per hectare had positive significant correlation with seed yield. Seed yield per plant and plant height had positive and high significantly (P ≤ 0.05) genotypic correlation coefficient with seed yield had high direct effect on seed yield. These results are not in conformation with Vardhan and Rao, (2006) who observed highest positive direct effect of plant height followed by harvest index towards seed yield plant−1 in linseed. The residual effect at genotypic level showed that about 33% of the variation in seed yield has been considered by the 67% characters included in the study.
5.7. Clustering pattern of genotypes
The study was conducted using 36 genotypes and grouped into (6) cluster based on divergence analysis as indicated in Table 9. Clustering of genotypes was not associated with the geographical origin of the genotypes rather it reflects morphological similarity between them. Thus, geographic origin cannot be considered as sole criteria for the selection of desirable donors for breeding programmers. Clustering pattern was random and independent, cluster I was the largest among all clusters followed by cluster III cluster II, cluster IV, Cluster V and cluster VI. Grouping of genotypes into six clusters suggested the presence of relatively high amount of genetic diversity in the material under investigation. As Abdula et al. (2015) studied 103 accessions of linseed for genetic diversity based on seven quantitative traits and grouped them into 12 clusters and cluster I was the largest with 23 accessions.
5.8. Inter and intra -cluster Euclidian distance
The averages inter and intra cluster distances Euclidian values are given in (Table 10). Maximum inter cluster Euclidian distance were recorded between cluster II and VI followed by cluster V and VI and between cluster II and V. Whereas minimum inters cluster distance were recorded between cluster I and III and between cluster III and IV. However, no variation has been observed within cluster II, IV, V and VI because solitary. The maximum inters cluster distance indicated that genotype of II and VI are not so closely related whereas the minimum inters cluster distance indicate that the genotype is closely related. The genotype of cluster I and II showed inters cluster distance hence these genotypes are closely related. Similar finding was also observed by Nagaraja et al., 2010: Abdul Nizar and Mulani, 2015.
5.9. Inters-cluster distance is a good indication to select diverse parental lines
It is suggested that superior pure line from diverse cluster may be chosen for hybridization due to better performance of hybrids (Ghafoor et al., 2001). The intra-cluster distance revealed that wider variation within cluster I followed by cluster III. The lower intra -cluster distance was suggesting that, the accessions within each cluster were relatively homogenous and selection within that clusters may not be progressive.
5.10. Cluster mean for different quantitative characters
Mean values (Table 11) of 14 traits indicated that genotype in Cluster I were early to flowering and contain medium primary branches per plant, secondary branches per plant and seed yield (tons ha −1). Genotype in cluster II had ate days to flowering and days to maturity, lower thousand seed weight, lower oil content, lower seed yield per plant, less primary branches per plant, less secondary branches per plant, a smaller number of capsules per plant and shorter plant height. Cluster IV higher total biomass and higher tiller per plant. Genotype in cluster V were early in terms of days to maturity contain lower oil yield (kg ha−1) less in harvest index, more in primary branches per plant, more in secondary branches per plant, more in number of capsules per plant and lower seed yield (tons ha−1). Genotype in cluster VI higher in thousand seed weight gram per plot, higher in total biomass tons ha−1, higher in oil content percent, higher in oil yield (kg ha−1), higher in harvest index taller plant height and higher seed yielder (tons ha−1). Generally, cluster that contains early genotypes in terms days to maturity genotype gave relatively lower yield has more primary branches per plant and secondary branches per plant and greater number of capsules per plant but cluster with late days to maturity and days to flowering genotype gave lower oil content percent has less primary branch per plant and secondary branch per plant and less in number of capsules per plant and shorter plant height. This result agrees with previous studies by Tadesse et al., (2009) in spite of low productivity, Ethiopian landraces of linseed possess economically important traits such as large number of capsules per plant, high seed weight, resistance to most of the diseases and high number of tillers per plant. This might be due to moisture stress. However, genotype in this cluster were almost similar to that of other cluster for traits such as seed yield per plant, tillers per plant and thousand seed weight indicate less susceptibility of these traits to terminal moisture stress.
5.11. Principal components analysis
Principal component analysis is intended to derive a small number of linear combinations of a set of variables that retain many of the existing information in the original variables (Mohammad, 2016). The principal component analysis showed that the gross variability observed among the 36 test genotypes can be explained with four principal components with eigenvalues greater than unity (Table 12). The first four components together accounted for about 80% of the total variation among the genotypes with respect to all the 14 traits evaluated and showed the presence of considerable genetic diversity among the genotypes for most of the traits under consideration. Individually, PC1, PC2, PC3 and PC4 in that order accounted for about 34%, 23%, 13% and 9% of the gross variation among the 36 linseed genotypes evaluated for 14 traits. The traits, which contributed more to PC1, were seed yield per plant, primary branches per plant, secondary branches per plant and plant height. Whereas for second principal components thousand seed weight, seed yield / oil content. For the third principal components days to flowering, days to maturity and total biomass yield while for the fourth principal components thousand seed weight, seed yield, oil content and oil yield. The first two principal components PC1 and PC2 with values of 34% and 23% respectively, contributed more than half to the total variation. Therefore, the present study confirmed that the linseed genotypes showed significant variations for the characters studied and it suggested that many opportunities for genetic improvement through selection. This result agrees with previous studies Singh et al., (2015) also reported the character contributing maximum to the divergence should be given greater emphasis for deciding the type of cluster to be used for further selection and the choice of parents for hybridization.
6. Conclusion
From this study, it was concluded that, there are genetic variability among the study materials and strong correlation between most of the desirable characters with better performance that can be provided basic information for further breeding activities for genetic improvement and thus confident enough to expect genetic progress if further breeding activities are carried out. The analysis of variance showed the presence of highly significant differences among the tested genotypes for all characters considered, indicating the existence of variability among the tested genotypes for these characters. The seed yield was significantly and positively correlated with yield attributing characters. The weight of seed produced per capsule is more important determinant of yield than number of branches or capsules per plant. Among the genotypes Bekoji-14, accessions; 212748, 13568, 212512 and 212747 performed high in growth, and seed yield characters. Highest phenotypic coefficient of variation (PCV) was recorded for tillers per plant and the lowest PCV was observed for oil content. Generally, the magnitudes of phenotypic coefficient of variation (PCV) and genotypic coefficient of variation (GCV) were found to be high for harvest index, seed yield per plant, number of capsules per plant, oil yield, seed yield, and total biomass yield, primary branches per plant, secondary branches per plant and thousand seed weight. Heritability values were very high for days to flowering, harvest index, oil content, tillers per plant and plant height. Similarly, the heritability estimates of days to maturity, oil yield, number of capsules per plant and total biomass yield were also high. The genetic advance as percent of mean was high for tillers per plant, harvest index, number of capsules per plant, seed yield, total biomass yield, thousand seed yield, oil yield, seed yield per plant and primary branches per plant were as low genetic advance as percent of mean obtained from oil content. Considering heritability and genetic advance as percent of mean simultaneously, were high for tillers per plant, harvest index, seed yield, oil yield and total biomass yield indicating presence of additive gene effect for these traits. The high yielding genotype can be selected by focusing on harvest index, seed yield per plant, oil yield and numbers of capsules per plant. Because these traits were correlated positively and significant among themselves and with seed yield both at phenotypic and genotypic level. The genetic divergence of 36 genotypes using Mahala Nobis D2 statistics grouped them into two clusters and four genotypes remain ungrouped. The largest (I) and the smallest (II, IV, V, VI) clusters comprised about (69.4%) and (2.7%), respectively, of the total genotypes studied. The average inter-cluster distances were significantly different, suggesting the possibility of obtaining suitable genotypes from these distant clusters for hybridization program of these genotypes. Since, this study was conducted in one season, further assessment for more locations and seasons may be helpful for future breeding programs.
Acknowledgment
Authors would like to express their thanks to Holeta Agriculture Research Centre (HARC) for Providing all research facilities and laboratory services to carry out this research work.
Footnotes
Peer review under responsibility of King Saud University.
Appendix A.
Table A1.
Mean value of yield and yield related traits of 36 linseed genotypes tested at HRC in 2018 cropping season.
| ERY | Acc. No | DF | DM | TSW(g) | TBY(t/ha) | SY(t/ha) | OC (%) | OY (kg/ha) |
|---|---|---|---|---|---|---|---|---|
| 1 | Acc.10101 | 70.00 l–m | 138.00 i–h | 4.85 d–i | 3.96 ij | 0.86 i–l | 36.60 ij | 314.74 i–n |
| 2 | Acc.13503 | 77.00f–i | 148.50 d–h | 5.56f–j | 4.165 h–j | 0.86 i–l | 38.40b–e | 328.73 h–n |
| 3 | Acc.13504 | 77.50f–i | 149.50c–f | 4.25c–g | 4.79f–j | 0.91f–k | 37.23 e–i | 337.85 g–n |
| 4 | Acc.13506 | 79.50 d–g | 152.50b–e | 4.85c–i | 4.17 h–j | 0.85 i–l | 38.30b–f | 325.32 h–n |
| 5 | Acc.13507 | 78.50 e–h | 156.50b–e | 6.20 h–j | 6.67 a–c | 1.05 e–h | 39.19 a–c | 413.45 d–j |
| 6 | Acc.13508 | 83.00c–e | 156.50b–e | 5.08 e–h | 5.84b–f | 1.18 e–h | 39.40 ab | 469.8c–g |
| 7 | Acc.13509 | 67.50 m | 131.50 k | 5.00c–i | 5.00 e–j | 0.99 e–k | 37.23 e–i | 366.64f–m |
| 8 | Acc.13511 | 70.50 k–m | 133.00 k | 4.90c–i | 5.00 e–j | 1.07 e–i | 37.02 g–j | 395.97 d–l |
| 9 | Acc.13512 | 71.00 j–m | 136.00 i–k | 4.45c–h | 4.58 g–j | 0.95 e–k | 37.10 g–i | 351.62 g–n |
| 10 | Acc.13515 | 69.50 k–m | 148.00 d–h | 5.15 e–h | 4.17 h–j | 1.05 e–j | 38.10c–g | 401.20 d–l |
| 11 | Acc.13517 | 70.50 k–m | 135.00 jk | 4.80c–i | 4.37 g–h | 0.95 e–k | 37.05 g–i | 354.49 g–n |
| 12 | Acc.13537 | 86.00b | 117.50 l | 4.85 e–i | 6.25 a–e | 1.19 e–g | 36.62 ij | 436.4 d–i |
| 13 | Acc.13548 | 84.50 bc | 155.00b–e | 5.15 e–j | 4.79f–h | 0.75 j–l | 37.17f–i | 276.95 k–n |
| 14 | Acc.13548 | 82.50b–e | 158.50b–d | 5.200f–i | 2.50 k | 0.97 e–k | 37.90 d–h | 367.57f–m |
| 15 | Acc.13568 | 77.00 g–i | 137.50 i–k | 4.75c–h | 5.63c–g | 0.88 h–l | 38.50b–d | 336.28 g–n |
| 16 | Acc.13578 | 57.00n | 135.50 i–k | 5.45f–j | 5.21 d–i | 0.83 i–l | 38.39b–e | 319 i–n |
| 17 | Acc.13598 | 74.00 h–k | 134.50 k | 4.95c–i | 6.60 a–c | 1.57 ab | 36.62 ij | 574.96 a–c |
| 18 | Acc.13620 | 70.50 k–m | 134.50 k | 5.25f–i | 6.25 a–e | 1.25 de | 37.27 e–i | 466.4c–g |
| 19 | Acc.13649 | 71.50 j–m | 136.50 i–k | 4.95c–i | 5.84b–f | 0.89 g–k | 36.85 h–j | 324.80 h–n |
| 20 | Acc.13653 | 69.50 k–m | 136.00 i–k | 3.55b | 5.00 e–j | 1.02 e–k | 36.85 h–i | 374.91 e–m |
| 21 | Acc.13654 | 83.00b–e | 149.00c–g | 7.05 ij | 3.75 kj | 0.57 ml | 39.30 ab | 224.68 no |
| 22 | Acc.13682 | 79.00e–g | 149.50c–f | 4.95c–i | 7.08 ab | 0.71 kl | 37.95 d–h | 269.38 l–n |
| 23 | Acc.207786 | 80.50c–e | 146.50 e–i | 4.20b–e | 6.25 a–e | 1.07 e–i | 37.00 g–j | 363.47f–m |
| 24 | Acc.207789 | 84.00b–d | 133.00 k | 4.20b–d | 4.79f–j | 0.34 m | 36.10 i–k | 121.52o |
| 25 | Acc.207791 | 80.00c–g | 139.00f–k | 4.60c–h | 3.96 ij | 0.82 i–l | 36.90 h–j | 298.41 j–n |
| 26 | Acc.208360 | 104.50 a | 175.00 a | 3.20 a | 5.00 e–j | 0.74 kl | 33.15 m | 245.83 m–o |
| 27 | Acc.208425 | 81.00c–f | 163.50b | 5.95 g–j | 4.17 h–j | 0.92 g–k | 40.05 a | 397.91 d–l |
| 28 | Acc.208664 | 75.50 g–j | 136.00 i–k | 4.25b–f | 5.42 e–h | 0.86 h–l | 35.30 kl | 310.00 i–n |
| 29 | Acc.208794 | 81.00c–f | 156 .00b–e | 4.25c–h | 5.63 d–g | 1.23c–d | 36.55 ij | 459.78c–h |
| 30 | Acc.212512 | 83.00c–e | 158.00b–d | 4.75c–h | 6.45 a–d | 1.39b–d | 36.60 ij | 510.24b–e |
| 31 | Acc.212517 | 79.50 d–g | 158.00b–d | 6.05 g–j | 3.96 ij | 1.56 a–c | 39.40 ab | 607.99 ab |
| 32 | Acc.212625 | 73.00 i–l | 138.50f–k | 4.80c–h | 5.85b–f | 1.21 d–f | 39.30 ab | 474.21b–f |
| 33 | Acc.212747 | 69.00 ml | 136.00 i–k | 5.65f–j | 4.17 h–j | 1.43b–d | 37.15f–i | 526.94b–d |
| 34 | Acc.212748 | 80.50c–e | 146.00 e–k | 4.05 bc | 6.25 a–e | 1.65 ab | 35.85 jk | 410.33 d–k |
| 35 | Bekoji–14 | 77.00 g–i | 160.00 bc | 8.60 j | 4.58f–g | 1.81 a | 38.00c–h | 687.99 a |
| 36 | L/check | 79.50 d–g | 153.00b–e | 4.25c–h | 7.50 a | 0.74 kl | 34.65 l | 255.5 m–o |
| Minimum | 57 | 117.5 | 3.2 | 2.5 | 0.34 | 33.15 | 121.52 | |
| Maximum | 104.5 | 175 | 8.6 | 7.5 | 1.81 | 40.05 | 687.99 | |
| Mean | 77.14 | 145.21 | 5 | 5.16 | 1.03 | 37.36 | 380.59 | |
| SE (±) | 2.27 | 5.58 | 0.7 | 0.66 | 0.15 | 0.15 | 65.81 | |
| CV% | 2.9 | 3.8 | 14 | 12.9 | 14.5 | 1.6 | 17.3 | |
| LSD 5% | 4.68 | 11.49 | 1.44 | 1.37 | 0.31 | 1.2 | 0.54 |
| ERY | Acc.No | SYPP | HI | PBPP | SBPP | NCPP | TPP | PH |
|---|---|---|---|---|---|---|---|---|
| 1 | Acc.10101 | 0.53f–h | 21.87c–h | 6.00 g–j | 3.45 g–i | 16.30jk | 0.70 j–m | 60.50 m–q |
| 2 | Acc.13503 | 0.55f–h | 20.52c–i | 7.65 d–j | 4.45 d–i | 17.00h–k | 1.00f–j | 68.40 e–k |
| 3 | Acc.13504 | 0.47f–h | 19.04 d–i | 7.50 d–j | 3.80 g–i | 17.80h–k | 1.60b–d | 64.25 i–o |
| 4 | Acc.13506 | 0.69 e–g | 20.31c–i | 8.45c–i | 4.90c–i | 27.05c–g | 1.45c–e | 72.60c–g |
| 5 | Acc.13507 | 0.97b–d | 15.78 g–j | 11.90 ab | 7.80ab | 46.85 a | 1.85 ab | 82.00 ab |
| 6 | Acc.13508 | 0.86c–e | 20.47c–i | 9.85b–d | 6.75bc | 30.50c–e | 0.08 a–m | 79.25 bc |
| 7 | Acc.13509 | 0.57 e–h | 19.79 d–i | 6.00 g–j | 3.50 g–i | 18.50h–k | 1.25 d–g | 59.5n–q |
| 8 | Acc.13511 | 0.75 d–e | 21.87c–h | 7.60d–j | 3.95f–i | 22.90 e–k | 1.20 e–h | 59.25o–q |
| 9 | Acc.13512 | 0.58 e–h | 20.99 d–i | 6.40f–j | 3.40 g–i | 18.90 g–k | 1.10 e–i | 62.50 j–o |
| 10 | Acc.13515 | 0.53f–h | 25.23cd | 5.55 j | 3.70 g–i | 16.50 i–k | 0.50 lm | 60.00n–q |
| 11 | Acc.13517 | 1.31a | 21.77c–h | 7.10 d–j | 5.50c–g | 29.30c–f | 0.55 ml | 68.00f–l |
| 12 | Acc.13537 | 0.62 e–g | 19.04 d–i | 8.50c–i | 4.90c–h | 22.00f–k | 1.20 e–h | 82.25 ab |
| 13 | Acc.13548 | 0.43 gh | 15.79h–j | 6.50f–j | 3.50 g–h | 14.95 k | 1.20 e–h | 70.75 d–i |
| 14 | Acc.13548 | 0.65 e–g | 50.80 a | 8.85c–g | 5.45c–h | 23.60 e–h | 1.35c–e | 72.5c–g |
| 15 | Acc.13568 | 0.55f–h | 15.63h–j | 8.15c–i | 4.00f–i | 20.60 g–k | 1.25 d–g | 55.5 pq |
| 16 | Acc.13578 | 0.61 e–g | 15.87h–j | 5.45 j | 3.35hi | 15.75 jk | 0.4 m | 47.5 r |
| 17 | Acc.13598 | 1.34 a | 23.54c–e | 8.95c–f | 6.45b-d | 33.10 bc | 1.2 e–h | 66.25 g–n |
| 18 | Acc.13620 | 0.78c–f | 19.95 d–i | 6.80 e–j | 3.60 g–i | 19.5 g–k | 0.8 i–l | 63.25 j–o |
| 19 | Acc.13649 | 0.48f–h | 15.57h–j | 6.15f–j | 3.20i | 16.15 l | 0.85h–l | 54.75 q |
| 20 | Acc.13653 | 0.63 e–g | 20.35d–i | 6.00 g–j | 3.35hi | 18.30h–k | 0.50ml | 59.25 pq |
| 21 | Acc.13654 | 0.67 d–g | 15.46h–j | 5.70 ij | 3.75hi | 15.85 jk | 0.60 k–m | 71.5 d–h |
| 22 | Acc.13682 | 0.53f–h | 10.22jk | 6.65 e–j | 4.50 e–i | 17.10h–k | 0.40 m | 62.00 k–o |
| 23 | Acc.207786 | 0.57 e–h | 17.13 e–h | 8.2c–j | 6.05b–e | 22.90 e–k | 0.95 g–i | 64.50 i–o |
| 24 | Acc.207789 | 1.06 a–c | 7.13 k | 13.80 a | 9.65 a | 45.30 a | 1.95 ab | 69.00e–j |
| 25 | Acc.207791 | 0.54f–h | 20.54 d–i | 7.05 d–j | 4.50 d–i | 18.00h–k | 1.05f–h | 64.00 i–o |
| 26 | Acc.208360 | 0.28h | 14.99 ij | 6.70 e–j | 3.60 g–i | 17.20h–k | 0.85h–l | 64.50i–o |
| 27 | Acc.208425 | 0.68 d–g | 22.11c–g | 5.85h–j | 4.20 e–i | 22.20f–k | 0.50 ml | 74.75c–f |
| ‘28 | Acc.208664 | 0.59 e–g | 16.19 g–j | 6.60f–j | 4.15 e–i | 19.50 g–k | 0.55 ml | 61.50l–q |
| 29 | Acc.208794 | 0.74 d–f | 22.40c–f | 11.00 a–c | 6.40b–d | 31.40cd | 1.70 ac | 64.00i–o |
| 30 | Acc.212512 | 1.25 ab | 21.61c–h | 13.50 a | 9.35 a | 44.35 a | 1.45 dc | 76.75b–d |
| 31 | Acc.212517 | 0.68 d–g | 39.79b | 6.20f–j | 3.70 g–i | 24.70 e–g | 0.50 ml | 86.75 a |
| 32 | Acc.212625 | 0.40 gh | 21.26c–i | 8.70c–h | 4.90 ‘ c–i | 18.30 e–h | 1.05f–h | 65.50h–o |
| 33 | Acc.212747 | 0.87 d–e | 34.30b | 6.85 e–j | 4.55 d–i | 21.40f–k | 0.50 ml | 68.25 e–l |
| 34 | Acc.212748 | 0.58 e–h | 26.65c | 9.85b–d | 5.25c–i | 25.30c–h | 1.30 d–g | 67.00h–m |
| 35 | Bekoji-14 | 1.36 a | 40.17b | 9.50c–e | 6.90 bc | 40.20 ab | 0.95h–i | 88 .00a |
| 36 | L/check | 0.95b–d | 9.93 jk | 8.50c–i | 6.25b–e | 30.90c–e | 1.10 e–i | 75.00c–e |
| Minimum | 0.28 | 7.13 | 5.45 | 3.2 | 14.95 | 0.4 | 47.5 | |
| Maximum | 1.36 | 50.8 | 13.8 | 9.65 | 46.85 | 2 | 88 | |
| Mean | 0.71 | 21.22 | 7.89 | 4.91 | 23.9 | 1.04 | 69.53 | |
| SE (±) | 0.15 | 3.12 | 1.41 | 1.02 | 4.04 | 0.17 | 3.33 | |
| CV% | 20.9 | 14.7 | 17.8 | 20.9 | 16.9 | 16.9 | 4.9 | |
| LSD (5%) | 20.93 | 14.7 | 17.83 | 20.87 | 16.92 | 16.86 | 4.93 |
Key: Acc. No = accession number, mean with the same letters are not significantly different: FD = days to flowering, DM = days to maturity, TBY = total biomass yield tone per hectares SY = seed yield tone per hectare. OC = oil content percentage, OY = oil yield kg per hectares, SE = Standard error, C.V(%) = Coefficient of variation, LSD = least significant differences at 5%.
Keys: Acc.No = accession number, mean with the same letters are not significantly different: (SYPP) = seed yield per plot, HI = harvest index tone per hectares, (PBP) = primary branches per plant, SBP = secondary branches per plant, TPP = tillers per plant, NCP = n umber of capsules per plant, TSW = thousand seed weight and. PH (cm) = plant height in centimeter. SE = Standard error, C.V(%) = Coefficient of variation, LSD = least significant differences at 5%.
Fig. A1.

A. Linseed field preparation and cultivation B. Linseed plants bearing a number of flowers in the erect branches. C. Matured crop ready to harvest.
References
- Abdul Nizar M., Mulani R.M. Research note genetic diversity in indigenous and exotic linseed germplasm (Linum usitatissimum L.) Electron. J. Plant Breed. 2015;6:848–854. [Google Scholar]
- Abdula E., Hassanien M., Ottai M., Al-Kordy M. Genetic diversity among five romanian linseed varieties under egyptian conditions. Middle East Journal of Applied Sciences. 2015;1:114–121. [Google Scholar]
- Akbar M., Mahmood T., Anwar M., Ali M., Shafiq M., Salim J. Linseed improvement through genetic variability correlation and path coefficient analysis. Introduct J Agric Biol. 2003;5(3):303–305. [Google Scholar]
- Allard, R.W., 1960. Principles of Plant Breeding. John Willey and Sons. Inc. New York, pp 485.among seed yield traits and oil content in Ethiopian linseed germplasm. Introduction Journal Sustainable Crop Production. 4(4), 8–16.
- Aytac Z., Kinaci G. Genetic variability and association studies of some quantitative characters in winter rapeseed (Brassica napus L.) Africa J Biotechnol. 2009;8:3547–3554. [Google Scholar]
- Bhateria S., Anju Pathania J., Sharma D., Bhandari J.C. Combining ability for seed yield and its components in linseed (Linum usitatissimum L.) J Oilseed Res. 2011;18:44–47. [Google Scholar]
- Bindra, S., nd Paul, S., 2016. Genetic variability and association studies in linseed (Linum usitatissimum L.). The Bioscan.11 (3):1855–1859.
- Bremer, B., Bremer, Kiche, M., 2009. An update of the Angiosperm Phylogeny Group classification for the orders and families of flowering plants, APGIII, Botanical Journal of the Linnaean Society. 161, 105–121.
- Burako, L., 2010. Genetic Diversity Study of Linseed Genotypes on Acidic Soil at Bedi Trial Site, Central Highland of Ethiopia, MSc. Thesis Addis Ababa University, Addis Ababa.
- Burton G., De Vane E. Estimating heritability in Tall Fescue (Festuca arundinacea), from replicated clonal material. Agron. J. 1953;45:478–481. [Google Scholar]
- Central Statistical Agency (CSA). 2018. The Federal Democratic Republic of Agricultural Sample Survey 2017/18 2010 E.C. Volume I Report on Area and Production of Major Crops, Addis Ababa. Characters in Linseed (Linum usitatissimum L.), Research Journal Agriculture Science.
- Danish Ibrar, Rafiq Ahmad, M., Yasin Mirza., Talat Mahmood., Mubashir Ahmad Khan., Muhammad Shahid Iqbal., 2016. Correlation and path analysis for yield and yield components in Linseed (Linum usitatissimum L.). Journal Agriculture Research. 54(2), 153-159.
- Dewey D.K. A correlation and path coefficient analysis of components of crested wheat grass seed production. Agron. J. 1959;51:551–558. [Google Scholar]
- Falconer, D. S., and Mackay, T. F. C., 1996. Introduction to quantitative genetics, 4thedition, Longman, Essex, UK.
- Getinet, A., and Nigussie, A., 1997. Highland oil crops: A three decade research experience in Ethiopia. Research report No. 30. Institute of Agriculture Research. Addis Ababa, Ethiopia
- Gomez K.A., Gomez A.A. 2nd ed. John Willey and Sons; Singapore: 1984. Statistical procedure for Agriculture Research. [Google Scholar]
- Ghafoor A.Z., Ahmad A.S., Zahid M.A.Z. Genetic diversity in Black gram. Field Crop Resour. 2001;69:183–190. [Google Scholar]
- Johnson H.W., Robinson H.F., Comstock R.E. Estimates of genetic and environmental variability in soybean. Agron. J. 1955;47:314–318. [Google Scholar]
- Johnson, R. A., Wichern, D. W., 1998. Applied multivariate statistical analysis. Prentice. Hall. Journal of Agriculture Science 43, 376–379.
- Johnson H.W., Robinson H.F., Comstock R.E. Genotypic and phenotypic correlations in Soybeans and their implications in selection. Agron. J. 1955;47:477–483. [Google Scholar]
- Kashiani P., Saleh G. Estimation of correlation on sweet corn inbred lines using SAS using model AM. J. Agric. Biol. Sci. 2010;5:309–314. [Google Scholar]
- Khan M.L., Sharif M., Sameera M., Ameen M. Chemical composition of different varieties of linseed. Pakistan Veterancy J. 2010;30:79–82. [Google Scholar]
- Khan M., Mirza M., Amjad M., Nawaz N., Nawaz M., Baig D. Assessment of genetic diversity in germplasm of linseed (Linum usitatissimum L.) Pak. J. Agri. Res. 2013;26:178–184. [Google Scholar]
- Kumar K., Rao S. Genetic variability and correlation studies for yield related trait in linseed (Linum usitatissimum L.) in North Western. Ethiopia Int. J. Plant Breed. Genet. 2008;8:66–73. [Google Scholar]
- Kumar S., Kerkhi A.S., Gangwar K.L., Chana P., Kumar M. Improvement in the genetic architecture through study of variability, heritability and genetic advance in linseed crop (Linum usitatissimum L.) Intl. J Res. in Engineering IT and Soc. Science. 2012;6:58–65. [Google Scholar]
- Kumar N., Pau S. Selection criteria of linseed genotypes for seed yield traits through correlation. Path Coefficient and Principal Component Analysis the Journal of Animal & Plant Sciences. 2016;26:1688–1695. [Google Scholar]
- Manggoel W., Uguru M.I., Ndam O.N., Disbar M.A. Genetic variability, correlation and path coefficient analysis of some yield components of ten cowpea (Vigna unguiculate L.) Wal Access J. Plant Breed. Crop Sci. 2012;4:80–86. [Google Scholar]
- Mansby E., Díaz O., Von Bothmer R. Preliminary study of genetic diversity in Swedish flax (Linum usitatissimum L) Genetic Resource Crop Evoy. 2000;47:417–424. [Google Scholar]
- MINITAB, 2003. MINITAB Statistical software, version 14.13.0.0. Minitab. Inc.
- Mohammad, E., 2016. Extent of Genetic Variability and Divergence in Linseed (Linum usitatissimum L.). Thesis Jawaharlal Nehru Krishi Vishwa Vidyalaya Jabalpur, Madhya Pradesh.
- Muhammad Akbar., Tariq Mahmood., M. Anwar., Muhammad Ali., Muhammad Shafiq., Jafar Salim., 2003. Linseed improvement through Genetic Variability, Correlation and Path Coefficient Analysis. International Journal of Agriculture & Biology. 05(3), 303–305.
- Mulusew, Fikere1., Firew, Mekbib., Adugna, Wakjira., 2013. Seed oil diversity of Ethiopian linseed (Linum usitatissimum L.) landraces accessions and some exotic cultivars. African Journal of Biochemistry Research. 7(6), 76–85.
- Nagaraja T.E., Ajit K.R., Golasangi B.S.C. Genetic diversity study in linseed (Linum usitatissimum L.) J. Maharashtra Agric. Univ. College Pune India J. Maharashtra Agri. Univ. 2010;22:249–251. [Google Scholar]
- Negash, K., 2006. Studies on Genetic Divergence in Common bean (Phaseolus Vulgaris L.), Msc thesis, Addis Ababa University Ethiopia.
- Negash W., Asfaw Z., Haile Selassie Y. Linseed (Linum usitatissimum L.), ethno botany and its cultivation status in Ethiopia. Introduct. J. Agric. Appl. Sci. 2012;4:48–57. [Google Scholar]
- Pal S.S., Gupta T.R., Singh I. Genetic determination of yield in linseed (Linum usitatissimum L.) Crop Improve. 2000;27:109–110. [Google Scholar]
- Rahimi M.M., Zarei M.A., Arminian A. Selection criteria of flax (Linum usitatissimum L.) for seed yield, yield components and biochemical compositions under various planting dates and nitrogen. African J. Agric. Res. 2011;6:3167–3175. [Google Scholar]
- Rajanna B., Biradar S., Ajithkumar K. Correlation and Path Coefficient Analysis in Linseed (Linum usitatissimum L.) Aninter National J. Quart. Life Sci. 2014;9:1625–1628. [Google Scholar]
- Robertson G.E. The sampling variance of the genetic correlation coefficient. Biometrics. 1959;15:469–485. [Google Scholar]
- SAS Institute, Inc., 2001. Statistical Analysis System, Version 9.3. Cary, North Carolina, USA.
- Satapathi D., Mishra P.C., Panda B.S. Variability, correlation and path coefficient analysis in linseed. J. Oilseeds Res. 1987;4(1):28–34. [Google Scholar]
- Semahegn Y., Tesfaye M. Genetic variation of different crosses of linseed genotypes for some agro-morphological traits. Asian J. Crop Sci. 2013;5:436–443. [Google Scholar]
- Sharma J.R., 1998. Statistical and biometrical in plant breeding, New Delhi, New Age International (p) limited publishers.
- Shivanna J., Ravi S., Sreeramu B. Character association and path coefficient analysis among economic traits in Makoi (Solanum nigrum L.) Karnataka J. Agric. Sci. 2007;20:575–577. [Google Scholar]
- Singh, P., 2001. Numerical problems in Plant Breeding and Genetics. New Delhi, India. Kalyani, Publishers.
- Singh A., Tewari N. Predictors of linseed improvement identified through correlation and path coefficient analysis. Curr. Adv. Agric. Sci. 2015;7:114–116. [Google Scholar]
- Singh, R.K., Chaudhary, B.D., 1999. Biometrical Method in Quantitative Genetics Society. 165, 64–83.
- Siva Subramanian V., Madhava Menon P. Path analysis for yield and yield components of rice. Madras Agric. J. 1973;60:1217–1221. [Google Scholar]
- Tadesse T., Singh H., Weyessa B. Correlation and path coefficient analysis among seed yield traits and oil content in Ethiopian linseed germplasm. Introd J. Sustain. Crop Product. 2009;4:8–16. [Google Scholar]
- Tadesse T., Parven A., Singh H., Weyessa B. Estimates of variability and heritability in linseed germplasm. Int. J. Sustain. Crop Product. 2010;5:8–16. [Google Scholar]
- Tadeusz Zaj, c., Stanisław Grzesiak., Bogdan Kulig., Milan, Polá ek., 2005. The estimation of productivity and yield of linseed (Linum usitatissimum L.) using the growth analysis. Acta Physiologiae Plantarum 27, 549–558.
- Tyagi A.K., Sharma M.K., Mishra S.K., Kerkhi S., Chand P. Estimates of genetic variability, heritability and genetic advance in linseed (Linum usitatissimum L.). germplasm. Progress Agric. 2014;14:7–48. [Google Scholar]
- Vardhan K., Rao S. Association analysis for seed yield and its components in Linseed (Linum usitatissimum L.) Mysore J. Agric. Sci. 2006;40:55–59. [Google Scholar]
- Pali Vikas, Mehta Nandan. Evaluation of oil content and fatty acid compositions of flax (Linum usitatissimum L.) varieties of India. J. Agric. Sci. 2014;6(9):65–69. [Google Scholar]
- Wakjira A., Maryke T., Arno H. Variability in oil content and fatty acid composition of Ethiopian and introduced cultivars of linseed. J. Sci. Food Agric. 2004;84:1–8. [Google Scholar]
- Wakjira, A., 2007. Linseed (Linum usitatissimum L.). In: Vegetable Oils and Fats Plant Resource of Tropical Africa (PROTA), Vandervossen, H.AM. And G.SM. Kamilo (Eds.). PROTA Foundation, Wageningen, Netherlands, 108–115.
- Wakjira A., Labuschagne M.T. Association of linseed characters and its variability in different environments. J. Agric. Sci. 2003;140:285–296. [Google Scholar]
- Wakjira A., Labuschagne M.T., Viljoen C.D. The use of morphological and AFLP markers in diversity analysis of linseed. Biodiversity Conserve. 2006;15:3193–3205. [Google Scholar]
- Wijnands J.H.M., Berserke J.R., VanLoo E.N. Oil seeds business opportunities in Pakistan. J. Bot. 2009;39:2407–2413. [Google Scholar]
Further reading
- Mahalanobis P.C. On the generalized distance in statistics. Pro. Nat. Inst. Science India, (B) 1936;2:49–55. [Google Scholar]
- Mishra A.K., Yadav L.N. Genetic parameters and association analysis in linseed. Ind. J. Agric. Res. 1999;33(2):113–118. [Google Scholar]