

Abstract
Polycystic ovary syndrome (PCOS) is characterized by androgen excess, ovulatory dysfunction and polycystic ovaries1, and is often accompanied by insulin resistance2. The mechanism of ovulatory dysfunction and insulin resistance in PCOS remains elusive, thus limiting the development of therapeutics. Improved metabolic health is associated with a relatively high microbiota gene content and increased microbial diversity3,4. This study aimed to investigate the impact of the gut microbiota and its metabolites on the regulation of PCOS-associated ovarian dysfunction and insulin resistance. Here, we report that Bacteroides vulgatus was markedly elevated in the gut microbiota of individuals with PCOS, accompanied by reduced glycodeoxycholic acid and tauroursodeoxycholic acid levels. Transplantation of fecal microbiota from women with PCOS or B. vulgatus-colonized recipient mice resulted in increased disruption of ovarian functions, insulin resistance, altered bile acid metabolism, reduced interleukin-22 secretion and infertility. Mechanistically, glycodeoxycholic acid induced intestinal group 3 innate lymphoid cell IL-22 secretion through GATA binding protein 3, and IL-22 in turn improved the PCOS phenotype. This finding is consistent with the reduced levels of IL-22 in individuals with PCOS. This study suggests that modifying the gut microbiota, altering bile acid metabolism and/or increasing IL-22 levels may be of value for the treatment of PCOS.
Recent studies showed that individuals with polycystic ovary syndrome (PCOS) have gut microbiota communities different from those of healthy controls5–7. However, due to small sample sizes or racial/ethnic differences among the studies investigating the microbiota in women with PCOS, the community structure and function of the gut microbiota in Chinese individuals with PCOS remains obscure. Importantly, the role and mechanism of the gut microbiota in the pathogenesis and complications of PCOS is largely unknown. To investigate changes in the gut microbiota community structure in individuals with PCOS, 43 healthy control donors and 50 individuals with PCOS were recruited. Body mass index-matched women with PCOS and control donors were enrolled to diminish the effect of obesity on the gut microbiota and bile acid profiles in individuals with PCOS. Age and waist-to-hip ratios were not different between the two groups. Individuals with PCOS had significantly higher hirsutism scores (Ferriman–Gallwey score), serum luteinizing hormone levels, luteinizing hormone/follicle-stimulating hormone (FSH) ratios, testosterone levels, androstenedione levels, free androgen index values, dehydroepiandrosterone (DHEA) sulfate levels, triglyceride levels and low-density lipoprotein cholesterol levels, as well as lower levels of serum FSH, sex hormone binding globulin (SHBG) and high-density lipoprotein cholesterol, compared with healthy controls. Fasting insulin levels and the insulin resistance index ‘homeostatic model assessment of insulin resistance’ (HOMA-IR) were significantly higher in women with PCOS (Supplementary Table 1).
Whole-genome shotgun sequencing showed no significant difference in bacterial alpha diversity between individuals with PCOS and healthy controls (Extended Data Fig. 1a). Notably, the beta diversity of PCOS microbiomes was significantly decreased compared with that of healthy controls, indicating a more homogeneous community structure among individuals with PCOS (Extended Data Fig. 1b). Partial least squares discriminant analysis (PLS-DA) showed that there was a distinct clustering pattern between samples from individuals with PCOS and healthy controls (Fig. 1a). The variable importance in projection (VIP) score for the gut microbiota showed that Bacteroides vulgatus contributed significantly to the group separation (Fig. 1b). Furthermore, the abundance of B. vulgatus was markedly increased in individuals with PCOS compared with healthy controls (Fig. 1c and Extended Data Fig. 1c,d).
Fig. 1 |. Profiling of the gut microbiota and bile acids in individuals with PCOS.
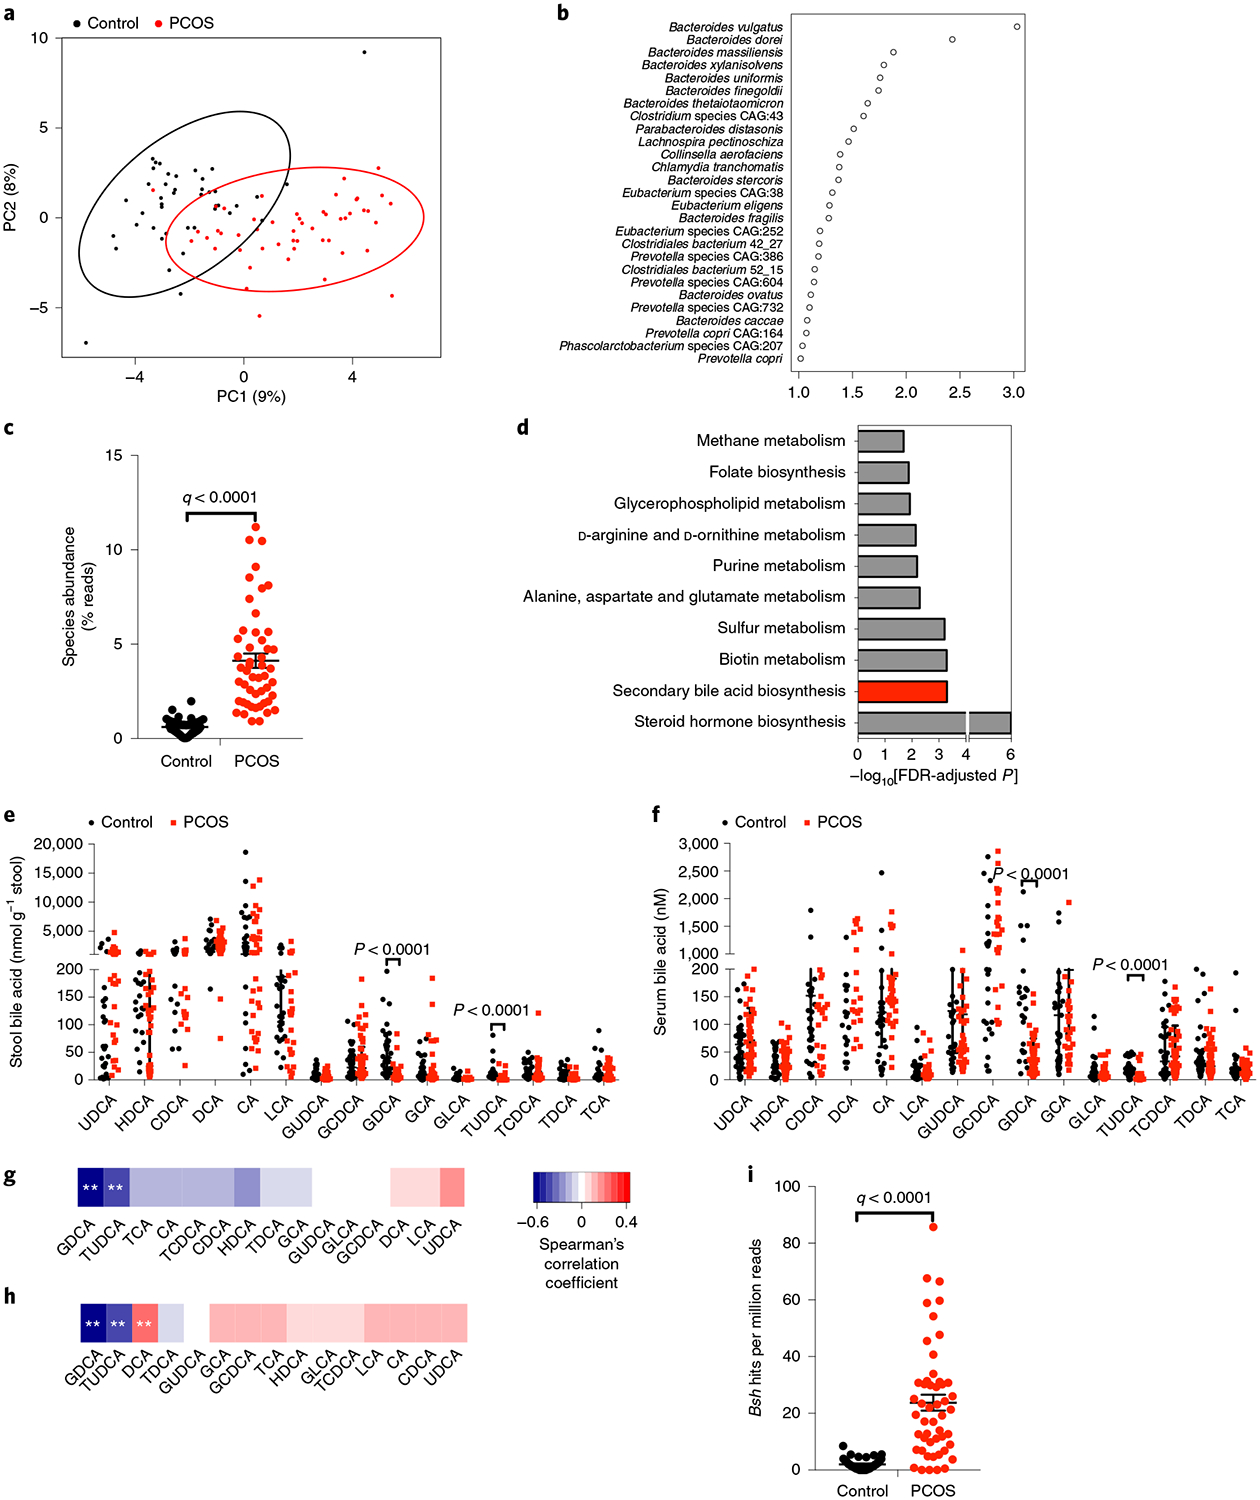
a, PLS-DA score plot of species abundance in samples from individuals with PCOS (red points) and healthy control samples (black points). Permutational multivariate analysis of variance with the Bray–Curtis distance metric was used to assess the significance of differences between the two groups (P = 0.0001). b, VIP scores of PLS-DA. VIP scores were used to rank the discriminating power of different taxa between the PCOS and control groups. A taxon with a VIP score of >1 was considered important in the discrimination. c, B. vulgatus species abundance in PCOS and control subjects (q value = 4.27 × 10⁻¹³; the P value was determined by two-tailed Wilcoxon rank-sum test and data are presented as means ± s.e.m.). d, Kyoto Encyclopedia of Genes and Genomes annotation of key altered metabolic pathways in individuals with PCOS. P values were determined by two-tailed Wilcoxon rank-sum test. e,f, Levels of stool bile acids (e) and serum bile acids (f) of cholic acid (CA), chenodeoxycholic acid (CDCA), deoxycholic acid (DCA), glycocholic acid (GCA), glycochenodeoxycholic acid (GCDCA), glycolithocholic acid (GLCA), glycoursodeoxycholic acid (GUDCA), hyodeoxycholic acid (HDCA), lithocholic acid (LCA), taurocholic acid (TCA), taurochenodeoxycholic acid (TCDCA), taurodeoxycholic acid (TDCA) and ursodeoxycholic acid (UDCA) were detected in individuals with PCOS and in controls. P values were determined by two-tailed Mann–Whitney U-test and data are presented as medians with interquartile ranges. In e, P = 1.07 × 10⁻¹⁰ for GDCA and P = 2.35 × 10⁻¹² for TUDCA. In f, P = 7.79 × 10⁻¹⁰ for GDCA and P = 2.06 × 10⁻⁷ for TUDCA. g,h, Correlations of B. vulgatus levels with the levels of stool bile acids (g) and serum bile acids (h), as determined by Spearman’s rank test (**q < 0.01 versus control). In g, q = 3.96 × 10⁻¹¹ for GDCA and q = 0.00015776 for TUDCA. In h, q = 1.79 × 10⁻¹¹ for GDCA, q = 3.65 × 10⁻⁵ for TUDCA and q = 0.00180804 for DCA. i, bsh gene composition of B. vulgatus in individuals with PCOS and healthy controls (q value = 7.27 × 10⁻⁹; the P value was determined by two-tailed Wilcoxon rank-sum test and data are presented as means ± s.e.m.; control: n = 43; PCOS: n = 50).
The gut microbiota participates in host metabolism by interacting with host signaling pathways8,9. Kyoto Encyclopedia of Genes and Genomes analysis indicated that bile acid metabolism was one of the key metabolic pathways affected by the gut microbiota changes found in individuals with PCOS (Fig. 1d). Qualitative and quantitative analysis of bile acid species indicated that glycodeoxycholic acid (GDCA) and tauroursodeoxycholic acid (TUDCA) were substantially reduced in the PCOS group compared with the control group in both the stool and serum (Fig. 1e,f). Correlation analyses of B. vulgatus and bile acid levels revealed that B. vulgatus was negatively correlated with GDCA and TUDCA (Fig. 1g,h). Interestingly, B. vulgatus deconjugates conjugated bile acids synthesized in the liver10. A significant increase in the abundance of bile salt hydrolase (bsh) genes, which encode bile salt hydrolases, was observed in the species B. vulgatus in individuals with PCOS compared with controls (Fig. 1i). These data indicate that B. vulgatus was most significantly upregulated in the gut microbiota of women with PCOS, which in turn influenced the metabolism of GDCA and TUDCA in these hosts.
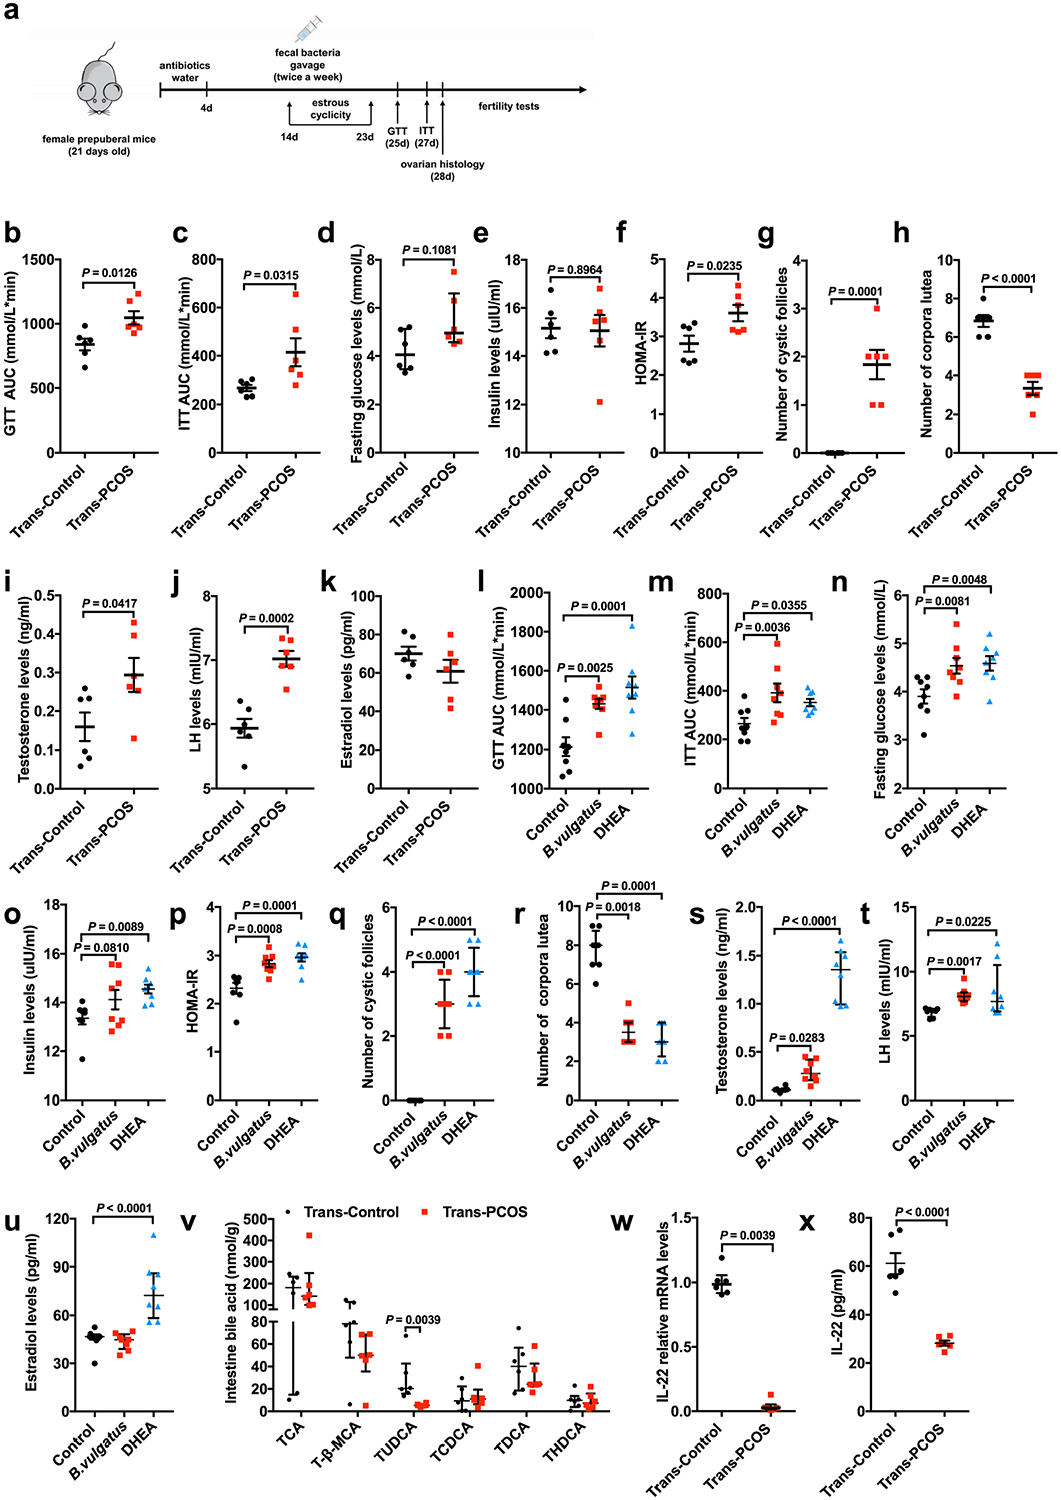
To investigate the effect of the gut microbiota on the PCOS phenotype in the host, stools from healthy controls or individuals with PCOS were transplanted into mice by oral gavage (Extended Data Fig. 2a). Compared with mice transplanted with stool from healthy controls, mice transplanted with stool from individuals with PCOS displayed insulin resistance, as revealed by glucose tolerance tests (GTTs), insulin tolerance tests (ITTs) and HOMA-IR (Fig. 2a,b and Extended Data Fig. 2b–f), and a disrupted estrous cycle (Fig. 2c,d). Ovaries from mice transplanted with healthy control stool microbiota consisted of follicles at different stages of development and exhibited normal numbers of corpora lutea. However, ovaries from mice transplanted with stool microbiota from individuals with PCOS showed increased numbers of cyst-like follicles and fewer corpora lutea (Fig. 2e and Extended Data Fig. 2g,h). Testosterone and luteinizing hormone levels were elevated, while no differences in estradiol levels were observed in mice transplanted with stool from individuals with PCOS (Extended Data Fig. 2i–k). Fertility tests were performed by counting the numbers of pups in the first litters after mating. The number of pups was decreased in mice transplanted with stool from women with PCOS compared with mice transplanted with stool from healthy controls (Fig. 2f). To further determine the role of B. vulgatus in the pathogenesis of the PCOS phenotype, B. vulgatus was administered to wild-type recipient mice by oral gavage, and heat-killed B. vulgatus was administered as a control. A PCOS-like mouse model established by DHEA treatment11 was used to evaluate the influence of B. vulgatus on PCOS pathogenesis. Notably, oral gavage with B. vulgatus induced insulin resistance (Fig. 2g,h and Extended Data Fig. 2l–p) and disrupted the estrous cycle (Fig. 2i,j), ovarian morphology (Fig. 2k and Extended Data Fig. 2q,r) and hormone profile (Extended Data Fig. 2s–u) in recipient mice. These data indicate that gut microbiota from women with PCOS enriched with B. vulgatus modulates insulin resistance and ovarian dysfunction in the PCOS mouse model.
Fig. 2 |. Effects of PCOS fecal microbiota or B. vulgatus transplantation disrupted insulin sensitivity, ovarian function, bile acid profiling and IL-22 production.
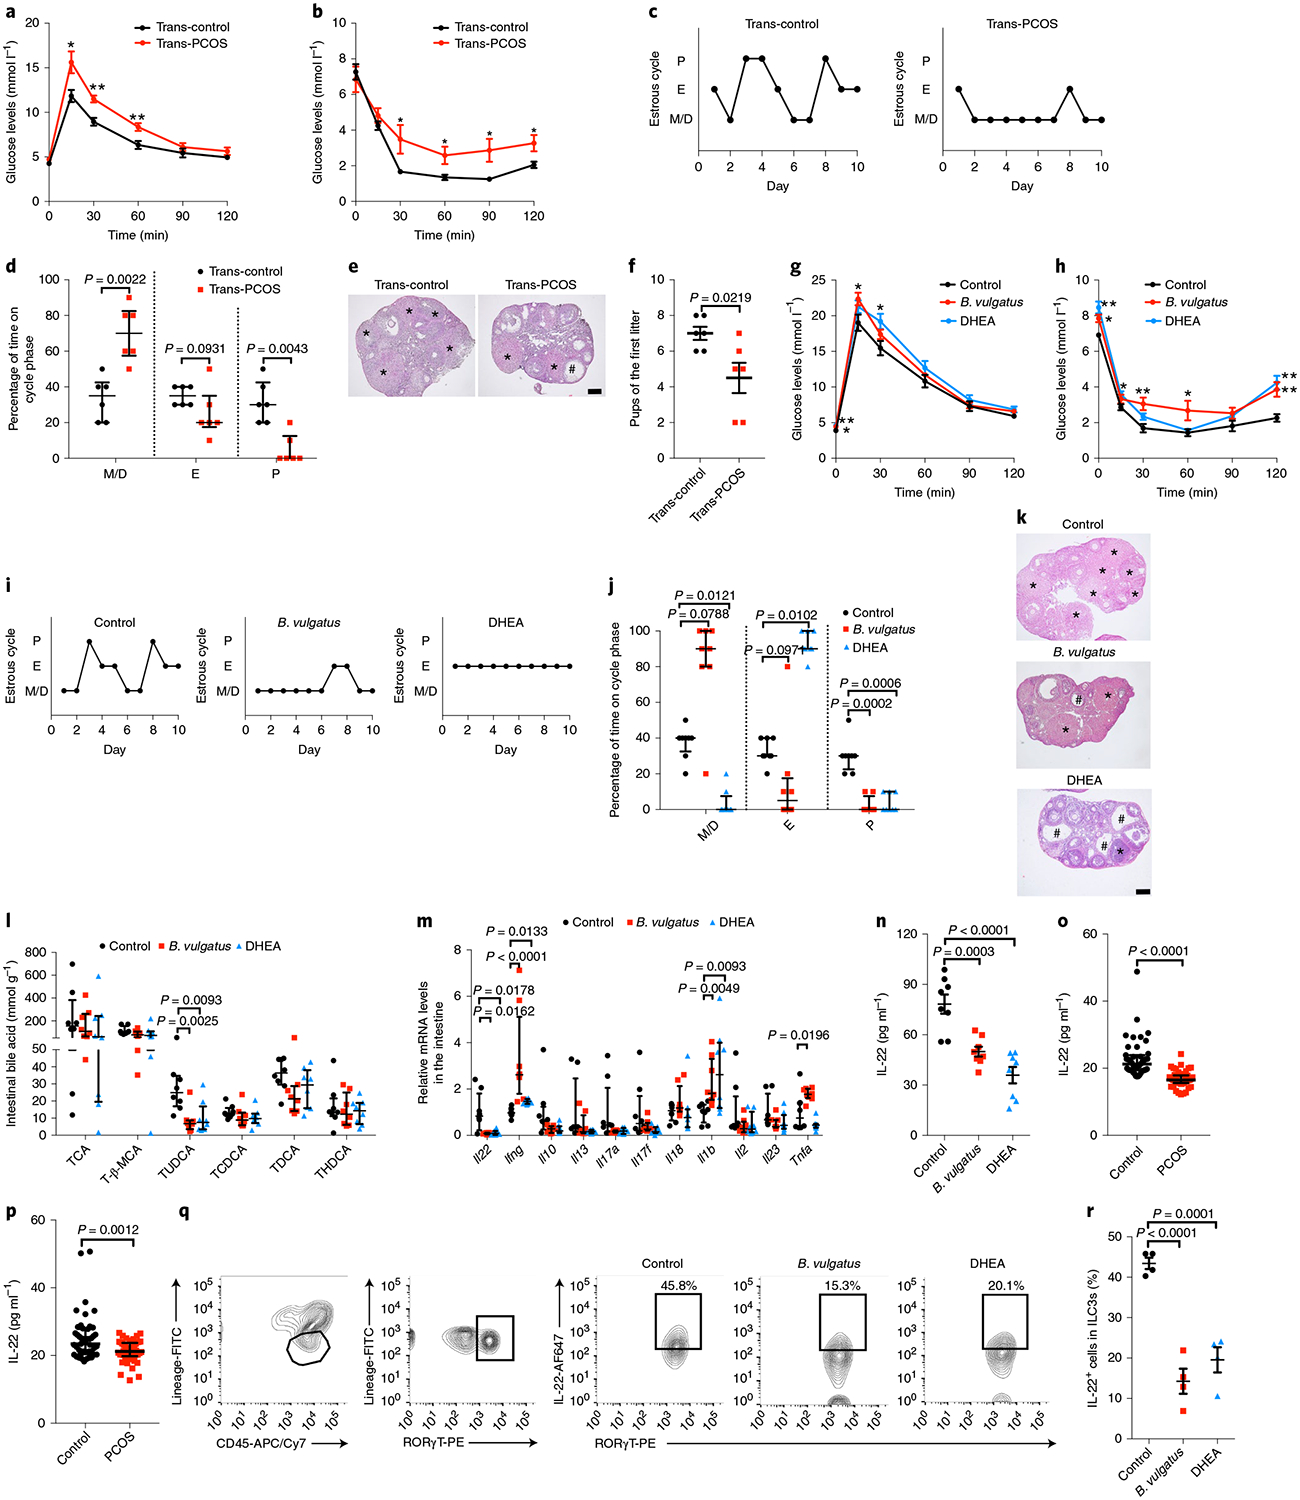
The mice transplanted with stool suspensions from healthy controls and women with PCOS were defined as trans-control and trans-PCOS, respectively. After treatment with antibiotics in drinking water for 4 d, the mice were oral gavaged with stool suspensions twice per week for a–f. a, GTT (n = 6 mice per group). b, ITT (n = 6 mice per group). c, Representative estrous cycles. d, Quantitative analysis of estrous cycles (n = 6 mice per group). e, Hematoxylin and eosin staining of representative ovaries. The cystic follicle is indicated by a hashtag, while the corpora lutea are indicated by asterisks. Scale bar: 200 μm. Images are representative of three independent experiments with similar results. f, Fertility test for the trans-control and trans-PCOS groups. The mice were mated after sexual maturation until the first litter was born (n = 6 mice per group; t10 = 2.712). For g–n, q and r, mice were divided into three groups (control, B. vulgatus and DHEA). For the B. vulgatus group, mice were treated with B. vulgatus by oral gavage for 3 weeks. For the DHEA group, they were injected subcutaneously for 21 consecutive days. Heat-killed B. vulgatus and sesame oil were used as parallel controls. g, GTT (n = 8 mice per group). h, ITT (n = 8 mice per group). i, Representative estrous cycles. j, Quantitative analysis of estrous cycles (n = 8 mice per group). k, Hematoxylin and eosin staining of representative ovaries. Scale bar: 200 μm. Images are representative of three independent experiments with similar results. l, Levels of intestinal bile acids (n = 8 mice per group). T-β-MCA, tauro-β-muricholic acid. m, Il22, Ifng, Il10, Il13, Il17a, Il17f, Il18, Il1b, Il2, Il23 and Tnfa mRNA expression levels in the intestines were measured by qPCR (n = 8 mice per group; control versus B. vulgatus for Ifng, P = 0.000016). n, IL-22 levels in the serum of control, B. vulgatus gavage and DHEA-treated mice (n = 8 mice per group; F2,21 = 21.498; control versus DHEA, P = 0.000002). o, IL-22 levels in the serum of human subjects (control: n = 43; PCOS: n = 50; P = 3.84 × 10⁻¹²). p, IL-22 levels in the follicular fluid of human subjects (control: n = 47; PCOS: n = 49). q, Flow cytometric analysis of IL-22+ cells in CD45+ lineage− RORγT+ ILC3s from the siLP. Three independent experiments were performed with similar results. r, Percentage of IL-22+ cells in ILC3s from siLP (n = 4 mice per group; F2,9 = 34.105; control versus B. vulgatus, P = 0.000028). P, proestrus; E, estrus; M/D, metestrus/diestrus. For a, b and f, P values were determined by two-tailed Student’s t-test and data are presented as means ± s.e.m. For d, o and p, P values were determined by two-tailed Mann–Whitney U-test and data are presented as medians with interquartile ranges. For g, h, n and r, P values were determined by one-way ANOVA with Tukey’s multiple comparison post-hoc test and data are presented as means ± s.e.m. For j, l and m, P values were determined by Kruskal–Wallis test followed by Dunn’s post-hoc test and data are presented as medians with interquartile ranges. *P < 0.05; **P < 0.01 versus the control.
The gut microbiota and its metabolites may contribute to glucose homeostasis through their effects on the immune system12. Thus, small intestinal bile acids and immune cells were screened. Unlike humans, mice preferentially conjugate bile acids with taurine, while humans mainly use glycine. TUDCA levels in the intestines were dramatically decreased in B. vulgatus- or PCOS gut microbiota-treated mice (Fig. 2l and Extended Data Fig. 2v). Intestinal immune cell-produced cytokines, including Il22, Ifng, Il10, Il13, Il17a, Il17f, Il18, Il1b, Il2, Il23 and Tnfa messenger RNA (mRNA), were quantified in the intestine samples. Among these cytokine mRNAs, Il22 mRNA was reduced by approximately 90% after oral gavage with B. vulgatus compared with the control group (Fig. 2m). Similarly, the level of Il22 mRNA was significantly decreased in the intestines of mice treated with stools from individuals with PCOS (Extended Data Fig. 2w). Serum interleukin-22 (IL-22) levels were also reduced in the PCOS-like mouse models (Fig. 2n and Extended Data Fig. 2x). Consistent with data from mice, the IL-22 levels in the serum and follicular fluid of individuals with PCOS were significantly lower than those of the control groups (Fig. 2o,p). To further identify the IL-22-producing cells, flow cytometry was used to detect group 3 innate lymphoid cells (ILC3s) from the small intestine lamina propria (siLP). The percentage of IL-22+ cells in CD45+ lineage− retinoic-acid-related orphan receptor-γT (RORγT)+ ILC3s from siLP was notably lower in the B. vulgatus group than in the control group (Fig. 2q,r). These findings support the view that the gut microbiota from individuals with PCOS, particularly the species B. vulgatus, modulates bile acid profiles and reduces ILC3-produced IL-22 levels in recipient mice.
Next, we measured the effects of IL-22 and GDCA on glucose metabolism and ovarian function in the PCOS-like mouse models (Extended Data Fig. 3a,b). We found that administration of IL-22 or GDCA to B. vulgatus-treated mice decreased insulin resistance (Fig. 3a,b and Extended Data Fig. 3c–g) and substantially reversed the disrupted estrous cycle (Fig. 3c,d), morphological changes of the ovary (Fig. 3e–g), abnormal hormones (Fig. 3h,i and Extended Data Fig. 3h) and the decline of first litter pup numbers (Fig. 3j). Thus, IL-22 and GDCA were verified to play a therapeutic role in insulin resistance, ovarian dysfunction and infertility in mice administered B. vulgatus. The prenatal anti-Müllerian hormone (PAMH) administration mouse model was recently reported to have neuroendocrine characteristics similar to those of individuals with PCOS13. Impaired estrous cycles, ovarian morphologies, hormones and pup numbers were recovered by IL-22 administration in the PAMH administration model (Fig. 3k–r and Extended Data Fig. 3i). To explore the possible preventive effects of IL-22 on PCOS in B. vulgatus-treated mice, IL-22 administration was initiated at the same time as B. vulgatus gavage to mice. IL-22 administration prevented the insulin resistance, impaired estrous cycles, reductions of MII oocytes and embryo numbers, distorted spindle apparatus and abnormal ovarian morphology induced by B. vulgatus gavage (Extended Data Fig. 4a–l). These data indicate that IL-22 administration improved insulin resistance and ameliorated infertility in the PCOS-like mouse model.
Fig. 3 |. IL-22 or bile acid administration improved insulin resistance, ovarian dysfunction and infertility in mice with PCOS.
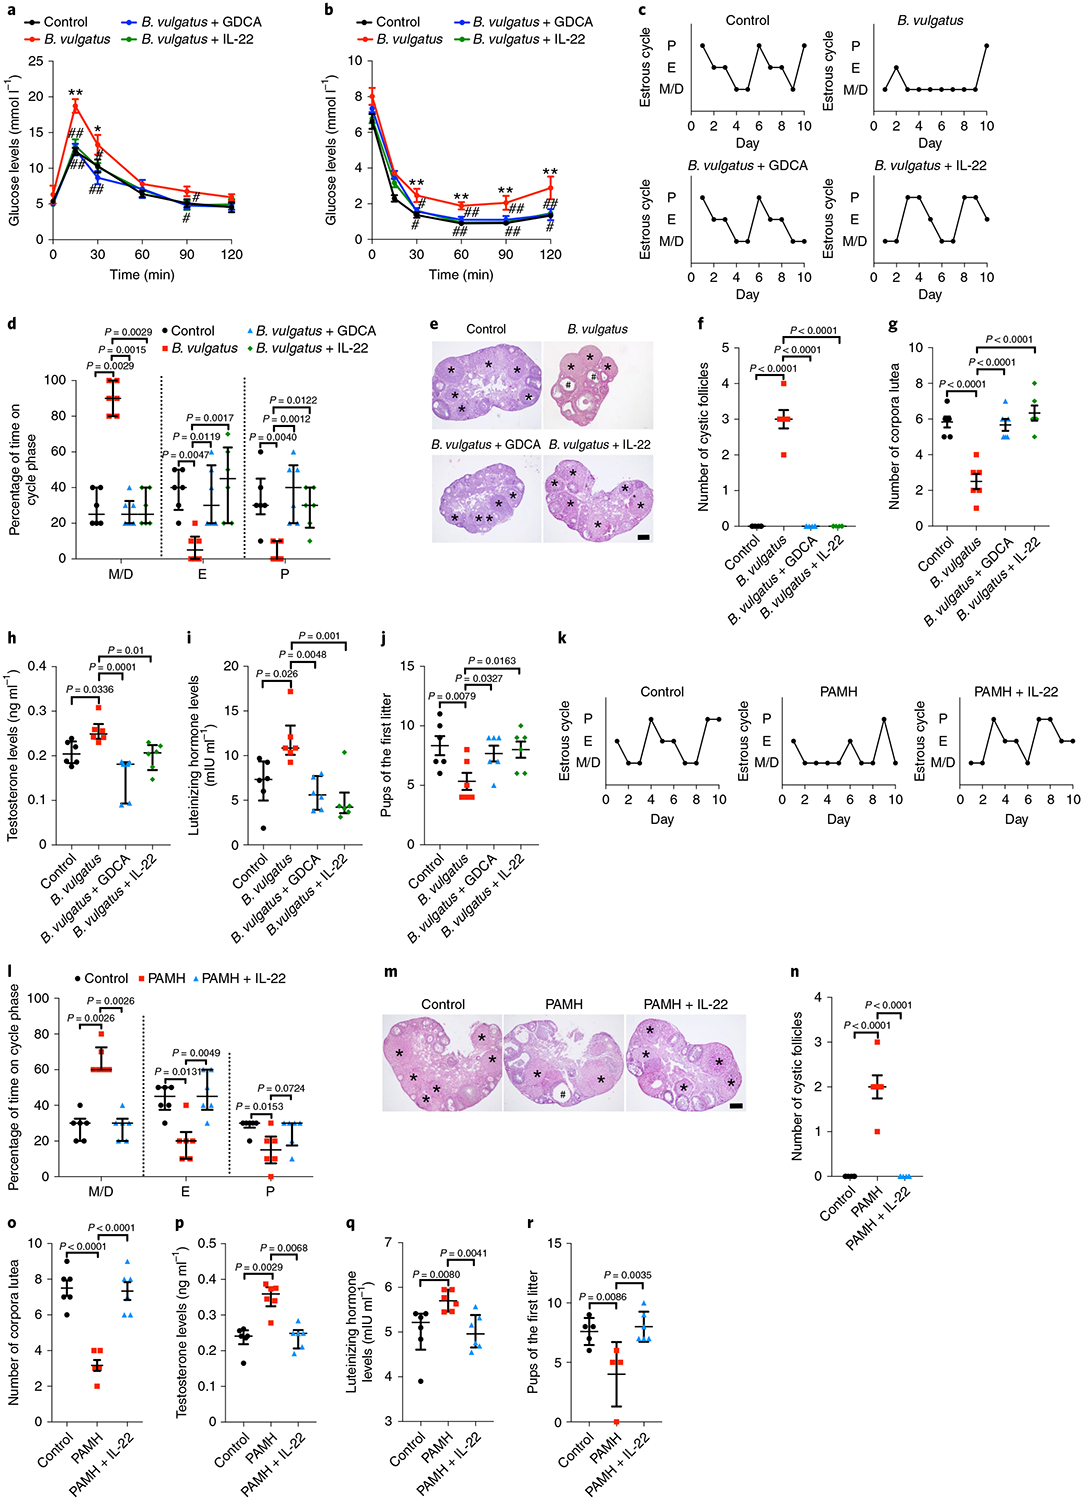
For a–j, the mice were divided into four groups (control, B. vulgatus, B. vulgatus + GDCA and B. vulgatus + IL-22). The mice were treated for 3 weeks with B. vulgatus or heat-killed B. vulgatus as a control, followed by another 3-week gavage with GDCA for the B. vulgatus + GDCA group or intraperitoneal injection of IL-22 for the B. vulgatus + IL-22 group. Gavage with PBS or injection with PBS intraperitoneally was used as a parallel control. a, GTT (n = 6 mice per group). b, ITT (n = 6 mice per group). c, Representative estrous cycles. d, Quantitative analysis of estrous cycles (n = 6 mice per group). e, Hematoxylin and eosin staining of representative ovaries. Scale bar: 200 μm. Images are representative of three independent experiments with similar results. f, Quantitative analysis of cystic follicles (n = 6 mice per group; F3,20 = 135.000; control versus B. vulgatus, P = 4.43 × 10⁻¹³; B. vulgatus versus B. vulgatus + GDCA, P = 4.43 × 10⁻¹³; B. vulgatus versus B. vulgatus + IL-22, P = 4.43 × 10⁻¹³). g, Quantitative analysis of corpora lutea (n = 6 mice per group; F3,20 = 21.503; control versus B. vulgatus, P = 0.000004; B. vulgatus versus B. vulgatus + GDCA, P = 0.000008; B. vulgatus versus B. vulgatus + IL-22, P = 5.69 × 10⁻⁷). h, Testosterone levels (n = 6 mice per group). i, Luteinizing hormone levels (n = 6 mice per group). j, Fertility test (n = 6 mice per group; F3,20 = 3.584). For k–r, the mice were divided into three groups (control, PAMH and PAMH + IL-22). Eight-week-old pregnant C57BL/6 mice were injected daily from embryonic day 16.5–18.5 with 0.12 mg kg−1 d−1 human AMH. Six-week-old female offspring were treated with or without IL-22 (PAMH + IL-22 or PAMH) for another 3 weeks. The controls were injected with PBS. k, Representative estrous cycles. l, Quantitative analysis of estrous cycles (n = 6 mice per group). m, Hematoxylin and eosin staining of representative ovaries. Scale bar: 200 μm. Images are representative of three independent experiments with similar results. n, Quantitative analysis of cystic follicles (n = 6 mice per group; F2,15 = 60.000; control versus PAMH, P = 9.95 × 10⁻⁸; PAMH versus PAMH + IL-22, P = 9.95 × 10⁻⁸). o, Quantitative analysis of corpora lutea (n = 6 mice per group; F2,15 = 34.628; control versus PAMH, P = 0.000002; PAMH versus PAMH + IL-22, P = 0.000004). p, Testosterone levels (n = 6 mice per group). q, Luteinizing hormone levels (n = 6 mice per group). r, Fertility test (control: n = 5; PAMH: n = 4; PAMH + IL-22: n = 6; F2,12 = 7.346). For a, b, f, g, j, n, o and r, P values were determined by one-way ANOVA with Tukey’s multiple comparison post-hoc test and data are presented as means ± s.e.m. For d, h, i, l, p and q, P values were determined by Kruskal–Wallis test followed by Dunn’s post-hoc test and data are presented as medians with interquartile ranges. *P < 0.05; **P < 0.01 versus the control. #P < 0.05; ##P < 0.01 versus B. vulgatus.
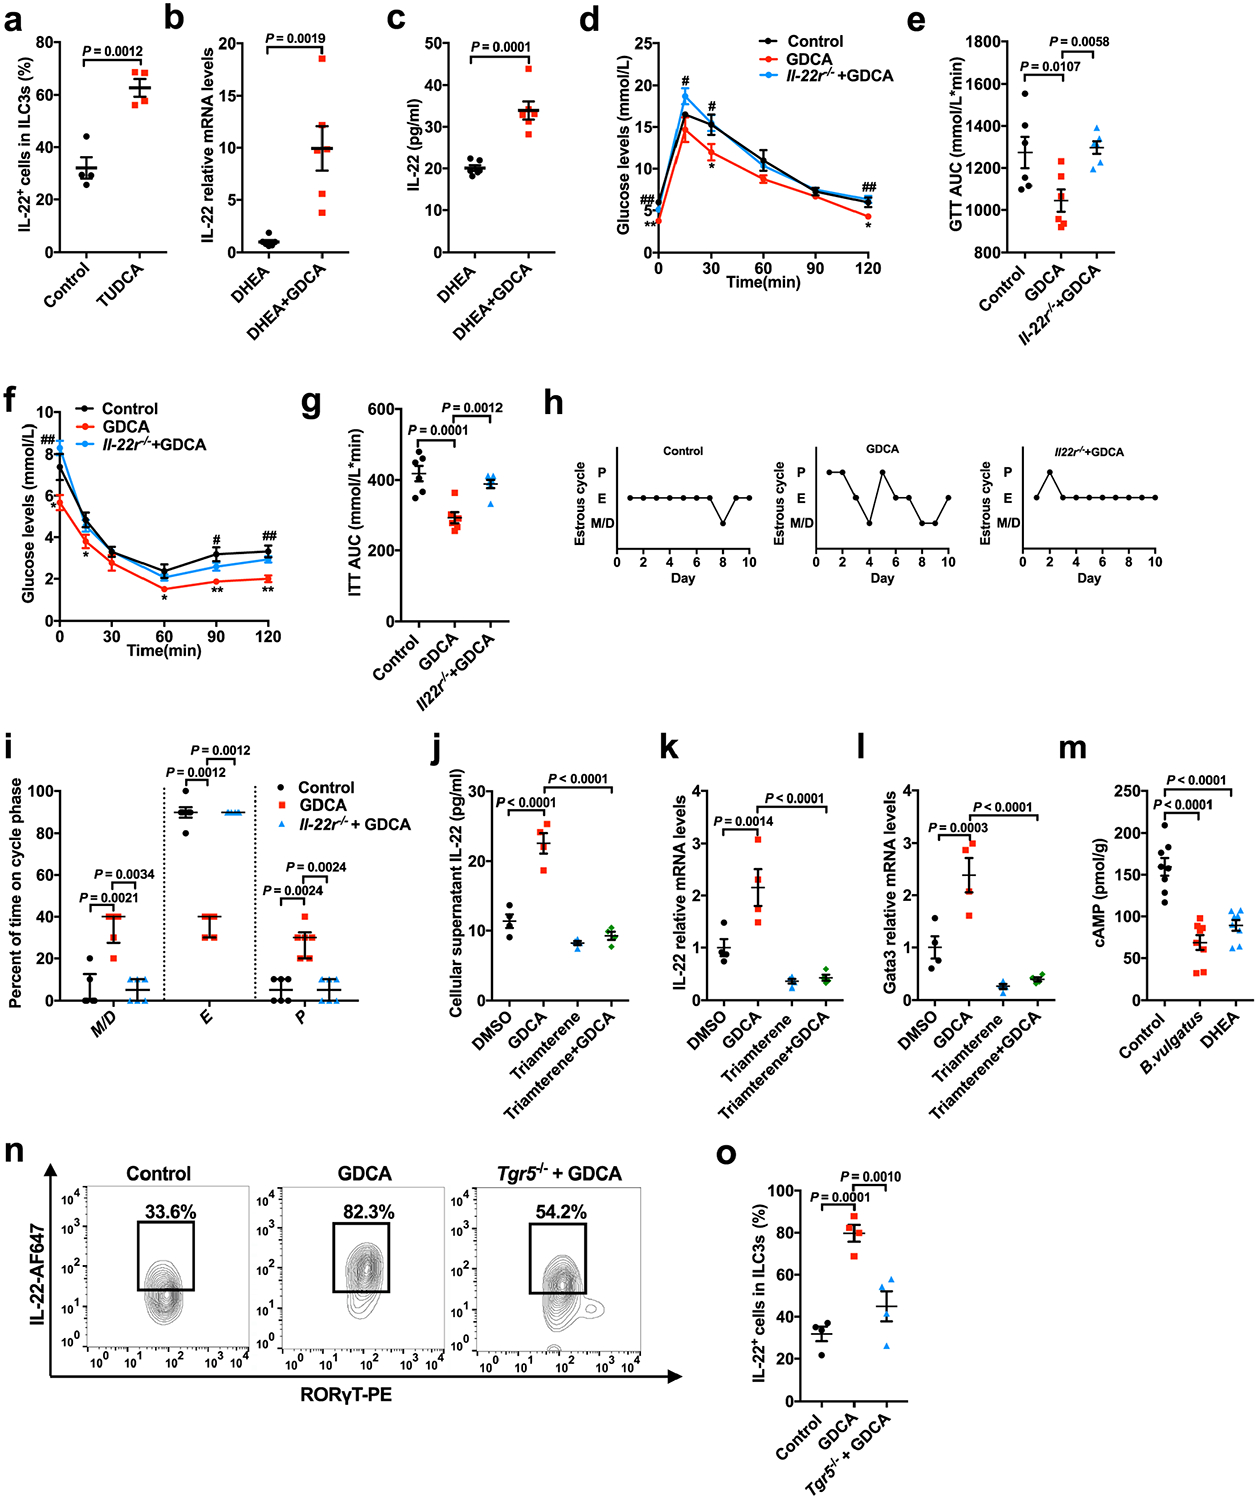
To investigate whether bile acids regulate IL-22 secretion, ILC3s from siLPs were sorted, cultured and treated with TUDCA or GDCA. Secretion of the IL-22 protein and Il22 mRNA levels in cultured ILC3s were significantly increased in the presence of TUDCA or GDCA (Fig. 4a,b). This finding was also confirmed by TUDCA oral gavage in mice, which revealed that TUDCA administration enhanced intestinal Il22 mRNA levels and the percentage of IL-22+ cells in CD45+ lineage− RORγT+ ILC3s in the siLP (Fig. 4c,d and Extended Data Fig. 5a). Consistent with this finding, GDCA administration upregulated intestinal Il22 and serum IL-22 levels in DHEA-treated mice (Extended Data Fig. 5b,c). Notably, the beneficial effects of GDCA on insulin resistance and ovarian function disruption in DHEA-treated wild-type mice were reversed by Il22 receptor knockout (Extended Data Fig. 5d–i). These data indicate that bile acids were involved in the regulation of IL-22 production, thus affecting ovarian function and insulin sensitivity in PCOS.
Fig. 4 |. Bile acid–GATA3 pathway-regulated IL-22 improved IR and ovarian dysfunction in PCOS-like mice.
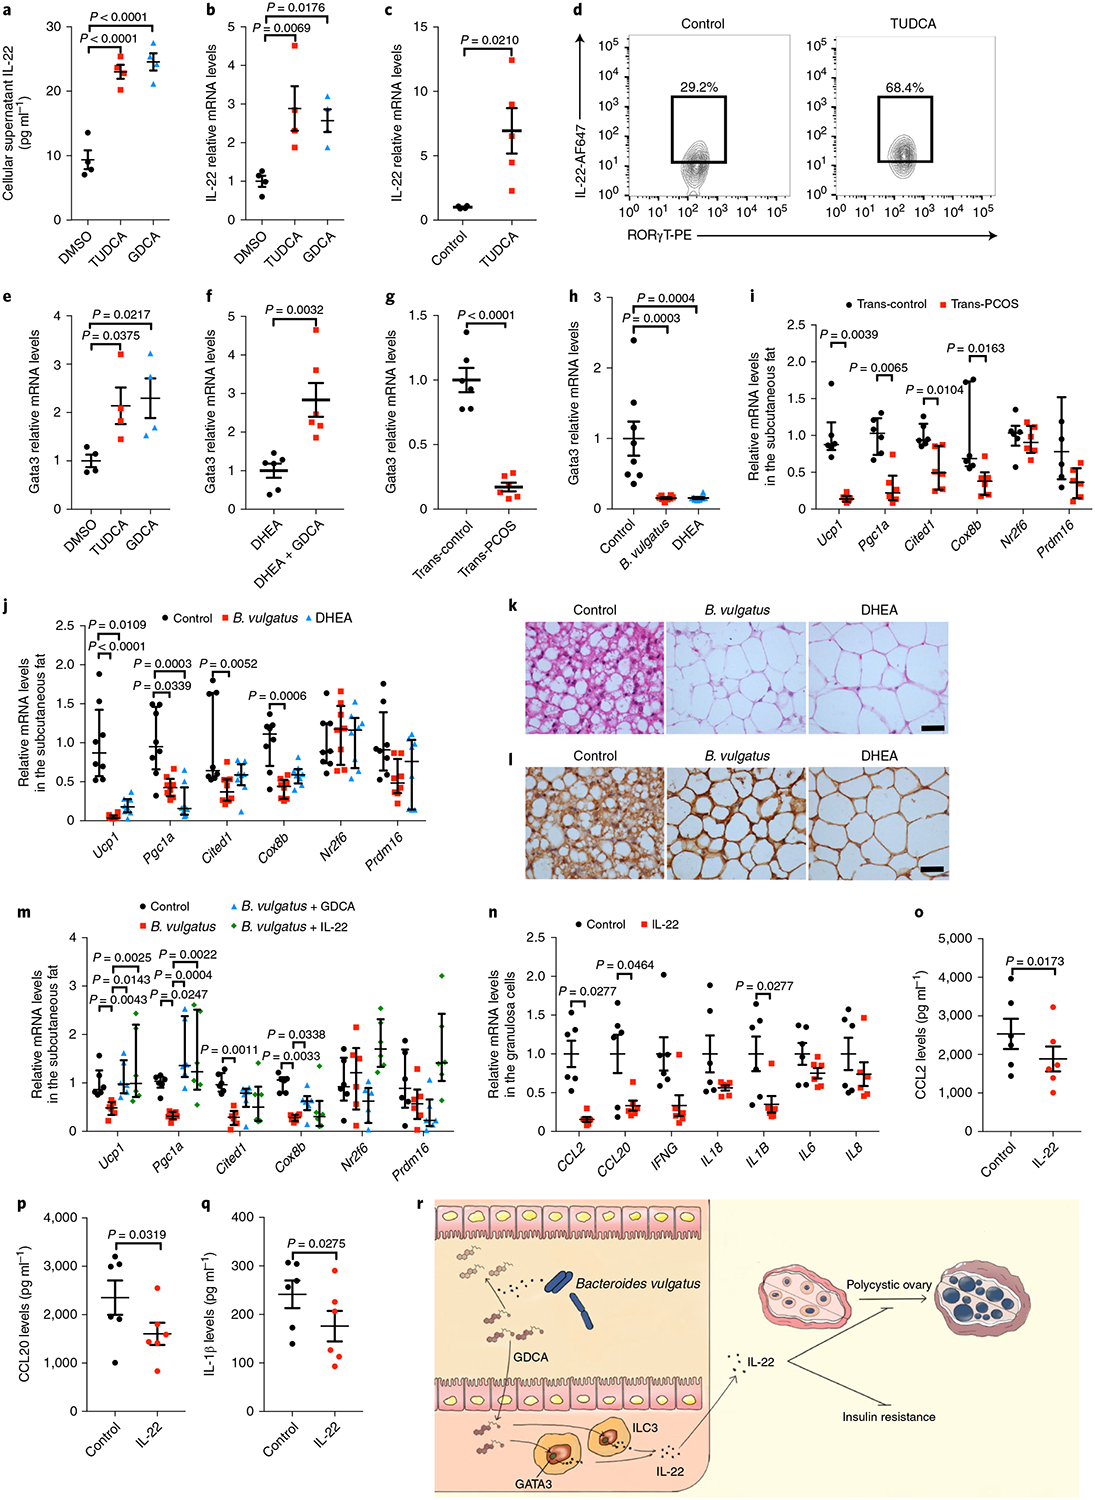
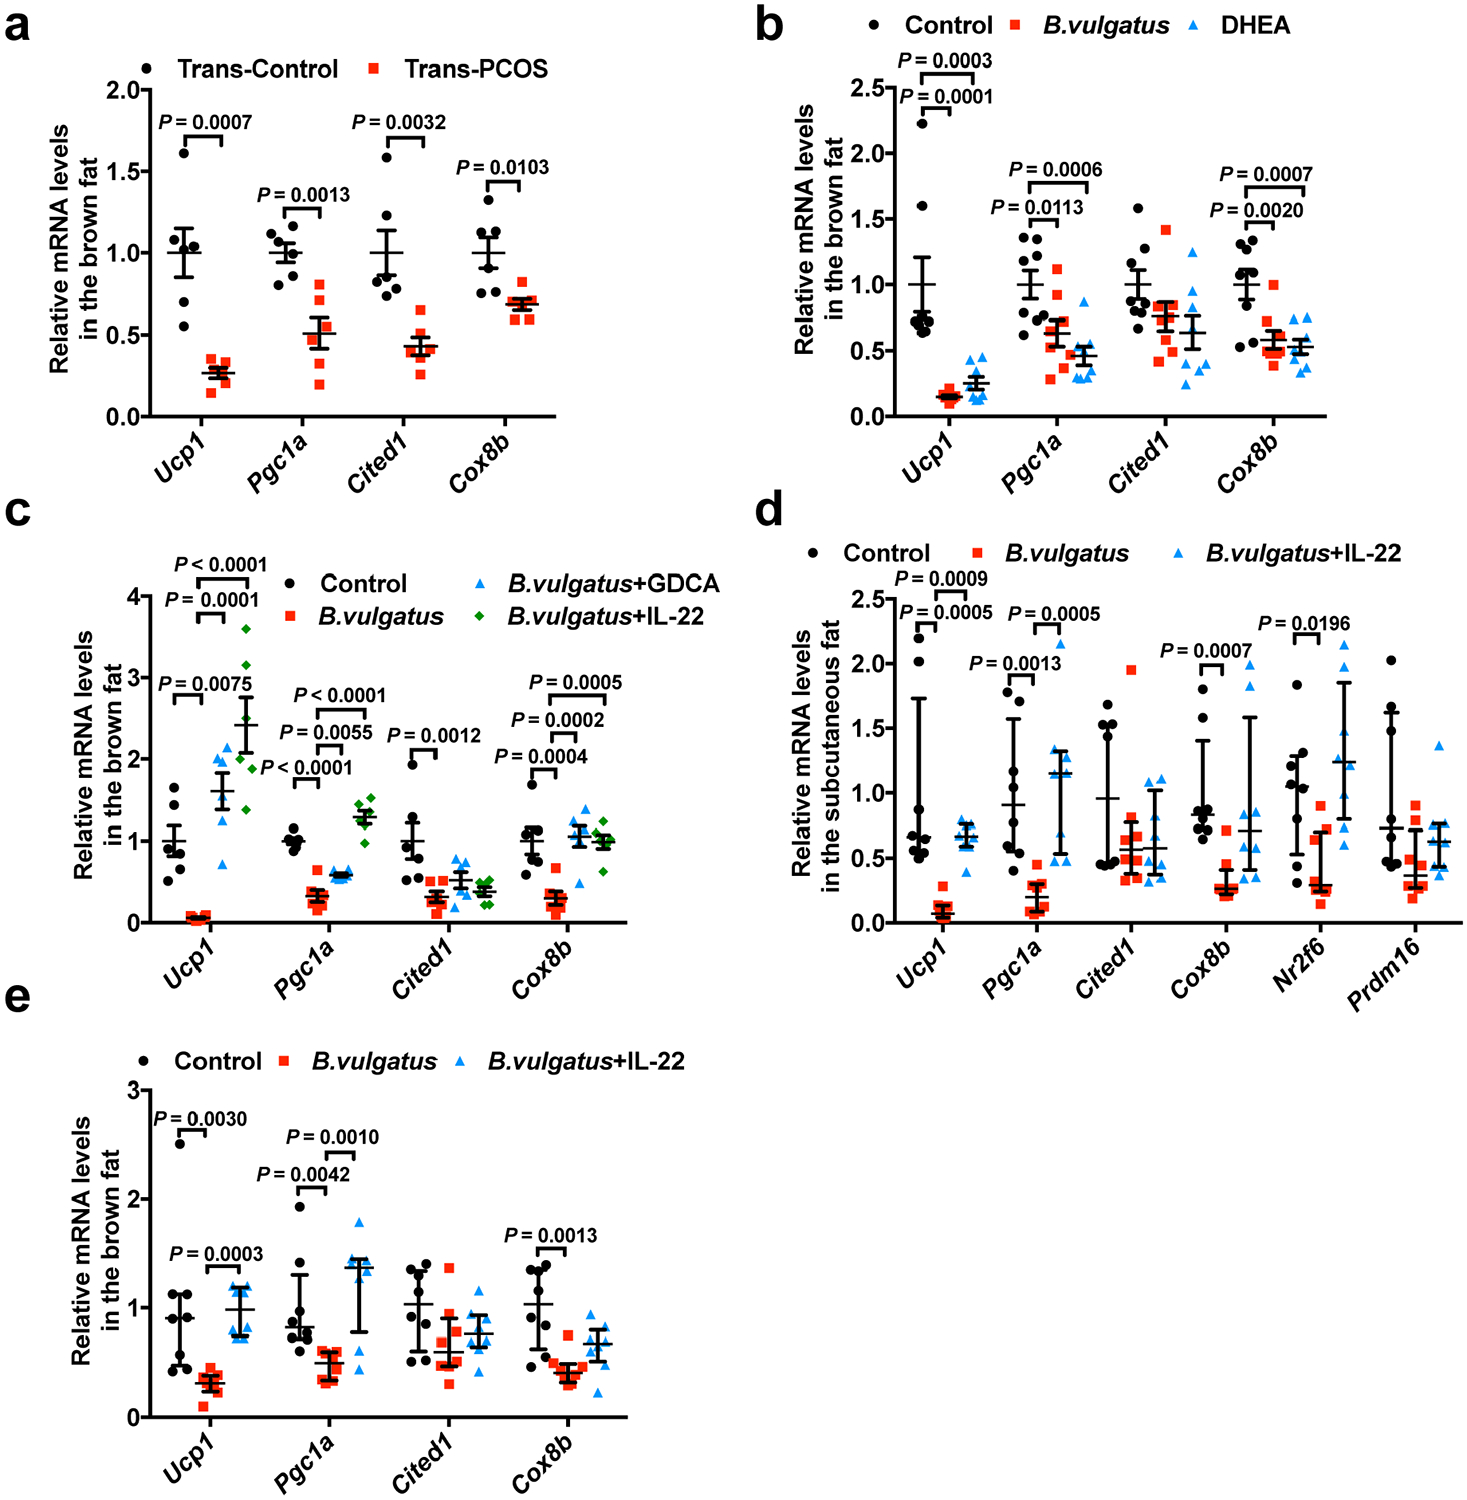
a, IL-22 levels in the supernatant of in vitro-cultured ILC3s treated with TUDCA or GDCA (n = 4 per group; F2,9 = 41.407; DMSO versus TUDCA, P = 0.00004; DMSO versus GDCA, P = 0.000017). b, Il22 mRNA expression levels in ILC3s (n = 4 per group; F2,9 = 6.958). c, Relative intestine Il22 mRNA levels of mice gavaged with TUDCA or PBS as controls for 1 week (control: n = 4; TUDCA: n = 5; t7 = −2.965). d, Representative flow cytometry plots of IL-22+ cells in CD45+ lineage− RORγT+ ILC3s from siLP. Three independent experiments were performed with similar results. e, Gata3 mRNA levels for ILC3s (n = 4 per group; F2,9 = 4.578). f–h, Relative intestinal Gata3 mRNA levels for mice from the DHEA and DHEA + GDCA groups (f; n = 6 mice per group; t10 = −3.860), recipient mice transplanted with PCOS or control individuals’ fecal microbiota (g; n = 6 mice per group; t10 = 8.281; P = 0.000009) and mice gavaged with B. vulgatus or injected with DHEA (h; n = 8 mice per group; F2,21 = 12.075). i,j, Ucp1, Pgc1a, Cited1, Cox8b, Nr2f6 and Prdm16 mRNA expression levels in the subcutaneous fat of recipient mice transplanted with PCOS or control individuals’ stool samples (i; n = 6 mice per group) or gavaged with B. vulgatus or injected with DHEA (j; n = 8 mice per group; control versus B. vulgatus for Ucp1, P = 0.000022). k,l, Hematoxylin and eosin (k) and UCP1 immunohistochemical staining (l) of subcutaneous fat for mice gavaged with B. vulgatus or injected with DHEA. Mice were placed at 4 °C for 12 h before killing. Scale bars: 40 μm. Images are representative of three independent experiments with similar results. m, Ucp1, Pgc1a, Cited1, Cox8b, Nr2f6 and Prdm16 mRNA expression levels in the subcutaneous fat of the control, B. vulgatus, B. vulgatus + GDCA and B. vulgatus + IL-22 groups (n = 6 mice per group). n, mRNA expression of CCL2, CCL20, IFNG, IL18, IL1B, IL6 and IL8 in granulosa cells from individuals with PCOS treated with or without IL-22. o–q, CCL2 (o; n = 6 per group; t5 = 3.501), CCL20 (p; n = 6 per group; t5 = 2.951) and IL-1β (q; n = 6 per group; t5 = 3.078) cytokine protein levels in the supernatants of granulosa cells from individuals with PCOS treated with or without IL-22, as measured using MSD technology. r, Schematic of hypotheses concerning the mechanisms underlying the role of the B. vulgatus–bile acid–IL-22 axis in regulating PCOS. For a, b, e and h, P values were determined by one-way ANOVA with Tukey’s multiple comparison post-hoc test and data are presented as means ± s.e.m. For c, f and g, P values were determined by two-tailed Student’s t-test and data are presented as means ± s.e.m. For i, P values were determined by two-tailed Mann–Whitney U-test and data are presented as medians with interquartile ranges. For j and m, P values were determined by Kruskal–Wallis test followed by Dunn’s post-hoc test and data are presented as medians with interquartile ranges. For n, P values were determined by two-tailed Wilcoxon matched-pairs signed rank test and data are presented as means ± s.e.m. For o, p and q, P values were determined by two-tailed paired-samples t-test and data are presented as means ± s.e.m. For i–m, mice were placed at 4 °C for 12 h before killing.
To determine the molecular mechanisms of bile acid-regulated IL-22 expression, triamterene—an antagonist of TGR5 (a G protein-coupled bile acid receptor)—was administered to cultured ILC3s. The production of IL-22 by ILC3s treated with GDCA was blocked by triamterene (Extended Data Fig. 5j,k). Expression of GATA binding protein 3 (GATA3) is critical for the homeostasis, development and function of ILC3 subsets, as well as the production of IL-22 (ref. 14). The expression of GATA3 enhanced by bile acids was blocked by triamterene (Fig. 4e and Extended Data Fig. 5l). To further verify this pathway, the levels of GATA3 were determined in GDCA-treated mice. Consistent with the in vitro data, GDCA administration induced increased Gata3 mRNA levels in the intestines (Fig. 4f). Strikingly, GATA3 levels were reduced in the intestines of mice treated with PCOS stool or B. vulgatus (Fig. 4g,h). Cyclic adenosine monophosphate (cAMP) is the critical downstream signaling molecule of bile acid receptors, and enhances GATA3 activity15. Levels of cAMP were markedly decreased in the intestines of mice treated with B. vulgatus (Extended Data Fig. 5m). Convincingly, blocking this pathway using Tgr5−/− mice significantly reduced the enhanced IL-22 secretion by ILC3s in GDCA-treated mice (Extended Data Fig. 5n,o). These data indicate that the GATA3 signaling pathway was involved in bile acid-mediated regulation of IL-22 production.
The possible mechanisms by which IL-22 regulates ovarian function and insulin resistance in PCOS were investigated. White adipose tissue browning increases the metabolic rate and improves insulin resistance16,17. Transplantation of brown adipose tissue reversed anovulation, polycystic ovaries, insulin resistance and infertility in PCOS rats18. Therefore, thermogenic markers were measured in subcutaneous and brown adipose tissues from PCOS mice. Mice transplanted with PCOS stool exhibited significantly lower levels of the Ucp1, Pgc1a, Cited1 and Cox8b mRNAs than controls in subcutaneous fat and brown fat (Fig. 4i and Extended Data Fig. 6a). Similar results were observed in B. vulgatus-treated mice (that is, browning of adipose tissues was reduced), as revealed by the decrease of thermogenic markers in subcutaneous and brown adipose tissues (Fig. 4j and Extended Data Fig. 6b), decrease of multilocular cells within the adipose tissues (Fig. 4k) and reduced expression of UCP1 in subcutaneous fat tissues (Fig. 4l). Notably, the relative expression levels of the Ucp1 and Pgc1a mRNAs in subcutaneous fat and brown fat were dramatically elevated after GDCA or IL-22 administration in the B. vulgatus-treated mice (Fig. 4m and Extended Data Fig. 6c–e).
Inflammation plays an essential role in the pathogenesis of PCOS19. To investigate whether IL-22 plays an anti-inflammatory role in granulosa cells, human luteinized granulosa cells were isolated and cultured with IL-22 in vitro. Administration of IL-22 significantly reversed the enhanced expression of CCL2, CCL20 and IL1B mRNAs in granulosa cells from individuals with PCOS (Fig. 4n). Consistent with this finding, the secretion of CCL2, CCL20 and IL-1β was reduced by IL-22 administration (Fig. 4o–q). Signal transducer and activator of transcription 3 (STAT3) acts as the crucial downstream molecule of the IL-22 receptor20. STAT3 activates its downstream molecule adenosine monophosphate kinase, which inhibits inflammation in macrophages21–23. Further studies are needed to verify whether the STAT3-adenosine monophosphate activated protein kinase pathway mediates the IL-22-induced inhibition of inflammation in PCOS granulosa cells. Our data indicate that the mechanisms underlying IL-22-regulated improvements in the insulin resistance and ovarian dysfunction associated with PCOS likely involve adipose tissue browning and direct effects on ovarian granulosa cells to inhibit inflammation.
Infertility and metabolic syndrome are major concerns of women with PCOS. Due to a poor understanding of the mechanisms involved, there is a limited selection of etiology-specific treatments for infertility and insulin resistance in individuals with PCOS. These data help to illustrate the role of bile acids and IL-22 in gut microbiota-induced insulin resistance and ovarian dysfunction in PCOS (Fig. 4r). Notably, the abundance of B. vulgatus was significantly increased in individuals with PCOS. B. vulgatus treatment in wild-type mice resulted in disrupted ovarian functions and aggravated insulin resistance similar to that observed in the transplantation of stool from individuals with PCOS or a PAMH-treated mouse model. This finding suggests that modulation of the gut microbiota, bile acids and IL-22 could be of great value for the treatment of PCOS.
Methods
Human subjects.
The study and all experimental procedures were approved by the Ethics Committee of Peking University Third Hospital according to the Council for International Organizations of Medical Sciences. All participants were recruited from the Reproductive Medical Center at Peking University Third Hospital between September 2015 and December 2016. For cohort 1, we recruited 50 individuals with PCOS and 43 controls of Chinese ancestry. Written informed consent was obtained from all participants.
Women with PCOS were diagnosed according to the 2003 Rotterdam criteria, which require the presence of at least two of the following: (1) oligo-ovulation and/or anovulation; (2) clinical and/or biochemical signs of hyperandrogenism; and (3) polycystic ovaries. Diagnoses of PCOS were made after the exclusion of other etiologies for hyperandrogenemia or ovulatory dysfunction (Cushing syndrome, 21-hydroxylase deficiency, thyroid disease, androgen-secreting tumors, congenital adrenal hyperplasia and hyperprolactinemia). All individuals with PCOS were first-visit patients and had not received PCOS-related treatment. The control subjects were from the general community and had regular menstrual cycles, normal ovarian morphology and normal levels of hormones. Women who were breastfeeding or pregnant within the past year or who took medication within the past 3months were excluded from the study.
Height, body weight, waist circumference and hip circumference were measured, and the body mass index (kgm−2) and waist-to-hip ratio were calculated. Peripheral blood samples were collected from all subjects during days 2–4 of spontaneous cycles after an overnight fast.
Levels of serum FSH, luteinizing hormone and SHBG were tested by radioimmunoassays. The levels of estradiol, testosterone, androstenedione and DHEA sulfate were measured using liquid chromatography–mass spectrometry (Sciex Triple Quad 6500+). The free androgen index was defined as (testosterone (nmoll−1)×100)/SHBG (nmoll−1). The levels of fasting serum glucose, serum insulin, triglycerides, total cholesterol, high-density lipoprotein cholesterol and low-density lipoprotein cholesterol were measured using an autoanalyzer (Beckman Coulter AU5800). The insulin resistance index (HOMA-IR) was calculated using homeostasis model assessment methods, defined as fasting insulin (mIUl−1)×fasting glucose (mmoll−1)/22.5.
Follicular fluid and granulosa cell collection and culture.
For cohort 2, we recruited another 49 individuals with PCOS and 47 controls from the Reproductive Medical Center at Peking University Third Hospital. The control group included women attending the clinic due to male azoospermia or tubal occlusion. All individuals with PCOS and controls were on their first in vitro fertilization cycle; the patients received a standard in vitro fertilization antagonist stimulation protocol and underwent transvaginal ultrasound-guided follicle aspiration 36h after human chorionic gonadotropin (hCG) administration. The clinical characteristics of the patients are shown in Supplementary Table 2.
Grossly clear follicular fluid was collected from a single large follicle on the first puncture of each ovary from oocyte retrieval. All follicular fluid samples were centrifuged to remove cells and stored at −80°C for IL-22 analyses.
The top portion of the cell pellet collected from the pooled follicular fluid samples from each individual with PCOS was aspirated and washed in phosphate buffered saline (PBS). The washed cell pellet was resuspended in PBS, layered over Ficoll (LTS1077; TBD Science) solution and separated from red blood cells by centrifugation. The cellular layer at the Ficoll/PBS interface was aspirated and washed in PBS, removing residual Ficoll. The final cell pellet was cultured in RPMI-1640 medium supplemented with 10% fetal bovine serum and 1% penicillin-streptomycin (5,000Uml−1) under a humidified atmosphere of 5% CO2 at 37°C. After 12h, IL-22 (100ng ml−1; 782-IL; R&D Systems) or the same volume PBS was added for another 48h. Granulosa cells were collected for mRNA extraction after culture. Supernatants were collected for the cytokine protein level detection via Meso Scale Discovery (MSD) technology using a U-PLEX Biomarker Group 1 (Human) Multiplex Assay (K15067L-1). A MESO QuickPlex SQ 120 machine and MSD Discovery Workbench software version 4.0.12 were used for the detection and data analyses, respectively.
DNA extraction.
Fecal samples were obtained for DNA extraction. The individuals had not received any antibiotic treatment for at least 3months before sample collection. A frozen aliquot (200mg) of each fecal sample was processed using the Stool Genomic DNA Kit (CW2092S; CWBIO). DNA concentrations were measured using a NanoDrop system (Thermo Fisher Scientific), and the DNA molecular size was estimated by agarose gel electrophoresis.
Metagenomic sequencing and analysis.
All samples were sequenced using the 250-base pair paired-end strategy on the Illumina HiSeq 2500 platform. Adapter contamination and low-quality reads were discarded from the raw sequencing reads, and the remaining reads were filtered to eliminate human host DNA based on the human genome reference (hg18). The high-quality reads were assembled using SPAdes software24, and a reference gene catalog was generated containing the genes predicted from assembled contigs using MetaGeneMark software25. The gene profiles were obtained by aligning high-quality sequencing reads to the reference gene catalog, and the relative abundance profiles of microbes were calculated from the relative abundances of their respective genes. Gene counts were calculated by counting the number of genes that were detected in each sample. Alpha diversity was estimated on the basis of the gene profile of each sample according to the Shannon index. Beta diversity was estimated by calculating Bray–Curtis dissimilarity between samples. For the analysis of bsh genes, a local gene database containing all available bsh genes was constructed by searching the UniProt protein database, and then used for targeted reads screening. Wilcoxon rank-sum tests (two tailed) with adjustments according to Benjamini–Hochberg (false discovery rate (FDR)) were conducted to detect differences between two groups using R version 3.4.0. Spearman’s rank-order correlation analysis was performed on the species associated with bile acid indices. PLS-DA was used to reveal taxonomic changes in two groups26, and VIP scores were used to rank the ability of different taxa to discriminate between different groups. The significance of differences between the two groups was assessed by permutational multivariate analysis of variance with the Bray–Curtis distance. The number of permutations was 9,999 (performed using the vegan package in R version 3.4.0).
Animal models.
Female prepuberal (21-d-old) mice of the C57BL/6 strain (Department of Experimental Animal Science, Peking University Health Science Center, Beijing, China) were randomly divided into different groups, housed 3–5 per cage, and maintained under controlled temperature and lighting conditions (12h light:12h darkness cycle), and standard laboratory conditions with free access to rodent feed and water. All animal experimental procedures were approved by the Animal Care and Use Committee of Peking University Health Science Center according to the national legislation for animal care. The mice were treated with antibiotics for 4d before human stool transplantation experiments. Then, stool samples were mixed with saline solution (20mgml−1), vortexed and centrifuged to collect the supernatant. A total of 100μl of the fecal suspension from either individuals with PCOS or controls was administered to mice by oral gavage. The B. vulgatus group was orally gavaged with pure B. vulgatus (American Type Culture Collection 8482) at a dose of 2×10⁸ colony-forming units per 0.2ml suspended in sterile anaerobic PBS twice per week. Gavage of the same dose of heat-killed B. vulgatus was used as a control. Animals in the DHEA group were injected daily with DHEA (D4000; Sigma–Aldrich; 6mg per 100g, dissolved in 0.2ml of sesame oil) subcutaneously. The control group was injected daily with sesame oil and/or gavaged with heat-killed B. vulgatus. The above animals were all treated for 3weeks. After 3weeks of treatment, the mice received another 3weeks of treatment by injection with IL-22 (100μgkg−1d−1) intraperitoneally for the B. vulgatus+IL-22 group or gavage with GDCA (30mgkg−1d−1; G9910; Sigma–Aldrich) for the B. vulgatus+GDCA group. To detect the preventive effects of IL-22 on PCOS, IL-22 administration was initiated at the same time as B. vulgatus gavage to mice. For the bile acid administration groups, TUDCA (30mgkg−1d−1; T0266; Sigma–Aldrich) was administered by oral gavage for 1week. PBS was administered by gavage as a control group. For the PAMH-treated model, 8-week-old pregnant C57BL/6 mice were subjected to daily intraperitoneal injections of 0.12mg kg−1d−1 human AMH (1737-MS-10; R&D Systems) from embryonic day 16.5–18.5. Six-week-old female offspring were treated with or without IL-22 (PAMH +IL-22 or PAMH) for another 3weeks. The controls were female offspring of the same age subjected to daily intraperitoneal injections of PBS from embryonic day 16.5–E18.5. Il22r−/− mice (KO-00115) and Tgr5−/− mice (KO-00021) with a C57BL/6 background were purchased from the Shanghai Bioray Laboratory. Before the mice were anesthetized with ether and killed by cervical dislocation, the animals from each group were subjected to GTT and ITT. The sex hormones were tested at diestrus stages. The serum was collected to measure insulin and IL-22 levels. The ovaries and subcutaneous fat tissues were processed for hematoxylin and eosin staining. The remaining subcutaneous fat tissue, brown adipose tissue (collected from the interscapular region), feces and intestines were quickly frozen and stored at −80°C.
Vaginal smears and estrous cycle determination.
For at least two estrous cycles, vaginal smears were taken daily at 09:00 from the 10th to the 19th day after the first day of treatment. The stage of the estrous cycle was determined by microscopic analysis of the predominant cell type in vaginal smears following Shorr staining. Proestrus consists of round, nucleated epithelial cells; estrus consists of cornified squamous epithelial cells; metestrus consists of epithelial cells and leukocytes; and diestrus consists of nucleated epithelial cells and a predominance of leukocytes.
GTT and ITT.
Mice were fasted for 12h before the GTT experiment and 4h before the ITT experiment. Glucose levels were measured by tail vein blood sampling using a blood glucose Accu-Chek Performa (Roche Diagnostics). After measurement of fasting glucose levels, the mice were intraperitoneally injected with D-glucose (2 g kg−1 body weight) for GTT, or insulin (1IUkg−1 body weight) for ITT, and tail sampling was performed at time points 15, 30, 60, 90 and 120min after the intraperitoneal injection for glucose level detection.
Serum analysis.
The blood samples were centrifuged at 3,000r.p.m. for 15min at 4°C and stored at −80°C for subsequent serum determinations. The levels of testosterone (DEV9911; Demeditec Diagnostics), estradiol (108667; Abcam), luteinizing hormone (H206–96T; NanJing Jian Cheng Bioengineering Institute), insulin (90080; Crystal Chem) and IL-22 (M2200; R&D Systems) were determined by enzyme-linked immunosorbent assay kits for mice.
Bile acid analysis.
Bile acids were quantified with an Eksigent Ultra Liquid Chromatography 100 system coupled to an AB 5600 TripleTOF system (AB SCIEX). For liquid chromatography separation, an XBridge Peptide BEH C18 column (100mm×2.1mm i.d.; 1.7μm; Waters Corp) was used at 40°C and a flow rate of 0.4mlmin−1. The solvent of the mobile phase was a mixture of 0.1% (v/v) formic acid, 10mM acetic acid amine in water (A) and 0.1% formic acid in 80% (v/v) methanol and 20% (v/v) acetonitrile (B). The gradient flow was set at 35% (v/v) B for 0.5min, linearly increased to 60% B during the next 2.5min, linearly increased to 80% B during the next 7min, linearly increased to 90% B during the next 6min, linearly decreased to 35% B during the next 4.5min, and finally maintained at this composition for an additional 2.5min. The injection volume was 5μl. The m/z range was set at 200–800Da for TOF MS scans and 50–800Da for the production of ion scans in auto tandem mass spectrometry acquisition. Raw data were processed using the Peak View1.2 and Multi Quant2.1 software based on the m/z value and sample retention time.
Oocyte immunofluorescence.
MII oocytes were used for spindle and chromosome analysis. To collect MII oocytes, mice from the control, B. vulgatus and B. vulgatus+IL-22 groups were superovulated by intraperitoneal injection of 10IU equine chorionic gonadotropin, followed by 10IU hCG 48h later. Cumulus–oocyte complexes were collected from oviductal ampullae 14–16h after hCG injection, and the cumulus cells were removed by brief incubation in 0.2% hyaluronidase. Denuded oocytes were observed under stereomicroscopy. After rinsing twice in PBS, the denuded MII oocytes were placed in 4% paraformaldehyde for 30min. The oocytes were permeabilized with 1% Triton X-100 for 30min at room temperature. Then, the permeabilized oocytes were incubated with PBS supplemented with 1% bovine serum albumin for 1h at room temperature. Subsequently, the oocytes were transferred to a droplet containing monoclonal anti-α-tubulin–FITC antibody (1:100 dilution in bovine serum albumin; F2168; Sigma–Aldrich) for 1h. To assess DNA content, the slides were stained with Hoechst 33342 for 10min. All images were obtained with a confocal laser-scanning microscope (LSM 710; Zeiss).
Fertility assessment.
Females were mated with males 1:1 until the first litter of pups was born. The number of pups in the first litter was quantified per treatment and pairing.
Morphology and immunohistochemistry.
Ovaries and adipose tissues were quickly collected, fixed in 4% paraformaldehyde, placed in 70% ethanol, dehydrated and embedded in paraffin. The sections were prepared and stained with hematoxylin and eosin. The ovaries were longitudinally and serially sectioned into 5 μm sections (CM1850; Leica); all of the sections were mounted onto a glass slide and observed by histomorphological examination under a light microscope (NIS-Elements 3.2, Nikon Eclipse 80i; Nikon). The numbers of corpora lutea and cystic follicles were counted. The results were confirmed by a pathologist.
Immunohistochemistry was performed using an anti-UCP1 antibody (1:100; ab10983; Abcam). After washing with PBS, the sections were incubated with the secondary antibody (PV-6001; Zhongshan) for 30min at room temperature. 3,3’-Diaminobenzidine was added to change the color by incubating for 2–5min, after which the slides were dehydrated with increasing ethanol concentrations and xylene, and then sealed.
Real-time quantitative PCR (qPCR) analysis.
Real-time qPCR analysis was performed using the SYBR Green PCR master mix (Invitrogen) using the ABI 7500 real-time PCR system (Applied Biosystems). The qPCR primers used in this study can be found in Supplementary Table 3. All qPCRs were carried out in a final volume of 20μl following the manufacturer’s instructions (Invitrogen). The amplification thermal cycling conditions were as follows: 95°C for 2min, 40 cycles at 95°C for 15s and 60°C for 40s.
Flow cytometry.
To analyze ILC3s, we used siLP with the following steps. Fresh small intestinal tissues were collected, and all of the Peyer’s patches were removed. The intestinal pieces were washed twice in PBS to remove the feces and mucus, and were then washed three times in Hanks’ balanced salt solution containing 5mM EDTA, 1mM DTT and 2% FBS for 20min at 37°C. After each step, samples were vortexed and the epithelial fraction was discarded. Afterwards, samples were washed with PBS. The remaining fragments were minced with scissors and digested with 0.1mgml−1 Liberase (05401020001; Roche) and 0.01% DNase I (DN25; Sigma–Aldrich) for 30min at 37°C. After filtering through a 70-μm cell strainer, the cells were mixed with equal amounts of 80% Percoll solution, and the solution was carefully layered onto an 80% Percoll solution. After centrifugation, lymphocytes in the interphase were carefully collected and washed with cold FACS buffer. The cells were stimulated with a cell activation cocktail (423301; BioLegend) for 6h at 37°C in a CO2 incubator to promote cytokine production. The cells were then stained for 30min at 4°C with anti-mouse-FITC-Gr1 (1:200; 108406; BioLegend), anti-mouse-FITC-CD3e (1:200; 100306; BioLegend), anti-mouse-FITC-CD11b (1:200; 101206; BioLegend), anti-mouse-FITC-CD45R (1:200; 103206; BioLegend) and anti-mouse-APC/Cy7-CD45 antibodies (1:500; 103116; BioLegend). The cells were permeabilized with the True-Nuclear Transcription Factor Buffer Set (424401; BioLegend), then stained with anti-mouse-Alexa Flour 647-IL-22 (1:200; 516406; BioLegend) and anti-mouse-PE-RORγT antibodies (1:200; 12-6981-82; eBioscience). The labeled cells were thoroughly washed with FACS buffer and analyzed on a FACS Aria II flow cytometer (Becton Dickinson). Data were analyzed using FlowJo software.
ILC3 isolation and culture.
As described above, after Percoll separation, the cells were carefully collected and washed with cold FACS buffer and then stained for 30min at 4°C with anti-mouse-FITC-Gr1, anti-mouse-FITC-CD3e, anti-mouse-FITC-CD11b, anti-mouse-FITC-CD45R, anti-mouse-APC/Cy7-CD45, anti-mouse-PE-KLRG1 (1:500; 138408; BioLegend) and anti-mouse-APC-CD90 (1:500; 105312; BioLegend) antibodies. Lineage−CD45+KLRG1−CD90++ cells (ILC3) were sorted to ~97% purity using a FACS Aria II flow cytometer. ‘Lineage’ refers to the following antigens: Gr1, CD3e, CD11b and CD45R. A total of 10,000 cells per well were cultured in 96-well plates for 12h at 37°C in U-bottom plates (in RPMI-1640 medium). The reagent concentrations used for the treatment were as follows: 40ngml−1 mouse recombinant IL-23 (1887-ML; R&D Systems), 100μM GDCA (G9100; Sigma–Aldrich), 100μM TUDCA (T0266; Sigma–Aldrich), 10μM triamterene (PHR1722; Sigma–Aldrich) or the same dose of dimethyl sulfoxide (DMSO; D2650; Sigma–Aldrich). After 72h, the supernatants were collected for IL-22 detection, and the cells were collected for mRNA extraction.
Statistics.
GraphPad Prism version 7.0 (GraphPad Software) and SPSS version 23.0 were used for statistical analysis. The sample sizes were determined by power analysis using StatMate version 2.0 (GraphPad Software). No data were excluded from the data analysis. The sample distribution was determined by the Kolmogorov–Smirnov normality test. One-way analysis of variance (ANOVA) followed by Tukey’s post-hoc test was used to evaluate the statistical significance of differences among three or more groups. A two-tailed Student’s t-test was used to evaluate statistical significance between two groups. Two-tailed paired-samples t-tests were applied to analyze the paired groups. For the nonparametric tests, the two-tailed Mann–Whitney U-test was used to evaluate statistical significance between two groups. Two-tailed Wilcoxon matched-pairs signed rank tests were applied to analyze the paired groups. The Kruskal–Wallis test was used to analyze differences among three or more experimental groups, followed by Dunn’s post-hoc analysis. Data are shown as means±s.e.m. or as medians with interquartile ranges. P<0.05 was considered statistically significant. Correlation analysis of the gut microbiome and host metabolome were investigated by nonparametric Spearman’s test.
Reporting Summary.
Further information on research design is available in the Nature Research Reporting Summary linked to this article.
Extended Data
Extended Data Fig. 1 |. Gut microbial alterations in women with PCOS.
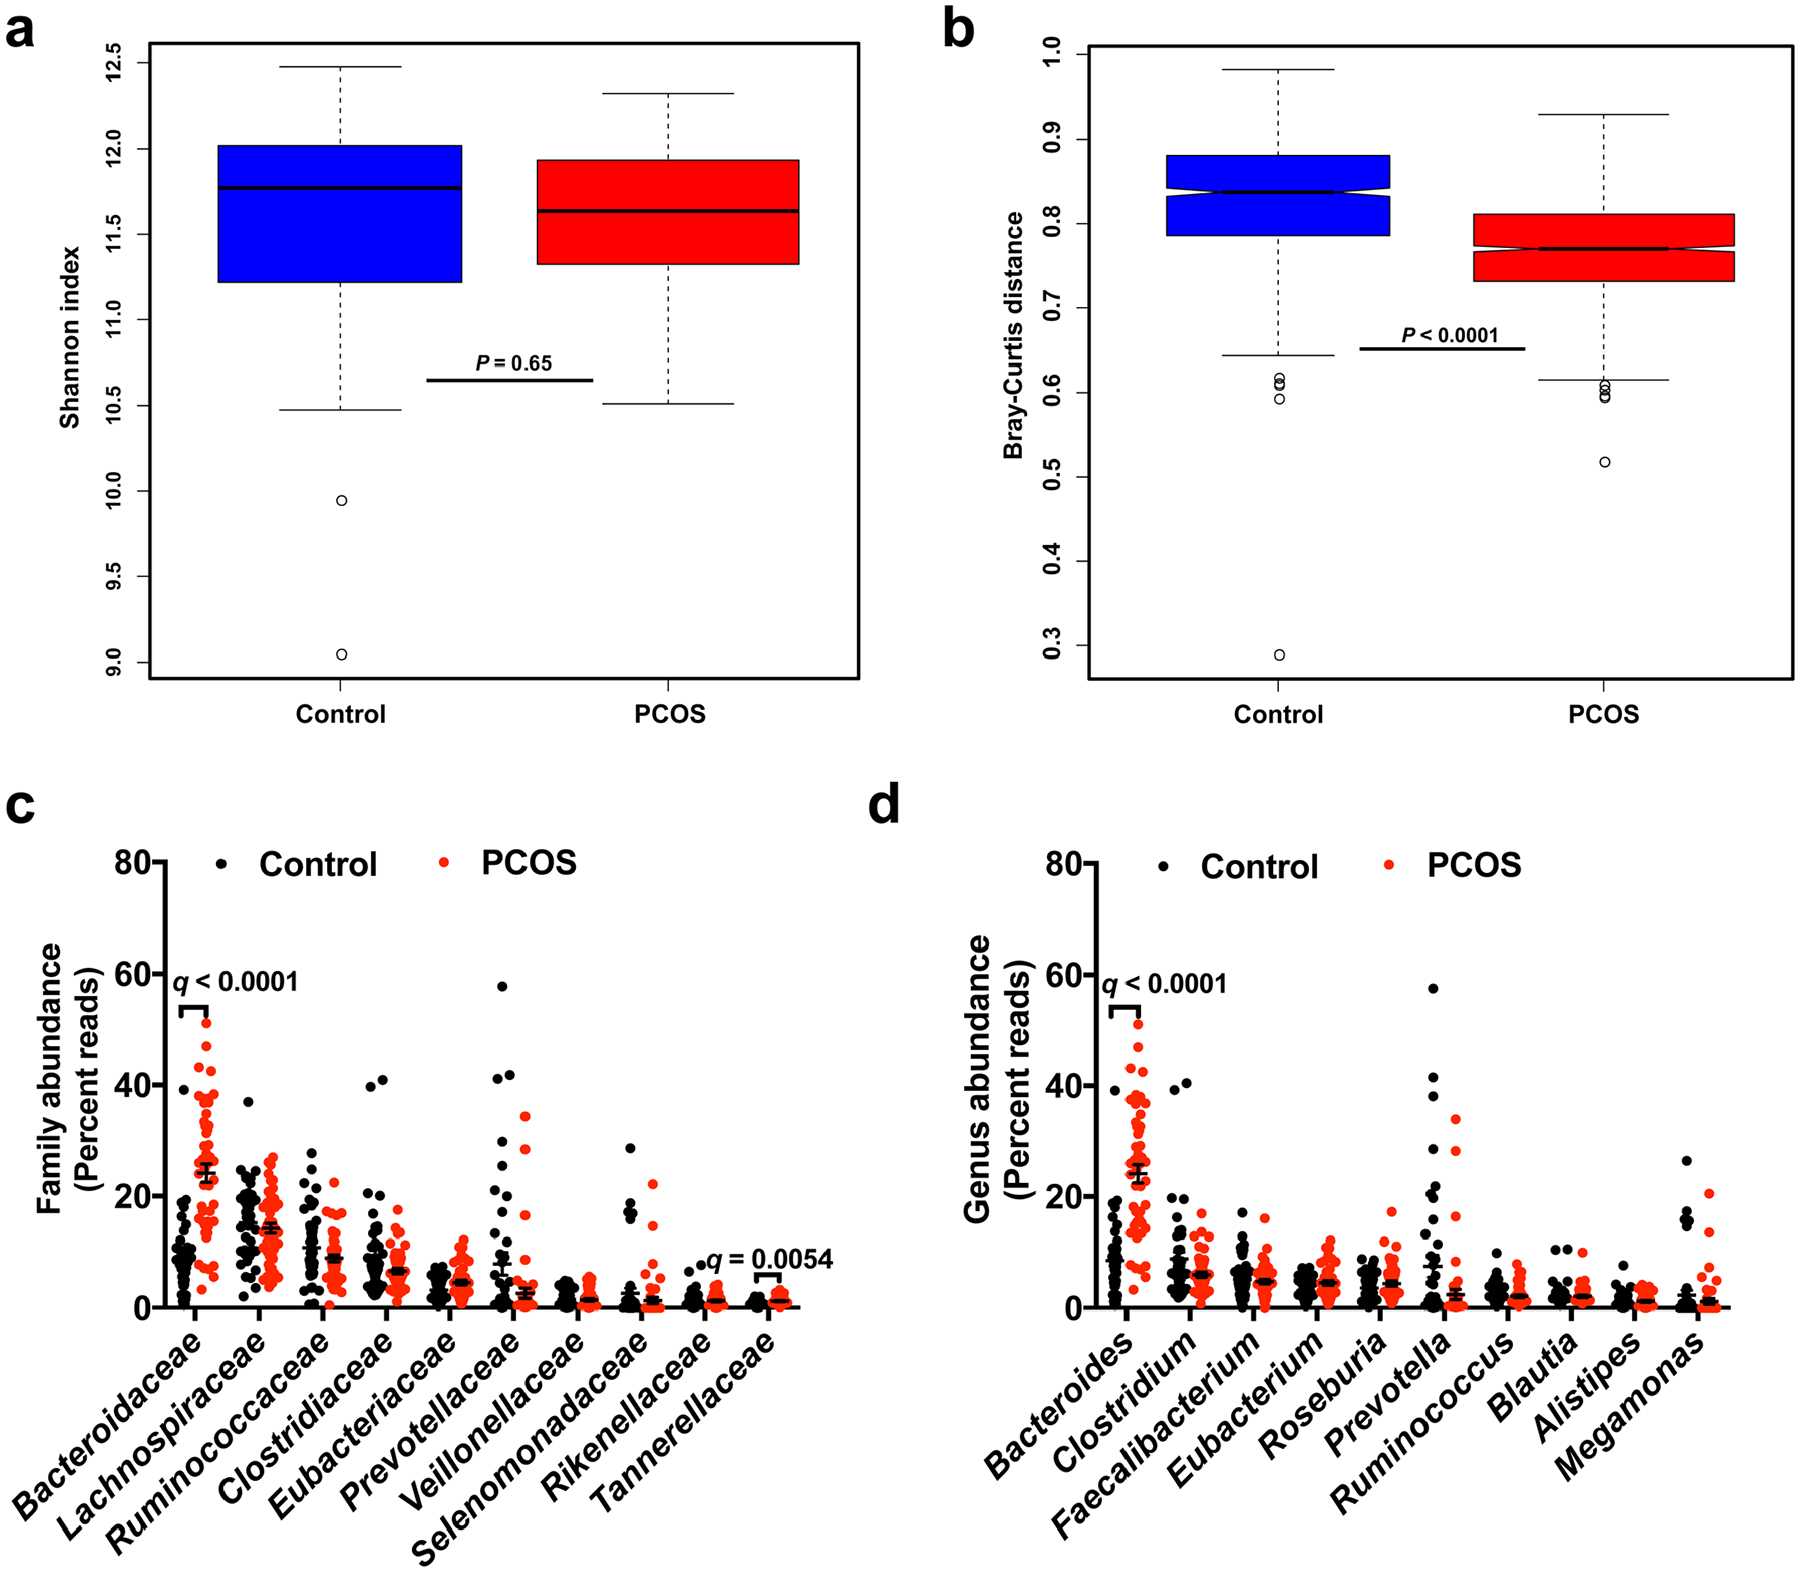
a,b, Alpha diversity (Shannon index) (a) and beta diversity (Bray–Curtis distance) (b) of the control and PCOS groups at the gene level. For box plots, the midline represents the median, the box represents the interquartile range (IQR) between the first and third quartiles, and whiskers represent the lowest or highest values within 1.5× the IQR from the first or third quartiles. Statistical significance was determined by two-tailed Mann–Whitney U-test. c,d, Top ten bacterial family (c) and bacterial genus (d) abundances in PCOS and control subjects. The q value represents the FDR-adjusted P value. The P value was determined by two-tailed Wilcoxon rank-sum test. In c, for Bacteroidaceae, q = 2.53 × 10⁻⁸. In d, for Bacteroides, q = 5.55 × 10⁻⁸. Data are presented as means ± s.e.m. Control: n = 43; PCOS: n = 50.
Extended Data Fig. 2 |. Insulin, hormone, bile acid and IL-22 levels of mice transplanted with PCOS gut microbiota or B. vulgatus.
a, Timeline for the recipient mice transplanted with PCOS or control fecal microbiota. b, Area under the curve (AUC) of GTT (n = 6 mice per group; t10 = −3.032). c, AUC of ITT (n = 6 mice per group; t10 = −2.498). d, Fasting glucose levels (n = 6 mice per group). e, Insulin levels (n = 6 mice per group; t10 = 0.134). f, HOMA-IR (n = 6 mice per group; t10 = −2.669). g, Number of cystic follicles (n = 6 mice per group; t10 = −5.966). h, Number of CLs (n = 6 mice per group; t10 = 7.720; P = 0.000016). i, Levels of testosterone (T) (n = 6 mice per group; t10 = −2.335). j, Levels of luteinizing hormone (n = 6 mice per group; t10 = −5.675). k, Levels of estradiol for the trans-PCOS and trans-control mice (n = 6 mice per group; t10 = 1.322). l, AUC of GTT (n = 8 mice per group; F2,21 = 12.095). m, AUC of ITT (n = 8 mice per group; F2,21 = 5.609). n, Fasting glucose levels (n = 8 mice per group; F2,21 = 6.190). o, Insulin levels (n = 8 mice per group; F2,21 = 4.254). p, HOMA-IR (n = 8 mice per group; F2,21 = 13.559). q, Number of cystic follicles (n = 8 mice per group; F2,21 = 91.000; control versus B. vulgatus, P = 3.17 × 10⁻⁹; control versus DHEA, P = 1.74 × 10⁻¹¹). r, Number of CLs (n = 8 mice per group). s, Levels of T (n = 8 mice per group; control versus DHEA, P = 0.000007). t, Levels of luteinizing hormone (n = 8 mice per group). u, Levels of estradiol for the mice in the control, B. vulgatus gavage or DHEA injection groups (n = 8 mice per group; F2,21 = 18.890; control versus DHEA, P = 0.000039). v, Levels of intestine bile acids (n = 6 mice per group). w, Il22 mRNA expression levels in the intestines, as measured by qPCR (n = 6 mice per group). x, IL-22 levels in the serum of mice transplanted with PCOS or control individual’s fecal microbiota (n = 6 mice per group; t10 = 7.518; P = 0.00002). For d, v and w, P values were determined by two-tailed Mann–Whitney U-test and the data are presented as medians with interquartile ranges. For b, c, e–k and x, P values were determined by two-tailed Student’s t-test and the data are presented as means ± s.e.m. For l–q and u, P values were determined by one-way ANOVA with Tukey’s multiple comparison post-hoc test and data are presented as means ± s.e.m. For r, s and t, P values were determined by Kruskal–Wallis test followed by Dunn’s post-hoc test and data are presented as medians with interquartile ranges.
Extended Data Fig. 3 |. Improvement of insulin resistance and ovarian dysfunction by administration of IL-22 or bile acid in PCOS mice.
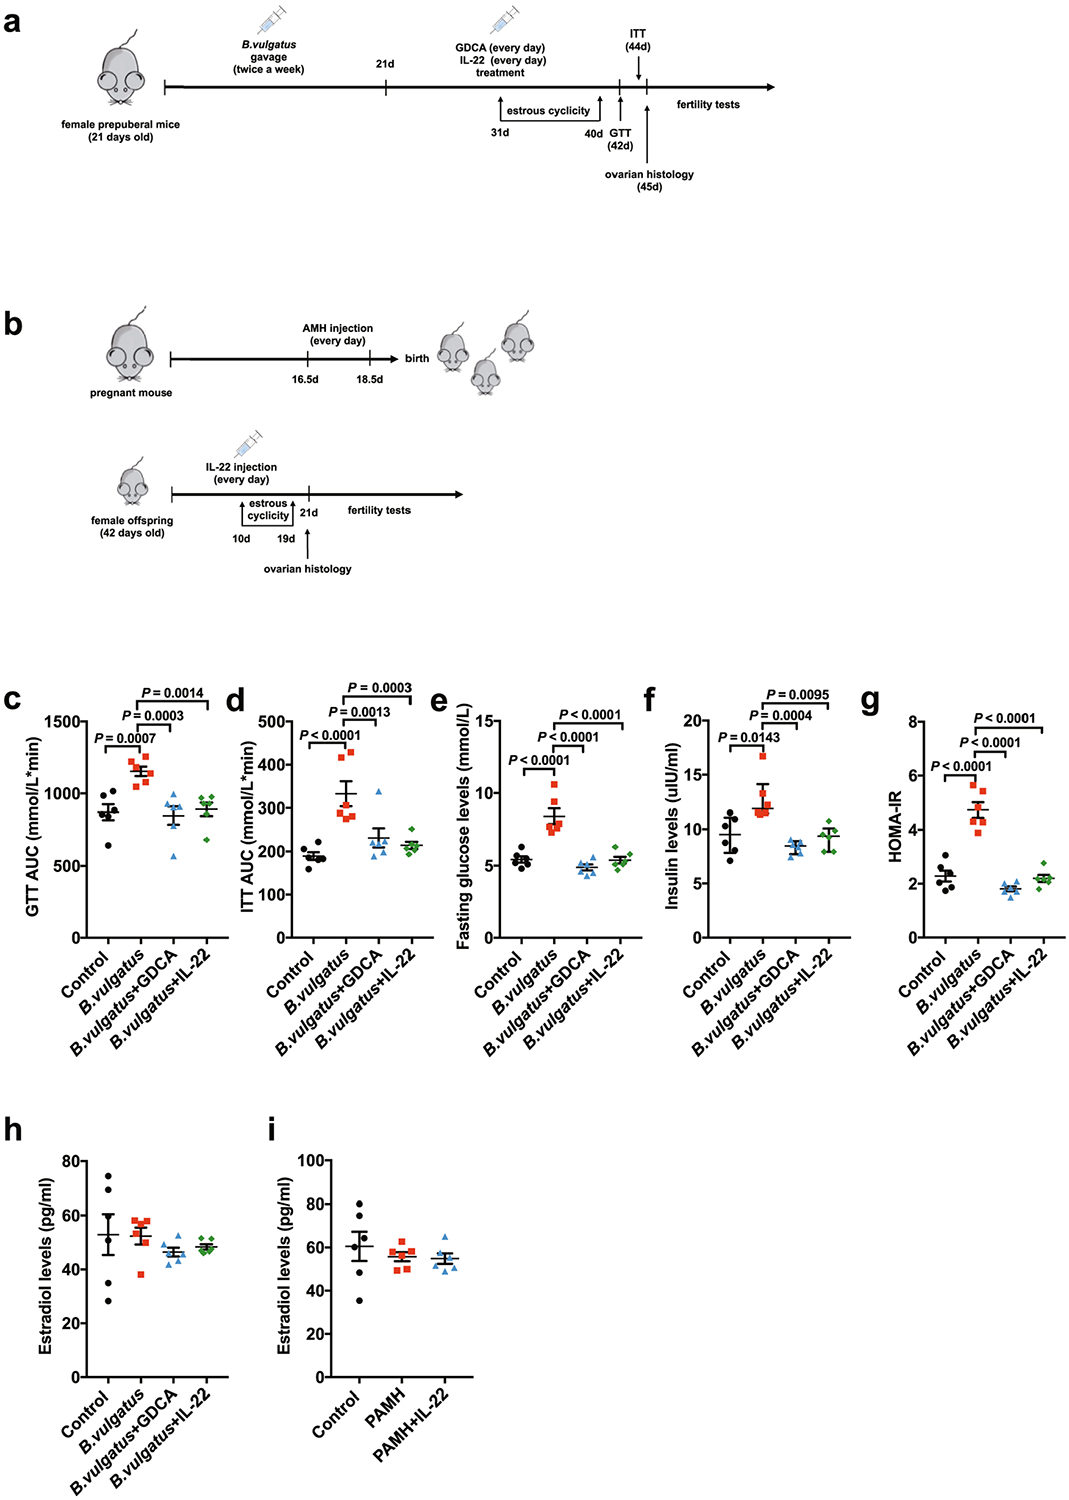
a, Timeline for the mice subjected to IL-22 or GDCA administration after gavage with B. vulgatus. b, Timeline for the PAMH administration PCOS-like mouse model. c, AUC of GTT (n = 6 mice per group; F3,20 = 8.170). d, AUC of ITT (n = 6 mice per group; F3,20 = 10.798; control versus B. vulgatus, P = 0.000035). e, Fasting glucose levels (n = 6 mice per group; F3,20 = 24.524; control versus B. vulgatus, P = 0.000003; B. vulgatus versus B. vulgatus + GDCA, P = 2.18 × 10⁻⁷; B. vulgatus versus B. vulgatus + IL-22, P = 0.000002). f, Insulin levels (n = 6 mice per group). g, HOMA-IR (n = 6 mice per group; F3,20 = 48.560; control versus B. vulgatus, P = 1.66 × 10⁻⁸; B. vulgatus versus B. vulgatus + GDCA, P = 8.55 × 10⁻¹⁰; B. vulgatus versus B. vulgatus + IL-22, P = 9.47 × 10⁻⁹). h, Levels of estradiol for the mice in the control, B. vulgatus, B. vulgatus + GDCA and B. vulgatus + IL-22 groups (n = 6 mice per group; F3,20 = 0.553). i, Levels of estradiol for the mice in the control, PAMH and PAMH + IL-22 groups (n = 6 mice per group; F2,15 = 0.498). For c–e and g–i, P values were determined by one-way ANOVA with Tukey’s multiple comparison post-hoc test and data are presented as means ± s.e.m. For f, the P values were determined by Kruskal–Wallis test followed by Dunn’s post-hoc test and data are presented as medians with interquartile ranges.
Extended Data Fig. 4 |. Administration of IL-22 prevented insulin resistance and ovarian dysfunction in B. vulgatus-treated mice.
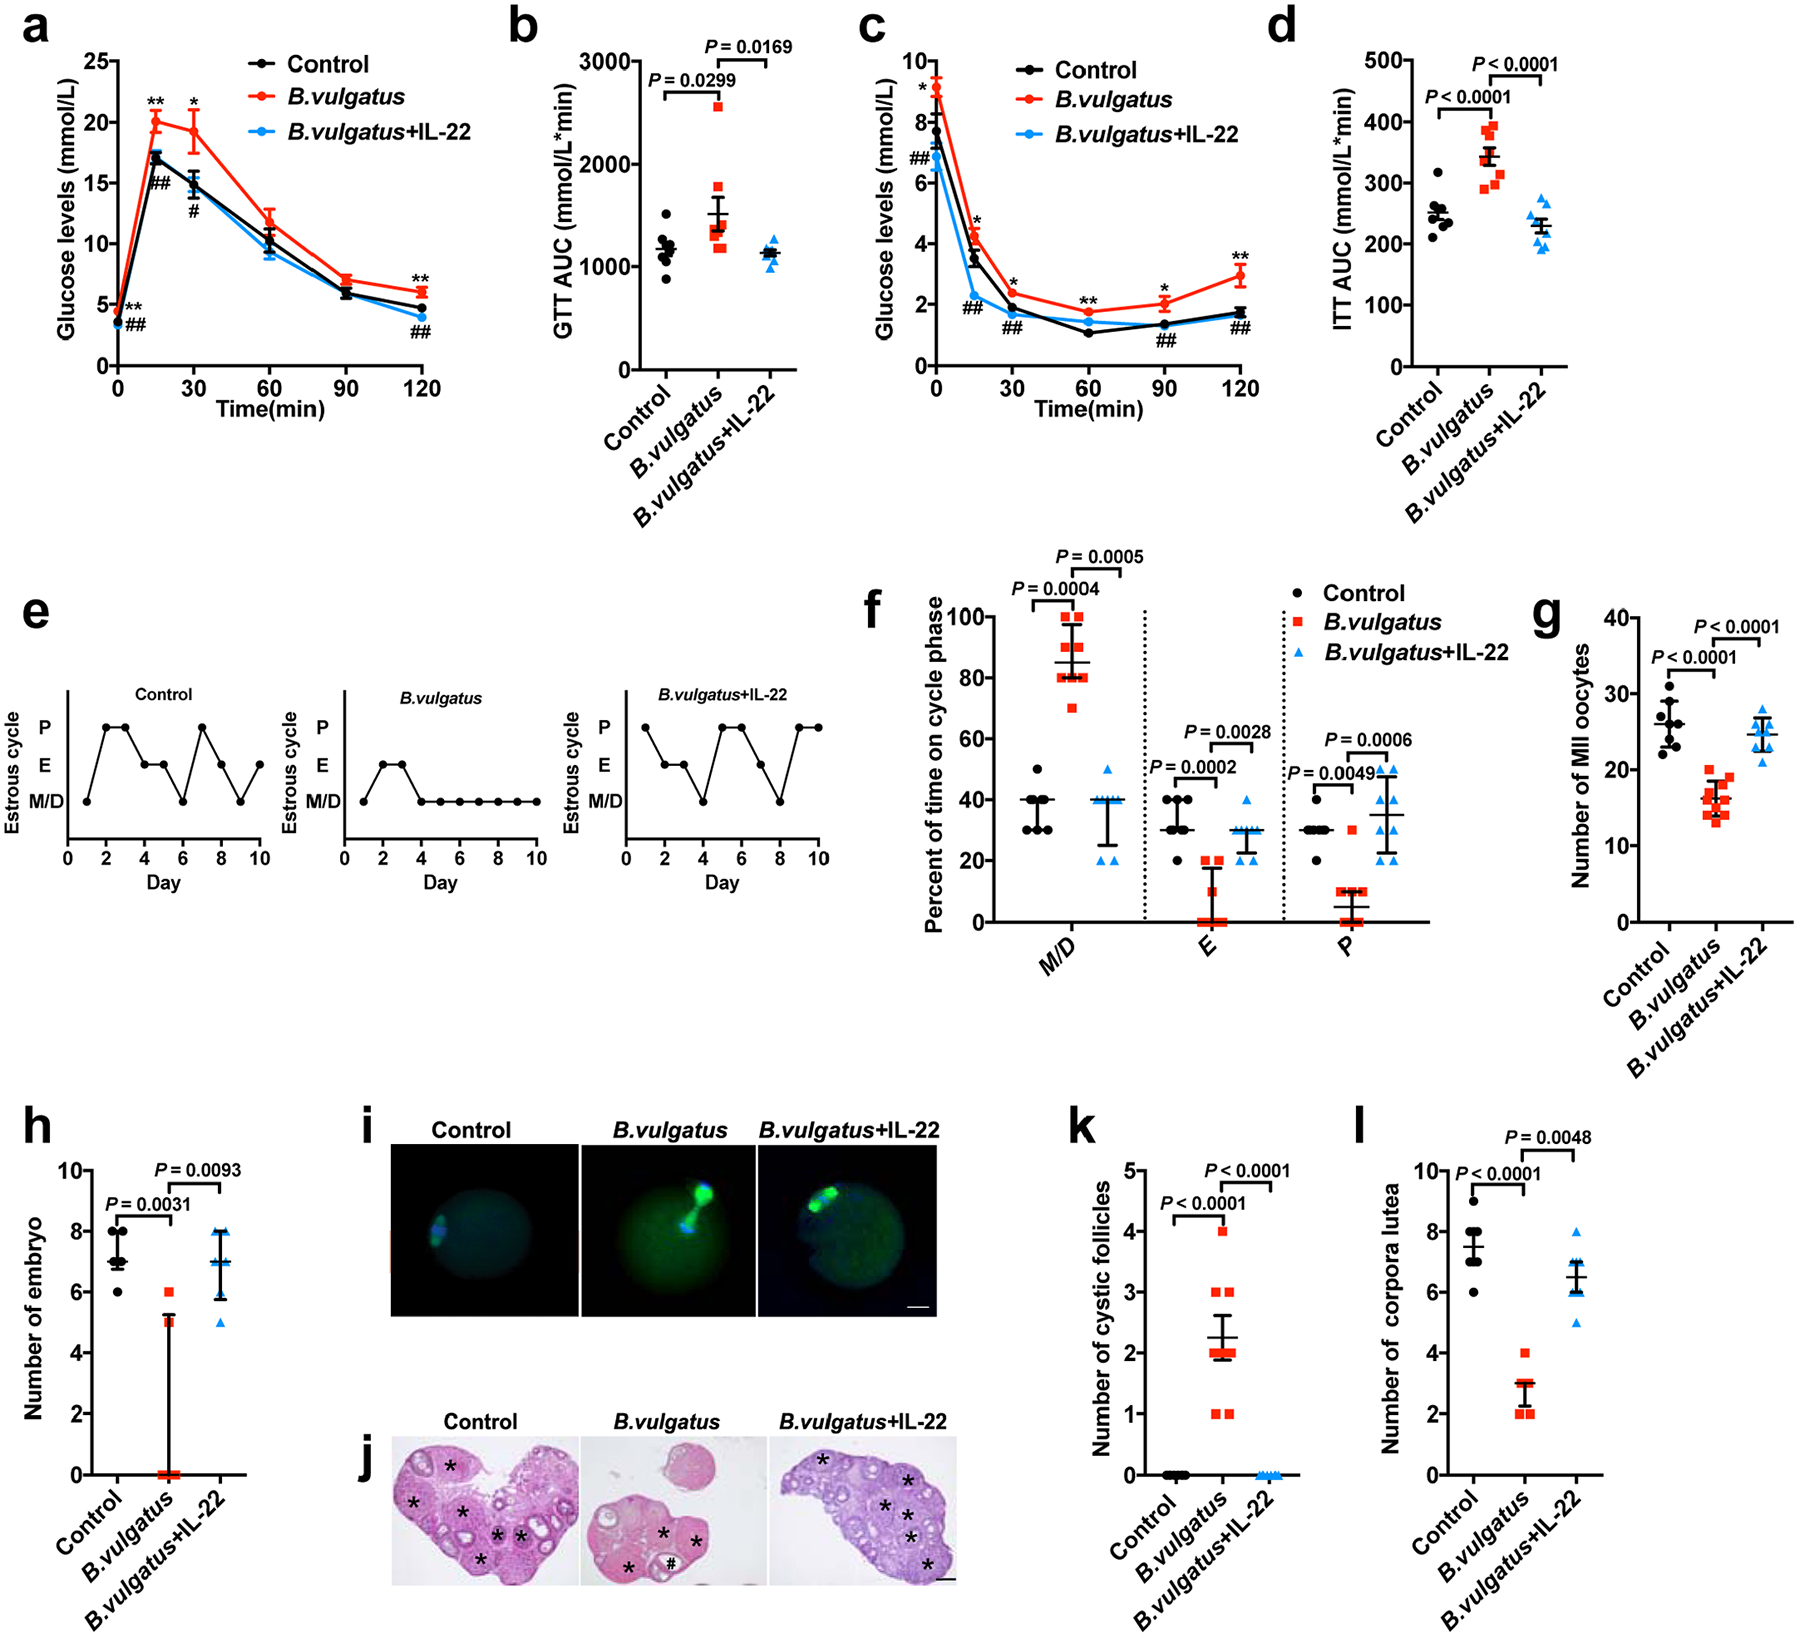
The mice were divided into three groups (control, B. vulgatus and B. vulgatus + IL-22). The animals were gavaged with B. vulgatus or heat-killed B. vulgatus as a control for 3 weeks. At the same time, the mice received IL-22 at a dose of 100 μg kg−1 d−1, intraperitoneally for the B. vulgatus + IL-22 group, or PBS as a parallel control for a–l. a, GTT (n = 8 mice per group). b, AUC of GTT (n = 8 mice per group; F2,21 = 4.076). c, ITT (n = 8 mice per group). d, AUC of ITT (n = 8 mice per group; F2,21 = 23.560; control versus B. vulgatus, P = 0.000036; B. vulgatus versus B. vulgatus + IL-22, P = 0.000002). e, Representative estrous cycles. f, Quantitative analysis of estrous cycles (n = 8 mice per group). g, Number of MII oocytes (n = 8 mice for the control and B. vulgatus + IL-22; n = 10 mice for B. vulgatus; F2,23 = 40.993; control versus B. vulgatus, P = 2.71 × 10⁻⁸; B. vulgatus versus B. vulgatus + IL-22, P = 3.40 × 10⁻⁷). h, Number of embryos (n = 6 mice per group). i, Immunofluorescence staining for tubulin (green) and DNA (blue) in MII oocytes (MII oocyte number = 150; n = 8 mice for the control and B. vulgatus + IL-22; n = 10 mice for B. vulgatus). Scale bars: 20 μm. Images are representative of two independent experiments with similar results. j, H&E staining of representative ovaries. Scale bars: 200 μm. Images are representative of three independent experiments with similar results. k, Quantitative analysis of cystic follicles (n = 8 mice per group; F2,21 = 37.800; control versus B. vulgatus, P = 2.14 × 10⁻⁷; B. vulgatus versus B. vulgatus + IL-22, P = 2.14 × 10⁻⁷). l, Quantitative analysis of CLs (n = 8 mice per group; control versus B. vulgatus, P = 0.000045). For a–d, g and k, P values were determined by one-way ANOVA with Tukey’s multiple comparison post-hoc test and data are presented as means ± s.e.m. For f, h and l, P values were determined by the Kruskal–Wallis test followed by Dunn’s post-hoc test and data are presented as medians with interquartile ranges. *P < 0.05; **P < 0.01 versus the control. #P < 0.05; ##P < 0.01 versus B. vulgatus.
Extended Data Fig. 5 |. Role and mechanisms of bile acid in improving insulin sensitivity and ovarian function.
a, Percentage of IL-22+ cells in CD45+ lineage− RORγT+ ILC3s from siLP of mice with or without TUDCA treatment (n = 4 mice per group; t6 = −5.767). b, mRNA expression of Il22 in the intestines (n = 6 mice per group; t10 = −4.175). c, Serum IL-22 levels of the DHEA or DHEA + GDCA mice (n = 6 mice per group; t10 = −6.067). The mice were divided into three groups (control, GDCA and Il22r−/− + GDCA) for d–i. For the control, wild-type mice were injected daily with DHEA subcutaneously. For GDCA, wild-type mice were injected daily with DHEA subcutaneously and gavaged with 30 mg kg−1 d−1 GDCA. For Il22r−/− + GDCA, Il22r−/− mice were injected daily with DHEA and gavaged with GDCA. d, GTT (n = 6 mice per group). e, AUC of GTT (n = 6 mice per group; F2,15 = 6.293). f, ITT (n = 6 mice per group). g, AUC of ITT (n = 6 mice per group; F2,15 = 14.899). h, Representative estrous cycles for mice from the three groups. i, Quantitative analysis of estrous cycles for the mice from the control, GDCA and Il22r−/− + GDCA groups (n = 6 mice per group). j, IL-22 levels in the cell culture supernatant (n = 4 mice per group; F3,12 = 49.221; DMSO versus GDCA, P = 0.000002; GDCA versus triamterene + GDCA, P = 3.60 × 10⁻⁷). k, Il22 mRNA expression levels (n = 4 mice per group; F3,12 = 17.708; GDCA versus triamterene + GDCA, P = 0.000047). l, Gata3 mRNA expression levels in ILC3s with or without GDCA or triamterene treatment in vitro (n = 4 mice per group; F3,12 = 24.044; GDCA versus triamterene + GDCA, P = 0.000012). m, cAMP levels in the intestines of mice treated with DHEA or B. vulgatus (n = 8 mice per group; F2,21 = 29.246; control versus B. vulgatus, P = 3.52 × 10⁻⁷; control versus DHEA, P = 0.000013). n, Representative flow cytometry plots of IL-22+ cells in CD45+ lineage− RORγT+ ILC3s from siLP. Three independent experiments were performed with similar results. o, Percentage of IL-22+ cells in CD45+ lineage− RORγT+ ILC3s from siLP of the mice (n = 4 mice per group; F2,9 = 23.175). For a–c, P values were determined by two-tailed Student’s t-test and data are presented as means ± s.e.m. For d–g, j–m and o, P values were determined by one-way ANOVA with Tukey’s multiple comparison post-hoc test and data are presented as means ± s.e.m. For i, P values were determined by Kruskal–Wallis test followed by Dunn’s post-hoc test and data are presented as medians with interquartile ranges.
Extended Data Fig. 6 |. Adipose tissue browning in PCOS-like mice with or without IL-22 or GDCA treatment.
a–c, Ucp1, Pgc1α, Cited1 and Cox8b mRNA expression levels in brown adipose tissue from: (a) trans-control and trans-PCOS mice (n = 6 mice per group; Ucp1: t10 = 4.789; Pgc1α: t10 = 4.427; Cited1: t10 = 3.846; Cox8b: t10 = 3.153); (b) control, B. vulgatus and DHEA mice (n = 8 mice per group; Ucp1: F2,21 = 14.107; Pgc1α: F2,21 = 8.638, Cited1: F2,21 = 2.612; Cox8b: F2,21 = 9.528); and (c) GDCA or IL-22 therapeutic administration in B. vulgatus-treated mice (control, B. vulgatus, B. vulgatus + GDCA and B. vulgatus + IL-22 mice) (n = 6 mice per group; Ucp1: F3,20 = 19.769, B. vulgatus versus B. vulgatus + IL-22, P = 3.41 × 10⁻⁷; Pgc1α: F3,20 = 53.487; control versus B. vulgatus, P = 8.83 × 10⁻⁸; B. vulgatus versus B. vulgatus + IL-22, P = 2.39 × 10⁻¹⁰; Cited1: F3,20 = 5.853; Cox8b: F3,20 = 9.242). d,e, Ucp1, Pgc1α, Cited1, Cox8b, Nr2f6 and Prdm16 mRNA expression levels in the subcutaneous fat (d; n = 8 mice per group), and Ucp1, Pgc1α, Cited1 and Cox8b mRNA expression levels in brown adipose tissue (e) after IL-22 preventive administration in B. vulgatus-treated mice (control, B. vulgatus and B. vulgatus + IL-22). For a–e, all of the mice were placed at 4 °C for 12 h before killing. For a, P values were determined by two-tailed Student’s t-test and data are presented as means ± s.e.m. For b and c, P values were determined by one-way ANOVA with Tukey’s multiple comparison post-hoc test and data are presented as means ± s.e.m. For d and e, P values were determined by Kruskal–Wallis test followed by Dunn’s post-hoc test and data are presented as medians with interquartile ranges.
Supplementary Material
Acknowledgements
This work was supported by the National Key Research and Development Program of China (2018YFC1003200 and 2018YFC1003900 to Y.P.), National Natural Science Foundation of China (91857115 to C.J.; 81521002 and 81730038 to J.Q.; and 81771650 to R.L.), Clinical Medicine Plus X—Young Scholars Project of Peking University (PKU2019LCXQ025 and PKU2018LCXQ013 to Y.P. and C.J.) and the National Key Research and Development Program of China (2016YFC1000201 to R.L.).
Footnotes
Data availability
Data relating to the metagenomic sequencing that support the findings of this study have been uploaded to the Sequence Read Archive database (https://trace.ncbi.nlm.nih.gov/Traces/home/) and are available for download via accession number PRJNA530971.
Online content
Any methods, additional references, Nature Research reporting summaries, source data, statements of code and data availability and associated accession codes are available at https://doi.org/10.1038/s41591-019-0509-0.
Competing interests
The authors declare no competing interests.
Extended data is available for this paper at https://doi.org/10.1038/s41591-019-0509-0.
Supplementary information is available for this paper at https://doi.org/10.1038/s41591-019-0509-0.
Peer Review Information: Randy Levinson and Joao Monteiro were the primary editors on this article and managed its editorial process and peer review in collaboration with the rest of the editorial team.
References
- 1.Norman RJ, Dewailly D, Legro RS & Hickey TE Polycystic ovary syndrome. Lancet 370, 685–697 (2007). [DOI] [PubMed] [Google Scholar]
- 2.Dumesic DA et al. Scientific statement on the diagnostic criteria, epidemiology, pathophysiology, and molecular genetics of polycystic ovary syndrome. Endocr. Rev 36, 487–525 (2015). [DOI] [PMC free article] [PubMed] [Google Scholar]
- 3.Sonnenburg JL & Backhed F Diet–microbiota interactions as moderators of human metabolism. Nature 535, 56–64 (2016). [DOI] [PMC free article] [PubMed] [Google Scholar]
- 4.Turnbaugh PJ, Backhed F, Fulton L & Gordon JI Diet-induced obesity is linked to marked but reversible alterations in the mouse distal gut microbiome. Cell Host Microbe 3, 213–223 (2008). [DOI] [PMC free article] [PubMed] [Google Scholar]
- 5.Lindheim L et al. Alterations in gut microbiome composition and barrier function are associated with reproductive and metabolic defects in women with polycystic ovary syndrome (PCOS): a pilot study. PLoS ONE 12, e0168390 (2017). [DOI] [PMC free article] [PubMed] [Google Scholar]
- 6.Liu R et al. Dysbiosis of gut microbiota associated with clinical parameters in polycystic ovary syndrome. Front. Microbiol 8, 324 (2017). [DOI] [PMC free article] [PubMed] [Google Scholar]
- 7.Torres PJ et al. Gut microbial diversity in women with polycystic ovary syndrome correlates with hyperandrogenism. J. Clin. Endocrinol. Metab 103, 1502–1511 (2018). [DOI] [PMC free article] [PubMed] [Google Scholar]
- 8.Martin FP et al. A top-down systems biology view of microbiome–mammalian metabolic interactions in a mouse model. Mol. Syst. Biol 3, 112 (2007). [DOI] [PMC free article] [PubMed] [Google Scholar]
- 9.Claus SP et al. Systemic multicompartmental effects of the gut microbiome on mouse metabolic phenotypes. Mol. Syst. Biol 4, 219 (2008). [DOI] [PMC free article] [PubMed] [Google Scholar]
- 10.Shindo K, Machida M, Fukumura M, Koide K & Yamazaki R Omeprazole induces altered bile acid metabolism. Gut 42, 266–271 (1998). [DOI] [PMC free article] [PubMed] [Google Scholar]
- 11.Van Houten EL & Visser JA Mouse models to study polycystic ovary syndrome: a possible link between metabolism and ovarian function? Reprod. Biol 14, 32–43 (2014). [DOI] [PubMed] [Google Scholar]
- 12.Hand TW, Vujkovic-Cvijin I, Ridaura VK & Belkaid Y Linking the microbiota, chronic disease, and the immune system. Trends Endocrinol. Metab 27, 831–843 (2016). [DOI] [PMC free article] [PubMed] [Google Scholar]
- 13.Tata B et al. Elevated prenatal anti-Mullerian hormone reprograms the fetus and induces polycystic ovary syndrome in adulthood. Nat. Med 24, 834–846 (2018). [DOI] [PMC free article] [PubMed] [Google Scholar]
- 14.Zhong C et al. Group 3 innate lymphoid cells continuously require the transcription factor GATA-3 after commitment. Nat. Immunol 17, 169–178 (2016). [DOI] [PMC free article] [PubMed] [Google Scholar]
- 15.Bouchard MF, Taniguchi H & Viger RS Protein kinase A-dependent synergism between GATA factors and the nuclear receptor, liver receptor homolog-1, regulates human aromatase (CYP19) PII promoter activity in breast cancer cells. Endocrinology 146, 4905–4916 (2005). [DOI] [PubMed] [Google Scholar]
- 16.Brestoff JR & Artis D Immune regulation of metabolic homeostasis in health and disease. Cell 161, 146–160 (2015). [DOI] [PMC free article] [PubMed] [Google Scholar]
- 17.Bartelt A & Heeren J Adipose tissue browning and metabolic health. Nat. Rev. Endocrinol 10, 24–36 (2014). [DOI] [PubMed] [Google Scholar]
- 18.Yuan X et al. Brown adipose tissue transplantation ameliorates polycystic ovary syndrome. Proc. Natl Acad. Sci. USA 113, 2708–2713 (2016). [DOI] [PMC free article] [PubMed] [Google Scholar]
- 19.Zhao Y et al. Up-regulated expression of WNT5a increases inflammation and oxidative stress via PI3K/AKT/NF-κB signaling in the granulosa cells of PCOS patients. J. Clin. Endocrinol. Metab 100, 201–211 (2015). [DOI] [PubMed] [Google Scholar]
- 20.Dudakov JA, Hanash AM & van den Brink MR Interleukin-22: immuno biology and pathology. Annu. Rev. Immunol 33, 747–785 (2015). [DOI] [PMC free article] [PubMed] [Google Scholar]
- 21.Pedersen BK & Febbraio MA Muscle as an endocrine organ: focus on muscle-derived interleukin-6. Physiol. Rev 88, 1379–1406 (2008). [DOI] [PubMed] [Google Scholar]
- 22.Sag D, Carling D, Stout RD & Suttles J Adenosine 5′-monophosphate-activated protein kinase promotes macrophage polarization to an anti-inflammatory functional phenotype. J. Immunol 181, 8633–8641 (2008). [DOI] [PMC free article] [PubMed] [Google Scholar]
- 23.Pang Y et al. Intermedin restores hyperhomocysteinemia-induced macrophage polarization and improves insulin resistance in mice. J. Biol. Chem 291, 12336–12345 (2016). [DOI] [PMC free article] [PubMed] [Google Scholar]
- 24.Bankevich A et al. SPAdes: a new genome assembly algorithm and its applications to single-cell sequencing. J. Comput. Biol 19, 455–477 (2012). [DOI] [PMC free article] [PubMed] [Google Scholar]
- 25.Zhu W, Lomsadze A & Borodovsky M Ab initio gene identification in metagenomic sequences. Nucleic Acids Res. 38, e132 (2010). [DOI] [PMC free article] [PubMed] [Google Scholar]
- 26.Perez-Enciso M & Tenenhaus M Prediction of clinical outcome with microarray data: a partial least squares discriminant analysis (PLS-DA) approach. Hum. Genet 112, 581–592 (2003). [DOI] [PubMed] [Google Scholar]
Associated Data
This section collects any data citations, data availability statements, or supplementary materials included in this article.