Abstract
Objective
We investigated factors affecting the disability assessment Longshi scale, and differences between the Longshi and Barthel scales, as well as modified Rankin scale (mRS), to determine whether the Longshi scale is superior to the other scales.
Methods
This cross-sectional study included 721 participants with disability. We performed the t-test, analysis of variance, Pearson’s correlation test, and multiple linear regression to analyze group differences and define explanatory variables.
Results
The Longshi scale had a strong positive correlation with the Barthel scale (r = 0.868) but a weak negative correlation with the mRS (r = –0.185). Scores obtained among seven study hospitals in two provinces of southeast China were significantly different (F = 8.034). Social activities of participants with disability can be positively predicted using the Longshi (β = 0.251) and Barthel scales (β = 0.276). However, age has a weak negative correlation with the Longshi scale (r = –0.163).
Conclusion
Training did not cause significant variations in assessment using the Longshi scale. However, the results differed among different regions. The Longshi scale showed a strong correlation with the Barthel scale but a weak correlation with the mRS. Assessment time was shorter using the Longshi scale and the scale can be used to predict the social activities of individuals with disability.
Keywords: Multicenter study, Longshi scale, disability assessment, Barthel scale, modified Rankin scale, predictor
Introduction
Aging societies have increased worldwide.1 Owing to increasing economic development in many countries, the health of local populations has greatly improved, thereby prolonging the life span and increasing the proportion of older people in the population each year.2 However, rapidly aging populations can lead to many social challenges. For example, with an increased number of older people entering retirement, the labor force decreases and the burden of care for older people increases.3 Aging of the population is a great challenge to society in countries worldwide. Hence, it is of great importance to distinguish older people who do not have the ability to work or to care for themselves, to provide greater focus on the treatment and care of these people.4
At present, there are several methods used to define and distinguish non-disabled people from their disabled counterparts.5 One of these is the Barthel scale, which was first introduced in 1965.6 This scale is used to assess the ability to live at home by measuring the degree of independence after discharge from the hospital.7 Another approach to measuring disability is the modified Rankin scale (mRS), which was first introduced to assess disability in patients with stroke. The mRS is also applicable to other patients.8 In the early stage, it was found that activities of daily living (ADL) are positively correlated with the range of activities, and all daily life activities are completed within the scope of either bed, the home, or community. According to the results of a survey, representative indicators of daily life activities were selected as the content for the assessment, and these are presented in the form of images in the Barthel scale. We developed a method for assessing self-care ability in daily life using a scenario diagram (the Longshi scale),9 which was approved by the National Standards Commission of China in 2016 as an evaluation method of self-care ability with respect to ADL among disabled people (20162587-T-314). This scale allows rehabilitation professionals, people with disabilities, and their families to clearly understand a disabled person’s functional status and the effects of rehabilitation. Compared with the Barthel scale, the Longshi scale has good reliability and validity among the population of Shenzhen. 9 In the present work, we conducted a cross-sectional study of disabled patients at seven hospitals located in two provinces of southeastern China, to determine whether the Longshi scale was superior to the Barthel scale and mRS in disability assessment.
Methods
Study design and participants
The present cross-sectional survey was conducted from September 2018 to August 2019 in Guangxi and Fujian, China, and included seven hospitals. Surveyed participants included disabled people and professional and non-professional assessors. All participants were residents with local hukou. The specific inclusion and exclusion criteria are as follows:
People with disabilities: Inclusion criteria: 18 to 80 years old, and diagnosed with a disability by a medical professional (including visual disability, hearing disability, speech disability, physical disability, intellectual disability, mental disability and multiple disabilities). Exclusion criteria: severe cognitive impairment, communication problems, depression, and dementia.
Professional assessors: Inclusion criteria: 18 to 80 years old, and medical work experience of at least 1 year. Exclusion criteria: individuals with disabilities and cognitive impairments.
Non-professional assessors: Inclusion criteria: 18 to 80 years old, and a non-disabled and medical worker. Exclusion criteria: individuals with cognitive impairment.
Ethics
The present study was approved by the Ethics Committee of the Second People’s Hospital of Shenzhen. All participants voluntarily completed the questionnaire and provided their signed informed consent after the purpose and significance of the study had been explained to them.
Observation indicators
Disability assessment was performed using the Longshi scale, Barthel scale, and mRS. We compared differences in the assessment results among these three methods and explored the potential factors affecting these results.
On the Longshi scale, the participants were categorized into three groups: the bed group, home group, and community group. For the bed group, the evaluation contents included bladder and bowel management, feeding, and entertainment. For the home group, the evaluation contents included toileting, self-cleaning, and house work. For the community group, the evaluation contents included community activities, shopping, and social participation. Each evaluation item was measured using a scale ranging from 1 to 3 points. On the Barthel scale, there are 10 basic ADL, which include bowels, bladder, grooming, toilet use, feeding, transfers, walking, dressing, climbing stairs, and bathing. These were initially measured using a scale ranging from 0 to 20, but this was subsequently modified to 0 to 10 points.10 Compared with the Barthel scale, the mRS only has six stages of disability (0–5, from no symptoms to completely disabled) and no detailed scales.11 Neither scale is 100% suitable for all older people.12
Statistical methods
Descriptive statistical methods were used to evaluate the basic characteristics of survey respondents. Disability assessment was conducted by both professionals and non-professionals. We performed the t-test, analysis of variance, Pearson correlation test, and multiple linear regression to analyze group differences and define the explanatory variables.
Results
Basic information of participants
This cross-sectional study included 721 participants with disability (Table 1).
Table 1.
Demographic information of 721 patients with physical disability.
| Characteristics | n (%) |
|---|---|
| Age, years | |
| ≤60 | 339 (46.0) |
| >60 | 382 (53.0) |
| Gender | |
| Male | 425 (59.0) |
| Female | 296 (41.1) |
| Nationality | |
| Han nationality | 656 (91.0) |
| Ethnic minorities | 65 (9.0) |
| Onset of stroke | |
| Once | 285 (81.4) |
| More than once | 65 (18.6) |
| Marital status | |
| Single | 65 (9.0) |
| Married | 625 (86.7) |
| Widowed/divorced | 31 (4.3) |
| Educational level | |
| Elementary | 280 (38.8) |
| High school | 310 (43.0) |
| University or above | 108 (15.0) |
| Others | 23 (3.2) |
| Retirement | |
| Yes | 557 (77.3) |
| No | 164 (22.8) |
| Occupation | |
| Farmer | 336 (46.6) |
| Worker | 122 (16.9) |
| Cadre | 88 (12.2) |
| Others | 175 (24.3) |
| Family income | |
| $7,000 | 391 (54.2) |
| $7,000–$15,000 | 201 (27.9) |
| $15,000–$20,000 | 62 (8.6) |
| >$20,000 | 67 (9.3) |
| Hypertension | |
| Yes | 351 (48.68) |
| No | 370 (51.3) |
| Diabetes mellitus | |
| Yes | 124 (17.2) |
| No | 597 (82.8) |
| Hyperlipidemia | |
| Yes | 70 (9.7) |
| No | 651 (90.3) |
| Coronary heart disease | |
| Yes | 84 (11.7) |
| No | 637 (88.4) |
| Kidney disease | |
| Yes | 25 (3.5) |
| No | 696 (96.5) |
Correlation among Longshi scale and Barthel scale and mRS
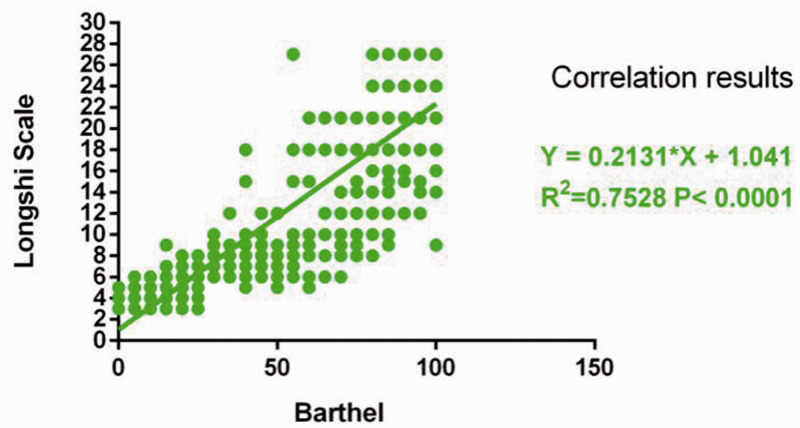
As shown in Figure 1, the Longshi scale had a strong positive correlation with the Barthel scale, with r = 0.868 (P < 0.01) However, the correlation between the Longshi scale and mRS was negative and weak, with r = −0.185, although P < 0.01 (Table 2).
Figure 1.
Comparison of evaluation time between Longshi and Barthel scales **P<0.01.
Table 2.
Correlation between Longshi scale and modified Rankin scale.
| Rankin scale | Longshi scale | Barthel scale | |
|---|---|---|---|
| Rankin | |||
| Pearson correlation | 1 | −.185* | −.244** |
| Significant (two-tailed) | .000 | .000 | |
| Number of cases | 555 | 555 | 528 |
| Longshi | |||
| Pearson correlation | −.185** | 1 | .868** |
| Significant (two-tailed) | .000 | .000 | |
| Number of cases | 555 | 721 | 690 |
| Barthel | |||
| Pearson correlation | −.244** | .868** | 1 |
| Significant (two-tailed) | .000 | .000 | |
| Number of cases | 528 | 690 | 690 |
**Significant at 0.01 level (two-tailed).
Assessments by professionals and non-professionals using the Longshi scale
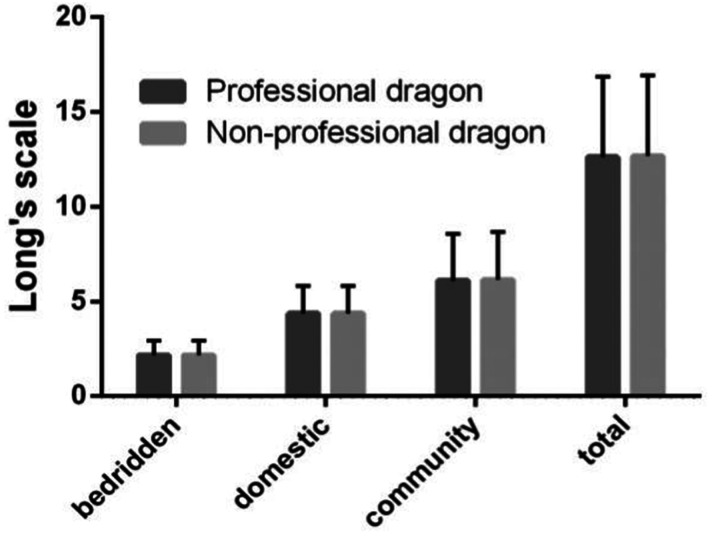
As shown in Figure 2 and Table 3, there were no significant differences in the results of assessment between professionals and non-professionals using the Longshi scale.
Figure 2.
Comparison of Longshi scale scores between professionals and non-professionals.
Table 3.
Scores for professionals and non-professionals in the bed, home, and community groups, using the Longshi scale, and Longshi total scores.
| Group | Mean | Standard deviation | t | |
|---|---|---|---|---|
| Bed | Professional | 2.16349 | .772107 | −.372 |
| Non-professional | 2.17166 | .757810 | ||
| Home | Professional | 4.36512 | 1.458978 | .000 |
| Non-professional | 4.36512 | 1.451468 | ||
| Community | Professional | 6.08992 | 2.472821 | −.727 |
| Non-professional | 6.13896 | 2.519819 | ||
| Total score | Professional | 12.61853 | 4.240255 | −.563 |
| Non-professional | 12.67575 | 4.252423 | ||
Comparison of assessment time between the Longshi and Barthel scales
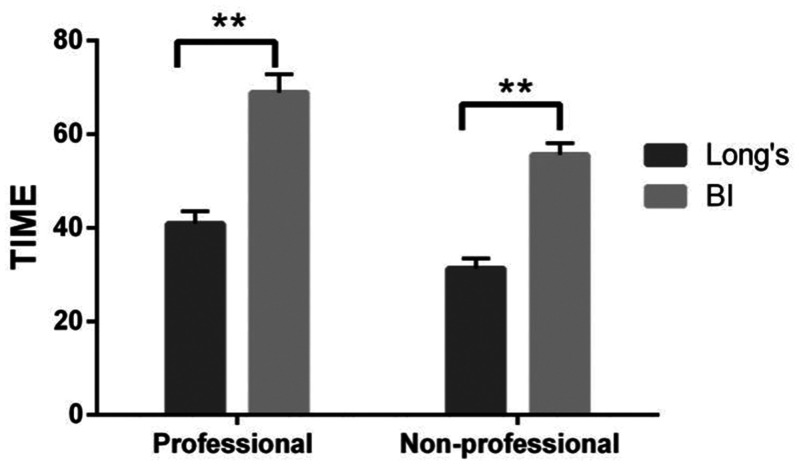
As shown in Figure 3, both professionals and non-professionals required less time to complete the assessment using the Longshi Scale than using the Barthel scale (P < 0.01).
Figure 3.
Comparison of assessment time between Longshi and Barthel scales **P < 0.01.
According to the difference test, there was a significant difference between these two methods (t = 8.107, P < 0.001). In the non-professional group, the Longshi scale was significantly less time-consuming than the Barthel scale. Therefore, regardless of whether the assessment was performed by a professional or non-professional, the Longshi scale required less time for assessment than the Barthel scale.
Results of scores obtained in different hospitals
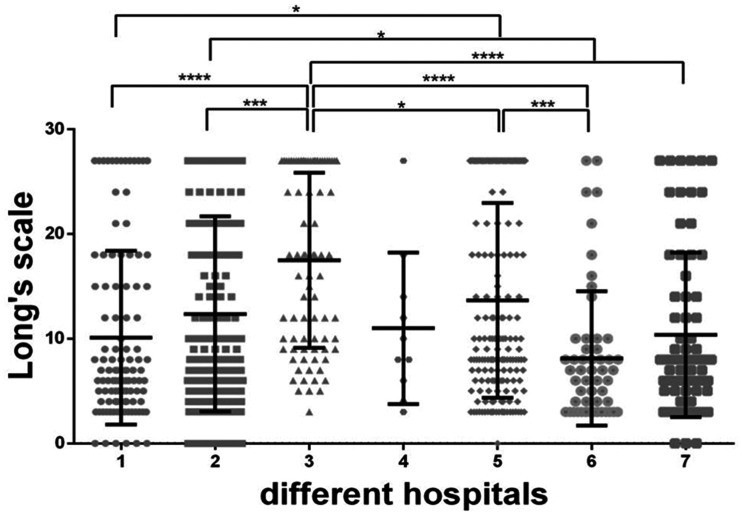
As shown in Figure 4, there were significant differences in the scores obtained among the seven participating hospitals in southeast China (F = 8.034, P < 0.01).
Figure 4.
Results of scores obtained in different hospitals *P < 0.05, **P < 0.01, ***P < 0.001, ****P < 0.0001.
Table 4 presents the scores in each hospital. The score in hospital #3 was the highest (17.49 ± 8.36) whereas the score in hospital #6 was the lowest (8.11 ± 6.42). However, scores in hospitals #1 (10.11 ± 8.30) and #7 (10.37 ± 7.86) were similar.
Table 4.
Scores obtained in different hospitals.
| Hospital | N | Mean | Standard deviation |
|---|---|---|---|
| 1 | 105 | 10.1143 | 8.30467 |
| 2 | 222 | 12.3694 | 9.3057 |
| 3 | 82 | 17.4878 | 8.35515 |
| 4 | 10 | 11 | 7.24185 |
| 5 | 174 | 13.6667 | 9.30059 |
| 6 | 54 | 8.1111 | 6.41539 |
| 7 | 71 | 10.3662 | 7.85992 |
Social activities of participants with disability can be positively predicted using Longshi scale scores
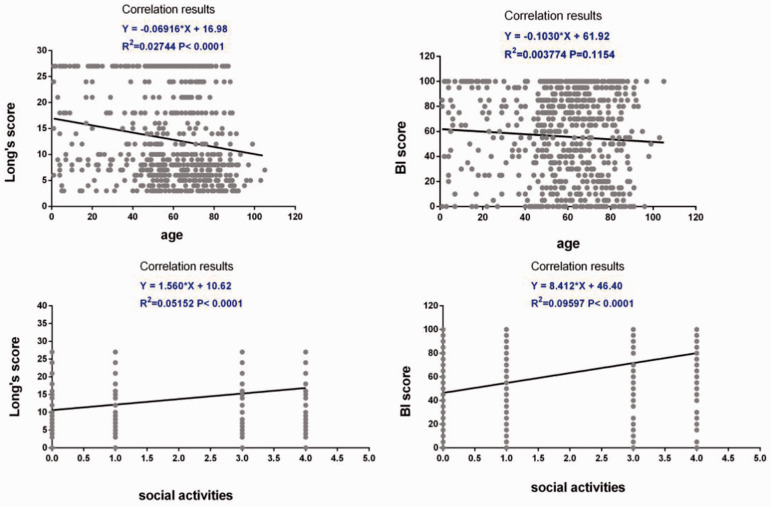
Table 5 shows the Longshi score ranges for different comorbidities or disabilities, which indicates its homogeneity. As shown in Figure 5 and Table 6, the social activities of participants with disability can be positively predicted using Longshi scale scores (β = 0.251, P = 0.001) and Barthel scale scores (β = 0.276, P < 0.01). However, age had a weak negative correlation with the Longshi scale (r = −0.163, P < 0.01).
Table 5.
Longshi score ranges for different comorbidities and disabilities (n).
| Area | Spinal cord injury | Cerebral hemorrhage | Cerebral infarction | Cerebral trauma | Parkinson's disease | Scoliosis | Fracture | Hand injury |
|---|---|---|---|---|---|---|---|---|
| Guangxi | 7.61 (31) | 8.87 (55) | 13.84 (167) | 9.5 (10) | 7 (2) | 22.64 (44) | 9.69 (13) | 26.25 (4) |
| Fujian | 8.88 (17) | 8.47 (53) | 9.62 (94) | 5.21 (14) | 17.32 (38) | 17.61 (18) | 16 (1) | 21 (4) |
| Average | 8.06 (48) | 8.68 (108) | 12.32 (261) | 7 (24) | 16.8 (40) | 21.18 (62) | 10.14 (14) | 23.63 (8) |
Figure 5.
Social activities of participants with disability can be positively predicted using Longshi scale scores.
Table 6.
Predictive factors of disability using the Longshi and Barthel scales.
| Model | Unnormalized coefficient |
Standardization coefficient |
|||
|---|---|---|---|---|---|
| B | Standard error | β | t | P-value | |
| (constant) | 19.769 | 8.328 | 2.374 | .019 | |
| Fall | −1.763 | 1.053 | −.123 | −1.674 | .096 |
| Assistive device | −2.758 | 6.540 | −.032 | −.422 | .674 |
| Life satisfaction | −.132 | .334 | −.030 | −.396 | .692 |
| Provincial hospital | .300 | .615 | .037 | .487 | .627 |
| Social activities for disabled people | 1.235 | .363 | .251 | 3.403 | .001 |
| Sex | .277 | 1.067 | .019 | .259 | .796 |
| Nationality | .081 | .130 | .046 | .626 | .532 |
| Age | −.068 | .021 | −.243 | −3.312 | .001 |
| Self-reported health status | −.658 | .489 | −.099 | −1.346 | .180 |
| Marriage status | −.501 | .744 | −.052 | −.672 | .502 |
| Education level | .504 | .549 | .067 | .917 | .360 |
Note: Dependent variable: Longshi scale.
| Model | Unnormalized coefficient |
Standardization coefficient |
t | Significance | ||
|---|---|---|---|---|---|---|
| B | Standard error | β | ||||
| 1 | (constant) | 130.503 | 40.372 | 3.233 | .001 | |
| Fall | −10.492 | 5.115 | −.151 | −2.051 | .042 | |
| Auxiliary | −49.024 | 31.531 | −.117 | −1.555 | .122 | |
| Satisfaction | .395 | 1.627 | .018 | .243 | .809 | |
| Visiting institution 1 | .035 | 3.002 | .001 | .012 | .991 | |
| Social activities for disabled people | 6.727 | 1.790 | .276 | 3.758 | .000 | |
| Sex | 1.531 | 5.175 | .022 | .296 | .768 | |
| Nationality | .396 | .628 | .046 | .632 | .529 | |
| Age | −.207 | .099 | −.152 | −2.079 | .039 | |
| Self-health | −4.086 | 2.371 | −.126 | −1.724 | .087 | |
| Marriage status | −6.934 | 3.596 | −.149 | −1.929 | .055 | |
| Education level | 4.734 | 2.667 | .129 | 1.775 | .078 | |
Note: Dependent variable: Barthel scale.
Discussion
The Longshi scale is used for assessing the self-care ability of older or disabled people. The scale is designed to allow rehabilitation professionals, disabled people, and their families to clearly understand the functional status and effects of rehabilitation among disabled people.9 The present work was a cross-sectional study including disabled patients and assessors in seven hospitals located in two provinces of southeastern China. Our findings can provide a basis for use of the Longshi scale in assessing disabled patients.
We first compared the results of assessment with the Longshi scale using two classical assessment methods, that is, the Barthel scale and mRS, both of which have been used in clinical settings for decades.13–16 The Longshi scale was strongly positively correlated with the Barthel scale, but its correlation with the mRS was negative and weak. This may be owing to the fact that both the Longshi and Barthel scales include detailed scales for each assessment item (rating scale 1–3 points for the Longshi scale and 0–10 points for the Barthel scale); the mRS merely only has six scales, representing the six stages of disability.17 Therefore, it can be concluded that the Longshi scale is more suitable than the mRS for disability assessment. However, further studies are needed to determine whether the Longshi scale is superior to the Barthel scale.
Next, we determined whether the Longshi scale is suitable for use by both professionals and non-professionals in assessing an individual’s disability. The results revealed that there was no significant difference between the assessments of professionals and non-professionals, indicating that the level of training does not cause significant variations in assessment using the Longshi scale. Hence, it can be concluded that the Longshi scale is applicable for a wide variety of people; this scale can be implemented in both hospital and communities settings and used by physicians and the patient’s family members.
We further investigated the time required to evaluate patients using the Longshi scale. The results indicated that both professionals and non-professionals required less time to complete the assessment using the Longshi scale than using the Barthel scale. In particular, among non-professionals, the Longshi scale was significantly less time-consuming when compared with the Barthel scale. This suggests that the Longshi scale is more convenient for non-professionals, which may be owing to its simpler description of patients’ symptoms and its smaller scales for each assessment item.
Despite these findings, the results differed among different regions as the scores among the seven participating hospitals differed from each other. This was partly owing to the differences among patients in these seven hospitals. Furthermore, this may be because the evaluation was performed using only a scale of 1 to 3 for each assessment item and not the 0 to 10 rating of the Barthel scale, which may result in wider variation among the seven hospitals.
We found that the social activities of individuals with disability could be positively predicted using Longshi scale scores whereas age had a weak negative correlation with the Longshi scale. Because there is no clear guidance regarding how to determine which people can be defined as having normal abilities and which are defined as disabled, our results suggest that among older people, the Longshi scale can more accurately identify disabled individuals and can better predict the social activities of these people.
The present study has several limitations. First, we could not determine why the results among the seven study hospitals differed. Second, the difference between the Longshi and Barthel scales was not explored in-depth; therefore, we could not determine which scale is superior. In future studies with larger sample sizes, it is hoped that these questions can be answered.
Conclusion
The Longshi rating scale is a popular, objective, simple, convenient, and rapid assessment tool. Rating scales represent a simple method for assessing functional ability with respect to ADLs without special training needed by assessors. The authors plan to develop corresponding rehabilitation measures and service procedures based on the Longshi rating scale and assessment method, and integrate this assessment into the overall process of rehabilitation services, providing an important basis for further standardization of rehabilitation services in China.
Declaration of conflicting interest
The authors declare that there is no conflict of interest.
Funding
This study was supported by the Shenzhen “Sanming project” (SZSM201610039) and science technology innovation and industrial development of Shenzhen Dapeng New District (Grand No. YL202001-14).
ORCID iD
Yulong Wang https://orcid.org/0000-0002-7270-9786
References
- 1.Dziechciaż M, Filip R. Biological psychological and social determinants of old age: bio-psycho-social aspects of human aging. Ann Agric Environ Med 2014; 21: 835–838. [DOI] [PubMed] [Google Scholar]
- 2.Lin YY, Huang CS. Aging in Taiwan: Building a Society for Active Aging and Aging in Place. Gerontologist 2016; 56: 176–183. [DOI] [PubMed] [Google Scholar]
- 3.Tahara Y. Cardiopulmonary Resuscitation in a Super-Aging Society - Is There an Age Limit for Cardiopulmonary Resuscitation? Circ J 2016; 80: 1102–1103. [DOI] [PubMed] [Google Scholar]
- 4.Wortley D, An JY, Heshmati A. Tackling the Challenge of the Aging Society: detecting and Preventing Cognitive and Physical Decline through Games and Consumer Technologies. Healthc Inform Res 2017; 23: 87–93. [DOI] [PMC free article] [PubMed] [Google Scholar]
- 5.Blum L, Korner-Bitensky N. Usefulness of the Berg Balance Scale in stroke rehabilitation: a systematic review. Phys Ther 2008; 88: 559–566. [DOI] [PubMed] [Google Scholar]
- 6.Quinn TJ, Langhorne P, Stott DJ. Barthel index for stroke trials: development, properties, and application. Stroke 2011; 42: 1146–1151. [DOI] [PubMed] [Google Scholar]
- 7.Huybrechts KF, Caro JJ. The Barthel Index and modified Rankin Scale as prognostic tools for long-term outcomes after stroke: a qualitative review of the literature. Curr Med Res Opin 2007; 23: 1627–1636. [DOI] [PubMed] [Google Scholar]
- 8.Broderick JP, Adeoye O, Elm J. Evolution of the Modified Rankin Scale and Its Use in Future Stroke Trials. Stroke 2017; 48: 2007–2012. [DOI] [PMC free article] [PubMed] [Google Scholar]
- 9.Wang Y, Guo S, Zheng J, et al. User test of the psychometric properties of pictorial-based disability assessment Longshi Scale by healthcare professionals and non-professionals: a Chinese study in Shenzhen. Clin Rehabil 2019; 33: 1479–1491. [DOI] [PubMed] [Google Scholar]
- 10.Balu S. Differences in psychometric properties, cut-off scores, and outcomes between the Barthel Index and Modified Rankin Scale in pharmacotherapy-based stroke trials: systematic literature review. Curr Med Res Opin 2009; 25: 1329–1341. [DOI] [PubMed] [Google Scholar]
- 11.Banks JL, Marotta CA. Outcomes validity and reliability of the modified Rankin scale: implications for stroke clinical trials: a literature review and synthesis. Stroke 2007; 38: 1091–1096. [DOI] [PubMed] [Google Scholar]
- 12.Harrison JK, McArthur KS, Quinn TJ. Assessment scales in stroke: clinimetric and clinical considerations. Clin Interv Aging 2013; 8: 201–211. [DOI] [PMC free article] [PubMed] [Google Scholar]
- 13.Barth J, De Boer WE, Busse JW, et al. Inter-rater agreement in evaluation of disability: systematic review of reproducibility studies. BMJ 2017; 356: j14. [DOI] [PMC free article] [PubMed] [Google Scholar]
- 14.Elwyn G, Edwards A, Wensing M, et al. Shared decision making: developing the OPTION scale for measuring patient involvement. Qual Saf Health Care 2003; 12: 93–99. [DOI] [PMC free article] [PubMed] [Google Scholar]
- 15.Vitacca M, Paneroni M, Baiardi P, et al. Development of a Barthel Index based on dyspnea for patients with respiratory diseases. Int J Chron Obstruct Pulmon Dis 2016; 11: 1199–1206. [DOI] [PMC free article] [PubMed] [Google Scholar]
- 16.Sackley C, Richardson P, McDonnell K, et al. The reliability of balance, mobility and self-care measures in a population of adults with a learning disability known to a physiotherapy service. Clin Rehabil 2005; 19: 216–223. [DOI] [PubMed] [Google Scholar]
- 17.Kasner SE. Clinical interpretation and use of stroke scales. Lancet Neurol 2006; 5: 603–612. [DOI] [PubMed] [Google Scholar]


