

Abstract
Purpose
The purpose was to investigate the association between embryonic development or implantation and the content of interleukin-6 and 10 (IL-6, IL-10) and tumor necrosis factor-α (TNF-α) in single-blastocyst conditioned medium (SBCM).
Methods
Thirty-eight SBCM samples (SBCMs) were collected from blastocysts with different morphological scores. IL-6, IL-10, and TNF-α concentration in 38 SBCMs was detected by Single Molecule Array and compared according to the blastocyst quality: top-quality (TQ) and non-top quality (NTQ), or blastulation time: day 5 (D5) and day 6 (D6). In another experiment, 61 SBCMs were collected from TQ blastocyst transplanted on D5, and IL-6 concentration in SBCM was compared based on whether embryos are implanted or not (implanted and non-implanted).
Results
In the first experiment, IL-6, IL-10, and TNF-α concentration was not significantly different between the TQ-SBCM and NTQ-SBCM. The D6-SBCM had a higher IL-6 concentration compared with the D5-SBCM, while IL-10 and TNF-α concentration was not significantly different between the D5-SBCM and D6-SBCM. The IL-6 concentration in D5-NTQ or D6-TQ SBCM was higher than that in D5-TQ or D6-NTQ SBCM (P < 0.05), respectively. Furthermore, the spearman analysis demonstrated that IL-6 concentration in SBCM was negatively correlated with the blastocyst quality on D5 and positively correlated with the blastocyst quality on D6. In the second experiment, no significant difference in IL-6 concentration was found between SBCM from implanted and non-implanted blastocyst.
Conclusion
IL-6 concentration in SBCM was associated with embryo quality depending on the blastulation time, although it might not be associated with the blastocyst implantation.
Electronic supplementary material
The online version of this article (10.1007/s10815-020-01805-7) contains supplementary material, which is available to authorized users.
Keywords: Blastocyst quality, Interleukin-6, Interleukin-10, Single-blastocyst conditioned medium, Single Molecule Array platform, Tumor necrosis factor-α
Introduction
Over the past decades, achievements in human-assisted reproductive technology (ART) have been significantly improved. In order to improve the live birth rate and reduce the multiple pregnancy rate, elective single-embryo transfer has gradually become a future trend [1]. The selection of embryos for a transfer with a higher developmental potential is critical to obtain higher implantation and birth rates [2]. Conventionally, embryo selection is mainly based on embryo morphological score, which is a subjective judgment [3]. Euploid embryos selected by invasive embryo selection tools such as pre-implantation genetic testing for aneuploidy (PGT-A) may result in higher implantation rates [4]. However, with the development of non-invasive detection methods, its advantages in embryo quality assessment gradually emerged, for example, the analysis of embryonic secreted proteins in embryonic conditioned medium (ECM) [5, 6].
During in vitro culture, the pre-implantation embryo secretes some cytokines into ECM, such as interleukin-6 (IL-6) [5], interleukin-10 (IL-10) [7], and tumor necrosis factor-α (TNF-α) [8]. The human endometrium also secretes these cytokines and expresses related receptors [9–11]. Abnormal expression of these cytokines is associated with recurrent abortions [12–14]. The interaction between endometrium and embryos during the pre-implantation stage is a key element for a successful implantation [15, 16]. The information above raised the possibility that the concentration of these cytokines in ECM might be predictive for the embryonic development potential or pregnancy in patient subjected to ART treatment. Previous studies reported the detection of TNF-α and IL-10 in ECM by conventional methods, but the correlation of IL-10 and TNF-α concentration in ECM with the embryo quality and embryo implantation remains inconclusive [8, 17]. Furthermore, studies on qualitative analysis or semi-quantitative analysis illustrated that IL-6 detected in ECM predicts embryo quality or implantation potential [5, 6]. However, these studies above still cannot conclude whether IL-6, IL-10, and TNF-α concentration in ECM from a single embryo can be predictive of the embryo quality or pregnancy by a specific type of quantitative detection method.
The Single Molecule Array (SIMOA) platform is capable of detecting single or multiple biomolecules with ultra-high sensitivity and has been used to detect proteins in serum at subfemtomolar concentrations in the field of neurology and immunology [18, 19]. Thus, SIMOA platform might be a better solution to overcome the limitation mentioned above. Therefore, this study aimed to detect the IL-6, IL-10, and TNF-α concentration in single-blastocyst conditioned medium (SBCM) by SIMOA platform, and to assess the relationship of the three cytokines’ concentration with embryo quality and outcome of subsequent embryo transfer.
Materials and methods
Study design
All SBCM samples were collected from IVF/ICSI cycles at the Fertility Center from January to December 2019. This study was approved by the research ethics committee of the hospital.
Cycles with all cleavage-stage embryos undergoing an extended blastocyst culture were included. The exclusion criteria were as follows: (a) female age > 38 years; (b) more than one cycle of ART treatment; (c) micro-stimulation protocol; (d) less than four top-quality (TQ) embryo [20] on day 3 (D3) derived from normal fertilized zygote with two pronucleus (2PN); (e) pre-implantation genetic diagnosis of monogenic diseases and PGT-A.
In one set of experiments, 38 SBCMs were collected from blastocysts with different morphological scores. The concentration of IL-6, IL-10, and TNF-α was detected in 38 SBCMs, and the relationship of the concentration with blastocyst quality was determined.
In another set of experiments, 61 SBCMs were collected from TQ blastocysts and subsequently transferred on day 5 after fertilization.
Human embryo culture and morphological score
For conventional IVF and ICSI, the fertilization (day 0) was performed in Quinn’s Fertilization Medium (SAGE BioPharma, Bedminster, NJ, USA). Fertilization assessment was performed 18–20 h after insemination (day 1) using an inverted microscope with Hoffman modulation contrast (× 200 and × 400 magnification). The fertilized zygote was individually cultured in Quinn’s Advantage Cleavage Medium (SAGE BioPharma) containing 10% (v/v) serum protein substitute (SAGE BioPharma). On D3, the cleavage-stage embryo was individually transferred to a 30-μL micro-droplet of Quinn’s Advantage Blastocyst Medium (SAGE BioPharma) containing 10% (v/v) serum protein substitute and cultured until day 5 (D5) or day 6 (D6). The quality of the cleavage-stage embryo was morphologically evaluated on D3 by the morphological scoring system [20]. Briefly, D3 embryos were mainly scored by blastomere number (BTN) and percentage of fragmentation (POF), and graded as follows: grade 1, BTN ≥ 7, POF ≤ 10%; grade 2, BTN ≥ 7, POF > 10%, and ≤ 20%; grade 3, BTN ≥ 7, POF > 20% or BTN ≥ 5 and < 7, POF ≤ 10%; grade 4, BTN ≥ 5 and < 7, POF > 10% or BTN < 5; grade 5, BTN ≤ 4 or POF > 50%. D3 embryos of grades 1 and 2 were defined as TQ embryos and grades 3, 4, and 5 as non-top quality (NTQ) embryos. Blastocysts were graded according to the popular Gardner system [21]. Briefly, blastocysts were mainly scored by the expansion of blastocoel (1–6), inner cell mass (ICM), and trophectoderm (TE) (grades A–C), and graded as follows: grade 1, expansion ≥ 3, both ICM and TE are ≥ B; grade 2, expansion ≥ 3, ICM = C, TE ≥ B or expansion ≥ 3, ICM ≥ B, TE = C; grade 3, expansion ≥ 3, ICM = C, TE = C. A blastocyst of grade 1 was defined as a TQ blastocyst and grades 2 and 3 were defined as NTQ blastocysts. A single TQ blastocyst was transferred on D5 and the surplus grade 1–2 blastocysts underwent vitrification at D5/6. Grade 3 blastocysts formed at D5/6 spontaneously degenerated in vitro.
Sample collection
A 30-μL micro-droplet of SBCM was collected into a 200-μL tube. The blastocyst in the SBCM was a 2PN zygote on D1 and a TQ embryo on D3. Samples of culture medium under the same conditions without embryo were collected and were used as negative controls. The collected SBCMs and negative controls were immediately frozen and stored at − 80 °C until detection. In one set of experiments, 38 SBCMs of each blastocyst after being transferred, frozen, or degenerated were collected and divided into two groups according to the blastocyst quality: TQ (n = 19) and NTQ (n = 19), or blastulation time: D5 (n = 20) and D6 (n = 18). In another set of experiments, 61 SBCMs of each TQ blastocysts that were transferred on D5 were collected and divided into two groups according to the outcome of the embryo transfer: implanted (n = 34) and non-implanted (n = 27).
IL-6, IL-10, and TNF-α detection in SBCM by SIMOA platform
IL-6, IL-10, and TNF-α concentration in SBCM was measured using the SIMOA Cytokine 3-plex A kit (Cat No: 101160) on a SIMOA HD-1 platform at GBIO (Hangzhou, China) according to the manufacturer’s instructions (Quanterix, Lexington, MA, USA). Briefly, the immunomagnetic bead captured the target protein, which was covalently attached to a detection antibody, and then the detection antibody was labeled with enzyme-labeled molecule. The labeled-immunomagnetic bead was randomly falling into a 50-fl reaction micropore and mixed with the substrate, so that each micropore only contains a single labeled-immunomagnetic bead. After reaction in the micropore, imaging was performed using the fluorescence microscopy. When the number of target protein molecules in the sample is much smaller than that of immunomagnetic beads, the proportion of labeled immunomagnetic beads obeys the Poisson distribution, which means that the beads carry a single immunocomplex or not at an extremely low-concentration of target protein. The Poisson distribution digital analysis method and standard curve were used to calculate the protein concentration [22]. The detection limits of IL-6, IL-10, and TNF-α of the kit were 0.0060 pg/mL, 0.0022 pg/mL, and 0.0110 pg/mL, respectively.
Outcome evaluation
In the experiment using 61 SBCMs, the implantation outcome of each transferred TQ blastocyst was followed up. One month after the transfer, implantation was confirmed by visualization on transvaginal ultrasound of an intrauterine gestational sac or more.
Statistical analysis
Statistical analysis was performed using SPSS version 22.0 (IBM Corp, Armonk, NY, USA). Quantitative data were expressed as mean ± standard deviation (SD), and differences between groups were calculated by Mann-Whitney U test or Student’s t test. Qualitative data were defined by percentages, and differences between groups were calculated using chi-squared test. The detection rate was defined as the percentage of samples with a protein concentration above the detection limit in all samples. By subtracting the value of the negative control, the cytokine concentration above zero was used for statistical analysis. Spearman rank correlation test was used to determine the association between IL-6 concentration in SBCM and blastocyst quality. A P value < 0.05 was considered statistically significant.
Results
IL-6, IL-10, and TNF-α concentration and blastocyst quality—an experiment based on 38 SBCMs
A total of 38 SBCMs collected from 32 patients who underwent IVF/ICSI treatment were analyzed. The proportion of ICSI cycles was 25% (8/32). The mean age of the women, BMI, and infertility duration were 31.13 ± 3.12 years, 20.79 ± 2.69 kg/m2, and 2.61 ± 1.62 years, respectively (Table S1, Supplementary material).
The detection rate of IL-6, IL-10, and TNF-α was 100% (38/38), 50% (19/38), and 63% (24/38), respectively (Table 1). The sample size of IL-6, IL-10, and TNF-α used for statistical analysis was 38, 16, and 24, respectively.
Table 1.
Blastocyst characteristics and IL-6, IL-10, and TNF-α concentration from SBCM derived from the related blastocyst
| No. | Blastocyst score | Female age (years) | Blastocyst grade | Blastulation time | IL-6 concentration (pg/mL) | IL-10 concentration (pg/mL) | TNF-α concentration (pg/mL) |
|---|---|---|---|---|---|---|---|
| 1 | 4AB | 31 | 1 | D5 | 0.1252 | — | — |
| 2 | 4AB | 32 | 1 | D5 | 0.4113 | 0.0127 | 0.0290 |
| 3 | 4AA | 28 | 1 | D5 | 0.2442 | 0.0094 | 0.0256 |
| 4 | 4AB | 28 | 1 | D5 | 0.2655 | 0.0027 | — |
| 5 | 4AA | 31 | 1 | D5 | 0.0916 | — | 0.0837 |
| 6 | 4AB | 26 | 1 | D5 | 0.3901 | — | — |
| 7 | 4AB | 36 | 1 | D5 | 0.1676 | — | — |
| 8 | 4AB | 34 | 1 | D5 | 0.1163 | 0.0073 | 0.0563 |
| 9 | 4AA | 37 | 1 | D5 | 0.1010 | — | — |
| 10 | 4AB | 27 | 1 | D5 | 0.2330 | 0.0104 | — |
| 11 | 4BC | 31 | 2 | D5 | 0.3238 | — | 0.0347 |
| 12 | 4BC | 31 | 2 | D5 | 0.4068 | 0.0059 | — |
| 13 | 4BC | 28 | 2 | D5 | 0.2185 | 0.0025 | 0.0645 |
| 14 | 4BC | 34 | 2 | D5 | 0.4840 | — | 0.0629 |
| 15 | 4BC | 34 | 2 | D5 | 0.5301 | — | 0.0618 |
| 16 | 4CC | 35 | 3 | D6 | 0.3374 | — | 0.0373 |
| 17 | 4CB | 29 | 2 | D6 | 0.6261 | — | — |
| 18 | 4CC | 32 | 3 | D6 | 0.5121 | 0.0030 | 0.0457 |
| 19 | 3CC | 26 | 3 | D6 | 0.4258 | 0.0095 | — |
| 20 | 4CC | 30 | 3 | D6 | 0.9452 | — | 0.0295 |
| 21 | 4AA | 31 | 1 | D6 | 1.3759 | 0.0176 | 0.1017 |
| 22 | 4AA | 28 | 1 | D6 | 1.1694 | — | 0.0357 |
| 23 | 4AA | 30 | 1 | D6 | 0.7506 | — | 0.0437 |
| 24 | 4AB | 28 | 1 | D6 | 0.7006 | — | 0.0445 |
| 25 | 4AB | 33 | 1 | D6 | 0.9809 | 0.0152 | — |
| 26 | 4AB | 33 | 1 | D6 | 0.7091 | 0.0059 | 0.1227 |
| 27 | 4BA | 28 | 1 | D6 | 1.0710 | 0.0285 | 0.3571 |
| 28 | 4BA | 38 | 1 | D6 | 0.3532 | 0.0186 | 0.1094 |
| 29 | 4BA | 31 | 1 | D6 | 0.7354 | 0.0080 | 0.0563 |
| 30 | 4CC | 32 | 3 | D6 | 0.6483 | — | 0.0754 |
| 31 | 4CC | 34 | 3 | D6 | 0.3226 | — | 0.0556 |
| 32 | 4CC | 32 | 3 | D6 | 0.8154 | 0.0193 | — |
| 33 | 4CC | 32 | 3 | D6 | 0.5861 | — | — |
| 34 | 4BC | 29 | 2 | D5 | 0.5189 | 0.0230 | 0.0925 |
| 35 | 4BC | 34 | 2 | D5 | 0.3973 | 0.0184 | 0.0224 |
| 36 | 4BC | 32 | 2 | D5 | 0.4653 | — | — |
| 37 | 4BC | 38 | 2 | D5 | 0.3745 | 0.0213 | 0.1391 |
| 38 | 4BC | 28 | 2 | D5 | 0.2576 | — | — |
| 39 | NC | 0.0508 | — | — | |||
| 40 | NC | 0.0152 | 0.0057 | — | |||
| 41 | NC | 0.0171 | — | — | |||
| 42 | NC | 0.0060 | — | — |
NC, negative control sample; D5, day 5; D6, day 6. “—” indicates that the concentration of IL-6, IL-10, or TNF-α in single-blastocyst conditioned medium was below the limit of detection
In order to investigate the correlation of the secreted proteins with the blastocyst quality, the concentration of IL-6, IL-10, and TNF-α in TQ-SBCM and NTQ-SBCM was compared. The results showed no significant differences in the IL-6, IL-10, and TNF-α concentration between TQ-SBCM and NTQ-SBCM (IL-6, 0.5036 ± 0.4027 pg/mL vs. 0.4617 ± 0.1839 pg/mL; IL-10, 0.0077 ± 0.0069 pg/mL vs. 0.0105 ± 0.0069 pg/mL; TNF-α, 0.0888 ± 0.0906 pg/mL vs. 0.0601 ± 0.0321 pg/mL; Fig. 1a–c).
Fig. 1.

IL-6, IL-10, and TNF-α concentration in SBCM derived from blastocyst of different quality (TQ and NTQ blastocysts) or blastulation time (D5 and D6). No significant difference was observed in the concentration of IL-6 (a), IL-10 (b), and TNF-α (c) between TQ-SBCM and NTQ-SBCM. Statistically significant difference in IL-6 concentration between D5-SBCM and D6-SBCM was observed (d), while no difference was observed in IL-10 (e) and TNF-α (f) concentration between D5-SBCM and D6-SBCM. NS, not significant. *P < 0.05. TQ, top-quality. NTQ, non-top quality. SBCM, single-blastocyst conditioned medium
Furthermore, it was determined whether the concentration of secreted proteins was affected by the blastulation time. D6-SBCM had a higher IL-6 concentration compared with D5-SBCM (0.7036 ± 0.2955 pg/mL vs. 0.2839 ± 0.1434 pg/mL; P < 0.05; Fig. 1d), while no significant difference in IL-10 and TNF-α concentration was observed between D5-SBCM and D6-SBCM (IL-10, 0.0078 ± 0.0065 pg/mL vs. 0.0096 ± 0.0074 pg/mL; TNF-α, 0.0611 ± 0.0348 pg/mL vs. 0.0857 ± 0.0870 pg/mL; Fig. 1e, f). Therefore, only the IL-6 concentration in 38 SBCMs was analyzed in the subgroups by stratification with the day of blastulation, as shown in Fig. 2. The IL-6 concentration in SBCM of D5-TQ, D5-NTQ, D6-TQ, and D6-NTQ was 0.1923 ± 0.1160 pg/mL, 0.3754 ± 0.1065 pg/mL, 0.8495 ± 0.3067 pg/mL, and 0.5576 ± 0.2089 pg/mL, respectively. The concentration of IL-6 in SBCM from D5-NTQ blastocysts was significantly higher than that from D5-TQ blastocysts (P < 0.05), while SBCM from D6-TQ blastocysts had a higher IL-6 concentration compared with that from D6-NTQ blastocysts (P < 0.05). Moreover, the concentration of IL-6 in SBCM from D6-TQ blastocysts was significantly higher than that from D5-TQ (P < 0.05), while SBCM from D6-NTQ blastocysts had no difference in IL-6 concentration compared with that from D5-NTQ blastocysts.
Fig. 2.
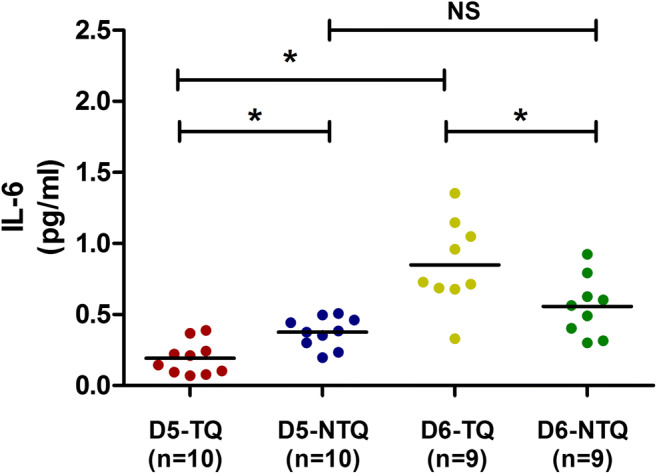
IL-6 concentration in SBCM was compared among the subgroups. The concentration of IL-6 in SBCM from D5-NTQ and D6-TQ blastocysts was significantly higher than that from D5-TQ and D6-NTQ blastocysts, respectively. The concentration of IL-6 in SBCM from D6-TQ blastocysts was significantly higher than that from D5-TQ blastocysts, while SBCM from D6-NTQ blastocysts showed no difference in IL-6 concentration compared with that from D5-NTQ blastocysts. D5-TQ, day 5 top-quality. D5-NTQ, day 5 non-top quality. D6-TQ, day 6 top-quality. D6-NTQ, day 6 non-top quality. SBCM, single-blastocyst conditioned medium. *P < 0.05
Furthermore, spearman analysis showed a significant negative correlation between IL-6 concentration in SBCM and blastocyst quality for D5 blastocyst (r = − 0.624, P = 0.003), while a significant positive correlation was observed for D6 blastocyst (r = 0.546, P = 0.019).
IL-6 concentration and implantation potential—an experiment based on 61 SBCMs
To investigate the predictive value of IL-6 on the embryonic implantation potential, 61 SBCMs from single TQ blastocysts transferred on D5 were collected and analyzed according to the outcome of the embryo transfer: implanted and non-implanted. The demographic characteristics, including age, BMI, infertility duration, Gn dosage, proportion of primary infertility, and ICSI, were not significantly different between the two groups (Table 2). No significant difference was observed in IL-6 concentration between SBCM derived from implanted and non-implanted blastocyst (0.2753 ± 0.2208 pg/mL vs. 0.2074 ± 0.1366 pg/mL; Fig. 3).
Table 2.
Demographic characteristics of the transplanted patients (n = 61)
| Characteristic | Implanted (n = 34) | Non-implanted (n = 27) |
|---|---|---|
| Female age (years) | 30.12 ± 3.45 | 31.11 ± 4.15 |
| BMI (kg/m2) | 22.31 ± 4.09 | 21.61 ± 2.52 |
| Duration of infertility (years) | 2.79 ± 1.53 | 3.02 ± 2.47 |
| Primary infertility, n (%) | 50 (17/34) | 67 (18/27) |
| ICSI, n (%) | 29 (10/34) | 33 (9/27) |
| Gn dosage | 26.92 ± 9.68 | 30.15 ± 8.48 |
Fig. 3.
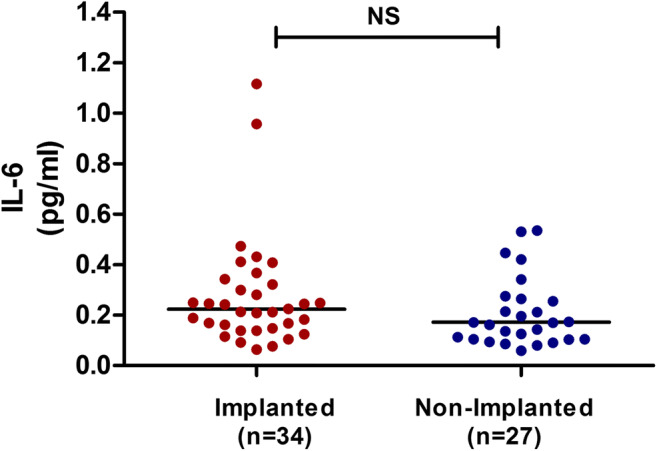
IL-6 concentration in SBCM derived from implanted and non-implanted blastocyst. No significant difference in IL-6 concentration was observed between the two groups. NS, not significant. SBCM, single-blastocyst conditioned medium
Discussion
In the present study, the association between IL-6, IL-10, and TNF-α concentration in SBCM and embryonic developmental potential was evaluated. To the best of our knowledge, the present study was the first to quantitatively detect the concentration of IL-6, IL-10, and TNF-α in SBCM using the SIMOA platform, and to demonstrate that IL-6 concentration had a negative correlation with the quality of blastocyst developed on D5, while it had a positive correlation with blastocyst quality on D6. No significant difference in the concentration of IL-10 and TNF-α between TQ-SBCM and NTQ-SBCM was observed. Importantly, this study demonstrated that the concentration of IL-6 in SBCM could not predict the blastocyst implantation potential.
Several studies reported the detection of some secreted protein content in ECM by conventional detection methods, such as ELISA. Zollner U et al. reported that TNF-α was detectable in all ECM by ELISA, and its concentration in ECM correlated with an unsuccessful implantation and pregnancy was significantly higher than that in ECM correlated with a successful implantation and pregnancy [8]. Furthermore, the difference in TNF-α and IL-10 concentration in SBCM between implanted and non-implanted embryos has also been detected by protein assay [17]. However, the results of our study showed that the detection rate and concentration of TNF-α in SBCM were much lower compared with that in the above studies. The possible reasons explaining this discrepancy could be explained as follows. Firstly, the ECM used by Zollner U et al. was collected from embryos cultured from zygotes to blastocysts, which may result in TNF-α accumulation in the ECM. Secondly, the ECM used in these studies were all obtained from multiple embryos, while the ECM in our study was obtained from a single blastocyst and cultured from D3 embryo to blastocyst. Moreover, the detection rate of IL-6 in SBCM from the embryo cultured from D3 to D5 by Luminex analysis is 43% (12/28) [5], which is lower than that in our study. The present study demonstrated that the detection rate of IL-6 in SBCM was 100% by SIMOA platform. Thus, the high detection sensitivity of SIMOA platform made the conclusions of our study more reliable and repeatable. Due to the low detection rate of IL-10 and TNF-α in SBCM, the present study only demonstrated the relationship between the IL-10 and TNF-α concentration in SBCM and blastocyst quality rather than embryonic implantation potential, which is one of the limitations of the present study.
The presence of IL-6 could be demonstrated in all SBCMs and negative control samples by SIMOA analysis. The presence of IL-6 was not detected in the Quinn’s Advantage Blastocyst Medium (data not shown), but the presence of IL-6 was detected in the Quinn’s Advantage Blastocyst Medium containing 10% (v/v) serum protein substitute (negative control, 0.0223 ± 0.0196 pg/mL, Table 1). In addition, the content of IL-6 in negative control was significantly lower than that in SBCM with blastocyst. These findings suggested that IL-6 detected in SBCM was produced by the blastocyst, which was consistent with a previous report [6]. A statistically significant difference in IL-6 concentration between D5-SBCM and D6-SBCM was observed, rather than between TQ-SBCM and NTQ-SBCM. The higher IL-6 concentration in D6-SBCM compared with the one in D5-SBCM might be related to the longer culture resulting in more IL-6 accumulation in the SBCM. Furthermore, after subgrouping by blastocyst quality, the cumulative effect of IL-6 in D6-SBCM compared with D5-SBCM was also observed (Fig. 2).
The embryo secretes IL-6 during blastocyst formation, and the blastocyst with more inner cells can utilize more IL-6 during blastocyst development [23, 24]. This probably explains why the mean concentration of IL-6 in SBCM from D5-NTQ blastocysts was higher than that of the D5-TQ blastocysts. However, the situation was different when a comparison was made between D6-TQ and D6-NTQ blastocysts. On the one hand, D6-TQ had a higher capacity of using IL-6 compared with D6-NTQ. On the other hand, the accumulation effect might result in more IL-6 in the D6-SBCM, but whether it had the same accumulation effect for D6-TQ SBCM and D6-NTQ SBCM was unknown and undetectable. Thus, the possible reasons explaining why D6-TQ SBCM had a higher IL-6 concentration than D6-NTQ SBCM might be related to the balance between embryonic secretion and use of IL-6.
Numerous studies showed that the interaction between the endometrium and embryo during the pre-implantation stage plays a key role in the success of implantation [15, 16]. Human pre-implantation embryo and endometrium can secrete IL-6 and express its receptors. Animal studies demonstrated that adding an appropriate amount of IL-6 is beneficial to the development of blastocysts culture in vitro [23, 25]. Therefore, IL-6 secreted by the embryo may affect the embryo development and endometrial function. Dominguez F et al. reported that the presence or absence of IL-6 in ECM was related to the percentage of implanted embryos, and found that the implantation rate of embryos in the presence of IL-6 in SBCM was significantly higher than that in the absence of IL-6 [5]. However, the present study found no difference in IL-6 concentration between SBCM from implanted and non-implanted blastocyst, which was inconsistent with the findings of the above study. It should be underlined that the results of Dominguez F et al. were obtained from a qualitative detection and analysis, which was the main difference between his study and our study. Due to the small sample size and characteristic of the retrospective analysis, it is necessary to increase the sample size and design a prospective randomize study to further identify the predictive value of IL-6 concentration on embryo implantation ability. Thus, this one represents another limitation of the present study.
Conclusion
The results of our study demonstrated that IL-6 concentration in SBCM was related to the quality of blastocysts in different blastulation times. However, IL-6 concentration in SBCM might not be associated with blastocyst implantation potential.
Electronic supplementary material
(DOC 19 kb)
Acknowledgments
The authors wish to thank the help of all staff of the IVF laboratory in the fertility center of Shenzhen Zhongshan Urology Hospital (Shenzhen, China).
Funding information
This study was funded by Basic Research Program of Shenzhen (No. JCYJ20160427113153295), clinical research special fund of Chinese Medical Association (Grant No. 18010120741), National Natural Science Foundation of China (Grant No. 21807072), Sanming Project of Medicine in Shenzhen (SZSM201502035), and National Key Research & Developmental Program of China (2018YFC1003904)
Compliance with ethical standards
This study was approved by the Research Ethics Committee of Shenzhen Zhongshan Urology Hospital (Approval number: SZZSECHU-20180021) on June 12, 2018.
Conflict of interest
The authors declare that they have no conflicts of interest.
Footnotes
Publisher’s note
Springer Nature remains neutral with regard to jurisdictional claims in published maps and institutional affiliations.
Huixian Zhong and Qing Sun contributed equally to this work.
References
- 1.Mansour R, Ishihara O, Adamson GD, Dyer S, de Mouzon J, Nygren KG, Sullivan E, Zegers-Hochschild F. International committee for monitoring assisted reproductive technologies world report: assisted reproductive technology 2006. Hum Reprod. 2014;29(7):1536–1551. doi: 10.1093/humrep/deu084. [DOI] [PubMed] [Google Scholar]
- 2.Barberet J, Bruno C, Valot E, Antunes-Nunes C, Jonval L, Chammas J, Choux C, Ginod P, Sagot P, Soudry-Faure A, Fauque P. Can novel early non-invasive biomarkers of embryo quality be identified with time-lapse imaging to predict live birth? Hum Reprod. 2019;34(8):1439–1449. doi: 10.1093/humrep/dez085. [DOI] [PMC free article] [PubMed] [Google Scholar]
- 3.Montag M, Toth B, Strowitzki T. New approaches to embryo selection. Reprod BioMed Online. 2013;27(5):539–546. doi: 10.1016/j.rbmo.2013.05.013. [DOI] [PubMed] [Google Scholar]
- 4.Sermon K. Novel technologies emerging for preimplantation genetic diagnosis and preimplantation genetic testing for aneuploidy. Expert Rev Mol Diagn. 2017;17(1):71–82. doi: 10.1080/14737159.2017.1262261. [DOI] [PubMed] [Google Scholar]
- 5.Dominguez F, Meseguer M, Aparicio-Ruiz B, Piqueras P, Quinonero A, Simon C. New strategy for diagnosing embryo implantation potential by combining proteomics and time-lapse technologies. Fertil Steril. 2015;104(4):908–914. doi: 10.1016/j.fertnstert.2015.06.032. [DOI] [PubMed] [Google Scholar]
- 6.Lindgren KE, Gulen Yaldir F, Hreinsson J, Holte J, Karehed K, Sundstrom-Poromaa I, et al. Differences in secretome in culture media when comparing blastocysts and arrested embryos using multiplex proximity assay. Ups J Med Sci. 2018;123(3):143–152. doi: 10.1080/03009734.2018.1490830. [DOI] [PMC free article] [PubMed] [Google Scholar]
- 7.Ozornek MH, Bielfeld P, Krussel JS, Moustafa M, Mikat-Drozdzynski B, Koldovsky U, et al. Interferon gamma and interleukin 10 levels in preimplantation embryo culture media. J Assist Reprod Genet. 1995;12(9):590–593. doi: 10.1007/bf02212580. [DOI] [PubMed] [Google Scholar]
- 8.Zollner U, Bischofs S, Lalic I, Zollner KP. LIF and TNF alpha concentrations in embryo culture media are predictive for embryo implantation in IVF. Asian Pac J Reprod. 2012;1(4):277–282. doi: 10.1016/S2305-0500(13)60092-5. [DOI] [Google Scholar]
- 9.Tabibzadeh S, Kong QF, Babaknia A, May LT. Progressive rise in the expression of interleukin-6 in human endometrium during menstrual cycle is initiated during the implantation window. Hum Reprod. 1995;10(10):2793–2799. doi: 10.1093/oxfordjournals.humrep.a135793. [DOI] [PubMed] [Google Scholar]
- 10.Wang WJ, Zhang H, Chen ZQ, Zhang W, Liu XM, Fang JY, Liu FJ, Kwak-Kim J. Endometrial TGF-beta, IL-10, IL-17 and autophagy are dysregulated in women with recurrent implantation failure with chronic endometritis. Reprod Biol Endocrinol. 2019;17(1):2. doi: 10.1186/s12958-018-0444-9. [DOI] [PMC free article] [PubMed] [Google Scholar]
- 11.Hunt JS, Chen HL, Hu XL, Tabibzadeh S. Tumor necrosis factor-alpha messenger ribonucleic acid and protein in human endometrium. Biol Reprod. 1992;47(1):141–147. doi: 10.1095/biolreprod47.1.141. [DOI] [PubMed] [Google Scholar]
- 12.Hua F, Li CH, Wang H, Xu HG. Relationship between expression of COX-2, TNF-alpha, IL-6 and autoimmune-type recurrent miscarriage. Asian Pac J Trop Med. 2013;6(12):990–994. doi: 10.1016/S1995-7645(13)60178-9. [DOI] [PubMed] [Google Scholar]
- 13.Wang J, Huang C, Jiang R, Du Y, Zhou J, Jiang Y, et al. Decreased endometrial IL-10 impairs endometrial receptivity by downregulating HOXA10 expression in women with adenomyosis. Biomed Res Int. 2018;2018:2549789. doi: 10.1155/2018/2549789. [DOI] [PMC free article] [PubMed] [Google Scholar]
- 14.Reid JG, Simpson NA, Walker RG, Economidou O, Shillito J, Gooi HC, et al. The carriage of pro-inflammatory cytokine gene polymorphisms in recurrent pregnancy loss. Am J Reprod Immunol. 2001;45(1):35–40. doi: 10.1111/j.8755-8920.2001.450106.x. [DOI] [PubMed] [Google Scholar]
- 15.Banerjee P, Fazleabas AT. Endometrial responses to embryonic signals in the primate. Int J Dev Biol. 2010;54(2-3):295–302. doi: 10.1387/ijdb.082829pb. [DOI] [PMC free article] [PubMed] [Google Scholar]
- 16.Gu XW, Yang Y, Li T, Chen ZC, Fu T, Pan JM, Ou JP, Yang ZM. ATP mediates the interaction between human blastocyst and endometrium. Cell Prolif. 2020;53(2):e12737. doi: 10.1111/cpr.12737. [DOI] [PMC free article] [PubMed] [Google Scholar]
- 17.Dominguez F, Gadea B, Esteban FJ, Horcajadas JA, Pellicer A, Simon C. Comparative protein-profile analysis of implanted versus non-implanted human blastocysts. Hum Reprod. 2008;23(9):1993–2000. doi: 10.1093/humrep/den205. [DOI] [PubMed] [Google Scholar]
- 18.Kan CW, Rivnak AJ, Campbell TG, Piech T, Rissin DM, Mosl M, et al. Isolation and detection of single molecules on paramagnetic beads using sequential fluid flows in microfabricated polymer array assemblies. Lab Chip. 2012;12(5):977–985. doi: 10.1039/c2lc20744c. [DOI] [PubMed] [Google Scholar]
- 19.Rissin DM, Kan CW, Campbell TG, Howes SC, Fournier DR, Song L, Piech T, Patel PP, Chang L, Rivnak AJ, Ferrell EP, Randall JD, Provuncher GK, Walt DR, Duffy DC. Single-molecule enzyme-linked immunosorbent assay detects serum proteins at subfemtomolar concentrations. Nat Biotechnol. 2010;28(6):595–599. doi: 10.1038/nbt.1641. [DOI] [PMC free article] [PubMed] [Google Scholar]
- 20.Wan CY, Song C, Diao LH, Li GG, Bao ZJ, Hu XD, Zhang HZ, Zeng Y. Laser-assisted hatching improves clinical outcomes of vitrified-warmed blastocysts developed from low-grade cleavage-stage embryos: a prospective randomized study. Reprod BioMed Online. 2014;28(5):582–589. doi: 10.1016/j.rbmo.2014.01.006. [DOI] [PubMed] [Google Scholar]
- 21.Gardner DK, Schoolcraft WB. Culture and transfer of human blastocysts. Curr Opin Obstet Gynecol. 1999;11(3):307–311. doi: 10.1097/00001703-199906000-00013. [DOI] [PubMed] [Google Scholar]
- 22.Rissin DM, Fournier DR, Piech T, Kan CW, Campbell TG, Song L, Chang L, Rivnak AJ, Patel PP, Provuncher GK, Ferrell EP, Howes SC, Pink BA, Minnehan KA, Wilson DH, Duffy DC. Simultaneous detection of single molecules and singulated ensembles of molecules enables immunoassays with broad dynamic range. Anal Chem. 2011;83(6):2279–2285. doi: 10.1021/ac103161b. [DOI] [PMC free article] [PubMed] [Google Scholar]
- 23.Wooldridge LK, Ealy AD. Interleukin-6 increases inner cell mass numbers in bovine embryos. BMC Dev Biol. 2019;19(1):2. doi: 10.1186/s12861-019-0182-z. [DOI] [PMC free article] [PubMed] [Google Scholar]
- 24.Wooldridge LK, Johnson SE, Cockrum RR, Ealy AD. Interleukin-6 requires JAK to stimulate inner cell mass expansion in bovine embryos. Reproduction. 2019;158(4):303–312. doi: 10.1530/REP-19-0286. [DOI] [PubMed] [Google Scholar]
- 25.Kelley RL, Gardner DK. Addition of interleukin-6 to mouse embryo culture increases blastocyst cell number and influences the inner cell mass to trophectoderm ratio. Clin Exp Reprodu Med. 2017;44(3):119–125. doi: 10.5653/cerm.2017.44.3.119. [DOI] [PMC free article] [PubMed] [Google Scholar]
Associated Data
This section collects any data citations, data availability statements, or supplementary materials included in this article.
Supplementary Materials
(DOC 19 kb)