Abstract
In this study, near-field electrospinning (NFES) is used to fabricate BaxSr1–xTiO3 (BST)/poly(vinylidene fluoride) (PVDF) piezoelectric fiber composites with excellent mechanical properties and chemical properties. BST ceramic powder is blended with PVDF solution uniformly to prepare a solution of appropriate conductance. The parameter for BST/PVDF fiber processing is based on PVDF fibers. Scanning electron microscopy, differential scanning calorimetry, microtensile testing, Fourier transform infrared spectroscopy, and electricity test of the blends of BST/PVDF fibers are incorporated. Mechanical properties of the fibers are then measured by microtensile testing. Effects of distinct ratios of Ba/Sr and the content of Ba0.7Sr0.3TiO3 ceramic powder on BST/PVDF piezoelectric fibers are discussed. Finally, BST/PVDF piezoelectric fiber composites are patterned on a poly(ethylene terephthalate) (PET)-based structure with an interdigital electrode as a BST/PVDF flexible energy harvester to capture ambient energy. The results show that the BST ceramic powder is ∼58–93 nm, and the diameters of piezoelectric fiber composites are ∼6.8–13.7 μm. The tensile strength of piezoelectric fiber composites is ∼74.92 MPa, and the Young’s coefficient tensile strength is ∼3.74 GPa. Mechanical properties are 2–3 times higher than those of pure PVDF piezoelectric fibers. The maximum open-circuit voltage and closed-loop current of BST/PVDF fibers reached ∼1025 mV and ∼391 nA, respectively. The electromechanical energy conversion efficiency of the BST/PVDF energy harvester is found to be 1–2 times higher than that of the PVDF energy harvester. It is confirmed and validated that the addition of BST ceramic powder could effectively increase the piezoelectric constant of PVDF piezoelectric fibers.
1. Introduction
With the development of Internet of Things (IoT) technology, the demand for sensors in the engineering industry is increasing dramatically.1 Power supply is a serious problem for the application of sensors.2 Batteries are standard portable power supplies in conventional wireless devices. However, batteries have shortcomings such as limited life and chemical pollution.3,4 Therefore, finding a new energy supply device to replace the traditional battery is essential because of global green energy development.
Energy harvesting is the most forward-looking potential of technology. One of the most effective energy-harvesting techniques is to use a piezoelectric material, where the piezoelectric effect collects the vibrational mechanical energy and converts it into electrical energy to supply power.5−7 The piezoelectric power supply device has the advantages of small volume and is used for long-term operation without device replacement. Electrospinning processes can construct fibers with simultaneous in situ mechanical stretch and electrical poling.8,9 This method is applied for synthetic and natural polymer alloys, polymer composites, and polymers.10 Unlike the conventional electrospinning process, near-field electrospinning (NFES) only needs a small electric field to produce continuous fibers with fine diameters.11 Piezoelectric materials can be divided mainly into five types: single piezoelectric crystal, piezoelectric ceramic, thin-film polymer, piezoelectric polymer, and composite piezoelectric compound.12 These materials have a property of transforming mechanical strain energy into electrical charges.
Most previous studies of piezoelectric polymer materials have used poly(vinylidene difluoride) (PVDF) as the substrate. PVDF piezoelectric materials have the properties of high toughness, flexibility, simple process, low quality, low cost, high piezoelectric coefficient, and low human exclusion. However, PVDF was limited by its low intrinsic permittivity,13 whereas ferroelectric ceramics, such as Pb(Zr,Ti)O3, BaTiO3, and BaxSr1–xTiO3 (BST), had the advantages of high dielectric constant, low Curie temperature, and low dielectric loss.14 In the recent years, potassium sodium niobate (KNN) was also extensively investigated by several groups as a lead-free ceramic-based ferroelectric material in flexible fibrous nanogenerators15,16 and self-powder-based devices.17 However, though the dielectric ceramics possess excellent dielectric properties, they also have the disadvantage of lacking flexibility and have a high sintering temperature.18
In this study, BST ceramic powder with PVDF solution of appropriate conductance was prepared and used. Also, BST/PVDF composite fibers with excellent mechanical properties and chemical properties were fabricated by NFES, and the fibers were used on a poly(ethylene terephthalate) (PET)-based structure with an interdigital electrode (IDT) as a BST/PVDF flexible energy harvester to capture ambient energy. In this study, we generate the three-dimensional structure of PVDF and BST as the best potential sensor. The potential sensor and its dynamic behavior in the entire PVDF and BST complex were also evaluated using the molecular dynamics (MD) simulation approach, as promising particles for multiple diseases.
2. Experimental Procedures
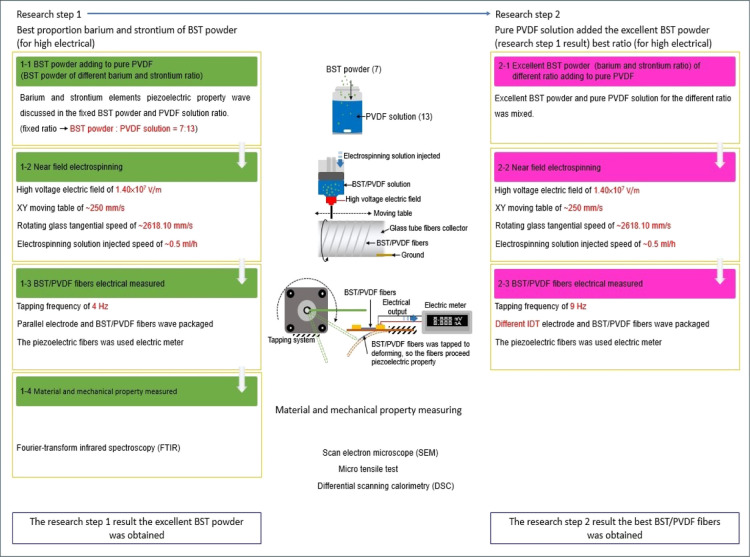
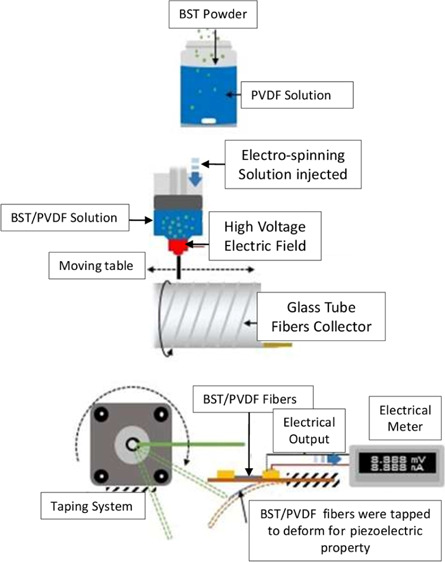
The BST/PVDF composite fibers were fabricated by the NFES process and compared with pure PVDF fibers. The experimental process is shown in Figure 1. First, the best proportion of BST powder was prepared by the sol–gel method. The best BST powder used had different proportions of barium acetate (Mw = ∼255.41), strontium acetate (Mw = ∼205.71), and titanium dioxide (Mw = ∼79.866), heated at 90 °C and stirred for 2 h in DI water (solvent). Next, the solution was dried at 100 °C and grinded into powder. This powder was calcined under 750 °C for an hour to obtain a rough powder. The rough powder was kept grinding up to a point until the powder becomes fine. Afterward, different proportions of the powder, such as Ba0.3Sr0.7TiO3, Ba0.4Sr0.6TiO3, Ba0.5Sr0.5TiO3, and Ba0.6Sr0.4TiO3, were obtained. The BST powder was mixed with pure PVDF solution in a proportion of 7:13 (35/65-BST/PVDF) to obtain the optimal powder configuration. In addition, the pure PVDF electrospinning solution was formed by dimethyl sulfoxide (DMSO), acetone, and fluorosurfactants. DMSO was used for the PVDF powder (Mw = ∼534,000), and the fluorosurfactant (ZONYL UR) in acetone was added to improve the evaporation rate and decrease the surface tension of the PVDF solution, respectively. The solution mixture was sealed in a sample container to avoid any evaporation effect at room temperature. The component ratio is shown in Table 1. Finally, the PVDF/BST electrospinning solution was used by adding BST powder prepared by sol–gel method to the pure PVDF electrospinning solution. Table 2 shows the different ratios of BST (BaxSr1–xTiO3) powder added to pure PVDF solution. The conductivity of BaxSr1–xTiO3/PVDF solution (∼36.8–41.3 μS/cm) was better than that of pure PVDF solution (∼25.6 μS/cm).
Figure 1.
Experimental process of BST/PVDF composite fibers fabricated by the NFES process and compared with pure PVDF fibers.
Table 1. Pure PVDF Solution Compounding Ratio.
| powder (g) | acetone (g) | DMSO (g) | surfactant (g) |
|---|---|---|---|
| 0.90 | 2.50 | 2.50 | 0.20 |
Table 2. Ratio of the Best BST (BaxSr1–xTiO3) Powder Added to Pure PVDF Solution.
| best BST (BaxSr1–xTiO3) powder/pure PVDF solution | |
|---|---|
| ratio | weight (g) |
| 25/75 | 0.225 g/0.675 g |
| 30/70 | 0.270 g/0.630 g |
| 35/65 | 0.315 g/0.585 g |
| 40/60 | 0.360 g/0.540 g |
| 45/55 | 0.405 g/0.495 g |
| 50/50 | 0.450 g/0.450 g |
PVDF is a piezoelectric polymer, which has a complex structure and exhibits five crystalline phases, in which α, β, and γ were the most possible phases. The peaks of α-phase PVDF were 489, 531, 611, 765, 853, 975, 1209, and 1382 cm–1; the peaks of β-phase PVDF were 475, 510, 840, 878, 1171, and 1232 cm–1, while the peaks of γ-phase PVDF were 794 and 1284 cm–1. Therefore, it was of importance to know the effects of fillers on the structure of the PVDF matrix. The Fourier-transform infrared spectroscopy (FTIR) technique was used to obtain the structure information of PVDF in nanocomposites. The thermal properties of pure PVDF and BST/PVDF composites were investigated by using differential scanning calorimetry (DSC).
2.1. NFES Process
By comparing NFES with conventional far-field electrospinning (FFES), the NFES process showed superior mechanical stretching for the possible alignment of dipoles along the longitudinal direction of the fibers. Therefore, the piezoelectricity of fibers fabricated by NFES was better than that of FFES. The NFES system (Figure 2) consists of three main components: a high-voltage power supply, a metal spinning needle, and a reverse-polarity metal collector.
Figure 2.
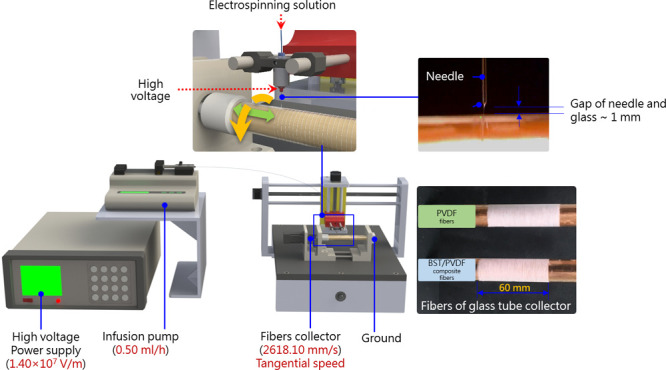
NFES process and driver system setting.
A syringe was used as a container to fill up the solution. The contents were then injected using a precise infusion pump (∼0.50 mL/h). PVDF/BST fibers were pulled out and were connected to a metal needle (inside diameter ∼0.25 mm) with a copper wire to contact the high-voltage power supply. Under the high-voltage electric field, the prominent conical drops in the needle gradually became the Taylor cone. Finally, the PVDF/BST fibers were collected in the rotating glass tube (rotating glass tangential speed ∼2618.10 mm/s).
2.2. Energy Harvester Device Design and Electrical Measurement
The IDT was made by screen printing. It had different electrode gaps (0.20, 0.40, and 0.60 mm) and different numbers of pole pairs (1, 5, 10, and 15 pairs). The detailed specifications of the IDT are shown in Figure 3. The vibration measurement system was fabricated as follows: 10 mm width piezoelectric fibers were placed on a piece of flexible PET with both ends bonded tightly to the IDT to achieve a large displacement. The electrical measurement equipment is shown in Figure 4. When the piezoelectric fibers were deformed by the polarization direction, the electrons inside the material were squeezed out to generate free electrons. The mechanical strains distributed along the fibers were converted to alternating voltage and current through the piezoelectric d33 mode. The induced electric potential and current signals from the harvester were measured by voltage and current measurement meters, respectively.
Figure 3.
Detailed specifications of IDT: (a) silver parallel electrode with different electrode gaps and (b) silver IDT with different pole pairs at 0.20 mm gap.
Figure 4.
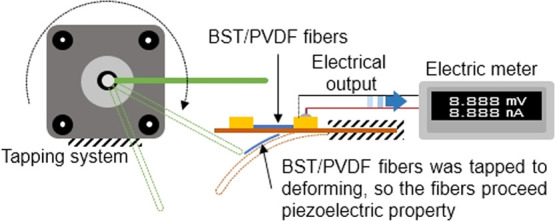
Electrical measurement equipment.
2.3. Molecular Docking
We downloaded three-dimensional structures for PubChem 66. Blind Docking was performed without considering the active site residues that have state penalties to the docking score. Further, we set the scaling of van der Waals radii to 0.8 with a partial charge cutoff of 0.15. Finally, the generated number of poses for each ligand was 100.
2.4. Molecular Dynamics Simulation
The PVDF docked complexes were subjected to molecular dynamics simulation using Desmond v4.19,20 We used the Desmond package for performing molecular dynamics simulation and the Desmond Schrödinger package for simulating the PVDF structure for 100 ns (nanoseconds). A model was developed by using water (SPC) and 1-hexadecanoyl-2--(9Z-octadecenoyl)-sn-glycero-3-phosphocholine (POPC) lipids that includes a simple point charge. Afterward, we embedded the system in SPC and POPC, and then, the system was neutralized with SPC molecules. We used the SHAKE algorithm for neutralizing heavy atom bond lengths with hydrogen particle-mesh-Ewald (PME). Periodic boundary conditions (PBCs) were used for electrostatic interactions. The simulation of the entire process of PVDF was carried out by using multistep MD simulation protocols. A maximum of 2000 iterations, with the steepest descent and limited memory Broyden Fletcher Goldfarb–Shanno (LBFGS) algorithms with 50.0 kcal/mol/Å threshold, were performed for initializing the process for minimized restraints. In a very similar manner, we again performed the minimization without any restraints in the presence of 5.0 kcal/mol/Å. In the next step, we simulated the system for nonhydrogen solute atoms in the NVT ensemble (constant number of atoms N, volume V, and temp. T) for 10 ps (pico-seconds) at 10 K temp. Furthermore, 24 ps MD simulation had been carried out for restraining all nonhydrogen solute atoms in the NPT ensemble at 300 K temp. In a very similar manner, we performed 24 ps MD simulation in order to relax the system without any restraints in the NPT ensemble while keeping the same temperature as in the previous step. For every time, steps of 2 (fs) femto second in the NPT ensembles, 100 ns each MD simulation, were carried out for the relaxed system. This procedure was performed using the berendsen thermostat restraints while maintaining the temperature at 310 K. We keep resampling the velocity at a rate of 1 ps. We continuously recoded the trajectories for every 4.8 ps. The energy was recorded for every interval of 1.2 ps. Energy in PVDF for every trajectory was examined with respect to 100 ns simulation, applying OPLS2005 (optimized potentials for liquid simulations) force fields.
2.5. Pan-Cancer Profile Analysis
We used GEPIA to interactively analyze the expression profile among 33 cancer types, 9736 tumors, and 8587 normal samples from the TCGA and the GTEx projects. We used the limma backend with a threshold of log2 fold change > 1 and a q-value < 0.05 to detect cancers exhibiting differential expression compared to the matched normal samples.
3. Results and Discussion
3.1. Surface Topography Analysis
Surface analysis of BaxSr1–xTiO3 ceramic powder was performed, and the scanning electron microscopy (SEM) results (Figure 5) show that the surface of BST ceramic powder was agglomerated after high-temperature sintering. However, after the agglomerated powder was dispersed by mechanical means, the average particle size was between ∼58 and 93 nm. At the same time, it can be seen that the BaxSr1–xTiO3 particle size increases as the ratios of Ba/Sr increases, which indicated that increasing the content of Ba in BST can promote the growth of crystal grains.
Figure 5.
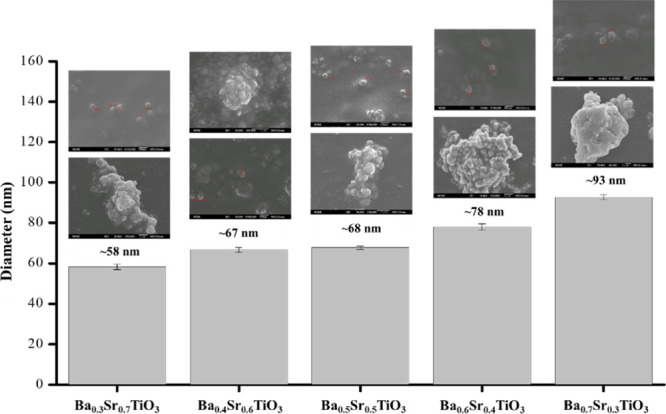
SEM analysis of BaxSr1–xTiO3 ceramic powder.
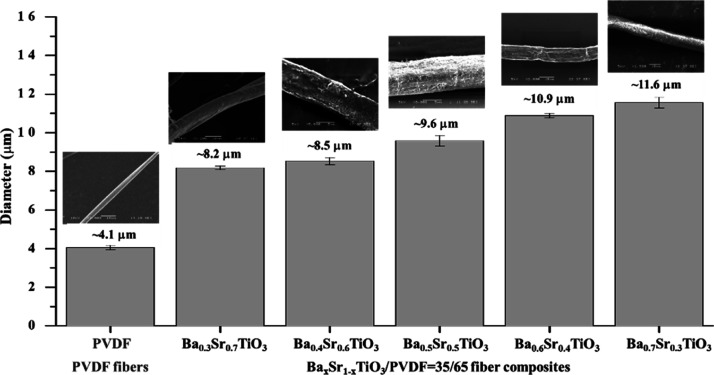
Surface analysis of BaxSr1–xTiO3/PVDF composite fibers with the SEM results (Figure 6) shows that the wire diameter of the BaxSr1–xTiO3/PVDF composite piezoelectric fibers was ∼8.2–11.6 μm and larger than ∼4.1 μm for pure PVDF piezoelectric fibers.
Figure 6.
.SEM of BaxSr1–xTiO3 with pure PVDF composite fibers with different proportions.
BST is a brittle ceramic material, and PVDF is a polymer material with better ductility. Therefore, the BST/PVDF piezoelectric fiber composite is a two-phase composite material and belongs to a heterogeneous solution. The surface of BaxSr1–xTiO3/PVDF composite fibers had an obvious pore structure.
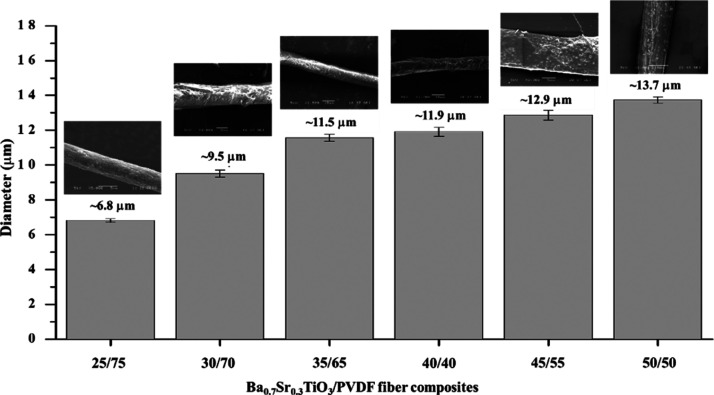
Further, the surface analysis of Ba0.7Sr0.3TiO3/PVDF composite fibers with the SEM results (Figure 7) shows that the wire diameter of Ba0.7Sr0.3TiO3/PVDF composite fibers in different proportions was ∼6.8–13.7 μm. The BST/PVDF piezoelectric fiber composite is a two-phase composite material and belongs to a heterogeneous solution. Therefore, the more theBST ceramic powder in the solution configuration, the larger the fiber wire diameter.
Figure 7.
SEM of Ba0.7Sr0.3TiO3/PVDF composite fibers with different proportions.
3.2. Material Property Analysis
3.2.1. Adding BST Ceramic Powder with Different Ba/Sr Ratios to PVDF Solution
From the results of DSC experiments, Figure 8 shows that the crystallization temperature (Tc) and melting temperature (Tm) of the BaxSr1–xTiO3/PVDF composite fibers were offset from the position of the PVDF fibers. The Tc of the PVDF fibers was ∼136.97 °C, and the BST/PVDF fibers were shifted to ∼134.89–135.54 °C. The Tm of the PVDF fibers was ∼164.74 °C, and the BST/PVDF fibers were shifted to ∼162.76–162.99 °C. We observed significant changes in the melting point and the crystallization point, indicating that BST and PVDF were miscible and have interactions between materials. Then, the structural properties of pure PVDF and BST/PVDF composites were investigated by using FTIR.
Figure 8.
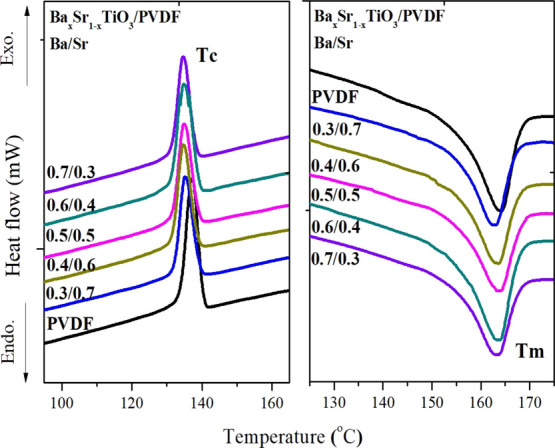
DSC of pure PVDF and BaxSr1–xTiO3/PVDF composite fibers.
From the results of FTIR experiments, it can be noted that α-phase PVDF (613 and 765 cm–1) will decrease, and β-phase PVDF with piezoelectric properties (475, 510, 840, 878, and 1431 cm–1) will increase after polarization. The structural changes of PVDF after polarization are shown in Figure 9.
Figure 9.
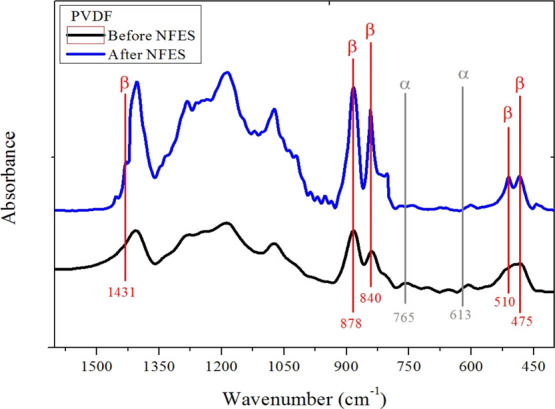
FTIR analysis results of pure PVDF solution after the NFES process.
The α-phase crystal was most common in the unpolarized PVDF powder and film, and the β-phase was the most important crystalline phase to account for piezoelectric properties. Thus, the α-phase crystal was converted into the β-phase crystal by polarization. The dipole moments of the β-phase crystal were polarized directionally, and the dipole moments arranged in the same direction to provide the PVDF possessing piezoelectric property. Therefore, the content of β-phase represented the piezoelectric strength of PVDF. According to the observation, the crystal lattice of the original PVDF powder was the α-phase crystal, without the piezoelectric property, before the manufacturing process. PVDF fibers were converted from a common α-phase crystal without a piezoelectric property into the β-phase crystal after the NFES process so that the PVDF fibers were able to have a piezoelectric property.
When the BST ceramic powder was blended with the PVDF polymer, it affects the dispersion of the ceramic filler in the polymer matrix and also the dielectric properties of the composite. Figure 10 shows that the BST/PVDF-blended solution with BST ceramic powder still has the α-, β-, and γ-phases of PVDF. It was indicated that ferroelectric material BST can induce the increase of β-phase PVDF, while the peaks of Si–O–Si (1019 cm–1) and O–Ti–O (936 cm–1) bonds almost disappeared after the NFES process.
Figure 10.
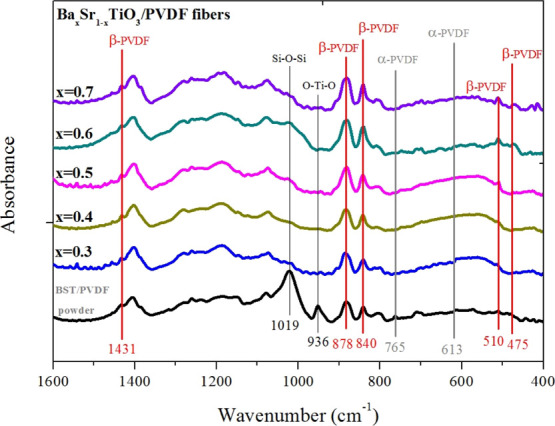
FTIR analysis results of pure BST/PVDF solution after the NFES process.
3.2.2. BST/PVDF Composite Piezoelectric Fibers Prepared by Different Proportions of BST/PVDF-Blended Solution
As shown in Figure 11, the PVDF piezoelectric fibers and BST/PVDF composite piezoelectric fibers have an endothermic peak between ∼150 and 170 °C. The BST/PVDF composite piezoelectric fibers began to melt at ∼155 °C and remained molten until the temperature increased to ∼165 °C and melts completely. The appearance of the endothermic peak was due to the melting endothermic reaction of PVDF and the polymer change of the crystal phase.
Figure 11.
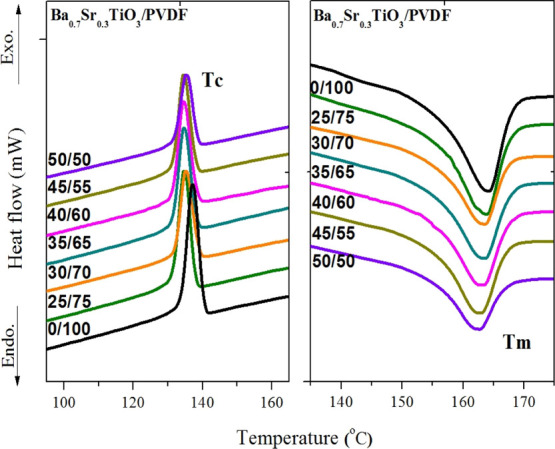
DSC of Ba0.7Sr0.3TiO3/PVDF composite fibers.
The composite piezoelectric fibers had an exothermic peak between ∼130 and 145 °C, and the exothermic peak was due to the crystallization exothermic reaction of PVDF near ∼130–145 °C. The experimental results show that the addition of Ba0.7Sr0.3TiO3 ceramic powder will affect the crystallinity of Ba0.7Sr0.3TiO3/PVDF piezoelectric composite fibers. The crystallinity of Ba0.7Sr0.3TiO3/PVDF piezoelectric composite fibers changed with the content of Ba0.7Sr0.3TiO3 ceramic powder. When the BST ceramic powder content was 25–40%, the crystallinity of the fibers increased with the amount of addition; when the content was more than 40%, the crystallinity decreased. It was speculated that the addition of excessive BST ceramic powder (>40%) may cause aggregation in the electrospinning-blended solution, causing the electrospinning solution to disperse unevenly. The electrospinning solution agglomerated with each other and affected its crystallization condition, resulting in a decrease in crystallinity. The absolute crystallinity of PVDF and BST/PVDF composite piezoelectric fibers can be calculated by the following formula21
| 1 |
where ΔHm0 is the melting enthalpy of the test sample, ΔHm is the melting enthalpy of the 100% crystalline sample, ΔHm of PVDF is 104.70 J/g,22 and Wpolymer is the weight fraction of the polymer substrate. Table 3 shows Tm, ΔHm, and crystallinity of PVDF and BST/PVDF composite fibers.
Table 3. Tm, ΔHm, and Crystallinity of PVDF and BST/PVDF Composite Fibers.
| material | Tm (°C) | ΔHm (J/g) | Xc (%) |
|---|---|---|---|
| PVDF = 100 | 164.18 | 20.46 | 19.54 |
| Ba0.7Sr0.3TiO3/PVDF = 25/75 | 163.72 | 17.91 | 22.81 |
| Ba0.7Sr0.3TiO3/PVDF = 30/70 | 163.52 | 17.45 | 23.81 |
| Ba0.7Sr0.3TiO3/PVDF = 35/65 | 163.50 | 17.32 | 25.45 |
| Ba0.7Sr0.3TiO3/PVDF = 40/60 | 163.29 | 16.24 | 25.85 |
| Ba0.7Sr0.3TiO3/PVDF = 45/55 | 162.90 | 13.47 | 23.39 |
| Ba0.7Sr0.3TiO3/PVDF = 50/50 | 161.62 | 11.42 | 21.81 |
Figure 12 represents the FTIR spectra of Ba0.7Sr0.3TiO3/PVDF composite fibers. The peak at 613 and 765 cm–1 corresponded to α-phase PVDF. The bands at 613 and 765 cm–1 were attributed to the bending and wagging vibration of CF2 groups and rocking vibration in the PVDF chain, respectively.23
Figure 12.
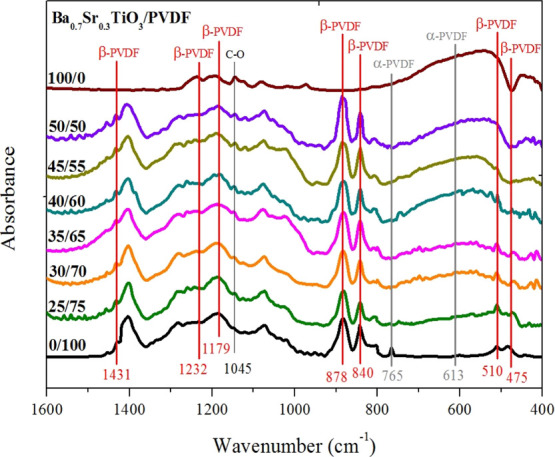
FTIR analysis of Ba0.7Sr0.3TiO3/PVDF composite fibers with different proportions.
The peaks at 840, 878, 1179, and 1232 cm–1 corresponded of the β-phase. The band at 878 cm–1 was assigned to the CH2 and CF2 groups generated from CH2 rocking and CF2 stretching, whereas the bands at 1179 and 1232 cm–1 were assigned to the CH2 group, which was associated with CH2 wagging and rocking.24 The incorporation of BST crystallites promoted the β-phase of PVDF; which was desirable for various applications because of their ferroelectric properties.25 It can be seen that as we increase the BST powder, the peaks of the absorption spectrum for β-phase PVDF grows slightly.
3.2.3. X-ray Diffraction Analysis of Adding BST Ceramic Powder to PVDF Solution
X-ray diffraction (XRD) analysis of the BST/PVDF composite piezoelectric fibers is shown in Figure 13. The optimal fraction of BST ceramic powder and the PVDF material was investigated as 50% each. The ratio of BST was 70% barium and 30% strontium which was expressed as Ba0.7Sr0.3TiO3. The XRD result shows that the intensity of the αphase and β-phase on the pure PVDF fiber and BST/PVDF composite fiber was of minor difference; it means that the BST ceramic powder added to the PVDF material becomes a composite material which was different from the compound material. It could be inferred that the different phase fractions of the α-phase and β-phase effect for the BST/PVDF composites fiber were not significant. Therefore, the BST/PVDF composites were able to improve piezoelectricity because of the multiplication effect.
Figure 13.
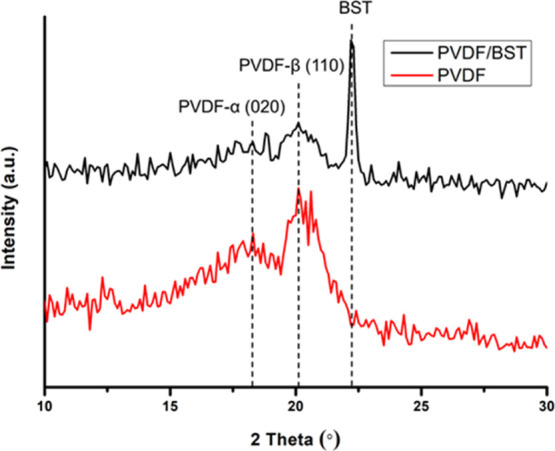
XRD analysis results of the PVDF fiber and BST/PVDF composite piezoelectric fiber.
3.3. Mechanical Characteristic Analysis
3.3.1. Adding BST Ceramic Powder with Different Ba/Sr Ratios to PVDF Solution
We employed a microtensile test setup to investigate the ultimate stress and Young’s modulus of the BST/PVDF composite fibers and to construct load–displacement curves to obtain critical information regarding their mechanical properties. Figure S1 displays the stress–strain curves of the PVDF and BST/PVDF composite fibers. The results show that the maximum tensile strength of pure PVDF fibers was ∼40.21 MPa, and the Young’s coefficient was ∼1.27 GPa. After adding BST ceramic powder, the tensile strength and Young’s modulus of the fibers were increased (Figure S2, Table 4). The maximum tensile strength of Ba0.7Sr0.3TiO3/PVDF composite fibers was ∼70.45 MPa, and the Young’s coefficient was ∼2.92 GPa. BST is a brittle ceramic material, and PVDF is a ductile material. The brittle material has large hardness, tensile strength, and Young’s modulus. Conversely, the ductile material has a tensile elongation at break. Therefore, after adding BST ceramic powder in PVDF piezoelectric fibers, the tensile strength and Young’s modulus of the fibers can be improved.
Table 4. Axial Force, Ultimate Tensile Load, Ultimate Stress, and Young’s Modulus of Pure PVDF and BaxSr1–xTiO3/PVDF = 35/65 Composite Fibers.
| material | axial force (kgf) | ultimate tensile load (N) | ultimate stress (MPa) | Young’s modulus (GPa) |
|---|---|---|---|---|
| PVDF | 408 × 10–4 | 400.10 × 10⁻³ | 40.21 | 1.27 |
| Ba0.3Sr0.7TiO3 | 527 × 10–4 | 516.70 × 10⁻³ | 51.50 | 2.53 |
| Ba0.4Sr0.6TiO3 | 669 × 10–4 | 655.70 × 10⁻³ | 65.63 | 2.74 |
| Ba0.5Sr0.5TiO3 | 679 × 10–4 | 655.60 × 10⁻³ | 65.64 | 2.90 |
| Ba0.6Sr0.4TiO3 | 726 × 10–4 | 711.60 × 10⁻³ | 71.22 | 2.78 |
| Ba0.7Sr0.3TiO3 | 723 × 10–4 | 708.50 × 10⁻³ | 70.45 | 2.92 |
3.3.2. 3BST/PVDF Composite Piezoelectric Fibers Prepared by Different Proportions of BST/PVDF-Blended Solution
We employed a tensile test setup to investigate the ultimate stress and the Young’s modulus of the BST/PVDF composite fibers and to construct load–displacement curves to obtain critical information regarding their mechanical properties.
Figure S3 displays the stress–strain curves of the Ba0.7Sr0.3TiO3/PVDF composite fibers. The results (Figure S4, Table 5) show that the more the BST ceramic powder is added, the larger the fiber tensile strength and Young’s modulus. The maximum tensile strength of Ba0.7Sr0.3TiO3/PVDF = 50/50 was ∼74.92 MPa, and the Young’s coefficient was ∼3.74 GPa. The experimental results were in accordance with the previous results. When the content of BST ceramic powder in PVDF increases, the tensile strength and Young’s modulus of the fibers can be effectively improved.
Table 5. Tensile Stress–Strain of Pure PVDF and Ba0.7Sr0.3TiO3/PVDF Composite Fibers.
| material | axial force (kgf) | ultimate tensile load (N) | ultimate stress (MPa) | Young’s modulus (GPa) |
|---|---|---|---|---|
| Ba0.7Sr0.3TiO3/PVDF = 25/75 | 606 × 10–4 | 593.80 × 10⁻³ | 59.62 | 2.54 |
| Ba0.7Sr0.3TiO3/PVDF = 30/75 | 625 × 10–4 | 612.50 × 10⁻³ | 61.01 | 2.71 |
| Ba0.7Sr0.3TiO3/PVDF = 35/65 | 723 × 10–4 | 708.50 × 10⁻³ | 70.45 | 2.92 |
| Ba0.7Sr0.3TiO3/PVDF = 40/60 | 748 × 10–4 | 733.10 × 10⁻³ | 73.33 | 3.53 |
| Ba0.7Sr0.3TiO3/PVDF = 45/55 | 749 × 10–4 | 734.10 × 10⁻³ | 73.45 | 3.73 |
| Ba0.7Sr0.3TiO3/PVDF = 50/50 | 737 × 10–4 | 722.30 × 10⁻³ | 74.92 | 3.74 |
3.4. Electrical Measurement
A flexible piezoelectric harvester for operation under low-frequency ambient forces was designed. The piezoelectric characteristics of pure PVDF piezoelectric fibers and BST/PVDF composite piezoelectric fibers were measured, including the voltage and current generated by the fibers with strain.
BST ceramic powder with different Ba/Sr ratios was added to PVDF solution to compare the output voltage of pure PVDF and BaxSr1–xTiO3/PVDF composite piezoelectric fibers under fixed experimental parameters. First, we added BST powder of different Ba/Sr ratios to the PVDF solution, and the BaxSr1–xTiO3/PVDF energy harvester was measured at different frequencies 1–4 Hz. Figures S5 and S6 show that the output voltage of the BaxSr1–xTiO3/PVDF energy harvester was higher than that of pure PVDF. So, an addition of BST ceramic powder can increase the output voltage of the piezoelectric fibers. When the ratio was Ba/Sr = 0.7/0.3, the BST ceramic powder can obtain the maximum dielectric constant. Therefore, we used Ba0.7Sr0.3TiO3 powder for the subsequent experiment.
BST/PVDF composite piezoelectric fibers were prepared with different proportions of BST/PVDF-blended solution with an objective to compare the output voltage of six different ratios of Ba0.7Sr0.3TiO3/PVDF composite piezoelectric fibers.
Six different ratios (25–50%) of Ba0.7Sr0.3TiO3/PVDF composite piezoelectric fibers with different electrode gaps (0.20, 0.40, and 0.60 mm) of parallel electrodes were discussed. We compared different ratios of the Ba0.7Sr0.3TiO3/PVDF energy harvester at 4 Hz to find the best electrode gap of the IDT. Figure S7 shows that the gap between the electrode is inversely proportional to the output voltage of the energy harvester. The output voltage of the energy harvester was the highest when the parallel electrode gap was 0.20 mm with Ba0.7Sr0.3TiO3/PVDF = 50/50. Figure S8 shows that it has a maximum output voltage of ∼280 mV and a maximum output current of ∼261 nA at a strain rate of 5.20 × 10⁻³ s–1.
Further, the relationship between the frequency and the output voltage of the energy harvester was discussed. We compared different ratios of the Ba0.7Sr0.3TiO3/PVDF energy harvester when the electrode gap was 0.20 mm to find the best frequency. The energy harvester was beating at different frequencies 1–10 Hz. Figure S9 shows that the frequency is proportional to the output voltage of the energy harvester. The output voltage of the energy harvester was the highest when the parallel electrode gap was 0.20 mm with Ba0.7Sr0.3TiO3/PVDF = 50/50 at 9 Hz. Figure S10 shows that it has a maximum output voltage of ∼692 mV and a maximum output current of ∼316 nA at a strain rate of 7.80 × 10⁻³ s–1.
Finally, the relationship between the number of pole pairs and the output voltage of the energy harvester was discussed. We compared different ratios of the Ba0.7Sr0.3TiO3/PVDF energy harvester at a frequency of 9 Hz to find the best number of pole pairs.
Figure S11 shows that the frequency is inversely proportional to the output voltage of the energy harvester. The output voltage of the energy harvester was the highest when the parallel electrode gap was 0.20 mm, and the number of pole pairs was 5 pairs with Ba0.7Sr0.3TiO3/PVDF = 50/50 at 9 Hz.
Later, the Ba0.7Sr0.3TiO3/PVDF = 50/50 composite piezoelectric fibers were repolarized with the IDT (0.20 mm electrode gap and 5 pole pairs). Before polarization, the water in the fibers must be completely evaporated to avoid failure (Figure S12a). The energy harvester is placed in the heater (heating temperature was about 65 °C) and then polarized with high voltage. The polarization was performed at a voltage of 1400 V for 1 h (Figure S12b).
Moreover, the BST/PVDF energy harvesters could be modeled with a load resistor for the impedance matching test. Figure S13 shows that the Ba0.7Sr0.3TiO3/PVDF = 50/50 composite fibers after repolarization have a load voltage of ∼576 mV and an output power of ∼24463.11 pW when the external resistance was 13.60 MΩ at a frequency of 9 Hz.
3.5. Molecular Modeling Approach
Compound–compound docking of PVDF and BST showed a potential energy of 3.836, as shown in Figure 14.
Figure 14.
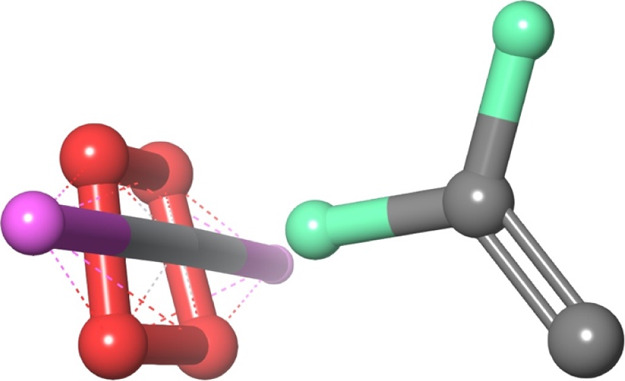
Representation of BST (magenta) interaction with PVDF (light green).
3.6. Molecular Dynamics Simulations
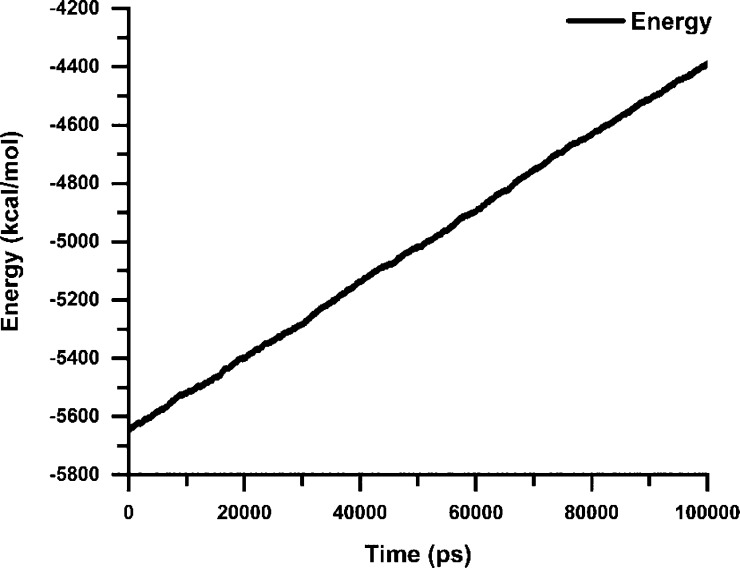
In accordance with docking scores of PVDF and BST, the performed MD simulation was noted in order to get noble stability across 100 ns, PVDF, and BST energy and potential energy, and analysis of the complex is demonstrated in Figures 15 and 16 for greater recognition of fluctuation. The moieties form strong interactions with side chains.
Figure 15.
Shows various curves that signify MD simulation investigation for PVDF and BST in 100 ns time. X-axis stands for the time in picoseconds (100 ns), and Y-axis shows the energy in kcal/mol.
Figure 16.
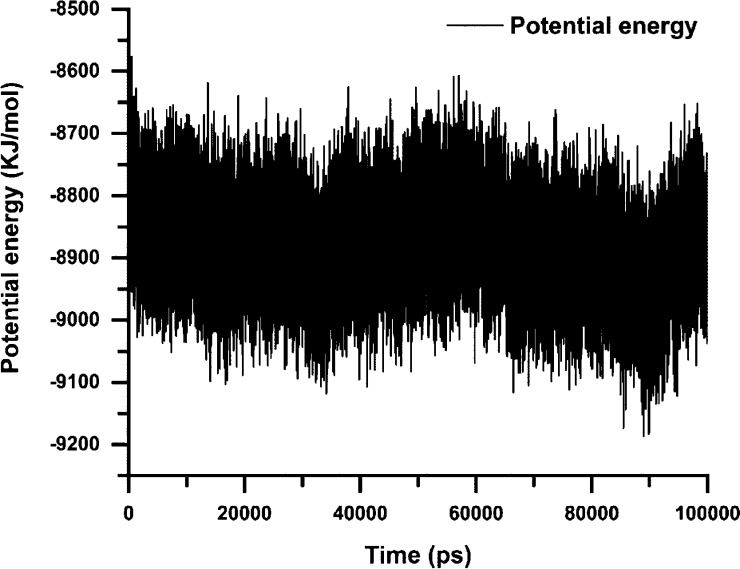
Indicates MD simulation (potential energy) analysis for PVDF and BST in 100 ns time. X-axis represents the time in picosecond (100 ns), and Y-axis represents the potential energy.
3.7. Energy Analysis of PVDF and BST
Figure 14 shows the representation of BST (magenta) interaction with PVDF (light green). Figure 15 indicates energy of system analysis for PVDF and BST during 100 ns time which has been recorded between −5800 and −4400 for noble stability. Molecular dynamics (MD) simulations presented an observation of dynamic perturbations along the complex of PVDF, lipids, and water molecules. MD simulation of the PVDF structure was optimized through 100 ns MD simulation which was performed by the Desmond Schrödinger package using Monte Carlo simulations at 300 K transition temperature and pressure 1.355 bar.
Figure 15 depicts the energy (kcal/mol) of carbon α (Cα) atoms of PVDF over a period of 100 ns, and Figure 16 depicts the potential energy (kcal/mol) of carbon alpha atoms of PVDF over a period of 100 ns from the reference frame (initial) in the trajectory to the final frame trajectory. The trajectory was analyzed for the production phase.
3.8. Potential Energy Analysis of PVDF and BST
As indicated by Figure 16, potential energy peaks represent MD simulation analysis for PVDF and BST in 100 ns time which have been recorded between −9000 and −8700 for noble stability as detected at the time of simulation.
3.9. Pan-Cancer Expression Landscape
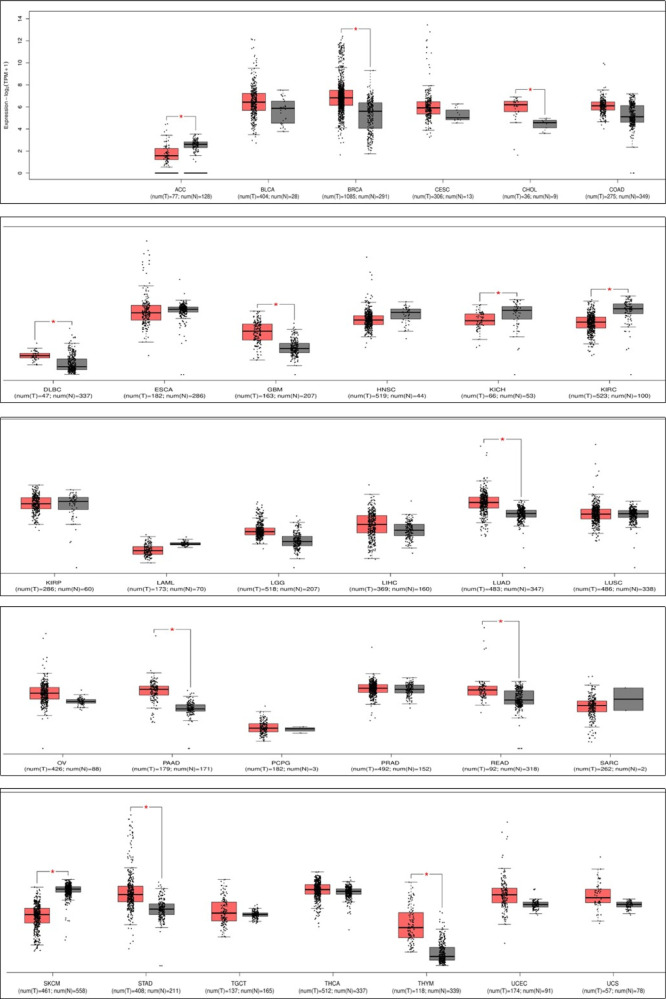
The results of our evaluation of the expression landscape from TCGA cohorts are shown in Figure 17. Among all of the 31 cancer types, most frequently mutated is rectal adenocarcinoma (READ), breast invasive carcinoma (BRCA), lung adenocarcinoma (LUAD), pancreatic adenocarcinoma (PAAD), and stomach adenocarcinoma (STAD). Also, cancers with high PVDF expression include READ, PAAD, LUAD, and BRCA. Among all of the cancer types, LUAD and BRCA show significant higher expression in the tumor tissue compared to healthy tissues. It is worth noting that PVDF in LUAD and BRCA is both hypermutated and significantly upregulated compared to that in normal tissues. This pattern implies that alterations in T-cell homing may have undiscovered effects on the pathophysiology of LUAD and BRCA. We found that the PVDF expression in LUAD and BRCA is significantly higher than in matched normal tissues, and the PVDF expression is significantly positively correlated with the prognoses of READ, BRCA, STAD, and LUAD. Furthermore, after the identification of BRCA in four cancer types, we observed that altered PVDF expression patterns could impact both T-cell and B-cell immunity in cancer.
Figure 17.
DEG analysis: box diagram of DEGs in TCGA cohorts among all of the 31 cancer types.
3.10. Expression and Prognostic Association in Pan-Carcinoma
To evaluate PVDF expression and prognosis in pan-carcinoma, we used the pretrain multiple variate Cox regression model, which combined the specific gene expression value and basic clinical data provided by OncoLnc to extract the TCGA cohorts of which the prognosis is significant with the PVDF expression value. In addition, based on Cox coefficients, the prognoses of BRCA, READ, and LUAD are negatively associated with PVDF expression.
Then, we stratified the patients in each cohort based on expression quintiles into high- and low-expression groups.
PVDF can reduce the inflammation level in the large intestine by controlling T-cell homing. We thus hypothesized that the high expression of PVDF in BRCA reduces inflammation in the breast, which in turn results in better prognosis. This pattern was also observed in BRCA and LUAD, which suggests that PVDF may perform similar immunity control functions in head, neck, and lung tissues. However, the observed upregulation of PVDF in BRCA implies poorer prognosis. The results of single variable survival analysis were in accordance with expression and prognosis association in pan-cancers (Supporting Information Figure S14).
4. Conclusions
We successfully demonstrated the use of NFES for fabricating BaxSr1–xTiO3 (BST)/poly(vinylidene fluoride) (PVDF) piezoelectric fiber composites with excellent mechanical properties and chemical properties. The experimental results show that the conductivity of Ba0.7Sr0.3TiO3/PVDF = 50/50 solution (48.81 μS/cm) was better than that of PVDF solution (38.40 μS/cm). BST powder was blended with PVDF solution uniformly to prepare BST/PVDF solution. BST/PVDF piezoelectric fiber composites at a high electric field of 1.4 × 10⁷ V/m with enhanced piezoelectricity were collected orderly on a rotating glass collector at a tangential velocity of 2618.10 mm/s. The average particle size of the BaxSr1–xTiO3 ceramic powder was ∼58–93 nm measured by SEM observation, and the BST average particle size tended to increase as the Ba/Sr ratios increase. It was indicated that increasing the content of Ba in the BST ceramic powder can promote the growth of crystal grains. The diameter of BST/PVDF composite piezoelectric fibers (∼6.8–13.7 μm) was larger than that of pure PVDF (∼4.1 μm). The thermal properties and structural properties of pure PVDF and BST/PVDF composite fibers showed that BST and PVDF were miscible and have interactions between materials, and the incorporation of BST powder promoted the β-phase of PVDF. The tensile strength and Young’s modulus of the BST/PVDF composite piezoelectric fibers were higher than those of pure PVDF, and when the content of BST ceramic powder in PVDF was increased, the tensile strength and the Young’s modulus of the fibers can be effectively improved. Besides this, the electromechanical energy conversion efficiency of the BST/PVDF energy harvester was two times higher than that of pure PVDF energy harvesters. The output voltage of the Ba0.7Sr0.3TiO3/PVDF = 50/50 energy harvester was the highest when the IDT electrode gap was 0.20 mm and the number of pole pairs was 5 pairs at 9 Hz. It has a maximum output voltage of ∼667 mV and a maximum output current of ∼310 nA at a strain rate of 7.80 × 10⁻³ s–1. The Ba0.7Sr0.3TiO3/PVDF = 50/50 energy harvester had a maximum output voltage of ∼1025 mV and a maximum output current of ∼398 nA at a strain rate of 7.80 × 10⁻³ s–1 after repolarization. These characteristics demonstrate the applicability of the composite in various intended applications. We present a comparison of PVDF affinity through wet lab experiments and computational simulation, showing which has the potential to offer a specific sensor. PVDF was obtained from the computational model and then BST and PVDF interactions were studied with each other using the docking score. Genomic outcomes suggested that PVDF might play crucial role in cancer, and the analytical protocol will improve the previous methods used to identify cancer based on multilevel data from the patients. The PVDF expression level was significantly correlated with the presence of four types of cancer.
We performed the docking and MD simulation for polycaprolactone and doxorubicin hydrochloride interaction that showed their binding affinity and was later validated as potential inhibitors. Additionally, we have successfully established the dynamic behavior of an entire biochemical pathway in the presence of polycaprolactone with doxorubicin hydrochloride using the systems biology approach. These BST/PVDF piezoelectric fiber composites with good piezoelectricity have immense potentials as wearable sensors and energy harvester applications. We present PVDF as the best potential sensor which could be considered in the development of new therapeutic agents for multiple diseases. Our results suggest that PVDF might play an important role in cancer therapy design. In addition, our novel analytical protocol can serve as a template for a new method to identify an effective anti-cancer carrier based on multilevel data from the patients. Pan-cancer omics analysis revealed that alteration of the PVDF expression level was significantly correlated with the presence of four types of cancer.
Acknowledgments
This work was supported by Kaohsiung Armed Forces General Hospital [grant number 108-35].
Glossary
Abbreviations
- BST
BaxSr1–xTiO3
- DSC
differential scanning calorimetry
- FFES
far-field electrospinning
- FTIR
Fourier transform infrared
- IDT
interdigital electrode
- IoT
internet of Things
- LBFGS
limited memory Broyden Fletcher Goldfarb–Shanno
- MD
molecular dynamics
- NFES
near-field electrospinning
- PBC
periodic boundary conditions
- PME
particle-mesh-Ewald
- PVDF
poly(vinylidene fluoride)
- SEM
scanning electron microscope
Supporting Information Available
The Supporting Information is available free of charge at https://pubs.acs.org/doi/10.1021/acsomega.0c00805.
Tensile stress–strain diagram of pure PVDF and BaxSr1–xTiO3/PVDF composite fibers; relationship between the Young’s modulus and the tensile strength of BaxSr1–xTiO3/PVDF = 35/65 composite fibers; tensile stress–strain diagram of pure PVDF and Ba0.7Sr0.3TiO3/PVDF composite fibers; relationship between the Young’s modulus and the tensile strength of Ba0.7Sr0.3TiO3/PVDF composite fibers; relationship between the frequency and the output voltage of the PVDF and BST/PVDF energy harvester; output voltage of PVDF and Ba0.7Sr0.3TiO3/PVDF piezoelectric fibers tapping parallel electrodes at 4 Hz; relationship between the parallel electrode gap and voltage of different ratios; Ba0.7Sr0.3TiO3/PVDF = 50/50 composite piezoelectric fibers at a parallel gap of 0.20 mm and a frequency of 4 Hz; relationship between the frequency and the voltage of Ba0.7Sr0.3TiO3/PVDF piezoelectric fibers with different ratios of 0.20 mm parallel electrodes; Ba0.7Sr0.3TiO3/PVDF = 50/50 composite piezoelectric fibers at a parallel gap of 0.20 mm and a frequency of 9 Hz; relationship between the pole number and the voltage of Ba0.7Sr0.3TiO3/PVDF piezoelectric fibers; polarization of composites fibers (a) collapsed electrode with polarization failure and (b) BST/PVDF composites fibers attached to the IDT for 1 h repolarization process (1400 V and 65 °C); load voltage and output power of the Ba0.7Sr0.3TiO3/PVDF = 50/50 energy harvester; expression landscape from in TCGA cohorts; and pan-cancer expression landscape where “T” stands for tumor tissue and “N” stands for paired normal tissue and expression abundance is measured by log-normalized transcripts per million (TPM) (PDF)
Figures of results obtained from the various experiments conducted (ZIP)
Author Contributions
# C.-T.P., S.-Y.W., C.-K.Y., A.K., and A.C.K. contributed equally. All authors conceptualized the ideas, conducted the literature search, prepared the experiments, and drafted the manuscript. All authors have read and approved the manuscript.
The authors declare no competing financial interest.
Supplementary Material
References
- Hou Y.; Wang L.; Wang D.; Yang H.; Guo M.; Ye Z.; Tong X. A preliminary study on the IoT-based pavement monitoring platform based on the piezoelectric-cantilever-beam powered sensor. Adv. Mater. Sci. Eng. 2017, 2017, 1. 10.1155/2017/4576026. [DOI] [Google Scholar]
- Bogue R. Energy harvesting and wireless sensors: a review of recent developments. Sens. Rev. 2009, 29, 194. 10.1108/02602280910967594. [DOI] [Google Scholar]
- Fang S.; Shen L.; Zheng H.; Zhang X. Ge–graphene–carbon nanotube composite anode for high performance lithium-ion batteries. J. Mater. Chem. A 2015, 3, 1498–1503. 10.1039/c4ta04350b. [DOI] [Google Scholar]
- Gao X.-W.; Deng Y.-F.; Wexler D.; Chen G.-H.; Chou S.-L.; Liu H.-K.; Shi Z.-C.; Wang J.-Z. Improving the electrochemical performance of the LiNi 0.5 Mn 1.5 O 4 spinel by polypyrrole coating as a cathode material for the lithium-ion battery. J. Mater. Chem. A 2015, 3, 404–411. 10.1039/c4ta04018j. [DOI] [Google Scholar]
- Sudevalayam S.; Kulkarni P. Energy harvesting sensor nodes: Survey and implications. IEEE Commun. Surv. Tutorials 2010, 13, 443–461. 10.1109/surv.2011.060710.00094. [DOI] [Google Scholar]
- Vullers R.; Schaijk R.; Visser H.; Penders J.; Hoof C. Energy harvesting for autonomous wireless sensor networks. IEEE Solid State Circ. Mag. 2010, 2, 29–38. 10.1109/mssc.2010.936667. [DOI] [Google Scholar]
- Ma D.; Lan G.; Xu W.; Hassan M.; Hu W.. SEHS: Simultaneous energy harvesting and sensing using piezoelectric energy harvester. In 2018 IEEE/ACM Third International Conference on Internet-of-Things Design and Implementation (IoTDI), 2018; pp 201–212.
- Yee W. A.; Kotaki M.; Liu Y.; Lu X. Morphology, polymorphism behavior and molecular orientation of electrospun poly (vinylidene fluoride) fibers. Polymer 2007, 48, 512–521. 10.1016/j.polymer.2006.11.036. [DOI] [Google Scholar]
- Gao K.; Hu X. G.; Yi T. F.; Chen H. Preparation and Electrochemical Properties of Electrospun Poly(vinylidene fluoride) Membranes. Acta Polym. Sin. 2006, 97, 1050–1054. 10.3724/sp.j.1105.2006.01050. [DOI] [Google Scholar]
- Greiner A.; Wendorff J. H. Electrospinning: a fascinating method for the preparation of ultrathin fibers. Angew. Chem., Int. Ed. 2007, 46, 5670–5703. 10.1002/anie.200604646. [DOI] [PubMed] [Google Scholar]
- Huang Z.-M.; Zhang Y.-Z.; Kotaki M.; Ramakrishna S. A review on polymer nanofibers by electrospinning and their applications in nanocomposites. Compos. Sci. Technol. 2003, 63, 2223–2253. 10.1016/s0266-3538(03)00178-7. [DOI] [Google Scholar]
- Gualtieri J. G.; Kosinski J. A.; Ballato A. Piezoelectric materials for acoustic wave applications. IEEE Trans. Sonics Ultrason. 1994, 41, 53–59. 10.1109/58.265820. [DOI] [Google Scholar]; Ballato A.1996 IEEE Ultrasonics Symposium. Proceedings; IEEE, 2002; Vol. 1, pp 575–583.
- Han R.; Jin J.; Khanchaitit P.; Wang J.; Wang Q. Effect of crystal structure on polarization reversal and energy storage of ferroelectric poly (vinylidene fluoride-co-chlorotrifluoroethylene) thin films. Polymer 2012, 53, 1277–1281. 10.1016/j.polymer.2012.02.004. [DOI] [Google Scholar]
- Wang Q.; Zhu L. J. Polym. Sci., Part B: Polym. Phys. 2003, 55, 403. [Google Scholar]
- Bairagi S.; Ali S. W. Poly (vinylidine fluoride)(PVDF)/Potassium Sodium Niobate (KNN) nanorods based flexible nanocomposite film: Influence of KNN concentration in the performance of nanogenerator. Org. Electron. 2020, 78, 105547. 10.1016/j.orgel.2019.105547. [DOI] [Google Scholar]
- Bairagi S.; Ali S. W. Influence of High Aspect Ratio Lead-Free Piezoelectric Fillers in Designing Flexible Fibrous Nanogenerators: Demonstration of Significant High Output Voltage. Energy Technol. 2019, 7, 1900538. 10.1002/ente.201900538. [DOI] [Google Scholar]
- Bairagi S.; Ali S. W. Effects of surface modification on electrical properties of KNN nanorod-incorporated PVDF composites. J. Mater. Sci. 2019, 54, 11462–11484. 10.1007/s10853-019-03719-x. [DOI] [Google Scholar]
- Shaohui L.; Jiwei Z.; Jinwen W.; Shuangxi X.; Wenqin Z. Enhanced energy storage density in poly (vinylidene fluoride) nanocomposites by a small loading of suface-hydroxylated Ba0. 6Sr0. 4TiO3 nanofibers. ACS Appl. Mater. Interfaces 2014, 6, 1533–1540. 10.1021/am4042096. [DOI] [PubMed] [Google Scholar]
- Bowers K. J.; Chow D. E.; Xu H.; Dror R. O.; Eastwood M. P.; Gregersen B. A.; Klepeis J. L.; Kolossvary I.; Moraes M. A.; Sacerdoti F. D.; Salmon J. K.. Scalable algorithms for molecular dynamics simulations on commodity clusters. SC ’06: Proceedings of the 2006 ACM/IEEE Conference on Supercomputing; IEEE, Nov 11, 2006; p 43.
- Jiang W.; Phillips J. C.; Huang L.; Fajer M.; Meng Y.; Gumbart J. C.; Luo Y.; Schulten K.; Roux B. Generalized scalable multiple copy algorithms for molecular dynamics simulations in NAMD. Comput. Phys. Commun. 2014, 185, 908–916. 10.1016/j.cpc.2013.12.014. [DOI] [PMC free article] [PubMed] [Google Scholar]
- Bouapao L.; Tsuji H.; Tashiro K.; Zhang J.; Hanesaka M. Crystallization, spherulite growth, and structure of blends of crystalline and amorphous poly (lactide) s. Polymer 2009, 50, 4007–4017. 10.1016/j.polymer.2009.06.040. [DOI] [Google Scholar]
- Du C.-H.; Xu Y.-Y.; Zhu B.-K. Plasticizer effect of dibutyl phthalate on the morphology and mechanical properties of hard elastic poly (vinylidene fluoride) fibers. J. Appl. Polym. Sci. 2009, 114, 3645–3651. 10.1002/app.30105. [DOI] [Google Scholar]
- Zak A. K.; Gan W. C.; Majid W. H. A.; Darroudi M.; Velayutham T. S. Experimental and theoretical dielectric studies of PVDF/PZT nanocomposite thin films. Ceram. Int. 2011, 37, 1653. 10.1016/j.ceramint.2011.01.037. [DOI] [Google Scholar]
- Yu L.; Cebe P. Crystal polymorphism in electrospun composite nanofibers of poly (vinylidene fluoride) with nanoclay. Polymer 2009, 50, 2133–2141. 10.1016/j.polymer.2009.03.003. [DOI] [Google Scholar]
- Gupta P.; Kumar A.; Tomar M.; Gupta V.; Singh D. P. Enhanced dielectric properties and suppressed leakage current density of PVDF composites flexible film through small loading of submicron Ba 0.7 Sr 0.3 TiO 3 crystallites. J. Mater. Sci.: Mater. Electron. 2017, 28, 11806–11812. 10.1007/s10854-017-6987-2. [DOI] [Google Scholar]
Associated Data
This section collects any data citations, data availability statements, or supplementary materials included in this article.


