

Abstract
We propose a coordination framework for managing urban and rural organic waste in a scalable manner by orchestrating waste exchange, transportation, and transformation into value-added products. The framework is inspired by coordinated management systems that are currently used to operate power grids across the world and that have been instrumental in achieving high levels of efficiency and technological innovation. In the proposed framework, suppliers and consumers of waste and derived products as well as transportation and technology providers bid into a coordination system that is operated by an independent system operator. Allocations and prices for waste and derived products are obtained by the operator by solving a dispatch problem that maximizes the social welfare and that balances supply and demand across a given geographical region. Coordination enables handling of complex constraints and interdependencies that arise from transportation and bio-physico-chemical transformations of waste into products. We prove that the coordination system delivers prices and product allocations that satisfy economic and efficiency properties of a competitive market. The framework is scalable in that it can provide open access that fosters transactions between small and large players in urban and rural areas and over wide geographical regions. Moreover, the framework provides a systematic approach to enable coordinated responses to externalities such as droughts and extreme weather events, to monetize environmental impacts and remediation, to achieve complex social goals such as geographical nutrient balancing, and to justify technology investment and development efforts. Furthermore, the framework can facilitate coordination with electrical, natural gas, water, and transportation, and food distribution infrastructures.
Keywords: organic waste, markets, coordination, interdependencies
1. Introduction
Urban, agricultural, and food sectors produce significant amounts of organic waste in the form of livestock waste, food waste, and biosolids from wastewater processing. To give some perspective, the dairy sector in the U.S. State of Wisconsin is a 43 billion USD enterprise that manages 1,270,000 dairy cows [1, 2] and provides 29 billion gallons of milk and 2.8 billion pounds of cheese annually. A single dairy cow produces approximately 6,800 gallons of manure per year and the entire sector generates 8.7 billion gallons of manure per year [3, 4]. Waste management operations (collection, processing, and disposal) are becoming increasingly troublesome and costly due to ever increasing volumes of waste streams, due to their highly distributed nature, and due to their complex bio-physico-chemical composition. When left untreated, organic waste releases excess nutrients, chemicals, and biological agents to the soil, surface and ground waters, and emissions to the atmosphere, ultimately disrupting natural ecosystems. Nutrients in livestock waste and biosolids such as phosphorus and nitrogen accumulate in surface waterbodies, triggering algal blooms and degrading the quality of water resources [5, 6]. Decreased water quality ultimately impacts health and socio-economic activities that are fundamental for some regions e.g., tourism, real estate, swimming, sailing, fishing. Mismanagement of organic waste represents not only an environmental hazard but also a lost economic opportunity. Specifically, diverse waste processing technologies are available to generate value-added products from organic waste such as fertilizers, fuels, and electricity. Unfortunately, economic viability of waste processing routes strongly depends on economies of scale, on transportation costs, and on the composition of the waste streams (which is complex and highly variable). In addition, decision makers are often unaware of potential uses of waste streams and thus of their inherent value. Another obstacle associated with waste management is the lack of cost-effective alternatives to collect and transport large amounts over long distances. Diverse government regulations and incentives are currently used to promote waste management and investment in processing technologies. For instance, a nutrient trading program is currently being implemented by the State of Virginia for managing nutrient (P and N) runoff to the Chesapeake Bay watershed. Unfortunately, existing incentives have not been fully capable of overcoming techno-economic and logistical costs associated with waste processing. As a result, the waste management infrastructure remains limited and fragmented, presenting a significant obstacle to mitigate the deterioration of water, land, and air resources as well as to enable sustainable growth of urban, agricultural, and food sectors. A detailed perspective on challenges associated with organic waste management is presented in Section 1 of the Supporting information file.
Coordinated management systems enable efficient exchange of products in complex decisionmaking environments that involve large numbers of stakeholders, that rely on shared and constrained infrastructures, and that are driven by complex spatio-temporal physical phenomena and externalities (e.g., weather). Such systems are common place in industry. Symbiotic relationship between industrial plants contributes to a more environmentally and economically sustainable system [7]. Optimization based approaches have been used to design eco-industrial parks or industrial symbioses where the participating industries share resources and achieve higher water [8, 9] and energy [10, 11] usage efficiencies. Advanced coordinated systems are also used to manage complex infrastructures such as the power grid [12, 13]. Power grid management systems are operated as coordinated (but competitive) markets, in which suppliers and consumers of power and of transmission capacity offer services. Power and transmission capacities and prices are allocated among the stakeholders by solving a central dispatch optimization problem that seeks to maximize the social welfare. The solution of this problem ensures physical feasibility of allocations and generates prices that properly remunerate the stakeholders. This aspect of coordination is key, as early decentralized management of the power grid driven by individual transactions between utilities lead to significant inefficiencies (e.g., shortages in supply) and market manipulation practices that hindered competition. Our work is motivated by the observation that the historical evolution of coordinated management of power networks provides important lessons and significant empirical evidence that can be leveraged to justify the need and guide the design of coordinated systems for organic waste management. A detailed perspective on coordinated management of power grids and on the status of organic waste management systems is provided in Section 2 of the Supporting information file.
In this work, we propose a coordinated management system for organic waste. In this system, bids are submitted by suppliers and consumers for waste and derived products as well as by transportation and technology providers for their services. An independent system operator (ISO) uses this bid information to run a dispatch system that finds optimal transportation and transformation pathways that balance supply and demands in a given geographical region. This approach captures system-wide interdependencies and constraints that arise from transportation and bio-physico-chemical transformations of waste into diverse products. The system operates as a coordinated market, generating prices for each waste type and derived product and at each geographical location. With this, bids and prices can be updated with a certain temporal frequency to capture variations in demand and supply (e.g., due to changing environmental conditions, resource availability, and other externalities). We show that allocations and prices obtained with the system satisfy a number of fundamental economic and efficiency properties that are expected from competitive markets. As with coordinated power grids, the proposed system is driven by a fundamental social service: to provide waste management services in the most efficient and reliable manner possible. These services are provided by finding optimal strategies to transport, process, and dispose of waste and products that maximize the social welfare. We show that the proposed market provides a systematic framework to monetize environmental and health impacts, and benefits associated with waste management. Moreover, prices reveal the true value of waste streams and derived products, and can be used to create incentives for investment and development of new technologies. Prices also capture spatial and temporal variations that help prioritize endangered locations/times and that reveal the need for investment in transportation, facility relocation, or seasonal waste storage. The framework can also be used by government agencies to understand and predict the effect of different regulation and incentive mechanisms. The proposed framework is scalable in that it provides open access that fosters transactions and interactions between large numbers of small and large market players in urban and rural areas and in that it enables coordination with other infrastructures such as power grid and natural gas, water, and food distribution networks. Our work aims to provide a stepping stone towards a coordinated market that better captures interdependencies between products exchanged in different infrastructures and their environmental impacts. Such a framework will become increaseingly necessary to provide reliable services as the human population grows and mobilizes and as resource availability becomes less predictable and more constrained. The proposed framework can potentially also be used to manage other complex supply chain networks.
2. Coordination Framework
We consider a system that comprises a set of geographical locations (nodes) , products , suppliers , consumers , transportation providers , and transformation (technology) providers . Products comprise different waste stream types and derived products, transportation providers offer alternatives (e.g., hauling, railway, pipelines) to move products between locations, and technology providers offer alternatives to process products to produce other higher value products.
Associated with each supplier there is a supply flow , product type , maximum offered capacity , location , and bidding cost . Associated with each consumer there is a demand flow , product type , maximum requested capacity , location , and bidding cost . We use attributes to define the nested sets with (i.e., all suppliers attached to node n) and (i.e., all suppliers of product p attached to node n). We follow a similar reasoning to define the nested sets .
Associated with each transportation provider there is a flow , product type transported , maximum capacity , bidding cost , sending (source) node , and receiving (destination) node . The bidding cost captures operational costs associated with the movement of a unit of flow from the source to the destination node. The set is the set of all flows entering node , the set is the set of all flows leaving node . We also define the nested subsets for entering flows where is the set of flows entering node n and carrying product p and we note that . We use similar definitions to construct subsets .
Associated with each transformation provider there are transformation (yield) factors , a reference product , processing capacity , processing (operating) cost , and location . Transformation factors represent units of product p consumed/generated per unit of reference product p(t) consumed/-generated in the transformation technology. We use the convention that γt,p > 0 if product p is generated in the technology t, γt,p < 0 if product p is consumed in the technology, and γt,p = 0 if product p is neither produced nor consumed in technology. Moreover, we use the convention that γt,p(t) = −1 (i.e., one unit of reference product is consumed to produce/consume other products). For each technology we also define an extent of transformation , which is the total amount of p(t) processed.
The management system proposed is operated by an ISO that collects bidding information from all participants (costs, capacities, and transformation factors) to obtain optimal allocations of product supply, demand, transportation, and transformation services. The ISO determines these allocations by solving a dispatch problem that finds optimal transportation and transformation pathways for waste and derived products that maximize the social welfare and that balance supply and demand for all products across a geographical region. For reasons that will become apparent, this dispatch problem can be seen as a market clearing problem. We use the short-hand notation (s, d, f, ξ) to denote the dispatched allocations. If the allocation of a given player is non-zero we say that the player has been cleared (otherwise we say that the player is not cleared and does not participate). We use to denote the set of cleared suppliers (i.e., those with si > 0, ). Similarly, we define the set of cleared consumers , transportation providers , and technology providers . The cleared transportation providers create a transportation network that connects nodes in the system that perform exchange of products. An efficient management system is expected to clear suppliers and providers that offer services at low costs and will give preference to consumers with higher bidding costs. The clearing problem also aims to find prices that are used to properly remunerate suppliers and providers to cover their service costs and to charge consumers for the service provided. These price incentives must take into consideration complex geographical and product interdependencies and physical constraints that arise from transportation and transformation. We now proceed to describe the design elements of a clearing mechanism that achieves all these goals.
2.1. Dispatch Formulation
Given the bidding information (αs, αd, αf, αξ) and (), the ISO solves the clearing problem (1) to find allocations (s, d, f, ξ) (as illustrated in Figure 1). These allocations maximize the social welfare (1a) and satisfy the physical conservation laws (1b), and capacity constraints (1c)–(1f). Maximizing the social welfare function maximizes the demand served and minimizes the costs of supply, transportation, and transformation. The conservation laws are also known as the balancing constraints or market clearing constraints. The first term in parenthesis is the total input flow for product p into node n (given by supply flows and transportation flows entering the node). The second term in parenthesis is the total output flow of product p from node n (given by the demand flows and transportation flows leaving the node). The third term is the generation/consumption rate of product p in all technologies located at node n.
| (1a) |
| (1b) |
| (1c) |
| (1d) |
| (1e) |
| (1f) |
Figure 1:
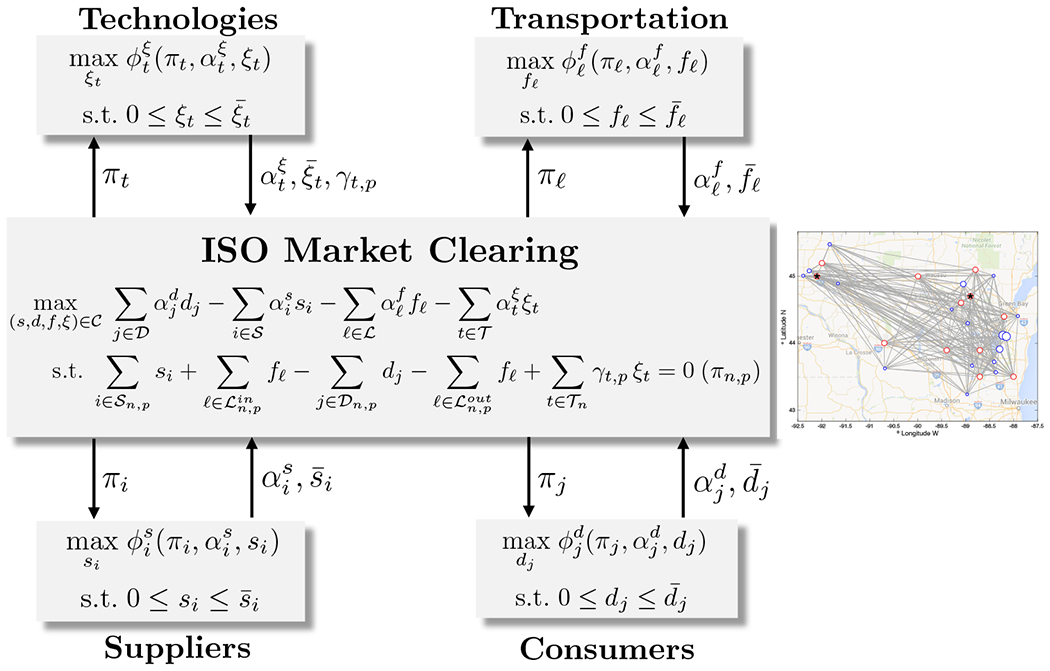
Coordination system. Suppliers, consumers, and service providers submit bidding information to the ISO. This information is used by the ISO to obtain prices and allocations that clear the market. The market is cleared by solving an optimization problem that finds optimal transportation and transformation pathways that maximize the social welfare and that balance supply and demand across a given region. Under the proposed design, solving the clearing problem is equivalent to maximizing the collective profit of the market players.
We define the set of feasible allocations as the set of all possible allocations (s, d, f, ξ) satisfying the capacity constraints (1c)–(1f). The trivial allocation (s, d, f, ξ) = (0, 0, 0, 0) is feasible and satisfies the conservation laws. This trivial allocation corresponds to a dry market (in which no player is cleared). The dual variables of the conservation laws (1b) act as market clearing prices that set values for products at different geographical locations. Because of this, we refer to πn,p, as the nodal prices or locational marginal prices. We use the short-hand notation π to denote all dual variables.
Allocations and prices derived from the clearing formulation play a fundamental role in establishing economic properties. Specifically, allocations and prices are used to remunerate providers and charge consumers. Moreover, prices are used as incentives that promote coordination between stakeholders. Because of this, clearing prices are also known as coordination prices. To explain how this takes place, we use the compact notation πi ≔ πn(i),p(i), and πj ≔ πn(j),p(j), . The revenue collected by supplier from the coordination system is πisi while is its operating cost. For consumers, is the value of the allocated demand and πidj is the payment made to the coordination system. To see how transportation providers are remunerated, we define πℓ ≔ πnr(ℓ),p(ℓ) − πns(ℓ),p(ℓ), and call these the transportation prices. For reasons that will become apparent, the quantity πℓfℓ is paid by the system to the transportation provider and is the transportation cost. We define and we call these the transformation prices. The technology provider is paid πtξt by the system and is its operating cost. The quantity represents the net revenue of provider t. This quantity captures the fact that, if a technology t produces a certain product p (i.e., γt,p > 0), the corresponding revenue associated with such product πn(t),pγt,pξt will be non-negative (πn(t),p ≥ 0). Similarly, when a technology consumes p (i.e., γt,p < 0), the corresponding revenue πn(t),pγt,pξt will be non-positive and thus this represents a cost. The player profits are a function of payments, charges, and costs:
| (2a) |
| (2b) |
| (2c) |
| (2d) |
We use the notation ϕ ≔ (ϕs,ϕd,ϕf,ϕξ) to denote the profits of all stakeholders that result from the clearing process.
The partial Lagrange function of the clearing problem is given by:
| (3) |
Assuming that strong duality holds, an optimal solution of the clearing problem can also be found by solving the Lagrangian dual problem:
| (4) |
Since the clearing problem is a linear program, strong duality holds under standard constraint qualifications [14]. The Lagrangian dual representation is essential to establish fundamental economic and efficiency properties of the coordination framework. The following basic observations will become useful in establishing such properties. First note that the following relationship holds:
| (5) |
This follows from the following identities:
| (6) |
where the last expression can also be written as . Moreover, we have that:
| (7) |
where the last expression can also be written as . From these properties we also have that the partial Lagrange function can be expressed as:
| (8) |
2.2. System Properties
We now establish fundamental properties of the coordination framework that proves that the system operates as a competitive market and that it generates efficient allocations. Some of these properties have been widely studied in the context of electricity markets [15, 16, 17, 18]. Our results extend these results to a multi-product setting that exhibits product interdependencies that arise from transportation and transformation.
Theorem 1 The coordination system delivers prices π and allocations (s, d, f, ξ) that maximize the collective profits (ϕs, ϕd, ϕf, ϕξ) and the profits are all non-negative.
Proof: Consider an arbitrary (and fixed) set of prices π. At such π, the trivial allocation (s, d, f, ξ) = (0, 0, 0, 0) yields zero profits , , , and . From (8) we have that the Lagrange function is the summation of the profits and thus . For fixed π, the Lagrangian dual problem finds an allocation (s, d, f, ξ) that minimizes the Lagrange function and thus . Moreover, because minimizing the Lagrangian at fixed π is equivalent to maximizing the players profits individually and thus we can always find an allocation that is at least as good as the trivial allocation for each player. We thus have that , , , and . Since π is an arbitrary set of prices then the profits are non-negative at the optimal clearing prices and corresponding allocation. □
The theorem reveals that, under the proposed remuneration scheme, the stakeholders either make a profit or they are not cleared (but they do not incur a financial loss). Moreover, it reveals that the clearing procedure assumes that the all the players seek to maximize their profit (as expected).
Theorem 2 The coordination system delivers prices π and allocations (s, d, f, ξ) that represent a competitive economic equilibrium.
Proof: For any set of prices π, the minimization of the Lagrange function with respect to the allocations (s, d, f, ξ) is equivalent to finding individual allocations that maximize the individual stakeholder profits. Moreover, because strong duality holds, the solution of the Lagrangian dual problem also solves the clearing problem and thus the optimal allocation satisfies the clearing constraints. □
This theorem is also known as the first welfare theorem and indicates that ISO coordination does not interfere with the competitive nature of the system. In other words, coordination is only used as a mechanism to find a feasible allocation that satisfies transportation and technology constraints.
Theorem 3 The coordination system delivers prices π and allocations (s, d, f, ξ) that lead to revenue adequacy:
Proof: The clearing constraints hold at any optimal allocation of the clearing problem. Consequently, we have that:
| (9) |
From (5) we thus have that . Consequently, the revenue collected from the consumers covers the payments made to suppliers and service providers. □
Revenue adequacy means that the revenue collected from the consumers covers the total payments made to the suppliers and providers for their services (there is no money lost in the transactions).
Theorem 4 The coordination prices satisfy the bounds: for all , for all , for all , and for all .
Proof: From Theorem 1 we have that the profits (ϕs, ϕd, ϕf, ϕξ) are all non-negative. Moreover, the allocations of all the cleared players are positive and thus we must have that for all , for all , for all , and for all . □
This theorem provides general price bounding properties based on the bidding costs of the cleared stakeholders (those that are not cleared do not affect the prices because their allocations are zero). The supply bidding costs act as lower bounds for the prices at nodes at which the suppliers are connected to. Consequently, when the supply bidding costs are positive, the prices at such nodes will be positive. Note, however, that at nodes in which there is no supplier connected to (or cleared), the price can become negative. The consumer bidding costs act as upper bounds for the prices at nodes at which they are connected to. This is important, because demands often drive the system. If there are multiple suppliers and consumers at the given location, we have that prices will be bounded by the bidding costs of all the players connected to that node. For instance, if there is a supplier and a consumer at a given node n = n(i) = n(j), the price at this location must satisfy . This basic bounding property can be used to derive more general pricing results. For instance, it can be verified that holds, indicating that the price at a given node n will be bounded by the highest supplier bid cleared and the lowest consumer bid cleared.
For transportation prices we observe that πℓ ≥ 0 for all with and that this implies that πnr(ℓ),p(ℓ) ≥ πns(ℓ),p(ℓ) for all . This indicates that there is an incentive (economic driving force) to transport a product if this is more valuable at the destination node than at the origin node, thus leading to a positive profit for the transportation provider. The magnitude of the driving force is lower bounded by the bidding cost . On other hand, if there is no price difference between nodes we have that πℓ = 0 then there is no incentive to move the product to a different location and thus the transportation profit for the associated provider will be zero. Consequently, transportation prices implicitly capture global (system-wide) geographical interdependencies between nodes i.e. the prices embed information on the topology of the transportation network that results from the clearing procedure.
For the transformation/technology prices we have that, when πt > 0, the technology providers have an incentive (economic driving force) to transform products to make a profit. Moreover, the prices are a mix of prices of raw materials and products entering and leaving the technology (weighted by the transformation factors γt,p). Consequently, πt > 0 indicates that the derived products have more value than the input products. From this we can also see that the transformation prices πt can be interpreted as a driving force to transfer a set of products from a given bio-physico-chemical state into another state of higher value. Moreover, the technology prices capture economic interdependencies between products. We also highlight that the coordination system does not permit negative profits for technology providers and thus avoids inefficient routes to process and transform products. Together with the transportation prices, the technology prices embed complex topological information of geographical and bio-physico-chemical interdependencies between products.
The following result establishes an important transportation efficiency result.
Theorem 5 If the transportation bidding costs αf are all positive, no cleared allocation f contains transportation cycles.
Proof: We prove this result by contradiction. Assume that the system is cleared for an arbitrary given product p with a transportation cycle that contains c nodes of the form n1 → n2 → ⋯ → nc−1 → nc → n1. From Theorem 2 we have that for all cleared providers that connect the nodes in the cycle. This implies that πnc,p > πnc−1,p > ⋯ > πn2,p > πn1,p > πnc,p, but this is a contradiction. ■
This result highlights that coordinated clearing captures system-wide geographical interactions between suppliers, consumers, and providers and that this helps avoid inefficient routes. Such system-wide interactions are difficult to capture in uncoordinated management systems, which are driven by transactions between individual consumers and suppliers, and thus can lead to inefficiencies. The ability to capture system-wide interactions and constraints is key to find efficient transportation and transformation pathways, to enable coordinated responses to externalities such as extreme weather events or shortages of resources, and to achieve complex societal goals such as geographical nutrient balancing. Examples that illustrate the theoretical properties are presented in Section 3 of the Supporting information, respectively.
2.3. Special Settings - Disposal, Storage, and Remediation Costs
The proposed framework can accommodate suppliers and consumers that offer negative bid costs. Waste storage/disposal facilities or the environment can act as consumers with negative bidding costs because such participants are often willing to take a certain product but only if they are paid for doing so (the bidding cost can thus be interpreted as a disposal, storage, or remediation cost). The contribution of this type of consumer to the Lagrange function is and, since this term is minimized and , we have that the clearing problem seeks to minimize dj. Consequently, the demand allocation dj acts as a slack variable and acts as a penalty cost. As a result, the larger , the less product the consumer is willing to take (i.e., the more expensive it is to dispose of at the given location). The negative bidding cost can also be interpreted as a force that tends to repel the product away from the associated node.
When negative bidding costs are allowed in the system, the results from Theorem 1 state that the profits are still guaranteed to be non-negative but the prices might need to become negative in order to enable this. For instance, for a consumer with negative bidding costs we have that the profit is . Consequently, for the profit to be positive it is required that (the clearing price has to be negative at node n(j)). The observation is also reinforced from price bounds established in Theorem 4. The competitive equilibrium result of Theorem 2, the revenue adequacy result of Theorem 3, and the transportation adequacy result of Theorem 5 remain unchanged under negative consumer bidding costs.
Suppliers with negative bid prices can be accommodated in a similar way to capture situations in which a given player is willing to pay the system to take away a given product (e.g., keeping waste at a given location might incur a cost). This situation will introduce negative clearing prices that can incentivize the consumption of waste products by transformation providers to generate valuable products. The properties on player profits, competitive equilibrium, revenue adequacy, price bounds, and transportation adequacy remain unchanged under negative supplier bidding costs.
2.4. Significance and Uses of the Coordination System
In electricity systems, demand bidding costs for inflexible consumers (such as urban areas) are usually set to a large value known as the “value of lost load” (VOLL), which quantifies the lost economic opportunity that arises from the power grid not being able to provide a service to society. The magnitude of VOLL is often estimated by performing detailed studies on the potential value of critical functions enabled by the provision of electricity. High VOLL values exert socio-economic pressure to markets (it activates the markets). In the absence of this external pressure, suppliers might not have a natural incentive to serve electricity demands at certain times and/or locations. In the context of organic waste, a similar socio-economic pressure exists but manifests as the need to process waste to mitigate environmental impacts. This pressure can be captured in our framework in the form of consumers (the environment) with negative bidding costs. Analogous to the case of VOLL, negative bidding costs for the environment can represent value of service (VOS) and can be estimated by determining environmental remediation and human health costs associated with leaving waste untreated. The need to determine suitable magnitudes for VOS at different geographical locations will create an incentive for government agencies to properly quantify local socio-economic, health, and environmental impacts associated with waste disposal. Negative consumer bidding costs will activate the market because they force clearing prices to be negative, creating an incentive for transformation providers to purchase waste (and getting paid for it) to produce valuable products. This basic principle drives the existence of infrastructures for wastewater treatment facilities (which transform wastewater into higher quality/value water). A negative bidding cost will also create an incentive for waste disposal providers, which is the basic principle driving landfill operations. Consequently, the proposed market can help determine suitable gate/tipping fees.
Prices generated under the proposed coordination framework can help justify investment in infrastructure and technology innovation. For instance, WWTPs and local governments need to justify investment in new technologies to their stakeholders. In particular, one could use market prices for biosolids with high and low P concentrations to justify the need for investment in a P recovery technology. Developing a mature market with more predictable prices is also essential in minimizing investment risk. A coordinated framework can also help set best practices to characterize and price complex organic waste streams and derived products and with this standardize waste exchange practices. Electricity markets, for instance, use a standardized framework to report bidding values. Moreover, competition induced by markets fosters disclosure of true values for products and technology operating costs.
Prices obtained from the proposed framework can also help inform and foster transactions between diverse market players in urban, rural, and industrial sectors. For instance, a coordinated market can help promote food waste separation and composting practices. One can also envision deploying coordinated markets in a hierarchical manner (as is done in electricity markets). For instance, one could create a coordinate market per county and have the county markets coordinate in a regional/state market. States market could then be coordinated in a national market. This hierarchical organization arrangement can enable management of a large number of market players and facilitate cross-regional transactions. This can be exploited, for instance, to identify nutrient-deficient regions in which excess manure fertilizer and associated nutrients can be more valuable. In other words, coordinated markets can help balance (homogenize) nutrient budgets across counties and regions more effectively as well as identify processing options needed that facilitate long-distance transportation e.g., pelletization [19, 20].
A coordinated framework enables fast system-wide adaptations of allocations and prices to respond to spatiotemp oral externalities. Specifically, the allocations and prices generated by the clearing procedure implicitly capture geographical priorities and transportation constraints. For instance, negative demand bidding costs with large magnitudes can be used to capture endangered areas e.g., regions with high nutrient concentration in the soil and water bodies. This will naturally create price regions that reflect how valuable or undesirable a particular waste stream is. Because the system will be cleared on a rolling basis (i.e., say daily), market players can adjust their bids to capture natural fluctuations of weather and other externalities. For instance, bidding costs can be adjusted during the raining season to prevent the application of manure in a certain area, which can lead to in-excess run-off, nutrient pollution, and harmful algal blooms which pose severe toxicity risk for communities, livestock, and wildlife. In this case, waste prices will implicitly capture the fact that an area will be endangered during a particular season compared to others when it is safer for manure to be applied. The market framework will thus provide a more natural and economically sound mechanism to prevent application of manure at certain times (as opposed to simply forbid application). A coordinated framework also provides a systematic approach to enable concerted and effective responses to externalities that might threaten urban and rural activities such as droughts and extreme weather events. Resilience provided by coordination is in fact one of the main drivers behind coordinated electricity markets. Along these lines, a coordinated system can help identify new pathways to produce and use electricity. As a result, coordination of waste and electricity markets can potentially achieve mutual benefits. For instance, current electricity rates provided by utility companies to biogas-based electricity producers in the US are too low to justify investment in anaerobic digestion and associated infrastructure. Coordination of electricity and waste markets can thus help provide a more systematic approach to uncover the true value of electricity generated from waste.
Prices obtained with the proposed framework can also help create incentives and justify the installation of livestock manure storage facilities to prevent application at certain times. In particular, under the proposed framework, prices provide a reflection of the time value of waste and of the associated environmental damages that storage and relocation can help overcome. Currently, small dairy farms are consolidating into increasingly larger operations to exploit economies of scale and reduce production costs. Consolidation, however, has the effect of concentrating livestock waste and associated environmental impacts in smaller areas. Moreover, the human population is increasingly being concentrated in urban areas and this creates a wider separation in the food and waste supply chain. Prices obtained under the proposed framework will provide a reflection of the costs associated with consolidation that urban planners and farmers can use to identify suitable degrees of consolidation and/or to identify optimal locations for operations. A coordinated market framework can also help predict the effect of incentives such as RECs, RINs, and nutrient discharge and emission constraints on social welfare and prices. In addition, this framework can inform stakeholders to optimize the investment of funds for incentives associated with organic waste management and to minimize the impacts of regulations on the economy and business.
The framework can also be used to explore potential impacts of fundamental changes in infrastructure options to process organic waste. For instance, in Sweden, households are designed to separate urine from other biosolids, which can be processed separately to recover P [21]. Fundamental changes in infrastructure are expensive and can involve complicated debates regarding public perception on health hazards. Coordination can facilitate such discussions by providing information on how infrastructure changes can impact environmental remediation and product prices and how changes can create new economic opportunities for stakeholders involved (e.g., householders and livestock producers).
The proposed framework can also be synergized with other environmental policy initiatives. For instance, on February 2019, a legislation (LRB-1244) was introduced in the State of Wisconsin’s senate to create a clearinghouse for reducing nutrient pollution in the waterbodies. The clearing house will facilitate trading of water pollution reduction credits between point-source polluters (e.g. wastewater treatment plants and factories) and the non-point sources (e.g. farms and residential areas). The proposed coordinated markets framework can guide in determining the prices for these credits, clearing the market, and determining the incentives required to facilitate transactions.
3. Geographical Nutrient Balancing in Upper Yahara Watershed
We analyzed the potential use of the coordinated management framework to conduct geographical nutrient balancing. Specifically, we focus on phosphorus (P) balancing for the Upper Yahara watershed region in the State of Wisconsin (Fig. 2A). Excessive amounts of P have accumulated in this area, primarily due to livestock manure and the heavy use of agricultural fertilizers. Rain and snow melt often wash these nutrients into waterways, which lead to the blue-green algae blooms in the Yahara lakes [22]. We use ρ to denote the total P imbalance ratio in the region, which is given by the ratio of total P applied to land in the region (primarily in the form of livestock manure) and the total P that can be absorbed by crops. Perfect balancing in the region indicates that ρ = 1. P surplus indicates that ρ > 1 and there could be a risk of water deterioration; while P deficiency indicates that ρ < 1 and this is not sustainable in the long-term. The total imbalance ratio in the watershed was estimated to be 1.95 in 2012 and 1.35 in 2013 [23], and we estimate that it was 1.46 in 2017 based on the crop types in agriculture lands, the nutrient removal amounts for different crops, the animal units in each farm, and the nutrient from animal excretions. Exact values of such imbalance are difficult to ascertain due to inherent uncertainty in crop yield values and manure composition. Total P balancing has improved over the years due to changes in crop production but some locations remain highly imbalanced and endangered. For instance, specific locations reach imbalance ratios of 300 (Fig. 4). Balancing total and localized (point) P imbalances is a key societal goal because such imbalances threaten the quality of large and small water bodies.
Figure 2:
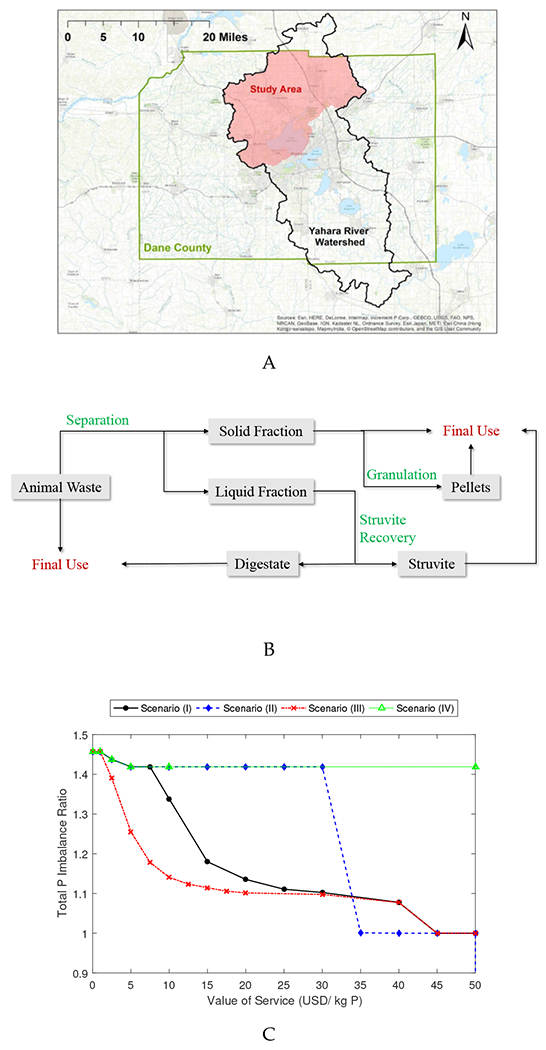
Geographical nutrient balancing using coordinated system in Upper Yahara region. (A) Study area in Yahara watershed in Dane County, WI. (B) Processing technology pathway options for livestock waste. (C) Total P imbalance ratio in the region as a function of value of service (VOS).
Figure 4:
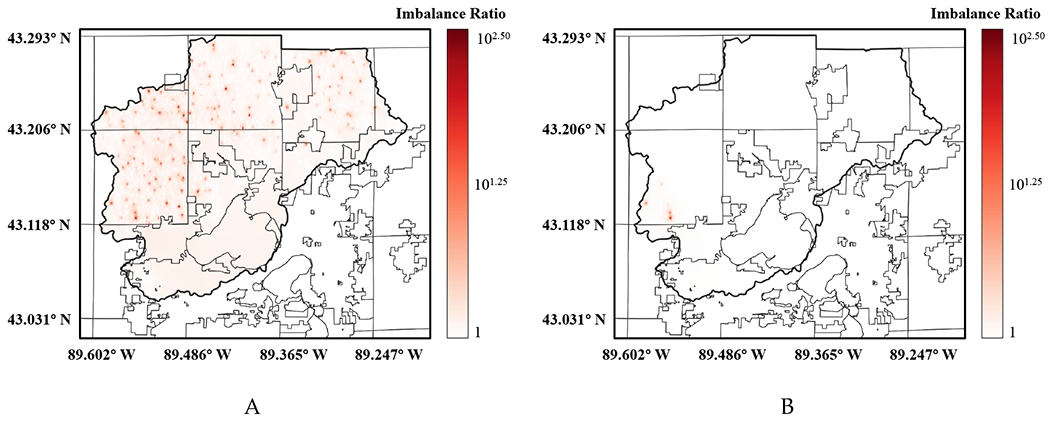
Phosphorus (P) imbalance maps in Upper Yahara region as a function of value of service (VOS). Imbalance ratio shown in logarithmic scale. (A) VOS of 0 USD/kg P and (B) VOS of 30 USD/kg P. Perfect balancing in all locations is achieved for a VOS of 45 USD/kg P.
The study comprises 1,372 nodes, 351 waste suppliers, and 20 different products. We consider 203 farms in the region (55 beef farms and 148 dairy farms). These farms represent over 99% of the P generation associated with livestock waste and are considered suppliers in the system. Waste is categorized as beef, dairy cow, and heifer manure and was originally assumed to be offered for free. Dairy cow manure has a higher P concentration [24, 25]. Derived products from manure are struvite, granulated compressed pellets, digestate, and the manure solid fraction. The consumers in this system are: agricultural lands inside the region that demand raw manure, solid fraction of manure, and digested manure; external players (outside the region) accepting waste surplus; external players that buy struvite, pellets, and the solid fraction of manure. We considered 1,167 agricultural land nodes that can be used for waste application. The external players are located in Madison, WI or Sauk County, WI (outside the region). We consider a demand bidding costs for struvite of 800 USD/tonne, for pelleted waste of 100 USD/tonne, for the solid waste fraction of 0.05 USD/tonne, for the liquid waste fraction of 0.002 USD/tonne, and for the digestate of 0 USD/tonne [26,27]. Location and capacity data for supply and demand nodes are obtained from [28,26,27]. We considered transportation bidding cost at each arc as the product of the length of the arc and 0.3 USD/tonne-km for manure and digestate (this value is 0.15 USD/tonne-km for struvite and pellets because solids that are easier to transport). For simplicity, we assume that transportation paths between nodes are linear and we assume that transportation bids exist to move product between all nodes in the system. This gives rise to hundreds of thousands of possible paths. To give an idea of the logistical complexity involved, the clearing problem is a linear programming problem containing over 30 million decision variables and 0.5 million constraints. This problem can be solved in 15 mins using modern solution tools such as Gurobi 7.5.2 [29]. All scripts needed to reproduce the results are available at https://github.com/zavalab/JuliaBox/CoordMarket.
We considered the possibility of processing the three types of waste using three different technology pathways of increasing complexity (Fig. 2.B). The first pathway separates the manure into its solid and liquid fractions, the second pathway performs an additional granulation step of the solid fraction to recover P in the form of pellets, the third pathway recovers P in the form of struvite from the liquid fraction. Struvite recovery also generates digestate as byproduct with traces of P. The processing costs for the technologies are 0.23 USD per tonne of raw manure for separation, 4.00 USD per tonne of raw manure for granulation, and 38.1 USD per tonne of liquid feed for stuvite recovery [26, 27]. Recovering struvite is a more expensive option because it involves a more sophisticated technology. However, struvite is a more valuable and concentrated product than pellets; while pellets is a more valuable and concentrated product than the manure solid fraction (higher concentration facilitates transportation and geographical nutrient balancing). We considered 126 hypothetical technology installations only in large farms which have more than 500 animal units (61 for separation, 3 for granulation, and 62 for struvite recovery). The installation locations are shown in Fig. 3. We analyze the system behavior under four scenarios in which different combinations of technologies are assumed to be available in the system. The scenarios were used to analyze the degree of technology complexity needed to achieve balancing. In scenario I, we consider that all technologies (separation, granulation, and struvite recovery) can be used by the system. In scenario II, we consider that only separation and struvite recovery are available. In these two cases we also consider that a small demand for the solid waste fraction exists so that the system is constrained on what can be done with this product. In scenario III, we consider that all technologies are available and that a large demand for solid fraction exists outside the region (in Madison, WI). In scenario IV, we consider that separation is the only technology available and that there is a small demand for the solid fraction of manure. For all scenarios, we evaluate the impact of VOS on the total regional and point P imbalance ratios.
Figure 3:
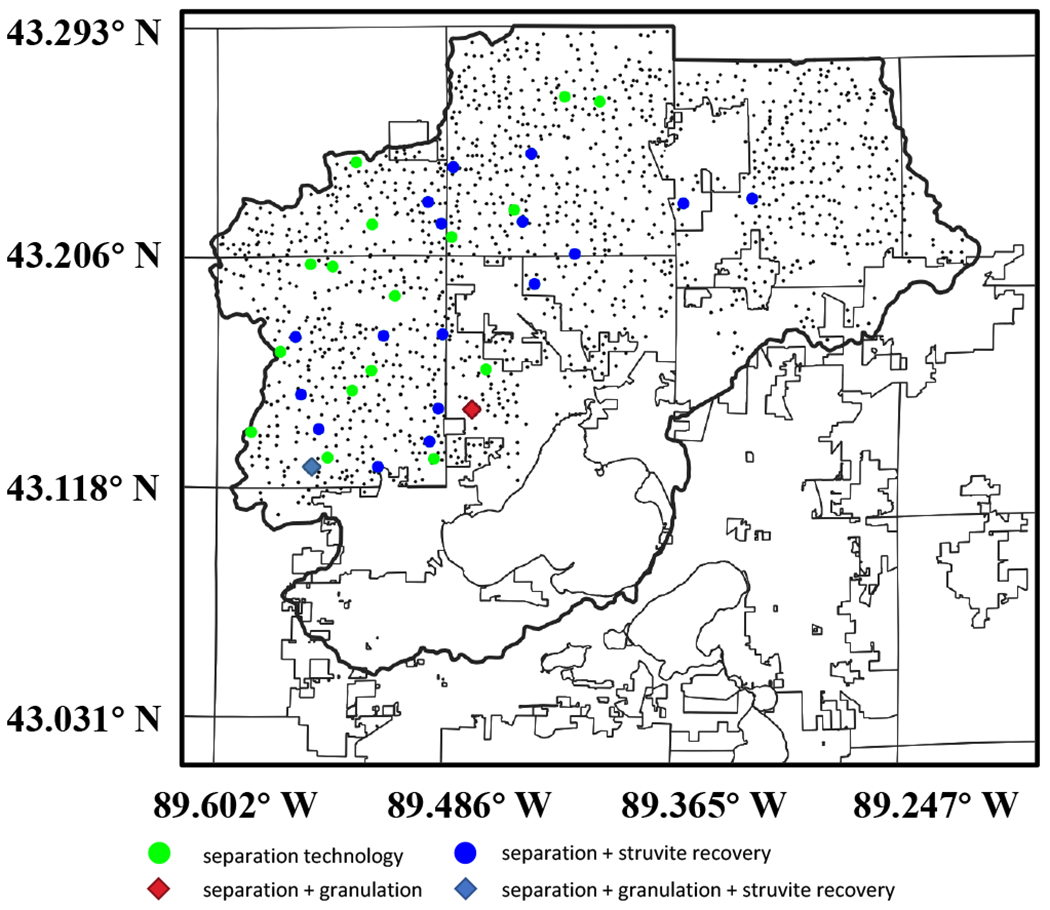
Locations for farms, agricultural lands, and waste processing technologies in the Upper Yahara region. Small dots indicate location of farms and agricultural lands.
Direct application of the coordination framework with the considered bidding costs revealed that the cleared market is dry i.e. no waste is transported or processed and no transactions take place. Consequently, P within the study region remains imbalanced. This result indicates that the added value of derived products is insufficient to overcome transportation and processing costs. In order to ensure that suppliers participate in the system, we found it necessary to supply waste at negative bidding costs. Even with negative bidding costs, however, the system did not achieve the desired P balancing (the optimal allocation consisted of short-distance transactions between suppliers and consumers inside the region). This indicates that, in order to balance P, it is necessary to use an economic driver that pushes excess P outside the region in a cost-effective manner. To do so, we considered the case in which surplus P at agricultural land locations incurs a cost and we note that this corresponds to having consumers with negative bidding costs (consumers that are willing to take P at a given location but only if paid for it). Such consumers can represent local governments or communities that seek to control environmental impact such as preventing harmful algae blooms at specific locations. In other words, nutrient balancing acts as an economic force that drives the system and negative bidding costs can be interpreted as environmental disposal/remediation costs that we call value of service (VOS).
Fig. 2C shows the impact of VOS on the total regional imbalance. The imbalance does not decrease unless VOS is considered. This again indicates that the value of derived products alone cannot promote balancing. In Fig. 2C we see that, as we increase VOS, the system provides incentives for service providers to process waste and transport excess P outside the region and the total imbalance decays. In scenario I we observe that a perfect imbalance ratio of one is achieved for a VOS of around 45 USD/kg P and saturates beyond that value (further incentives do not have an impact). Fig. 4 shows how an increasing value of VOS progressively eliminates point imbalances (perfect balancing at all locations is achieved for a VOS of 45 USD/kg P). This illustrates how policy makers can use coordinated system to identify suitable incentive mechanisms. As VOS is increased, manure separation is the first technology to be cleared because it is a low-cost option and because it is also a necessary processing step for both struvite recovery and granulation. The second technology to be cleared is granulation and the third is struvite recovery. This order is consistent with the processing costs. We have also found that combinations of technologies are needed to balance the region. Specifically, in scenario IV we observe that separation alone cannot balance the region. In contrast, in scenario II we see that the imbalance remains fairly large and constant up to a VOS value of around 35 USD/kg P; at this point, there is a sufficiently strong economic incentive for directly driving raw manure outside and P balance can be achieved; however, to activate the struvite recovery technology, a higher VOS is necessary and an upper bound on external demand of raw manure should be placed. From the trend of scenario III we observe that having a larger demand for the solid fraction of manure provides flexibility to the system and thus a perfect balance can be achieved for a small VOS of around 3 USD/kg P. This highlights how the entry of additional consumers into the system can help decrease VOS. In other words, as the market matures and more players participate, the need for external incentives decreases. In scenario III we see that increasing VOS further leads to a lower imbalance ratio. In our results we selected a common value of VOS for the entire region in order to simplify the analysis. However, different values based on diverse impacts can be selected to prioritize areas. This illustrates that VOS can be used to drive the system and adaptively control geographical nutrient balancing. This can be of interest to the government, which currently has limited tools to systematically control nutrient pollution [30].
Fig. 5 shows locational marginal prices for lactating cow manure and solids. We see that waste prices are all negative and they are smaller in certain areas. This is because these areas contain more dairy farms which results in higher density of P per unit area [28]. We can also see that manure solid prices are all negative but show a different distribution over the study region. This highlights that non-obvious geographical dependencies exist due to transportation, transformation, and external customers. Clearing prices and transportation flows for different products are presented in Figs. 6 and 7. From the transportation paths we see that the optimal strategy to balance P in the region is to transport raw lactating cow manure, manure pellets, and the solid fraction of manure outside the region. We also see that within the study region, manure is transported over short distances to homogenize imbalances and to be processed into pellets and solid/liquid fractions to facilitate longer-distance transportation.
Figure 5:
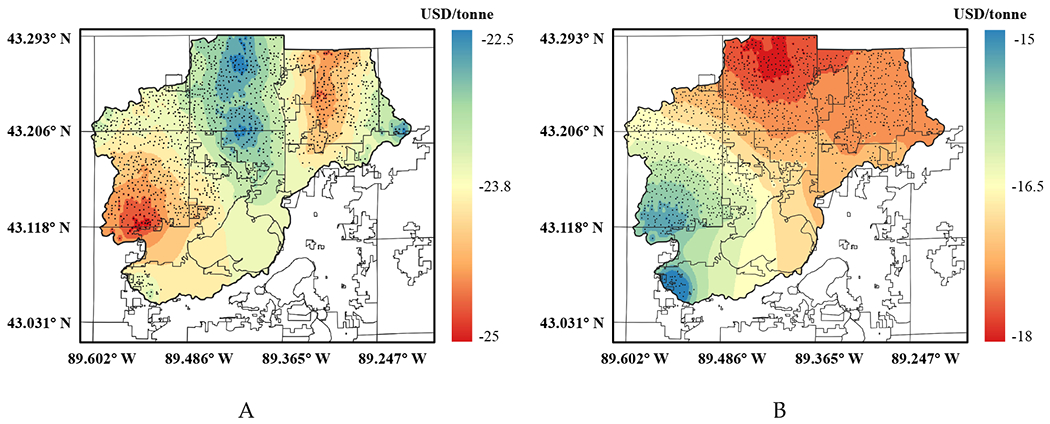
Clearing prices in the Upper Yahara region for different waste and derived products. (A) prices for lactating cow manure and (B) prices for manure solids. Results obtained for scenario I and for a VOS of 45 USD/kg P.
Figure 6:
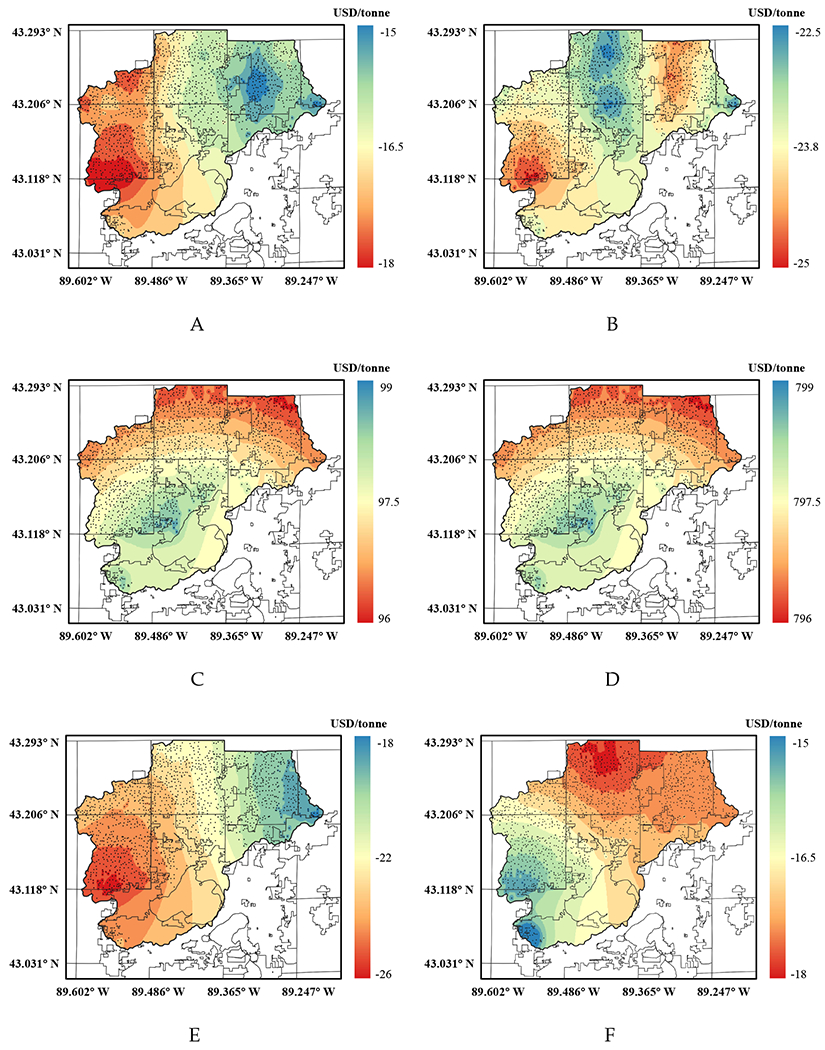
Clearing prices in the Upper Yahara region for different waste types and derived products. (A) Beef manure, (B) Dairy cow manure, (C) Beef manure pellets, (D) Struvite, (E) Liquid fraction of dairy cow manure, and (F) Solid fraction of dairy cow manure.
Figure 7:
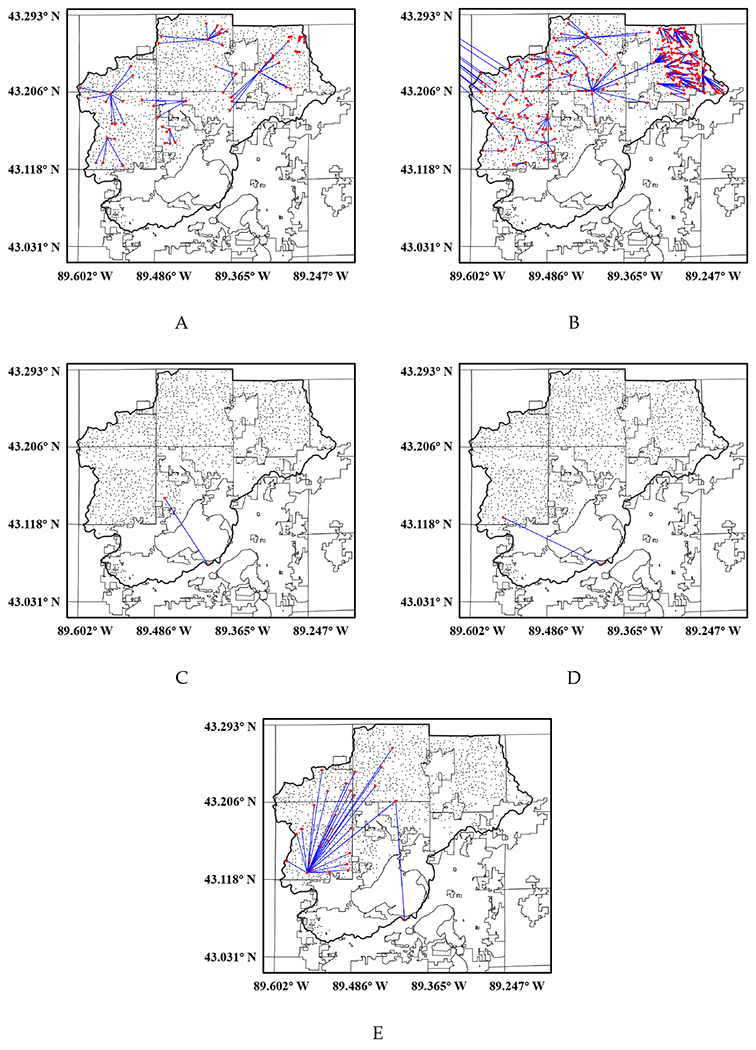
Cleared transportation flows in the Upper Yahara for different waste and derived products. (A) Beef manure, (B) Dairy cow manure, (C) Beef manure pellets, (D) Dairy cow manure pellets, and (E) Solid fraction of dairy cow manure. The external destination in (B) is Sauk County, WI; and the southmost point in (C), (D), and (E) is Madison, WI (point outside study region).
4. Conclusions and Future Work
We presented a coordination framework to facilitate the management of organic waste in a scalable manner by performing coordinated exchange, transportation, and transformation into value-added products. The framework operates as a coordinated market under which suppliers and consumers of waste as well as transportation and technology provides offer services to an independent system operator. Prices for waste and derived products at different geographical locations are obtained by solving a dispatch problem that maximizes the social welfare and that balances products across the region. Coordination enables handling of complex interdependencies between products and locations as well as physical constraints. We prove that the system delivers prices and allocations that satisfy fundamental economic and efficiency properties that are expected from a competitive market. We also show that the proposed system provides a systematic framework to monetize environmental and health impacts and benefits of remediation. Moreover, prices reveal the true value of waste streams and capture spatiotemporal variations that help prioritize endangered areas/times and that reveal the need for investment in processing technologies, transportation, facility relocation, and seasonal storage. The framework can also be used by the government to analyze and predict the effect of different regulations and incentive mechanisms. The proposed framework is scalable in that it can provide open access that fosters geographical transactions between large numbers of small and large players in urban and rural areas and in that it enables coordination with other infrastructures. A coordinated framework will become increasingly necessary as the human population grows and mobilizes, and as resource availability becomes more uncertain. As part of future work, it would be interesting to analyze the performance of coordinated system in realistic case studies that alternate waste streams (e.g., food waste) and geographical regions (e.g., urban areas). It is also necessary to explore how to enable multiscale geographical coordination and with other infrastructure networks. Another interesting direction is to explore how spatial relocation of waste producers (e.g., consolidation into larger dairy farms) can impact social welfare, prices, and the environment. This type of analysis requires of more advanced formulations for facility location and also of game-theoretic approaches that capture infrastructure investment strategies (such as recently developed anchor-tenant models) [31, 32].
Supplementary Material
5. Acknowledgements
We acknowledge support from the U.S. Department of Agriculture (grant 2017-67003-26055), from the National Science Foundation (grant CBET-1604374), and from the U.S. EPA (contract number EP-18-C-000016).
Footnotes
Publisher's Disclaimer: Disclaimer The views expressed in this article are those of the authors and do not necessarily reflect the views or policies of the U.S. Environmental Protection Agency. Mention of trade names, products, or services does not convey, and should not be interpreted as conveying, official U.S. EPA approval, endorsement, or recommendation.
References
- [1].Dairy industry contributes 43.4 billion USD to Wisconsin’s economy. University of Wisconsin-Extension; available at https://fyi.uwex.edu/extensioninthenews/2015/01/26/dairy-industry-contributes-43-4-billion-to-wisconsins-economy-2/, 2015. [Online; accessed 13-July-2018]. [Google Scholar]
- [2].2014 Wisconsin agricultural statistics. USDA National Agricultural Statistics Service (NASS), 2014.
- [3].Production Milk and Cows Milk. USDA - National Agriculture Statistics Service available at http://www.nass.usda.gov/Charts_and_Maps/Milk_Production_and_Milk_Cows, 2018. [Online; accessed 28-June-2018].
- [4].Facts and Figures. State of Wisconsin - Department of Agriculture, Trade, and Consumer Protection available at http://www.wisconsindairy.org/assets/images/pdf/WisconsinDairyData.pdf, 2018. [Online; accessed 28-June-2018].
- [5].Belsky A Joy, Matzke Andrea, and Uselman Shauna. Survey of livestock influences on stream and riparian ecosystems in the western United States. Journal of Soil and water Conservation, 54(1):419–431,1999. [Google Scholar]
- [6].Hoagland Porter and Scatasta Sara. The economic effects of harmful algal blooms In Ecology of harmful algae, pages 391–402. Springer, 2006. [Google Scholar]
- [7].Boix Marianne, Montastruc Ludovic, Azzaro-Pantel Catherine, and Domenech Serge. Optimization methods applied to the design of eco-industrial parks: a literature review. Journal of Cleaner Production, 87:303–317,2015. [Google Scholar]
- [8].Lovelady Eva M and El-Halwagi Mahmoud M. Design and integration of eco-industrial parks for managing water resources. Environmental Progress and Sustainable Energy: An Official Publication of the American Institute of Chemical Engineers, 28(2):265–272,2009. [Google Scholar]
- [9].Rubio-Castro Eusiel, Ponce-Ortega José María, Serna-González Medardo, Jiménez-Gutiérrez Arturo, and El-Halwagi Mahmoud M. A global optimal formulation for the water integration in eco-industrial parks considering multiple pollutants. Computers and Chemical Engineering, 35(8):1558–1574, 2011. [Google Scholar]
- [10].Chae Song Hwa, Kim Sang Hun, Yoon Sung-Geun, and Park Sunwon. Optimization of a waste heat utilization network in an eco-industrial park. Applied Energy, 87(6):1978–1988, 2010. [Google Scholar]
- [11].Taskhiri Mohammad Sadegh, Behera Shishir Kumar, Tan Raymond R, and Park Hung-Suck. Fuzzy optimization of a waste-to-energy network system in an eco-industrial park. Journal of Material Cycles and Waste Management, 17(3):476–489, 2015. [Google Scholar]
- [12].Blumstein Carl, Friedman Lee S, and Green Richard. The history of electricity restructuring in California. Journal of Industry, Competition and Trade, 2(1-2):9–38, 2002. [Google Scholar]
- [13].Nygren Erik, Sitaraman Ramesh K, and Sun Jennifer. The akamai network: a platform for high-performance internet applications. ACM SIGOPS Operating Systems Review, 44(3):2–19, 2010. [Google Scholar]
- [14].Bot RI, Kassay G, and Wanka Gert. Strong duality for generalized convex optimization problems. Journal of Optimization Theory and Applications, 127(1):45–70, 2005. [DOI] [PMC free article] [PubMed] [Google Scholar]
- [15].Bohn Roger E, Caramanis Michael C, and Schweppe Fred C. Optimal pricing in electrical networks over space and time. The Rand Journal of Economics, pages 360–376,1984. [Google Scholar]
- [16].Hogan William W, Read E Grant, and Ring Brendan J. Using mathematical programming for electricity spot pricing. International Transactions in Operational Research, 3(3-4):209–221,1996. [Google Scholar]
- [17].Zavala Victor M, Kim Kibaek, Anitescu Mihai, and Birge John. A stochastic electricity market clearing formulation with consistent pricing properties. Operations Research, 65(3):557–576,2017. [Google Scholar]
- [18].Pritchard Geoffrey, Zakeri Golbon, and Philpott Andrew. A single-settlement, energy-only electric power market for unpredictable and intermittent participants. Operations research, 58(4-part-2):1210–1219, 2010. [Google Scholar]
- [19].Hadas Aviva, Yosef B Bar, and Portnoy Rita. Extractability of phosphorus in manure pellets enriched with fertilizer phosphorus. Soil Science Society of America Journal, 54(2):443–448,1990. [Google Scholar]
- [20].Meers Erik, Rousseau DPL, Lesage Els, Demeersseman Ellen, and Tack FMG. Physico-chemical P removal from the liquid fraction of pig manure as an intermediary step in manure processing. Water, air, and soil pollution, 169(1-4):317–330, 2006. [Google Scholar]
- [21].Mihelcic James R, Fry Lauren M, and Shaw Ryan. Global potential of phosphorus recovery from human urine and feces. Chemosphere, 84(6):832–839,2011. [DOI] [PubMed] [Google Scholar]
- [22].Water sustainability and climate in the Yahara Watershed. University of Wisconsin-Center for Limnology; available at https://wsc.limnology.wisc.edu/about/watershed, 2018. [Online; accessed 23-July-2018]. [Google Scholar]
- [23].Larson R, Sharara M, Good L, Porter T, Zavala VM, Sampat A, and Smith A. Evaluation of manure storage capital projects in the Yahara river watershed. Technical Report for Dane County, WI, 2016.
- [24].Nennich TD, Harrison JH, VanWieringen LM, Meyer D, Heinrichs AJ, Weiss WP, St-Pierre NR, Kincaid RL, Davidson DL, and Block E. Prediction of manure and nutrient excretion from dairy cattle. Journal of Dairy Science, 88(10):3721–3733, 2005. [DOI] [PubMed] [Google Scholar]
- [25].Agricultural waste management field handbook. USDA National Resources Conservation Services (NRCS), 1992. [Google Scholar]
- [26].Sharara Mahmoud A, Runge Troy, Larson Rebecca, and Primm John G. Techno-economic optimization of community-based manure processing. Agricultural Systems, 161:117–123, 2018. [Google Scholar]
- [27].Sampat Apoorva M, Martin-Hernandez Edgar, Martin Mariano, and Zavala Victor M. Technologies and logistics for phosphorus recovery from livestock waste. Clean Technologies and Environmental Policy, pages 1–17, 2018. [Google Scholar]
- [28].Sharara Mahmoud, Sampat Apoorva, Good Laura W, Smith Amanda S, Porter Pamela, Zavala Victor M, Larson Rebecca, and Runge Troy. Spatially explicit methodology for coordinated manure management in shared watersheds. Journal of environmental management, 192:48–56, 2017. [DOI] [PubMed] [Google Scholar]
- [29].Gurobi optimizer reference manual. Gurobi Optimization, LLC, 2018. [Google Scholar]
- [30].Total maximum daily load for total phosphorus in the Wisconsin river basin. Technical report, WI Department of Natural Resources, 2018.
- [31].Topolski Kevin, Noureldin Mohamed MB, Eljack Fadwa T, and El-Halwagi Mahmoud M. An anchor-tenant approach to the synthesis of carbon-hydrogen-oxygen symbiosis networks. Computers and Chemical Engineering, 116:80–90, 2018. [Google Scholar]
- [32].Sampat Apoorva M., Martin Edgar, Martin Mariano, and Zavala Victor M.. Optimization formulations for multi-product supply chain networks. Computers and Chemical Engineering, 104:296–310,2017. [Google Scholar]
Associated Data
This section collects any data citations, data availability statements, or supplementary materials included in this article.