

Abstract
The gene responsible for ataxia telangiectasia syndrome, ATM, is also an intermediate-risk breast cancer susceptibility gene. Numerous studies have been carried out to determine the contribution of ATM gene mutations to breast cancer (BC) risk. Epidemiological surveys, segregation analyses and case-control studies reported BC risk in different forms, including penetrance, Relative Risk, Standardized Incidence Ratio and Odds Ratio. Since the reported estimates vary both qualitatively and quantitatively, we developed a general model allowing the integration of the different types of cancer risk available in the literature. We performed a comprehensive meta-analysis identifying 19 studies, and used our model to obtain a consensus estimate of BC penetrance. The cumulative risk of breast cancer in heterozygous ATM mutation carriers was estimated to be 6.02% by 50 years of age (95% credible interval: 4.58–7.42%) and 32.83% by 80 years of age (95% credible interval: 24.55–40.43%). An accurate assessment of cancer penetrance is crucial in order to allow mutation carriers to make medical and lifestyle decisions that can reduce their chances of developing the disease.
Keywords: ataxia-telangiectasia mutated (ATM) gene, hereditary breast cancer, penetrance, genetic predisposition
Introduction
The ataxia-telangiectasia mutated (ATM) gene encodes a protein kinase which plays a central role in the cellular response to DNA double-strand breaks through the phosphorylation of downstream proteins, including BRCA1, p53 and Chk2 [Shiloh and Ziv, 2013]. Homozygous or compound heterozygous mutations in the ATM gene are the principal cause of ataxia telangiectasia (AT), an autosomal recessive condition characterized by progressive cerebellar degeneration and oculocutaneous telangectasia [Chaudhary and Al-Baradie, 2014]. Moreover, heterozygous carriers of ATM mutations are at increased risk of breast cancer (BC), although the precise magnitude of such a risk is not yet sufficiently well-established. Studies assessing the BC risk associated with ATM mutations fall in three main categories: a) comparison of BC incidence and/or mortality in relatives of AT patients with that in the general population or in spouse controls; b) examination of the pedigrees of mutation carriers to observe co-segregation patterns of ATM mutations with the disease; c) case-control studies comparing the frequency of ATM mutations in BC patients with that in healthy subjects. Since the designs of these studies are different, they typically provide different measures of BC risks: family-based analyses generally estimate penetrance, Relative Risk (RR) or Standardized Incidence Ratio (SIR), while case-control studies report the Odds Ratio (OR). In addition, the results of these studies are not always concordant, with some detecting a strong association between heterozygous ATM mutations and BC susceptibility, while others finding lower evidence of risk. However, the reported findings are not necessarily incompatible, given the large widths of the respective confidence intervals. Overall, epidemiological and molecular analyses estimated that pathogenic mutations in the ATM gene confer approximately a 2- to 3-fold increase in breast cancer risk [Turnbull and Rahman, 2008]. It is important to estimate BC risk more precisely, in order to provide appropriate counseling to heterozygous carriers of ATM mutations.
The aim of this study is two-fold: to develop a simple and general model allowing the meta-analytic integration of different types of cancer risk estimates, including penetrance, RR, SIR and OR, and to apply this model to estimate the BC penetrance associated with heterozygous ATM gene mutations.
Methods
Search strategy and study selection criteria
We performed a PubMed search (up to Feb 10, 2015) of the following keywords in the title/abstract of the articles: [“ATM”] AND [“penetrance” OR “risk”] AND [“breast”]. Additional studies were identified by a manual search of references from original articles and reviews. Inclusion criteria were defined as: 1) family-based segregation analyses or epidemiological studies reporting on cancer risk-related information, including penetrance, RR and SIR; 2) case-control studies comparing BC patients with healthy subjects and reporting either the OR or sufficient data to estimate the OR and its 95% CI. We also included case-control studies in which no mutations were detected in controls (whereby the estimated OR would be infinite), because they still provide useful information for the meta-analysis and excluding them may introduce bias. Papers were excluded for any of the following reasons: studies reporting only on genes or cancers other than ATM and BC; articles not published in English; articles reporting on patients already included in larger studies within our set; family-based studies including fewer than 4 families; articles reporting on a spectrum of gene variants but without any usable information on BC risk; studies not conducted in humans; reviews whose relevant citations have already been included in the literature search; meta-analyses whose relevant citations have already been included in the literature search. Moreover, we excluded papers reporting on ATM polymorphisms (MAF>1%) and VUSs (Variants of Uncertain Significance). Many of the studies we selected examined only rare, pathogenic mutations. However, some case-control studies included polymorphisms or VUSs: in these cases, we considered only rare pathogenic or likely pathogenic mutations in our estimate of BC risk.
Statistical analysis
Model description
Let g be the mutation carrier status with g = 1 denoting carriers of a deleterious mutation and g = 0 non-carriers. We assume that cancer penetrance in mutation carriers is a probability distribution function F1, characterized by n parameters θ11, … , θ1n, that is
The associated density function is denoted by
Analogously, we assume that penetrance in non-carriers is a probability distribution function F0(a; θ01, …, θ0n), with density f0(a; θ01, … , θ0n).
We assume that studies are independent from each other. Thus the total likelihood LT(θ11, … , θ1n) for the meta-analysis is the product of all the study-specific contributions Ls(θ11, … , θ1n). We can define each Ls(θ11, … , θ1n) according to the type of study design and cancer risk provided by study s as follows.
Penetrance
Consider a study reporting a single penetrance value at age a, with a measure of variability . Assuming a normal distribution around , the likelihood function for this study is
For a study providing m penetrance estimates or for a study reporting the entire penetrance curve after we discretize the function in m values , we assume that the likelihood function is a multivariate normal distribution
The off-diagonal elements of the covariance matrix account for dependencies among penetrance estimates at different ages.
Relative Risk (RR)
The RR is generally defined as
where “cancer” refers to the event that an individual is observed with cancer within a study. In studies reporting estimates of RR without individual-level data, our challenge is to express the study-specific likelihood in terms of the penetrance function parameters. A simple approximation is feasible if one can estimate, or make reasonable assumptions about, the distributions G(a | g) g = 0,1 of ages of carriers and non-carriers in the study. On average:
Assuming specifically that G(a | g = 1) = N(a, A1, V12) and G(a | g = 0) = N(a, A0, V02), we propose approximating the likelihood function as
where and are the reported RR and the corresponding measure of variability.
In practice, even G(a | g) may not always be available, in which case it is still possible to make progress using the distribution Q(a | g) g = 0,1 of ages of onset among carriers and non-carriers, and approximating the cancer rates by the average:
where P is the penetrance common to all studies in the analysis, while Q is the study-specific distribution of ages at cancer onset. Under normality assumption for Q, the likelihood can be approximated by
This approach is less desirable than the one above it because it does not consider ages of unaffected study participants.
Standardized Incidence Ratio (SIR)
The SIR is obtained by dividing the observed number of cancer cases among mutation carriers by the number of cases expected on the basis of the disease rate in the general population. Therefore, similarly to the RR, one can approximate via distributions G or Q. In the latter case the likelihood can be approximated as
where P(g = 1) and P(g = 0) are the population frequencies of carriers and non-carriers, respectively.
Odds Ratio (OR)
Here we consider a case-control design. We let
The Odds Ratio can be defined as
Using Bayes’ theorem, we obtain
and
Therefore, using approximations similar to those described for the RR case
assuming that in breast cancer patients the age of onset distributions in the study are Qc(a | g = 1) = Nc(a, A1, V12) and Qc(a | g = 0) = Nc(a, A0, V02). Similarly, assuming that in healthy controls the ages at inclusion in the study are Gh(a | g = 1) = Nh(a, A1, V12) and Gh(a | g = 0) = Nh(a, A0, V02), then
where 1 − F1(a; θ11, … , θ1n) and 1 − F0(a; θ01, … , θ0n) are the disease-free survival functions by age a in carriers and non-carriers, respectively.
As a consequence,
Case-control studies generally report not only the OR itself, but also the numerators and the denominators separately. In that case it may be preferable to write the likelihood as the product of two binomial distributions considering these terms separately, rather than the likelihood of the OR, which implies loss of useful information.
Let mc and mh be the number of mutated cases and the number of mutated healthy controls, respectively, while nc and nh the number of non-mutated cases and controls, respectively. The likelihood function can be written as
Model specification for ATM analysis
In our meta-analysis, we assumed that BC penetrance associated with ATM heterozygous mutations is a Weibull distribution F1, characterized by parameters κ and λ. The cumulative penetrance function is and the corresponding density is . We chose this distribution because, among commonly used parametric curves, it is the most similar to cancer penetrance curves reported in the literature (e.g. Goldgar et al., 2011). It is very rare to develop BC before 15 years of age; therefore to improve fit we performed the analysis using a “breast age” a = age − 15.
We assumed that non-carriers and healthy controls have approximately the same penetrance of the general population, as ATM mutations are sufficiently rare. We assumed that this penetrance is also Weibull, with parameters κ0 and λ0estimated from Surveillance, Epidemiology, and End Results data for the US population (SEER 18 Registries, Incidence, 2008–2012; http://seer.cancer.gov/faststats/selections.php?series=cancer).
Wherever possible, we used distributions Q reported in the corresponding papers. If Q is not specified in the paper, we used the mean age at BC diagnosis and variance of the US general population. Moreover, case-control studies generally provide only the mean age at diagnosis of BC patients and the mean age of healthy controls; therefore, we assumed that Qc(a | g = 1) = Qc(a | g = 0) and Gh(a | g = 1) = Gh(a | g = 0). If the mean age and variance of healthy subjects was not explicitly indicated, we assumed that Qc(a | g = j) = Gh(a | g = j).
Of relevance, P(g = 1) for the ATM pathogenic mutations is not yet well-established. Therefore, for papers providing the SIR, we used LRR instead of LSIR, assuming that BC incidence in the general population is the same as in non-carriers. Similarly, the methodology with LBin is potentially more efficient, because it incorporates additional information separately at the numerator and at the denominator of the Odds Ratio; however, it has the disadvantage of requiring a good external estimate of the prevalence P(g = 1). Therefore, in this particular application we decided to use LOR. To estimate the Odds Ratio for case-control studies in which no mutations were detected in controls (OR theoretically infinite), we added .5 to each cell of the (2×2) table, as suggested by Haldane [1955] and Gart and Zweifel [1967]. In the RR studies, information on G was not available, and thus we approximated the likelihood using Q.
We estimated κ and λ using the maximum likelihood approach. To assess uncertainty, we used a Bayesian approach: assuming that the prior distribution of κ and λ is uniform, we obtained the 95% credible intervals based on posterior probability distributions. More specifically, we drew random pairs of κ and λ uniformly within a suitably broad range (for κ we used 1 through 6 and for λ we used 40 through 500); we calculated the likelihood values for each pair drawn; we used as weights the renormalized likelihood values; we calculated the penetrance values for each pair at different ages (40, 50, 60, 70, 80 years); we sorted the penetrance values keeping the corresponding weights; we cut the cumulative sum of the weights at 0.025 and 0.975 to provide 95% credible intervals. A potential limitation of this method is that intervals do not incorporate study-to-study variation, as the studies are assumed to be independent.
Statistical analysis was performed using the R (version 3.2.0) software [Ihaka and Gentleman, 1996]. R code for analysis is available upon request.
Results
Meta-analysis results
In total, 19 papers were selected by our search criteria. Table 1 shows the main characteristics of the studies selected in the meta-analysis.
Table 1.
Characteristics of the studies included in the meta-analysis
| Study | Country | Case eligibility criteria | Study design | BC risk |
|---|---|---|---|---|
| Goldgar et al, 2011 | USA, Canada, Australia, New Zealand | familial BC, BRCA1/2 negative | family-based segregation analysis | Penetrance curve |
| Thompson et al., 2005 | UK | one family member with AT | cancer incidence in relatives of AT patients | Penetrance curve |
| Swift and Lukin, 2008 | USA, Canada | one family member with AT | cancer incidence in relatives of AT patients | RR |
| Renwick et al., 2006 | UK | familial BC, BRCA1/2 negative | case-control/family-based segregation analysis | RR |
| Olsen et al., 2005 | Denmark, Finland, Norway, Sweden | one family member with AT | cancer incidence in relatives of AT patients | SIR |
| Andrieu et al., 2005 | France | one family member with AT | cancer incidence in relatives of AT patients | SIR |
| Bogdanova et al., 2009 | Belarus, Russia, Poland | mainly unselected BC, except for a small group of familial BC and a group of early-onset BC (<50y) | case-control study | OR |
| Pylkäs et al., 2007 | Finland | familial and unselected BC, BRCA1/2 negative | case-control study | OR |
| Kreiss et al., 2000 | Morocco (Jewish) | unselected BC | case-control study | ORa |
| Turnbull et al., 2012 | UK | familial BC | case-control study | ORa |
| FitzGerald et al., 1997 | USA | early-onset BC (<40y) | case-control study | ORa |
| Teraoka et al., 2001 | USA | early-onset BC (<35y) and/or family history of BC | case-control study | NAb |
| Graña et al., 2011 | Spain | high-risk familial BC, BRCA1/2 negative | case-control study | NA |
| Soukupova et al., 2008 | Czech Republic | familial or early-onset BC (<40y; if bilateral <50y), BRCA1/2 negative | case-control study | NAb |
| Brunet et al., 2008 | Spain | unselected early-onset BC (<46y), BRCA1/2 negative | case-control study | NAb |
| Mangone et al., 2015 | Brazil | sporadic BC | case-control study | NAb |
| Allinen et al., 2002 | Finland | familial and sporadic BC, BRCA1/2 negative | case-control study | NAb |
| Thorstenson et al., 2003 | Austria | familial BC | case-control study | NAb |
| Izatt et al., 1999 | UK | early-onset BC (<40y), moderate/absent family history, BRCA1/2 negative | case-control study | NAb |
NA, not applicable (OR not provided because no mutations were found in healthy controls)
OR was calculated using the data reported in the paper
Polymorphisms and VUSs were excluded
The studies are heterogeneous in terms of population, patient ascertainment, study design and type of BC risk reported. In the Methods section we described a model that allowed us to integrate these different kinds of BC risks and to estimate the penetrance of heterozygous ATM gene mutations, taking into account the contribution of each paper. Results are shown in Figure 1A. The parameters of the Weibull distribution are estimated to be: κ = 3.00; λ = 88.37. The corresponding penetrance is estimated to be 6.02% by 50 years of age (95% credible interval: 4.58–7.42%) and 32.83% by 80 years of age (95% credible interval: 24.55–40.43%).
Figure 1.
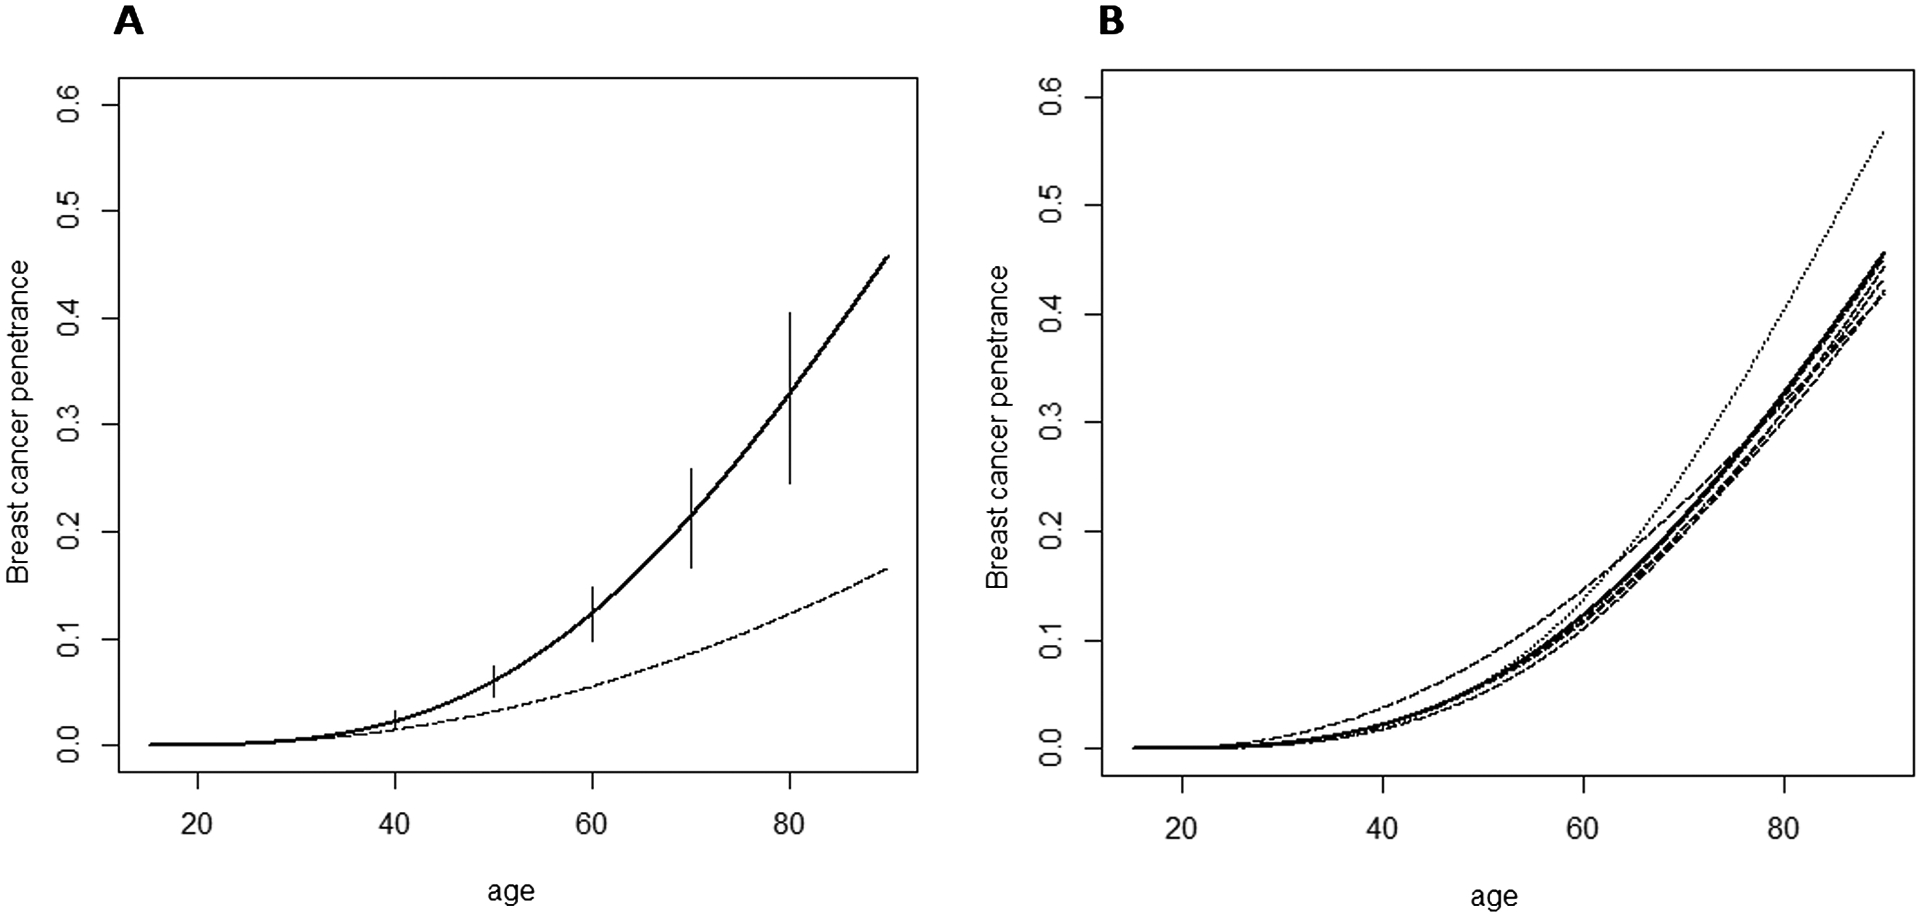
(A) Solid line: cumulative risk of breast cancer in heterozygous ATM mutation carriers along with 95% credible intervals (Weibull parameters: κ = 3.00; λ = 88.37). Dashed line: cumulative risk of breast cancer in non-carriers (Weibull parameters derived from SEER data for the US population: κ0 = 2.25; λ0 = 159.71). (B) Dashed/dotted lines: penetrance curves obtained in the leave-one-study-out tests of sensitivity (the curve obtained after removal of Thompson et al., 2005 is indicated with the dotted line). Solid line: weighted average of dashed/dotted lines.
Sensitivity analysis
To explore if any of the individual studies disproportionally affected our estimates, we performed a leave-one-study-out analysis, in which each of the 19 studies was removed in turn. We inspected the 19 resulting curves, and then estimated the average curve, taking into account the sample size of the excluded paper in order to give a lower weight to those curves obtained after the removal of a large paper. The average curve is no longer constrained to the Weibull form: it is a mixture of Weibull distributions. The 19 resulting penetrance curves, as well as the weighted average curve, are shown in Figure 1B.
Our estimates generally show little sensitivity to the removal of individual studies, indicating that our results are likely to be robust. Moreover, the average curve resulting from the tests of sensitivity is nearly identical to the curve obtained including all the 19 studies. Specifically, the cumulative risk of breast cancer by age 50 is estimated to be 6.02% according to the all-inclusive curve and 5.98% according to the weighted average curve, while the cumulative risk by age 80 is estimated to be 32.83% and 32.65% according to the all-inclusive curve and the weighted average curve, respectively.
Discussion
Three categories of BC susceptibility alleles are currently described. High-penetrance genes, such as BRCA1 and BRCA2, are characterized by multiple, individually rare, loss-of-function mutations that confer a high BC risk (RR>10). Low-penetrance variants, identified through genome-wide association studies, are common but associated with small increases in risk (RR 1.08–1.26). Finally, moderate-penetrance genes, including ATM, CHEK2, BRIP1 and PALB2, are characterized by rare, loss-of-function mutations that confer intermediate risks (RR 2–4) [Turnbull and Rahman, 2008].
After the first observation that female relatives of AT patients are at increased risk of developing breast cancer [Swift, 1976], numerous studies have been performed to clarify the role of ATM gene in BC susceptibility and to quantify such a risk. As a result of the diverse designs of published studies, different types of BC risk are available in the literature: some papers reported a full estimate of the penetrance curve, others estimated the BC risk of ATM mutation carriers relative to non-carriers (RR) or to the general population (SIR), while case-control studies evaluated the proportion of carriers among patients and healthy subjects and reported the OR. The goal of this study was to perform a meta-analysis including all the information available in the literature, and to integrate the different measures of BC risk into a single penetrance analysis. Of note, ATM truncating-mutations might have a different effect on ATM activity and hence on cancer susceptibility compared with missense variants [Gatti et al., 1999]. Evidence exists that the most severe missense substitutions, falling in specific ATM domains, actually confer greater risk of breast cancer than protein-truncating mutations [Tavtigian et al., 2009; Tavtigian and Chenevix-Trench, 2014]. If this were the case, it would be interesting to estimate the different penetrance associated with distinct types of mutation. However, the majority of the papers identified in our search included mixed pool of mutation types; therefore it was not feasible to separate the effects of these types of mutations in our analysis. Instead, it seemed more reasonable to consider the average risk among a group of carriers with a representative mix of pathogenic mutations.
The model developed here allowed us to estimate the penetrance of breast cancer in carriers of a pathogenic ATM allele. We also performed a sensitivity analysis by omitting each study in turn, to identify potential outlying studies, which may have impact on between-study heterogeneity. Assessing heterogeneity across studies in a meta-analysis is a crucial issue. We found it challenging to use traditional methods, because we use a two-parameter model for the penetrance, but some studies only report a single summary statistic. While these studies are informative when incorporated in the overall analysis, if taken in isolation do not provide meaningful penetrance estimates. Accordingly, we decided to address the issue of heterogeneity in a way that is free from the choice of study-specific summary statistics, and accomplished this through the use of a leave-one-study-out analysis. Penetrance estimates were generally insensitive to the removal of individual studies. The most influential when removed is Thompson et al. [2005] (dotted line in Figure 1B), which was performed on a very large group of AT relatives, and is one of two papers, together with Goldgar et al. [2011], to provide the entire penetrance curve with 95% CI. Therefore, it gives an important contribution to the meta-analysis and its exclusion has a comparatively higher effect on our estimates of BC risk. Even in that case, after the removal of Thompson et al. the penetrance is not substantially altered and the curve estimated by the meta-analysis, which includes all the 19 papers, is very similar to the average curve obtained after the sensitivity tests, indicating that our findings are likely to be robust.
To the best of our knowledge, our meta-analysis of different types of cancer risk is unique in the biomedical literature. The advantage of our strategy is the possibility of using all the information available in the literature, which should lead to a more precise estimate of penetrance. A potential limitation is the reliance on a parametric form for the penetrance, dictated by the paucity of studies reporting sufficient detail to use more flexible models. Parametric assumption can be hard to check and to relax when most studies report RR or OR. Nonetheless, the general approach described in the Methods could be implemented in a more flexible way if data are richer. The model we built here could also be used to estimate the risk associated with mutations in other genes suspected to play a role in cancer susceptibility and other types of cancer, with no restriction on the type of mutation (heterozygous or homozygous; rare or common). It is important to get an accurate quantification of cancer risk, in order to include mutation carriers in appropriate cancer surveillance programs and help them to evaluate the possibility of undergoing surgical interventions that can reduce their chances of developing the disease.
Acknowledgements
Monica Marabelli received support from the Pavia-Boston project, promoted by the University of Pavia. Giovanni Parmigiani and Su-Chun Cheng received support from NCI grant 5R21CA177233-02.
Footnotes
Conflict of interest
The authors declare no conflict of interest.
References
- Allinen M, Launonen V, Laake K, Jansen L, Huusko P, Kääriäinen H, Børresen-Dale AL, Winqvist R. 2002. ATM mutations in Finnish breast cancer patients. J Med Genet 39:192–6. [DOI] [PMC free article] [PubMed] [Google Scholar]
- Andrieu N, Cavaciuti E, Laugé A, Ossian K, Janin N, Hall J, Stoppa-Lyonnet D. 2005. Ataxia-telangiectasia genes and breast cancer risk in a French family study. J Dairy Res 72 Spec No:73–80. [DOI] [PubMed] [Google Scholar]
- Bogdanova N, Cybulski C, Bermisheva M, Datsyuk I, Yamini P, Hillemanns P, Antonenkova NN, Khusnutdinova E, Lubinski J, Dörk T. 2009. A nonsense mutation (E1978X) in the ATM gene is associated with breast cancer. Breast Cancer Res Treat 118:207–11. [DOI] [PubMed] [Google Scholar]
- Brunet J, Gutiérrez-Enríquez S, Torres A, Bérez V, Sanjosé S, Galceran J, Izquierdo A, Menéndez JA, Gumà J, Borràs J. 2008. ATM germline mutations in Spanish early-onset breast cancer patients negative for BRCA1/BRCA2 mutations. Clin Genet 73:465–73. [DOI] [PubMed] [Google Scholar]
- Chaudhary MW, Al-Baradie RS. 2014. Ataxia-telangiectasia: future prospects. Appl Clin Genet 7:159–67. [DOI] [PMC free article] [PubMed] [Google Scholar]
- FitzGerald MG, Bean JM, Hegde SR, Unsal H, MacDonald DJ, Harkin DP, Finkelstein DM, Isselbacher KJ, Haber DA. 1997. Heterozygous ATM mutations do not contribute to early onset of breast cancer. Nat Genet 15:307–10. [DOI] [PubMed] [Google Scholar]
- Gart JJ, Zweifel JR. 1967. On the bias of various estimators of the logit and its variance with application to quantal bioassay. Biometrika 54:181–7. [PubMed] [Google Scholar]
- Gatti RA, Tward A, Concannon P. 1999. Cancer risk in ATM heterozygotes: a model of phenotypic and mechanistic differences between missense and truncating mutations. Mol Genet Metab 68:419–23. [DOI] [PubMed] [Google Scholar]
- Goldgar DE, Healey S, Dowty JG, Da Silva L, Chen X, Spurdle AB, Terry MB, Daly MJ, Buys SM, Southey MC, Andrulis I, John EM; BCFR; kConFab, Khanna KK, Hopper JL, Oefner PJ, Lakhani S, Chenevix-Trench G. 2011. Rare variants in the ATM gene and risk of breast cancer. Breast Cancer Res 13:R73. [DOI] [PMC free article] [PubMed] [Google Scholar]
- Graña B, Fachal L, Darder E, Balmaña J, Ramón Y Cajal T, Blanco I, Torres A, Lázaro C, Diez O, Alonso C, Santamariña M, Velasco A, Teulé A, Lasa A, Blanco A, Izquierdo A, Borràs J, Gutiérrez-Enríquez S, Vega A, Brunet J. 2011. Germline ATM mutational analysis in BRCA1/BRCA2 negative hereditary breast cancer families by MALDI-TOF mass spectrometry. Breast Cancer Res Treat 128:573–9. [DOI] [PubMed] [Google Scholar]
- Haldane JBS. 1955. The estimation and significance of the logarithm of a ratio of frequencies. Ann Hum Genet 20:309–11. [DOI] [PubMed] [Google Scholar]
- Ihaka R, Gentleman R. 1996. R: A language for data analysis and graphics. Journal of Computational and Graphical Statistics 5:299–314. [Google Scholar]
- Izatt L, Greenman J, Hodgson S, Ellis D, Watts S, Scott G, Jacobs C, Liebmann R, Zvelebil MJ, Mathew C, Solomon E. 1999. Identification of germline missense mutations and rare allelic variants in the ATM gene in early-onset breast cancer. Genes Chromosomes Cancer 26:286–94. [PubMed] [Google Scholar]
- Kreiss Y, Barak F, Baruch RG, Levy-Lahad E, Pras E, Friedman E. 2000. The founder mutations in the BRCA1, BRCA2, and ATM genes in Moroccan Jewish women with breast cancer. Genet Test 4:403–7. [DOI] [PubMed] [Google Scholar]
- Mangone FR, Miracca EC, Feilotter HE, Mulligan LM, Nagai MA. 2015. ATM gene mutations in sporadic breast cancer patients from Brazil. Springerplus 4:23. [DOI] [PMC free article] [PubMed] [Google Scholar]
- Olsen JH, Hahnemann JM, Børresen-Dale AL, Tretli S, Kleinerman R, Sankila R, Hammarström L, Robsahm TE, Kääriäinen H, Bregård A, Brøndum-Nielsen K, Yuen J, Tucker M. 2005. Breast and other cancers in 1445 blood relatives of 75 Nordic patients with ataxia telangiectasia. Br J Cancer 93:260–5. [DOI] [PMC free article] [PubMed] [Google Scholar]
- Pylkäs K, Tommiska J, Syrjäkoski K, Kere J, Gatei M, Waddell N, Allinen M, Karppinen SM, Rapakko K, Kääriäinen H, Aittomäki K, Blomqvist C, Mustonen A, Holli K, Khanna KK, Kallioniemi OP, Nevanlinna H, Winqvist R. 2007. Evaluation of the role of Finnish ataxia-telangiectasia mutations in hereditary predisposition to breast cancer. Carcinogenesis 28:1040–5. [DOI] [PubMed] [Google Scholar]
- Renwick A, Thompson D, Seal S, Kelly P, Chagtai T, Ahmed M, North B, Jayatilake H, Barfoot R, Spanova K, McGuffog L, Evans DG, Eccles D; Breast Cancer Susceptibility Collaboration (UK), Easton DF, Stratton MR, Rahman N. 2006. ATM mutations that cause ataxia-telangiectasia are breast cancer susceptibility alleles. Nat Genet 38:873–5. [DOI] [PubMed] [Google Scholar]
- Shiloh Y, Ziv Y. 2013. The ATM protein kinase: regulating the cellular response to genotoxic stress, and more. Nat Rev Mol Cell Biol 14:197–210. [PubMed] [Google Scholar]
- Soukupova J, Dundr P, Kleibl Z, Pohlreich P. 2008. Contribution of mutations in ATM to breast cancer development in the Czech population. Oncol Rep 19:1505–10. [PubMed] [Google Scholar]
- Swift M 1976. Malignant neoplasms in the families of patients with ataxia-telangiectasia. Cancer Res 36:209–15. [PubMed] [Google Scholar]
- Swift M, Lukin JL. 2008. Breast cancer incidence and the effect of cigarette smoking in heterozygous carriers of mutations in the ataxia-telangiectasia gene. Cancer Epidemiol Biomarkers Prev 17:3188–92. [DOI] [PubMed] [Google Scholar]
- Tavtigian SV, Oefner PJ, Babikyan D, Hartmann A, Healey S, Le Calvez-Kelm F, Lesueur F, Byrnes GB, Chuang SC, Forey N, Feuchtinger C, Gioia L, Hall J, Hashibe M, Herte B, McKay-Chopin S, Thomas A, Vallée MP, Voegele C, Webb PM, Whiteman DC; Australian Cancer Study; Breast Cancer Family Registries (BCFR); Kathleen Cuningham Foundation Consortium for Research into Familial Aspects of Breast Cancer (kConFab), Sangrajrang S, Hopper JL, Southey MC, Andrulis IL, John EM, Chenevix-Trench G. 2009. Rare, evolutionarily unlikely missense substitutions in ATM confer increased risk of breast cancer. Am J Hum Genet 85:427–46. [DOI] [PMC free article] [PubMed] [Google Scholar]
- Tavtigian SV, Chenevix-Trench G. 2014. Growing recognition of the role for rare missense substitutions in breast cancer susceptibility. Biomark Med 8:589–603. [DOI] [PMC free article] [PubMed] [Google Scholar]
- Teraoka SN, Malone KE, Doody DR, Suter NM, Ostrander EA, Daling JR, Concannon P. 2001. Increased frequency of ATM mutations in breast carcinoma patients with early onset disease and positive family history. Cancer 92:479–87. [DOI] [PubMed] [Google Scholar]
- Thompson D, Duedal S, Kirner J, McGuffog L, Last J, Reiman A, Byrd P, Taylor M, Easton DF. 2005. Cancer risks and mortality in heterozygous ATM mutation carriers. J Natl Cancer Inst 97:813–22. [DOI] [PubMed] [Google Scholar]
- Thorstenson YR, Roxas A, Kroiss R, Jenkins MA, Yu KM, Bachrich T, Muhr D, Wayne TL, Chu G, Davis RW, Wagner TM, Oefner PJ. 2003. Contributions of ATM mutations to familial breast and ovarian cancer. Cancer Res 63:3325–33. [PubMed] [Google Scholar]
- Turnbull C, Rahman N. 2008. Genetic predisposition to breast cancer: past, present, and future. Annu Rev Genomics Hum Genet 9:321–45. [DOI] [PubMed] [Google Scholar]
- Turnbull C, Seal S, Renwick A, Warren-Perry M, Hughes D, Elliott A, Pernet D, Peock S, Adlard JW, Barwell J, Berg J, Brady AF, Brewer C, Brice G, Chapman C, Cook J, Davidson R, Donaldson A, Douglas F, Greenhalgh L, Henderson A, Izatt L, Kumar A, Lalloo F, Miedzybrodzka Z, Morrison PJ, Paterson J, Porteous M, Rogers MT, Shanley S, Walker L; Breast Cancer Susceptibility Collaboration (UK), EMBRACE, Ahmed M, Eccles D, Evans DG, Donnelly P, Easton DF, Stratton MR, Rahman N. 2012. Gene-gene interactions in breast cancer susceptibility. Hum Mol Genet 21:958–62. [DOI] [PMC free article] [PubMed] [Google Scholar]