Abstract
The liquid-cooled thermal management system based on a flat heat pipe has a good thermal management effect on a single battery pack, and this article further applies it to a power battery system to verify the thermal management effect. The effects of different discharge rates, different coolant flow rates, and different coolant inlet temperatures on the temperature distribution uniformity of the power battery system were analyzed, and the effectiveness of the flat heat pipe in improving the thermal equilibrium performance of the liquid-cooled thermal management system was verified.
1. Introduction
Lithium-ion batteries have been widely applied in electric vehicles and hybrid vehicles for energy density, absence of memory effect, and long cycle life.1−4 However, it forms a severe challenge to the battery safety because of the fast increasing demands of electric vehicle performance, such as high driving mileage and fast acceleration.5 This is because that the battery temperature will keep rising with the space constraint and time accumulation during charging and discharging processes.6−8 When it exceeds the safety temperature range (−20 to 60 °C),9 thermal runaway maybe caused and the consequence is fire accident. Actually, although the acceptable operating temperature range for Li-ion batteries is −20 to 60 °C, it is recommended to keep the temperature range within 15–35 °C to maintain optimal performance.10 Therefore, the battery thermal management system (BTMS) has received extensive attention in the research field and electric vehicle manufacturers. The maximum temperature and the temperature difference of battery are the main parameters to assess the heat dissipation performance of BTMS.
Many researchers have proved that liquid cooling is almost one of the most promising cooling methods compared to air cooling, although the latter have advantages in the production cost, utility rate of space, structure complexity, and so on. The microchannel liquid cold and heat model of single-layer 18650-type lithium ion battery system was established by Zhao.11 The effects of discharge rate, coolant inlet velocity, contact area between the battery and the water-cooled tube, and the contact area between the battery and the water-cooled tube on the heat dissipation of the battery system were studied. Jarrett and Kim11,12 discussed the use of mathematical algorithms to optimize the geometry of snake-shaped channel cold plate design by adjusting the channel width and position, and then the influence of different boundary conditions on optimization was analyzed. Tong13 devised a liquid cooling-based BTMS for the prismatic bipolar Li-ion battery pack. Two cold plates contain a battery system which possesses a series of stacks. Average temperature and temperature uniformity can be improved by increasing coolant flow or plate wall thickness at the cost of increasing pumping power. Xu14 analyzed the influence of diverse water-cooled plate flow, inlet flow rate, and ambient temperature on the heat dissipation performance of single-cell 2 and 12-string battery systems. The results show that the maximum temperature rise and the maximum internal temperature difference of the battery system in the dual-inlet and dual-outlet liquid cooling system are significantly reduced, and the heat dissipation efficiency is improved compared with the single inlet and single outlet flow path. No matter which runner scheme is adopted, there is an optimal feed flow rate of 450 L/h, which minimizes both the maximum temperature rise and the maximum internal temperature difference. Conduction elements made of the highly conductive metal was used to envelop the cylindrical cells. Lan15 introduced a novel design of BTMS with discrete aluminum flat tubes twining around the prismatic cells. Each tube contains many microchannels for water flow, which improves the heat transfer efficiency. The results show that the method can well control the maximum temperature and temperature difference, and the parasitic power consumption is very small. Increasing the number of stacks in the cold plate results in poor thermal performance. Huo16 analyzed an aluminum cold plate-based BTMS with ramrod minichannels. The parameters of coolant channels, flow direction, inlet liquid water flow rate, and ambient temperature at 5 °C were analyzed. The best flow direction for a given BTMS is from one side of the electrode to the other.
It can be seen that many researchers focused on the water-cooling plate, and many structure changes can affect the heat dissipation performance of liquid cooling in this way from the previous research. However, the biggest problem is that batteries are cold on one side and hot on the other side because the water-cooling plate can be only placed at the bottom of batteries to keep the utility rate of space and energy density. Actually, the real function of the BTMS is bringing the heat of the batteries away. Therefore, the heat transfer between the batteries and the BTMS is the key point. Most heat is transferred along the height direction (longitudinal heat transfer) instead of the thickness direction according to the winding structure of batteries which reflects that the heat conductivity of the height direction is far beyond that of the thickness direction in reality.
A heat pipe, a very high-efficiency heat transfer device, meets the requirement of improving the longitudinal heat transfer and brings very small change to the structure complexity. Actually, the heat pipe has been applied in BTMS and it works. Feng17 embedded that the heat pipe cooling device in the center of the battery pack can effectively reduce the operating temperature and strain of the lithium battery. Rao18 conducted an experimental study on the feasibility of heat pipes in the thermal management of electric vehicle batteries. There are four copper tubes between the two battery-sized cylindrical heaters, and the condenser part is cooled by a water bath. The study found that for a given system, if the input thermal power does not exceed 50 W, the battery temperature can be kept below 50 °C. In order to make the temperature difference less than 5 °C, the maximum heat production rate is 30 W. Jiang19 proposed a sandwich-cooling structure composed of batteries, phase change materials and heat pipes, and verified the lumped thermal model of the cooling structure by experimental data. The heat pipe can be used to recover the latent heat of the phase change material with an appropriate melting point at the end of each cycle to ensure that the battery temperature is low when it is used for a long time. Mo20 used experiments to verify the influence of a microheat pipe array thermal management system on the battery operating temperature and temperature difference. At a discharge rate of 3 C, Tmax can be kept below 43.7 °C and ΔT is below 4.9 °C. Zhao21 developed a BTMS that combines heat pipes and wet cooling. The proposed BTMS relies on ultrathin heat pipes, which can effectively transfer heat from the battery side to the cooling end. The heat pipe BTMS also introduces a combination of natural convection, fan cooling, and wet cooling methods. The system can control the temperature of the battery pack within an appropriate temperature range with minimal energy and water spray costs. Behi22 discussed the effects of different cooling methods and found that the forced air cooling, the maximum module temperature of the heat pipe and the heat pipe with copper sheets (HPCS) cooling strategy, reached 42.4, 37.5, and 37.1 °C, compared with natural air cooling, the highest can be reduced by 34.5, 42.1, and 42.7%. In addition, the temperature uniformity of the battery modules used for forced air cooling, heat pipes, and HPCS was improved by 39.2, 66.5, and 73.4%, respectively.
In this paper, a lithium ion battery model is established to invest in the longitudinal heat transfer key affecting factors, and a new heat pipe (flat heat pipe)-based BTMS and a three-dimension (3D) battery thermal model are proposed. The flat heat pipe can make a sufficient contact compared to the normal heat pipe, which can transfer the heat more quickly and uniformly. In addition, the battery thermal model is verified by the experiment. The charging and discharging rate and the flow rate are the main research points to analyze their effects on the heat dissipation performance which can provide important guidance for the BTMS design.
2. Results and Discussion
2.1. Different Discharge Rate
In this section, first, different cooling methods are simulated and compared, and the cooling effects of air cooling, liquid cooling, and flat heat pipe cooling on the battery pack under 1 C discharge rate are compared. The heat dissipation data of the three cooling modes are shown in Table 1. Figure 1 shows the maximum temperature of air cooling, liquid cooling, and flat heat pipe cooling battery pack under 1 C discharge rate. It can be seen that the cooling effect of the flat heat pipe cooling heat management system is far better than the other two cooling methods.
Table 1. Power Battery Temperature Data of Three Cooling Methods under 1 C.
| cooling method | lowest temp | max temp | max temp difference |
|---|---|---|---|
| air cooling | 31.34 | 34.76 | 3.42 |
| liquid cooling | 25.96 | 28.06 | 2.10 |
| heat pipe cooling | 21.61 | 23.69 | 2.08 |
Figure 1.
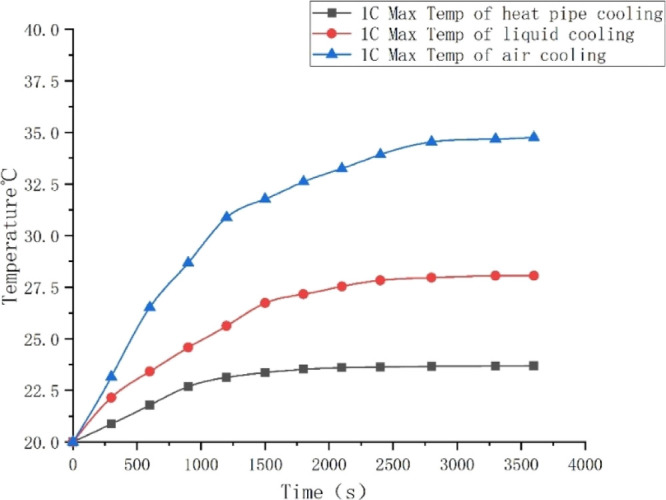
Maximum temperature of the battery pack at 1 C discharge rate.
Compared with the maximum temperature difference of 9.906 °C for the liquid-cooled double-layer BTMS,23 the temperature difference of the flat heat pipe thermal management system is only 2.08 °C. The maximum temperature of the battery pack of the parallel liquid-cooling BTMS with different flow paths is 27.98 °C.24 The maximum temperature of the battery pack of the flat heat pipe thermal management system is only 23.69 °C. This is because the excellent longitudinal heat transfer capability of the flat heat pipe thermal management system can transfer more heat.
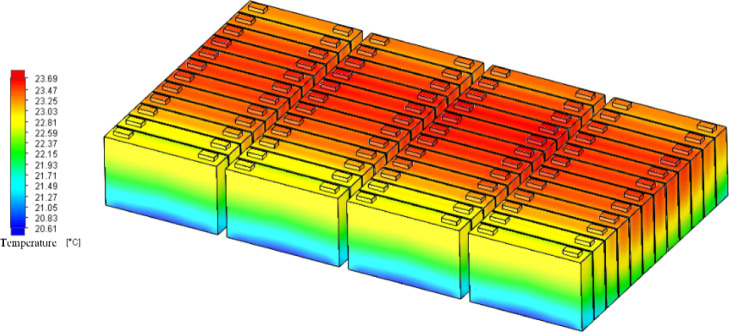
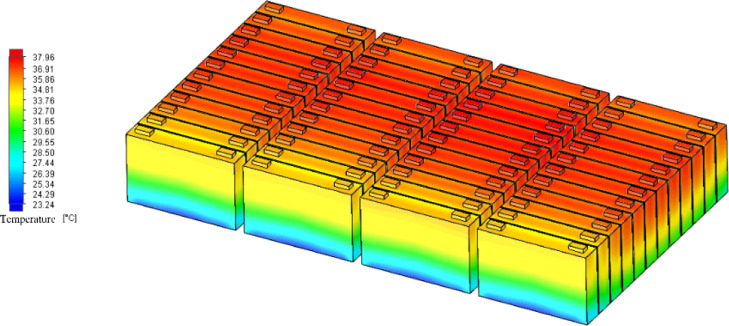
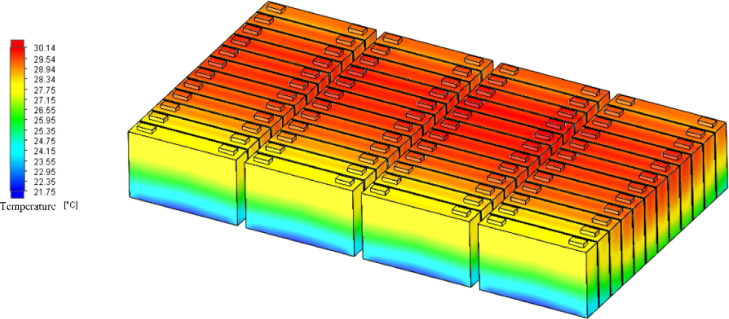
Next, this section analyzes the influence of different discharge multiples on the temperature distribution uniformity of the power battery system. Figures 2–4 are the temperature distribution diagrams of the power battery system under 1, 2, and 3 C discharge multiples, respectively.
Figure 2.
Temperature distribution of the power battery system under 1 C discharge rate.
Figure 4.
Temperature distribution of the power battery system under 3 C discharge rate.
Figure 3.
Temperature distribution of the power battery system under 2 C discharge rate.
By comparing the three temperature distributions, it can be seen that the temperature distribution characteristics of the power battery system are basically the same under different discharge multiples and the overall temperature distribution uniformity is good. The higher the discharge rate, the higher the maximum temperature of the power battery system. At three discharge multiples, the temperature distribution of the four battery packs in the power battery system is similar. Along the direction of coolant flow, the high-temperature area in each battery pack increases first and then remains basically unchanged. However, the proportion of the high-temperature area in the whole battery pack is slightly higher than that of the no. 2 and no. 3 battery pack in the middle than that of the no. 1 and no. 4 battery pack.
At the same time, the two most front-end battery monomers in the four battery packs are located near the liquid cold plate inlet, which has the best heat dissipation condition and the best temperature distribution uniformity, and the highest temperature is also significantly lower than that of the 10 rear battery monomers. 1–4 battery high temperature area in 6–9, 18–21, 30–33, 42–45 maximum battery monomer, the battery pack from no. 10, 12, no. 34, no. 46 battery monomer backwards the amplitude of the high temperature area in slightly down, this is mainly due to the near the liquid into the mouth, just contact with the battery monomer, coolant temperature rise, heat dissipation effect is better, when at the bottom of the cooling fluid flows through the battery monomer gradually, the temperature rise gradually, and the temperature decreases of monomer battery, heat dissipation effect, and for each battery pack at the back of the battery monomer, because at the end of the battery pack, compared with the middle part of the battery, it is in good contact with air, so the high-temperature area is reduced. In the direction of cell height, from top to bottom, the four battery packs show the distribution characteristics of gradually decreasing temperature.
The similar temperature distribution characteristics of the four battery packs indicate that the flat-plate heat pipe has a good heat transfer effect in the battery pack and transfers the heat accumulated in the upper and middle positions of each battery pack to the liquid cooling board and the lower temperature area of the battery pack, so that the overall temperature distribution uniformity of the power battery system is better.
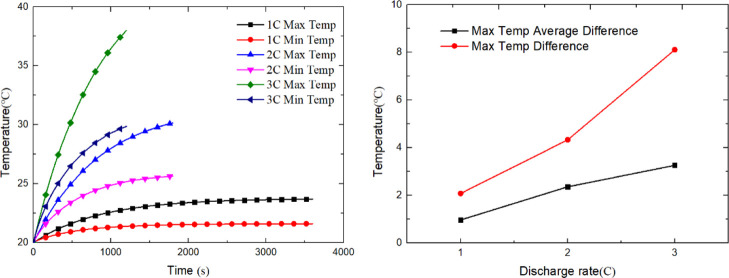
The analysis data in the three cases are shown in Table 2. Figure 5 shows the maximum temperature rise and maximum temperature difference of the power battery system and the maximum temperature difference curve of the average temperature of each cell under 1, 2, and 3 C discharge multiples. As can be seen from the figure, with the increase of the discharge rate, the maximum temperature, maximum temperature difference of the dynamic power battery system, and the maximum temperature difference of the average temperature of each battery unit keep increasing. From Table 2, it can be seen that for 1 C discharge rate, the highest temperature is 23.69 °C, the maximum temperature is 2.08 °C, and the average temperature of the battery monomer maximum temperature is 0.97 °C. For 2 C discharge rate, the highest temperature is 30.14 °C, the maximum temperature is 4.33 °C, and the average temperature of the battery monomer maximum temperature is 2.36 °C. For 3 C discharge rate, the highest temperature is 37.96 °C, the maximum temperature is 8.11 °C, and the average temperature of the battery monomer maximum temperature is 3.26 °C.
Table 2. Temperature Data of the Power Battery System under Different Discharge Rates.
| discharge rate (C) | max temp rise | max temp difference | max temp average difference |
|---|---|---|---|
| 1 | 23.69 | 2.08 | 0.97 |
| 2 | 30.14 | 4.33 | 2.36 |
| 3 | 37.96 | 8.11 | 3.26 |
Figure 5.
Temperature data of the power battery system under different discharge rates.
Combined with the temperature distribution diagram, it can be seen that the flat heat pipe fully transfers the heat from the high-temperature area in the middle of each battery pack to the battery monomer with lower ambient temperature and the liquid cooling plate, so that the temperature distribution characteristics of each battery monomer in the power battery system are basically the same. However, after the coolant is shunted by the liquid cooling plates of multiple battery packs, the cooling effect is somewhat reduced. Therefore, the control ability for the maximum temperature is weakened. When the discharge rate of the battery increases, the heat generation power increases and the maximum temperature of the power battery system increases. But in fact, the average temperature of the battery monomer maximum temperature difference in up to 3 C, 1 C discharge times by only increased by 2.29 °C, is further evidence that each battery monomer in the power battery system basically work under the same conditions of temperature, the temperature distribution uniformity is good, avoiding the short board effect.
2.2. Different Inlet Flow Rate
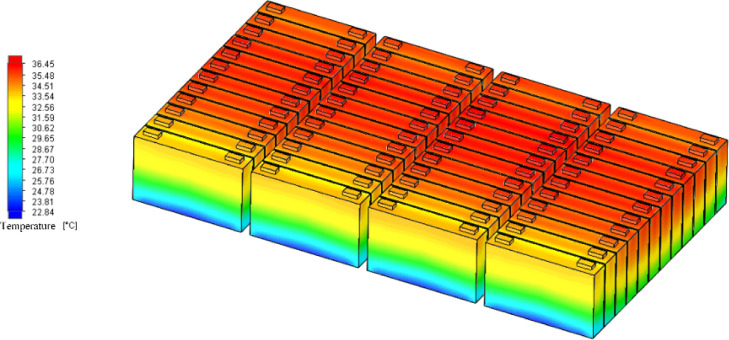
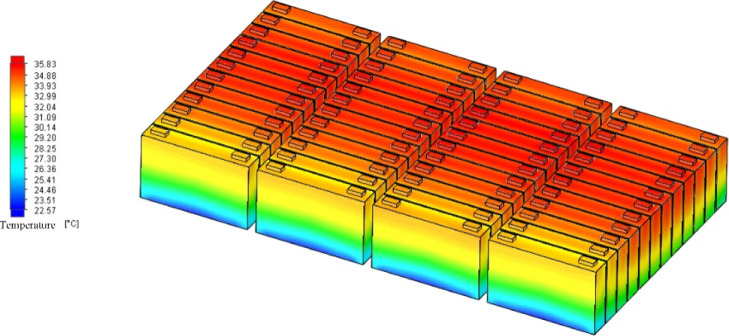
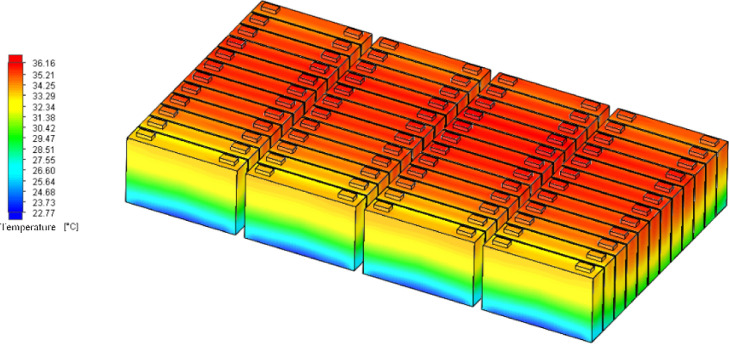
This section studies the uniformity of temperature distribution in the power battery system under different coolant inlet flow rates. The discharge rate is 3 C, and the simulation time is 1200 s. Figures 6–8 are the temperature distribution diagrams of the power battery system. It can be seen from the figure that, at 3 C discharge rate, the increase of coolant inlet flow has little influence on the distribution of high- and low-temperature regions of nos. 1–4 battery pack.
Figure 6.
Temperature distribution of the power battery system when the flow rate is 700 L/h.
Figure 8.
Temperature distribution of the power battery system when the flow rate is 800 L/h.
Figure 7.
Temperature distribution of the power battery system when the flow rate is 750 L/h.
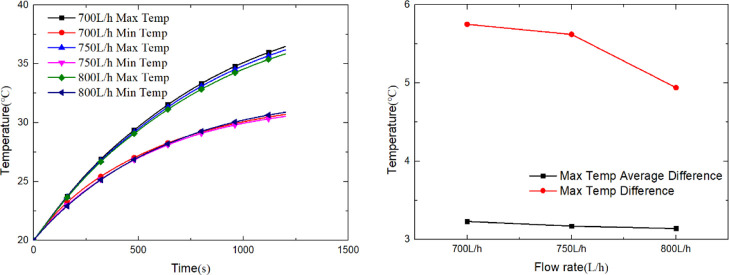
The analysis data in three cases are shown in Table 3. Figure 9 shows the temperature rise, maximum temperature difference, and the maximum temperature difference curve of the average temperature of each battery unit under the cooling liquid inlet flow rate of 700, 750, and 800 L/h of the power battery system. Table 3 shows that for a liquid flow rate of 700 L/h, the highest temperature is 36.45 °C, the maximum temperature is 5.75 °C, and the average temperature of the battery monomer maximum temperature is 3.23 °C. For 750 L/h, the highest temperature is 36.16 °C, the maximum temperature is 5.62 °C, and the average temperature of the battery monomer maximum temperature is 3.17 °C. For 800 L/h, the highest temperature is 35.83 °C, the maximum temperature is 4.94 °C, and the average temperature of the battery monomer maximum temperature is 3.14 °C.
Table 3. Temperature Data of the Power Battery System with Different Flow Rates.
| flow rate (L/h) | max temp rise | max temp difference | max temp average difference |
|---|---|---|---|
| 700 | 36.45 | 5.75 | 3.23 |
| 750 | 36.16 | 5.62 | 3.17 |
| 800 | 35.83 | 4.94 | 3.14 |
Figure 9.
Temperature data of the power battery system with different inlet flow rates.
Combined with the temperature distribution can be seen that the ascension of cooling liquid into the liquid flow of the power battery system is small, the influence of the temperature distribution in the trend into the liquid flow rate increased from 700 to 800 L/h, the battery monomer average maximum temperature difference temperature is 0.09 °C, and the basic remain unchanged. However, the liquid flow ascension to power battery system had a greater influence on the maximum temperature difference; in the liquid flow rate of 800 L/h, the maximum temperature difference is lower than 5 °C; if it is more than 700 L/h, the temperature was reduced by 0.81 °C. This is mainly because of the increase of coolant flow, which increases the heat dissipation capacity of the liquid cooling plate. At the same time, because of the large temperature difference between the upper and lower parts of the plate heat pipe, the heat transfer effect becomes stronger and more heat is transferred to the liquid cooling plate within the same time. From the perspective of the maximum temperature difference of the average temperature of each battery cell, it can be seen that the temperature distribution characteristics of each battery cell are basically the same under the three liquid inlet flows.
2.3. Different Inlet Flow Temperatures
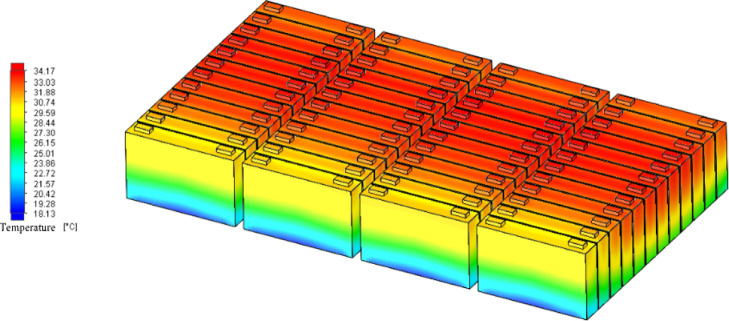
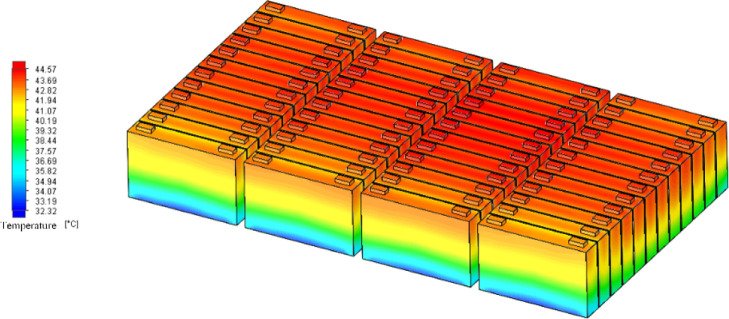
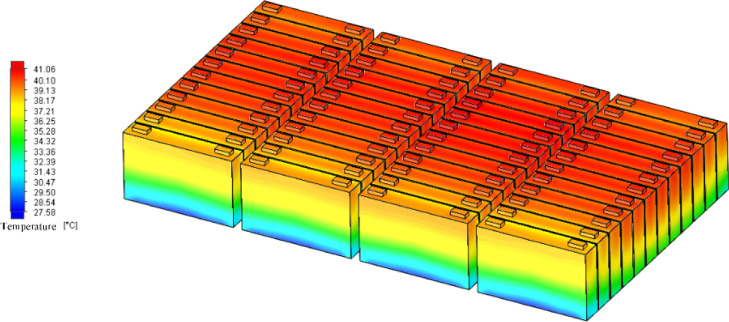
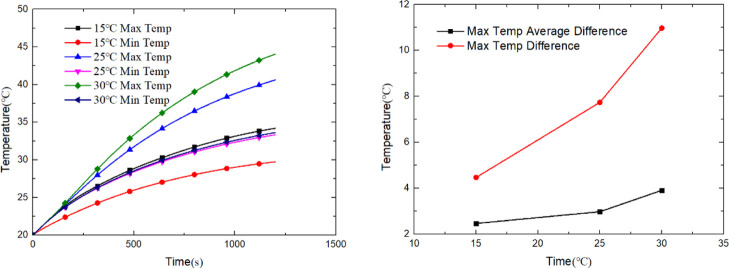
In this section, the temperature distribution characteristics of the power battery under different coolant inlet temperatures are studied. The discharge rate is 3 C, and the simulation time is 1200 s. Cooling liquid into the liquid temperatures of 15, 25, and 30 °C is given in Table 4. Figures 10–12 show the temperature distribution of the power battery system. It can be seen from the figure that the lower the inlet temperature of the coolant, the lower the maximum temperature of the power battery system.
Table 4. Temperature Data of the Power Battery System with Different Inlet Flow Temperatures.
| inlet flow temp (°C) | max temp rise | max temp difference | max temp average difference |
|---|---|---|---|
| 15 | 34.20 | 4.47 | 2.47 |
| 25 | 41.06 | 7.74 | 2.98 |
| 30 | 44.57 | 10.97 | 3.91 |
Figure 10.
Temperature distribution of the power battery system when the inlet flow temperature is 15 °C.
Figure 12.
Temperature distribution of the power battery system when the inlet flow temperature is 30 °C.
Figure 11.
Temperature distribution of the power battery system when the inlet flow temperature is 25 °C.
Analysis data of three cases as shown in Table 4 and Figure 13 are 15, 25, and 30 °C cooling liquid into the liquid temperature power battery system temperature, maximum temperature difference, and maximum temperature difference between the average temperature of each battery monomer curve. Table 4 shows that for 15 °C, the highest temperature is 34.20 °C, the maximum temperature is 4.47 °C, and the average temperature of the battery monomer maximum temperature is 2.47 °C. For 25 °C, the highest temperature is 41.06 °C, the maximum temperature is 7.74 °C, and the average temperature of the battery monomer maximum temperature is 2.98 °C. For 30 °C, the highest temperature is 44.57 °C, the maximum temperature is 10.97 °C, and the average temperature of the battery monomer maximum temperature is 3.91 °C.
Figure 13.
Temperature data of the power battery system with different inlet flow temperatures.
Combined with temperature distribution can be seen that the improvement of cooling liquid into the liquid temperature reduces the surface plate heat dissipation ability, the high temperature in the middle of the flat heat pipe will be caused by the battery and surface plate heat transfer to the surrounding battery monomer, battery temperature converge at the same time, heat away at a rapid speed, causing the battery only area at the bottom of the heat dissipation is better, while the rest part at higher temperature. Into the liquid at lower temperature, the power battery system is the highest temperature is low, the maximum temperature difference is less than 5 °C, the temperature distribution uniformity of each cell monomer is better as well.
3. Conclusions
This paper first establishes the geometric model of the power battery system. According to the actual working characteristics of the power battery system, the effects of different discharge rates, different coolant flow rates, and different coolant inlet temperatures on the uniformity of the temperature distribution of the power battery system are analyzed. The research results show that with the increase of the discharge rate, the maximum temperature, the maximum temperature difference of the power battery system, and the maximum temperature difference of the average temperature of each battery cell gradually increase and reach the maximum at 3 C, but the efficient heat transfer of the flat heat pipe makes the power battery. The overall temperature distribution in the system tends to be consistent, and the uniformity of the temperature distribution of the power battery system varies less under different operating conditions; the increase in the flow rate of the coolant inlet liquid and the decrease in the temperature of the coolant inlet liquid can effectively reduce the maximum temperature of the power battery system, which shows the maximum temperature difference. At the same time, even if the maximum temperature difference inside the power battery system is large, the uniformity of the temperature distribution of the power battery system is still good when the average maximum temperature difference of each battery cell is low, which verifies that the flat heat pipe is hot to the liquid-cooled thermal management system, which shows the effectiveness of balanced performance.
4. Experiment Determination of Battery and Model Development
4.1. Experimental Preparation
In this study, the heat generation of the lithium-ion battery is assessed by an experiment. The arrangement developed for the experiment is displayed in Figure 14. In the experiment, the connecting plates are prewelded on the positive and negative terminals of the battery for charging and discharging. There are four measuring points in total, two measuring points on the terminals and two measuring points on the side wall. CDS-SY200A-T02 is used to charge and discharge the battery, and the maximum current is 200 A which is shown in Figure 15. To maintain the safety, a special safety experiment box is custom-made with caution, emission, heat isolation, and lighting functions which is shown in Figure 16.
Figure 14.
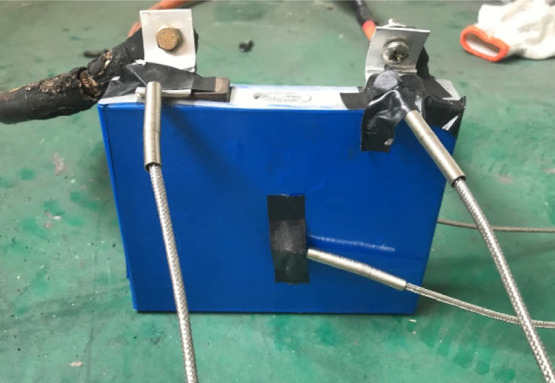
Experimental setup of the battery. “Photograph courtesy of “Renzheng Li”. Copyright 2020.”
Figure 15.
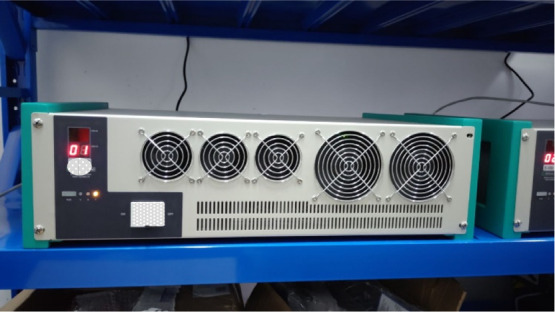
Battery test system CDS-SY200A-T02. “Photograph courtesy of “Renzheng Li”. Copyright 2020.”
Figure 16.
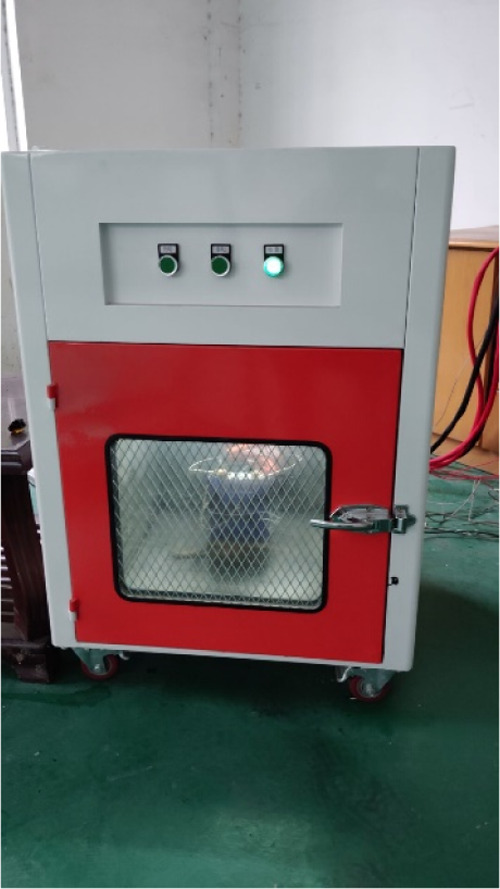
Experiment safety box. “Photograph courtesy of “Renzheng Li”. Copyright 2020.”
4.2. Heat Generation Calculation
In this study, the heat generation of the lithium-ion battery is tested by an experiment and the calculation method is shown as formula (1).
| 1 |
where Q is the heat generated by the battery throughout the time of charge and discharge, m is the battery mass, c is the specific heat, and ΔT is the temperature change of the battery during charge and discharge.
The lithium-ion battery is a complex chemical power source, and it contains several kinds of materials. The specific heat can be calculated as formula (2).
| 2 |
where cs, cpc, cp, csp, ce, cn, and cnc are the specific heat of the battery shell, positive current collector, positive material, separator, negative material, and negative current collector, respectively; ms, mpc, mp, msp, me, mn, and mnc are the mass of the battery shell, positive current collector, positive material, separator, negative material, and negative current collector, respectively. In this study, the specific heat of the lithium-ion battery is 1050 J/(kg·K).
4.3. Battery Thermal Model
As the heat source of battery packs, it is necessary to carry out the heat generation model before simulation. In the model development, the battery is assumed as a whole without several components and the thermal model is shown as formula (3).
| 3 |
where ρ is the density of the battery, Cp is the specific heat which is 1050 J/(kg·K), λx, λy, and λz are the conductivity of the battery along x, y, z direction, T is the battery temperature, and q is the heat generation rate of the battery.
The conductivity of the battery along x, y, z direction can be calculated using formulae (4–6).
Thickness direction
| 4 |
Height and width direction
| 5 |
In this study, λx is 1.3 W/(m·K), and λy and λz are 19.7 W/(m·K).
4.4. Physical Model
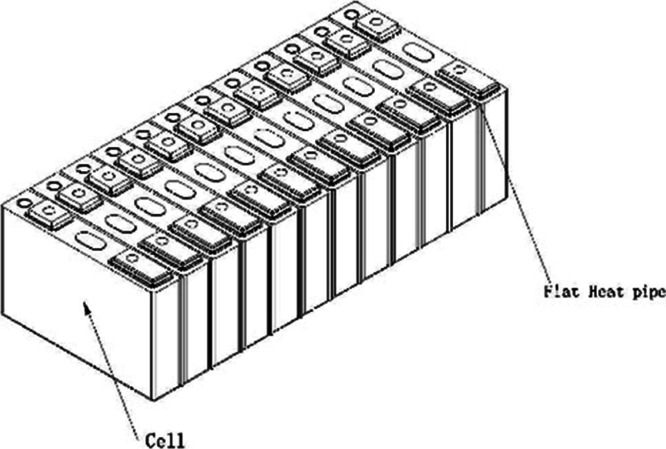
The battery 3D model is established from the real battery which is shown in Figure 17. In this study, the effect of the flat heat pipe width on the heat dissipation performance is analyzed and the battery system 3D model is shown in Figure 18. In the battery system, the batteries are numbered 1–12 along the direction of the flow. The flat heat pipe is put between the batteries. Actually, the working performance of the flat heat pipe is affected by its temperature. The batteries are low-temperature heat sources which means that the working performance of the flat heat pipe is steady in the battery system. As a result, the flat heat pipe is assumed as a heat conduction part in the simulation of which the conductivity is 6000 W/(m·K). The performance parameters of the battery and heat pipe are listed in Tables 5 and 6.
Figure 17.
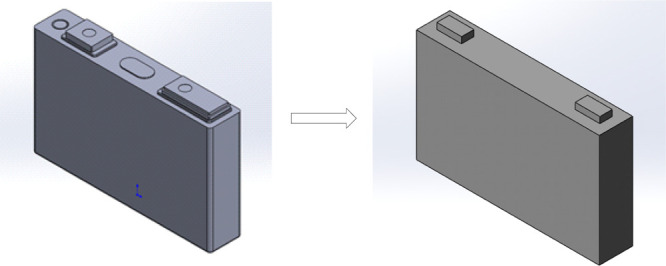
Lithium-ion battery 3D model.
Figure 18.
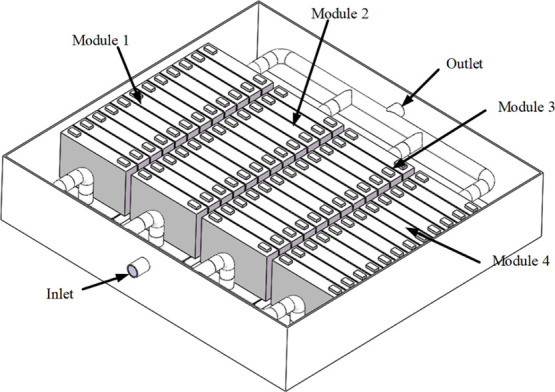
Lithium-ion battery system 3D model.
Table 5. 38 A h Square-Shell Ternary Lithium-Ion Battery Basic Parameter Table.
| project | technical parameters |
|---|---|
| rated voltage | 3.6 V |
| rated capacity | 38 A h |
| working voltage range | 3.0–4.2 V |
| maximum continuous discharge current | 5 C (battery surface temperature ≤ 45 °C) |
| dimensions (height × width × thickness) | 97 × 148 × 27 mm |
| battery weight | ≤0.82 kg |
| AC internal resistance | ≤1 mΩ |
| DC internal resistance | ≤2 mΩ |
| room-temperature charge retention rate | ≥98% (25 °C) |
| self-discharge rate | ≤4% (25 °C) |
| charging working environment temperature | –10 to 45 °C |
| discharge working environment temperature | –20 to 60 °C |
| maximum continuous charging current | 0.1 C (−10 to 0 °C) |
| 1 C (5–10 °C) | |
| 2 C (10–35 °C) | |
| maximum allowable charging voltage | 4.25 V |
Table 6. Flat Heat Pipe Parameter Setting.
| parameter type | parameter value |
|---|---|
| height × width × thickness mm | 91 × 148 × 2 |
| equivalent thermal conductivity W/(m·K) | 6000 |
| surface roughness | smooth |
| initial temperature °C | 20 |
4.5. Computational Fluid Mechanics Control Model
In this paper, heat from the battery is mainly brought outside by the water in the liquid-cooling plate. As a result, to conduct the numerical modeling, the computational fluid mechanics control model must be developed. The flow of the coolant in the liquid-cooling plate can be considered to be incompressible. Considering the high liquid flow rate and the separation phenomenon caused by the complex flow channel in the liquid-cooling plate, it should be processed according to the turbulence model and iterated by the SIMPLE pressure correction method. The governing equations are as follows25
Continuity equation
| 6 |
Momentum conservation equation
| 7 |
Energy conservation equation
| 8 |
Turbulence equation
Turbulent flow phenomena exist in nature and in various engineering fields. Convection heat transfer during turbulent flow is a common method of heat transfer in engineering. Applying the standard model is currently the main method to solve the flow and heat transfer.
The equation is also called the turbulent pulsation kinetic equation
| 9 |
ε is called the dissipation rate, and its governing equation is
| 10 |
4.6. Boundary Conditions
In this paper, 3D modeling is first performed in Solidworks and then related thermal management simulation is performed in Flow Simulation. In the Flow Simulation module, the software uses the finite volume method for meshing by default. In the Flow Simulation module, when performing thermal simulation analysis of battery cells, after completing the geometric model construction and meshing, you can directly add the heat source command; different forms of heat generation are given to the built geometry, including surface heat source and volume heat source. Considering that the established battery cell model is an overall unified structure, the battery cell tab is actually smaller in volume and it is made of copper nickel plating material; the conductivity is high, and the actual heat generation and battery cell body during charging and discharging. The difference is not large, so consider the battery cell as the overall heat source and set it as the volume heat source. The following are the specific boundary conditions:
The initial temperature of the battery is 20 °C; the liquid-cooling plate inlet is velocity inlet, and the temperature of the cooling liquid is 20 °C; the liquid-cooling plate outlet is pressure outlet and it is equal to the ambient pressure. The wall of the battery pack box is assumed to be adiabatic, and the heat exchange between the battery and the environment is considered as convective heat transfer because the battery casing is made of highly polished aluminum and the emissivity is low. Therefore, the radiation heat loss is neglected.26−29 The heat convection inside the battery pack can be determined by the following equations
| 11 |
where h is the heat transfer coefficient and it is 4 in natural convection; A is the surface area of batteries; Tb is the battery temperature; and Ta is the ambient temperature.
Acknowledgments
This work was supported by National Natural Science Foundation of China (51875259), National key research and development program (2018YFC0810504), Foundation of State Key Laboratory of Automotive Simulation and Control (20180103), and Postgraduate Research & Practice Innovation Program of Jiangsu Province (SJCX19_1169).
The authors declare no competing financial interest.
References
- Yan J.; Wang Q.; Li K.; Sun J. Numerical study on the thermal performance of a composite board in battery thermal management system. Appl. Therm. Eng. 2016, 106, 131–140. 10.1016/j.applthermaleng.2016.05.187. [DOI] [Google Scholar]
- Etacheri V.; Marom R.; Elazari R.; Salitra G.; Aurbach D. Challenges in the development of advanced Li-ion batteries: a review. Energy Environ. Sci. 2011, 4, 3243–3262. 10.1039/c1ee01598b. [DOI] [Google Scholar]
- Qian Z.; Li Y.; Rao Z. Thermal performance of lithium-ion battery thermal management system by using mini-channel cooling. Energy Convers. Manage. 2016, 126, 622–631. 10.1016/j.enconman.2016.08.063. [DOI] [Google Scholar]
- Chen Z.; Mi C. C.; Xia B.; You C. Energy management of power-split plug-in hybrid electric vehicles based on simulated annealing and Pontryagin’s minimum principle. J. Power Sources 2014, 272, 160–168. 10.1016/j.jpowsour.2014.08.057. [DOI] [Google Scholar]
- Liu H.; Wei Z.; He W.; Zhao J. Thermal issues about Li-ion batteries and recent progress in battery thermal management systems: A review. Energy Convers. Manage. 2017, 150, 304–330. 10.1016/j.enconman.2017.08.016. [DOI] [Google Scholar]
- Xu X. M.; Sun X. D.; Hu D. H.; Li R. Z.; Tang W. Research on heat dissipation performance and flow characteristics of air-cooled battery pack. Int. J. Energy Res. 2018, 42, 3658–3671. 10.1002/er.4113. [DOI] [Google Scholar]
- Xiaoming X.; Wei T.; Jiaqi F.; Donghai H.; Xudong S. The forced air cooling heat dissipation performance of different battery pack bottom duct. Int. J. Energy Res. 2018, 42, 3823–3836. 10.1002/er.4114. [DOI] [Google Scholar]
- Xu X. M.; Li R. Z.; Fu J. Q.; Jiang H. B. Research on the heat flow field synergy of electric vehicle power cabin at different charge and discharge rates. Appl. Therm. Eng. 2017, 117, 397–408. 10.1016/j.applthermaleng.2017.01.063. [DOI] [Google Scholar]
- Väyrynen A.; Salminen J. Lithium ion battery production. J. Chem. Thermodyn. 2012, 46, 80–85. 10.1016/j.jct.2011.09.005. [DOI] [Google Scholar]
- Ye Y.; Saw L. H.; Shi Y.; Tay A. A. O. Numerical analyses on optimizing a heat pipe thermal management system for lithium-ion batteries during fast charging. Appl. Therm. Eng. 2015, 86, 281–291. 10.1016/j.applthermaleng.2015.04.066. [DOI] [Google Scholar]
- Jarrett A.; Kim I. Y. Design optimization of electric vehicle battery cooling plates for thermal performance. J. Power Sources 2011, 196, 10359–10368. 10.1016/j.jpowsour.2011.06.090. [DOI] [Google Scholar]
- Jarrett A.; Kim I. Y. Influence of operating conditions on the optimum design of electric vehicle battery cooling plates. J. Power Sources 2014, 245, 644–655. 10.1016/j.jpowsour.2013.06.114. [DOI] [Google Scholar]
- Tong W.; Somasundaram K.; Birgersson E.; Mujumdar A. S.; Yap C. Numerical investigation of water cooling for a lithium-ion bipolar battery pack. Int. J. Therm. Sci. 2015, 94, 259–269. 10.1016/j.ijthermalsci.2015.03.005. [DOI] [Google Scholar]
- Xu X. M.; Zhao Y. Q. Experimental study on heat dissipation performance of cold plate liquid cooling system of electric vehicle under different working conditions. Automob. Eng. 2014, 36, 1057–1062. [Google Scholar]
- Lan C.; Xu J.; Qiao Y.; Ma Y. Thermal management for high power lithium-ion battery by minichannel aluminum tubes. Appl. Therm. Eng. 2016, 101, 284–292. 10.1016/j.applthermaleng.2016.02.070. [DOI] [Google Scholar]
- Huo Y.; Rao Z.; Liu X.; Zhao J. Investigation of power battery thermal management by using mini-channel cold plate. Energy Convers. Manage. 2015, 89, 387–395. 10.1016/j.enconman.2014.10.015. [DOI] [Google Scholar]
- Feng L.; Zhou S.; Li Y.; Wang Y.; Zhao Q.; Luo C.; Wang G.; Yan K. Experimental investigation of thermal and strain management for lithium-ion battery pack in heat pipe cooling. J. Energy Storage 2018, 16, 84–92. 10.1016/j.est.2018.01.001. [DOI] [Google Scholar]
- Rao Z.; Wang S.; Wu M.; Lin Z.; Li F. Experimental investigation on thermal management of electric vehicle battery with heat pipe. Energy Convers. Manage. 2013, 65, 92–97. 10.1016/j.enconman.2012.08.014. [DOI] [Google Scholar]
- Jiang Z. Y.; Qu Z. G. Lithium-ion battery thermal management using heat pipe and phase change material during discharge–charge cycle: A comprehensive numerical study. Appl. Energy 2019, 242, 378–392. 10.1016/j.apenergy.2019.03.043. [DOI] [Google Scholar]
- Mo X.; Hu X.; Tang J.; Tian H. A comprehensive investigation on thermal management of large-capacity pouch cell using micro heat pipe array. Int. J. Energy Res. 2019, 43, 7444–7458. 10.1002/er.4777. [DOI] [Google Scholar]
- Zhao R.; Gu J.; Liu J. An experimental study of heat pipe thermal management system with wet cooling method for lithium ion batteries. J. Power Sources 2015, 273, 1089–1097. 10.1016/j.jpowsour.2014.10.007. [DOI] [Google Scholar]
- Behi H.; Karimi D.; Behi M.; Ghanbarpour M.; Jaguemont J.; Sokkeh M. A.; Gandoman F. H.; Berecibar M.; Van Mierlo J. A new concept of thermal management system in Li-ion battery using air cooling and heat pipe for electric vehicles. Appl. Therm. Eng. 2020, 174, 115280. 10.1016/j.applthermaleng.2020.115280. [DOI] [Google Scholar]
- Yang Y.; Li W.; Xu X.; Tong G. Heat dissipation analysis of different flow path for parallel liquid cooling battery thermal management system. Int. J. Energy Res. 2020, 44, 5165–5176. 10.1002/er.5089. [DOI] [Google Scholar]
- Zhao L.; Zhu M.; Xu X.; Hu D.; Wang J.; Li R.; Fu J. Heat dissipation analysis of double-layer battery pack under coupling heat transfer of air, liquid, and solid. Int. J. Energy Res. 2018, 42, 4840–4852. 10.1002/er.4240. [DOI] [Google Scholar]
- Shahid S.; Agelin-Chaab M. Experimental and numerical studies on air cooling and temperature uniformity in a battery pack. Int. J. Energy Res. 2018, 42, 2246–2262. 10.1002/er.4018. [DOI] [Google Scholar]
- Gulfam R.; Zhu W.; Xu L.; Cheema I. I.; Sheng P.; Zhao G. G. Design, fabrication and numerical analysis of compact thermal management system integrated with composite phase change material and thermal bridge. Energy Convers. Manage. 2018, 156, 25–33. 10.1016/j.enconman.2017.10.098. [DOI] [Google Scholar]
- Saw L. H.; Ye Y.; Tay A. A. O.; Chong W. T.; Kuan S. H.; Yew M. C. Computational fluid dynamic and thermal analysis of Lithium-ion battery pack with air cooling. Appl. Energy 2016, 177, 783–792. 10.1016/j.apenergy.2016.05.122. [DOI] [Google Scholar]
- Amiribavandpour P.; Shen W.; Mu D.; Kapoor A. An improved theoretical electrochemical-thermal modelling of lithium-ion battery packs in electric vehicles. J. Power Sources 2015, 284, 328–338. 10.1016/j.jpowsour.2015.03.022. [DOI] [Google Scholar]
- Panchal S.; Dincer I.; Agelin-Chaab M.; Fraser R.; Fowler M. Experimental and theoretical investigations of heat generation rates for a water cooled LiFePO4 battery. Int. J. Heat Mass Transfer 2016, 101, 1093–1102. 10.1016/j.ijheatmasstransfer.2016.05.126. [DOI] [Google Scholar]


