Abstract
Purpose
To investigate reproducibility of myocardial radiomic features with cardiac MRI.
Materials and Methods
Test-retest studies were performed with a 3-T MRI system using commonly used cardiac MRI sequences of cine balanced steady-state free precession (cine bSSFP), T1-weighted and T2-weighted imaging, and quantitative T1 and T2 mapping in phantom experiments and 10 healthy participants (mean ± standard deviation age, 29 years ± 13). In addition, this study assessed repeatability in 51 patients (56 years ± 14) who underwent imaging twice during the same session. Three readers independently delineated the myocardium to investigate inter- and intraobserver reproducibility of radiomic features. A total of 1023 radiomic features were extracted by using PyRadiomics (https://pyradiomics.readthedocs.io/) with 11 image filters and six feature families. The intraclass correlation coefficient (ICC) was estimated to assess reproducibility and repeatability, and features with ICCs greater than or equal to 0.8 were considered reproducible.
Results
Different reproducibility patterns were observed among sequences in in vivo test-retest studies. In cine bSSFP, the gray-level run-length matrix was the most reproducible feature family, and the wavelet low-pass filter applied horizontally and vertically was the most reproducible image filter. In T1 and T2 maps, intensity-based statistics (first-order) and gray-level co-occurrence matrix features were the most reproducible feature families, without a dominant reproducible image filter. Across all sequences, gray-level nonuniformity was the most frequently identified reproducible feature name. In inter- and intraobserver reproducibility studies, respectively, only 32%–47% and 61%–73% of features were identified as reproducible.
Conclusion
Only a small subset of myocardial radiomic features was reproducible, and these reproducible radiomic features varied among different sequences.
Supplemental material is available for this article.
© RSNA, 2020
See also the commentary by Leiner in this issue.
Summary
At MRI of the myocardium, only a small subset of radiomic features were reproducible, and these reproducible radiomic features varied among different sequences.
Key Points
■ Only a small subset of myocardial radiomic features are reproducible at cardiac MRI, with different reproducibility patterns among different sequences.
■ In in vivo test-retest reproducibility studies, the gray-level run-length matrix was the most reproducible feature family, and the wavelet low-pass filter applied horizontally and vertically was the most reproducible image filter with cine balanced steady-state free precession.
■ First-order and gray-level co-occurrence matrices were the most reproducible feature families in T1 and T2 mapping; and “gray-level nonuniformity” was the most reproducible feature name across all sequences.
■ In inter- and intraobserver reproducibility studies, only 32%–47% and 61%–73% of features were identified as being reproducible, respectively.
Introduction
Radiomics has the potential to unveil image characteristics that are not recognized by the human observer (1). By using this technique, quantitative features of textural information are extracted from medical images on the basis of their relation to neighboring pixels, with and without applying image filters. Radiomics has shown promise for precision medicine in diagnosis, prognosis, prediction of disease, and therapy response. It is also widely applied in oncology practice for conditions such as lung cancers, head and neck cancers, and rectal cancers (2–4).
Radiomics has recently been applied to myocardial tissue phenotyping for diagnosis of various cardiomyopathies using cardiac MRI. Radiomic features applied to cine balanced steady-state free precession (cine bSSFP) showed promise in enabling discrimination between different causes of left ventricular hypertrophy (5). Radiomics has also been applied to myocardial parametric mapping. Radiomic analysis of T1 and T2 maps revealed improved facilitation of the diagnosis of acute “infarction-like” myocarditis (6), as well as acute or chronic heart failure–like myocarditis (7). Furthermore, radiomic analysis of T1 maps enables discrimination between hypertensive heart disease and hypertrophic cardiomyopathy (8).
Despite the emerging potential of radiomics, challenges remain, including the assessment of repeatability and reproducibility (1). Various factors may affect reproducibility of radiomic features, such as imaging protocols, image filters, preprocessing steps, and feature extraction software. Studies have investigated radiomic-feature reproducibility (9) at CT (2,10,11) and PET (12,13). Radiomic reproducibility with MRI has not been extensively investigated, despite challenges associated with the qualitative-imaging nature (9). A recent study (14) assessing test-retest repeatability of radiomic features on multiparametric MR images showed that repeatability was highly sensitive to processing parameters. Although reproducibility of radiomic features at MRI has been explored in a phantom study, widely used parametric mapping sequences and in vivo reproducibility have not been investigated (15).
To address these challenges, we sought to investigate the reproducibility of radiomic features extracted from standard cardiac MRI sequences in controlled-phantom, healthy-participant, and patient studies. A study on the robustness of radiomic features will improve our understanding of baseline feature variations and facilitate interpretation of disease progression or therapeutic intervention from measurement variability, which will provide a benchmark for feature reproducibility to aid clinical decision making.
Materials and Methods
Reliable and complete reporting is necessary to ensure reproducibility and validation of results (16). We report image processing and image biomarker extraction according to the Image Biomarker Standardization Initiative (IBSI) reporting guidelines (16), as presented in Table E1 (supplement). The data sets are publicly shared on Harvard Dataverse for the future benchmarking purposes of other groups (https://doi.org/10.7910/DVN/F63WPI).
Study Design
We studied both test-retest reproducibility and inter- and intraobserver reproducibility. Test-retest reproducibility studies were performed in phantoms, healthy participants, and patients. Imaging was performed with a 3-T Vida (Siemens Healthineers, Erlangen, Germany) MRI system using an 18-channel body coil. The study was compliant with the Health Insurance Portability and Accountability Act. The imaging protocol was approved by the Beth Israel Deaconess Medical Center Institutional Review Board, and written informed consent was obtained from each participant before scanning. A total of 1023 radiomic features were extracted using PyRadiomics (https://pyradiomics.readthedocs.io/) (17) with 11 image filters: image without applying any image filters (original); wavelet low- and high-pass filters applied in horizontal and vertical directions; square of image intensities (square filter); square root of the absolute image intensities (square-root filter); logarithm of the absolute image intensities (logarithm filter); exponential filter of the absolute image intensities (exponential filter); magnitude of the local gradient of the image (gradient filter); local binary pattern (LBP filter); and six feature-family filters (first-order, intensity-based statistics; gray-level dependence matrix [GLDM]; gray-level size-zone matrix [GLSZM]; neighboring gray-tone-difference matrix [NGTDM]; gray-level run-length matrix [GLRLM]; and gray-level co-occurrence matrix [GLCM]) (Fig 1). Healthy-participant and patient images were contoured using Circle CVI42 (Circle Cardiovascular Imaging, Calgary, Canada) by manual delineation of endo- and epicardial contours. In 15 randomly selected patients, three independent readers (J.J. [4 years of experience in cardiac MRI], J.M. [6 years of experience in cardiac MRI], and S.K. [5.5 years of experience in cardiac MRI]) independently delineated the myocardium for each sequence to study interobserver reproducibility; one reader performed a second reading with an interval of 2 weeks to study intraobserver reproducibility (Fig E1 [supplement]). Radiomic analysis was performed for each sequence by applying analysis to different regions on the basis of each observer.
Figure 1a:
Examples of radiomic features extracted from cardiac MR images (T1 mapping in this example) in a 62-year-old female patient by using PyRadiomics. (a) Cardiac MR image and the manually delineated ROI were given as inputs, and image filters were applied on the original image to create additional radiomic features. (b) A total of 1023 features were extracted from various feature families. GLCM = gray-level co-occurrence matrix, GLDM = gray-level dependence matrix, GLRLM = gray-level run length matrix, GLSZM = gray-level size-zone matrix, LBP = local binary pattern, NGTDM = neighboring gray-tone-difference matrix, ROI = region of interest, wavelet-HH = wavelet high-pass filter applied in horizontal and vertical directions, wavelet-HL = wavelet high- and low-pass filters applied in horizontal and vertical directions, wavelet-LH = wavelet low- and high-pass filters applied in horizontal and vertical directions, wavelet-LL = wavelet low-pass filter applied in horizontal and vertical directions.
Figure 1b:
Examples of radiomic features extracted from cardiac MR images (T1 mapping in this example) in a 62-year-old female patient by using PyRadiomics. (a) Cardiac MR image and the manually delineated ROI were given as inputs, and image filters were applied on the original image to create additional radiomic features. (b) A total of 1023 features were extracted from various feature families. GLCM = gray-level co-occurrence matrix, GLDM = gray-level dependence matrix, GLRLM = gray-level run length matrix, GLSZM = gray-level size-zone matrix, LBP = local binary pattern, NGTDM = neighboring gray-tone-difference matrix, ROI = region of interest, wavelet-HH = wavelet high-pass filter applied in horizontal and vertical directions, wavelet-HL = wavelet high- and low-pass filters applied in horizontal and vertical directions, wavelet-LH = wavelet low- and high-pass filters applied in horizontal and vertical directions, wavelet-LL = wavelet low-pass filter applied in horizontal and vertical directions.
Phantom study.—The radiomic phantom study consisted of 16 fruits and vegetables (four onions, four limes, four kiwifruits, and four apples) to reflect different signal intensities, shapes, and tissue textures (15). The radiomic phantom (15) was imaged twice in each session, and a retest scan was performed after repositioning the phantom. Images were acquired using cine bSSFP, T1 mapping, T2 mapping, and T1- and T2-weighted sequences. Details of the imaging sequences are included in Table E1 (supplement).
Healthy-participant study.—Ten healthy participants (mean ± standard deviation age, 29 years ± 13; seven women and three men) with no cardiovascular disease were recruited for two separate test-retest visits. In each visit, participants were imaged twice to study within-session variability. To study variability between sessions, the same participant returned 2 weeks later and underwent MRI with the same imaging protocol. Images were acquired by using cine bSSFP, T1 mapping, T2 mapping, and T1- and T2-weighted sequences.
Patient study.—Fifty-one patients (56 years ± 14; 34 men and 22 women) referred for clinical cardiac MRI were recruited. Demographics, clinical indications, and diagnoses of patients are presented in Table E2 (supplement). To study within-session variability, patients underwent repeat scans of cine bSSFP, T1 mapping, and T2 mapping at the end of the standard clinical protocols, without any changes in the condition, which included gadolinium-based contrast agent administration between the repeated scans.
Statistical Analysis
Statistical analyses were performed to assess the intraclass correlation coefficient (ICC). We performed hierarchic modeling (linear mixed-effects models) in which we captured the within-subject repeated measurements by modeling the within-subject correlation for the variance-covariance matrix of each feature using Υijk = β0 + ηi + θij + εijk, where Υijk is the kth measurement on a session i from subject j, ηi is the session i random effect, θij is the subject j random effect where the session is nested within the subject, and  is the residual error. These random effects have variances of
  ,
,  , and
, and  that are estimated by the model through maximizing the restricted likelihood function.
The ICCs are the proportion of the total variation explained by the respective blocking factor. The correlation between two randomly selected observations from the same subject is
 . .
|
The correlation between two randomly selected observations on the same session, and from the same subject, is
 . .
|
For the inter- and intraobserver ICC, we also performed linear mixed-effects modeling to estimate the variances due to subject and observer. ICC was reported as the mean ± standard deviation and was visualized by using heat maps grouped by image filters and feature families. Features of ICCs greater than or equal to 0.8 were considered reproducible (18,19). All statistical analyses were performed using SAS software (SAS Institute, Cary, NC).
Results
Test-Retest Reproducibility
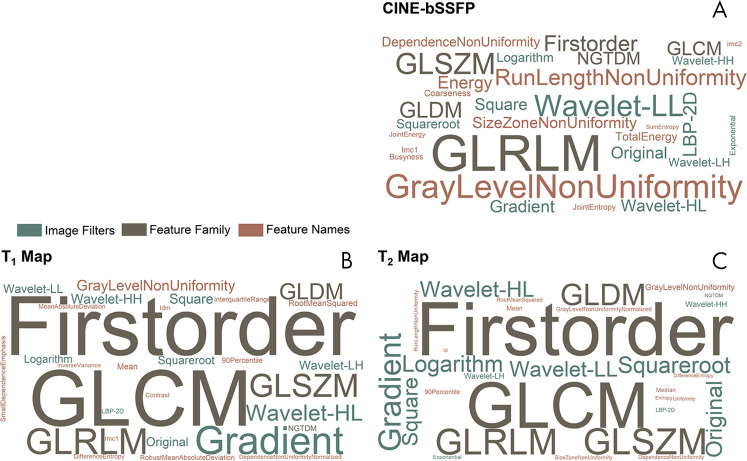
We observed different reproducibility patterns for each sequence, as shown in the summarized word-cloud presentation of reproducible features (ICC ≥ 0.8) (18,19) in the in vivo test-retest experiments (Fig 2). In cine bSSFP (Fig 2, A), GLRLM was the most reproducible feature family, and the wavelet low-pass filter applied horizontally and vertically was the most reproducible image filter. On both T1 and T2 maps (Fig 2, B, C), the first-order and GLCM families were the most reproducible feature families. First-order features are estimated on the basis of the histogram and therefore reflect the quantitative nature of the parametric T1 and T2 mapping sequences. There was no dominant reproducible image filter. “Gray-level nonuniformity” was the most frequently identified reproducible feature name across all image filters and feature families.
Figure 2:
The word-cloud representation of reproducible features (ICC ≥ 0.8) for each image filter, feature family, and feature name across, A, cine bSSFP, B, T1 mapping, and, C, T2 mapping. The word clouds illustrate the more reproducible feature names with greater prominence. The top 30 most reproducible features are presented in the word clouds. cine bSSFP = cine balanced steady-state free precession, GLCM = gray-level co-occurrence matrix, GLDM = gray-level dependence matrix, GLRLM = gray-level run-length matrix, GLSZM = gray-level size-zone matrix, LBP = local binary pattern, NGTDM = neighboring gray-tone-difference matrix, 2D = two-dimensional, wavelet-HH = wavelet high-pass filter applied in horizontal and vertical directions, wavelet-HL = wavelet high- and low-pass filters applied in horizontal and vertical directions, wavelet-LH = wavelet low- and high-pass filters applied in horizontal and vertical directions, wavelet-LL = wavelet low-pass filter applied in horizontal and vertical directions.
Phantom Study
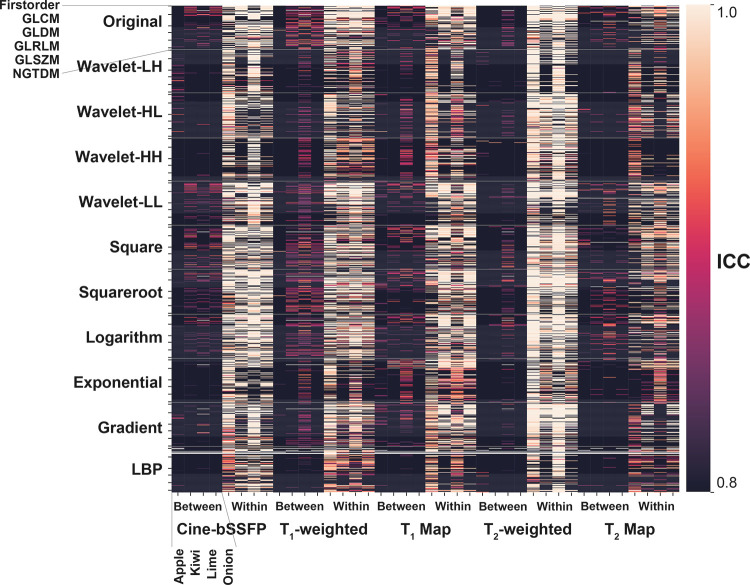
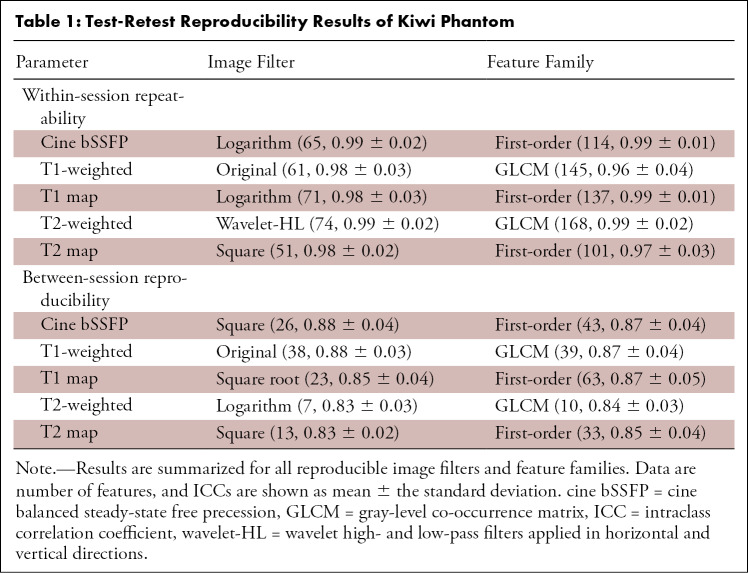
In the phantom study, we report variability due to within-session and between-session repetitions relative to the total variation. Reproducibility patterns were different for each fruit or vegetable, representing various tissue types (Fig 3). We report the results of the kiwifruit in this section, and the results of the apple, lime, and onion are reported in Table E3 (supplement).
Figure 3:
Test-retest reproducibility and repeatability results of phantom study summarized for all image filters and feature families. The heat map highlights reproducible features defined at the ICC greater than or equal to 0.8. cine bSSFP = cine balanced steady-state free precession, GLCM = gray-level co-occurrence matrix, GLDM = gray-level dependence matrix, GLRLM = gray-level run-length matrix, GLSZM = gray-level size-zone matrix, ICC = intraclass correlation coefficient, LBP = local binary pattern, NGTDM = neighboring gray-tone-difference matrix, wavelet-HH = wavelet high-pass filter applied in horizontal and vertical directions, wavelet-HL = wavelet high- and low-pass filters applied in horizontal and vertical directions, wavelet-LH = wavelet low- and high-pass filters applied in horizontal and vertical directions, wavelet-LL = wavelet low-pass filter applied in horizontal and vertical directions.
Within-session repeatability.—In the repetitions within the session, the first-order family was the most reproducible feature family in cine bSSFP, T1 mapping, and T2 mapping. The GLCM was the most reproducible feature family on T1-weighted and T2-weighted images. There was no dominant reproducible image filter (Fig 3, Table 1). In each sequence, 45.4%, 45.8%, 46.2%, 50.7%, and 29.1% of features were reproducible with cine bSSFP, T1-weighted images, T1 mapping, T2-weighted images, and T2 mapping, respectively.
Table 1:
Test-Retest Reproducibility Results of Kiwi Phantom
Between-session reproducibility.—In the test-retest phantom study between sessions, similar reproducibility patterns were found. First-order and GLCM families were the most reproducible feature families, with no dominant reproducible image filter (Fig 3, Table 1). In each sequence, 11.1%, 16.2%, 13.0%, 2.2%, and 6.6% of features were reproducible with the cine bSSFP, T1-weighted images, T1 mapping, T2-weighted images, and T2 mapping, respectively.
Healthy-Participant Study
In the healthy-participant study, we report variability due to within- and between-session repetitions (within subjects) relative to total variation, including different participants (between subjects) for each imaging sequence.
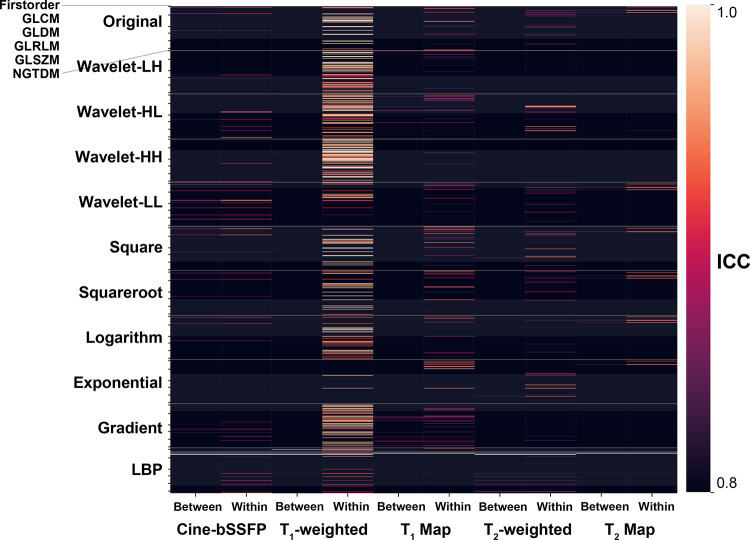
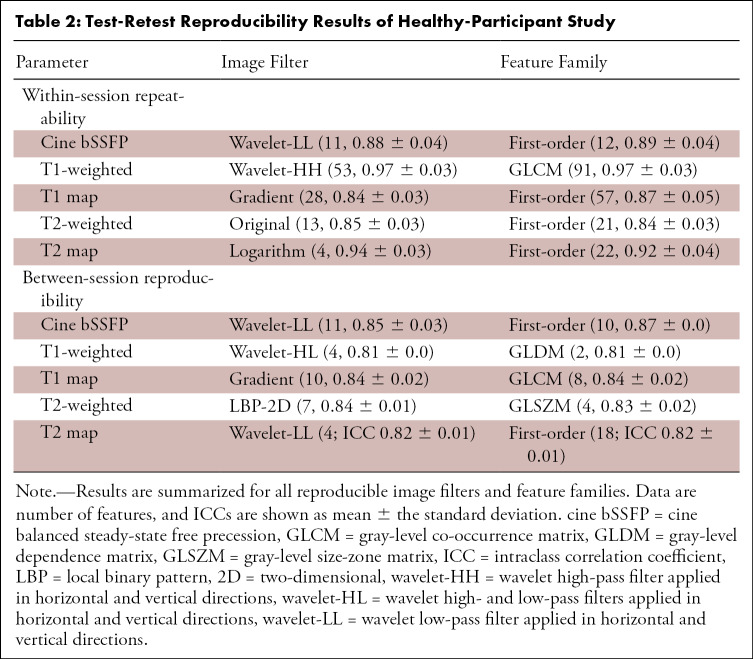
Within-session repeatability.—In the test-retest within-session healthy-participant study, the first-order family was the most reproducible feature family in all sequences except T1-weighted imaging sequences (Fig 4, Table 2). No image filter was identified as being reproducible across all sequences; 4.7%, 28.8%, 13.3%, 8.0%, and 2.6% of features were reproducible in cine bSSFP, T1-weighted images, T1 mapping, T2-weighted images, and T2 mapping, respectively.
Figure 4:
Test-retest reproducibility and repeatability results of healthy-participant study summarized for all image filters and feature families. cine bSSFP = cine balanced steady-state free precession, GLCM = gray-level co-occurrence matrix, GLDM = gray-level dependence matrix, GLRLM = gray-level run-length matrix, GLSZM = gray-level size-zone matrix, ICC = intraclass correlation coefficient, LBP = local binary pattern, NGTDM = neighboring gray-tone-difference matrix, wavelet-HH = wavelet high-pass filter applied in horizontal and vertical directions, wavelet-HL = wavelet high- and low-pass filters applied in horizontal and vertical directions, wavelet-LH = wavelet low- and high-pass filters applied in horizontal and vertical directions, wavelet-LL = wavelet low-pass filter applied in horizontal and vertical directions.
Table 2:
Test-Retest Reproducibility Results of Healthy-Participant Study
Between-session reproducibility.—Only a few features were reproducible in between-session healthy-participant reproducibility studies, in which 3.1%, 0.7%, 2.2%, 1.1%, and 2.2% of features were reproducible in cine bSSFP, T1-weighted images, T1 mapping, T2-weighted images, and T2 mapping, respectively. Therefore, no consistent reproducible image filter or feature family was identified across different sequences (Fig 4, Table 2).
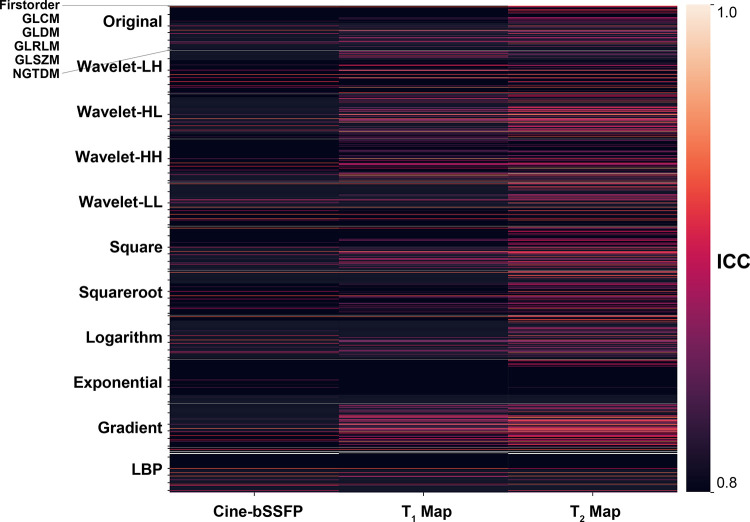
Patient study.—In the patient study, we report variability due to within-session repetitions (within subjects) relative to variability due to different patients (between subjects). The GLRLM was the most reproducible feature family in cine bSSFP and T1 mapping, and the GLCM was the most reproducible feature family in T2 mapping. The gradient filter was the most reproducible image filter on both T1 and T2 maps (Fig 5, Table 3). For each sequence, 8.9%, 26.4%, and 34.8% of features were reproducible with the cine bSSFP, T1 mapping, and T2 mapping, respectively.
Figure 5:
Test-retest reproducibility results of patient study summarized for all image filters and feature families. cine bSSFP = cine balanced steady-state free precession, GLCM = gray-level co-occurrence matrix, GLDM = gray-level dependence matrix, GLRLM = gray-level run-length matrix, GLSZM = gray-level size-zone matrix, ICC = intraclass correlation coefficient, LBP = local binary pattern, NGTDM = neighboring gray-tone-difference matrix, wavelet-HH = wavelet high-pass filter applied in horizontal and vertical directions, wavelet-HL = wavelet high- and low-pass filters applied in horizontal and vertical directions, wavelet-LH = wavelet low- and high-pass filters applied in horizontal and vertical directions, wavelet-LL = wavelet low-pass filter applied in horizontal and vertical directions.
Table 3:
Test-Retest Reproducibility Results of Patient Study
Inter- and Intraobserver Reproducibility
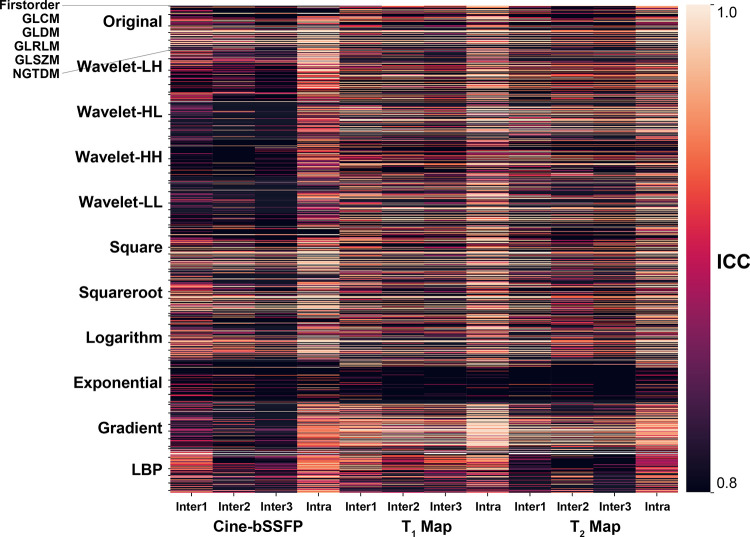
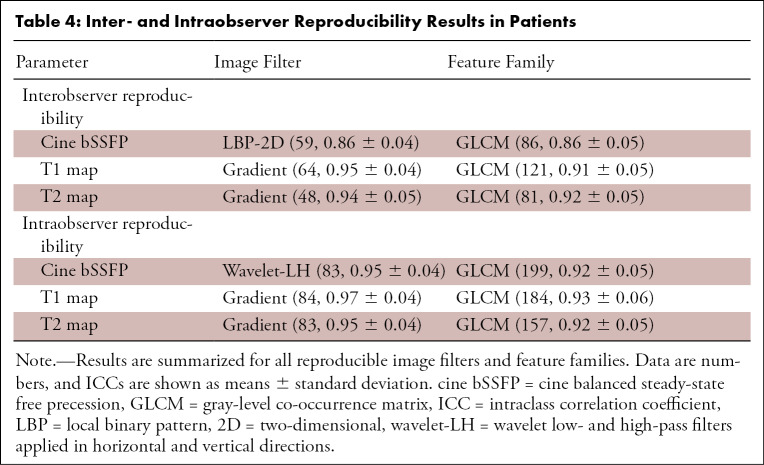
Interobserver reproducibility.—In the interobserver reproducibility study in patients, 32.1%, 46.7%, and 35.5% of features were reproducible with the cine bSSFP, T1 mapping, and T2 mapping, respectively (Fig 6, Table 4). The GLCM was the most reproducible feature family, and the gradient filter was the most reproducible image filter on both T1 and T2 maps.
Figure 6:
Inter- and intraobserver reproducibility results in patients summarized for all image filters and feature families. cine bSSFP = cine balanced steady-state free precession, GLCM = gray-level co-occurrence matrix, GLDM = gray-level dependence matrix, GLRLM = gray-level run-length matrix, GLSZM = gray-level size-zone matrix, ICC = intraclass correlation coefficient, LBP = local binary pattern, NGTDM = neighboring gray-tone-difference matrix, wavelet-HH = wavelet high-pass filter applied in horizontal and vertical directions, wavelet-HL = wavelet high- and low-pass filters applied in horizontal and vertical directions, wavelet-LH = wavelet low- and high-pass filters applied in horizontal and vertical directions, wavelet-LL = wavelet low-pass filter applied in horizontal and vertical directions.
Table 4:
Inter- and Intraobserver Reproducibility Results in Patients
Intraobserver reproducibility.—In the intraobserver reproducibility study in patients, 73.1%, 66.8%, and 61.1% of features were reproducible with the cine bSSFP, T1 mapping, and T2 mapping, respectively (Fig 6, Table 4). Intraobserver reproducibility showed reproducibility patterns similar to those of interobserver reproducibility, in which the GLCM and gradient were the most reproducible feature family and image filter. Higher reproducibility, with a higher number of reproducible features and a higher ICC magnitude, was shown in intraobserver reproducibility compared with interobserver reproducibility.
Discussion
With growing interest in the application of radiomics in cardiac MRI, it is important to assess the reproducibility of imaging-based biomarkers prior to their clinical adoption. Despite recent enthusiasm about the increasing potential of radiomics, there are very limited data on radiomic-feature reproducibility. To address this void, we performed a rigorous reproducibility study to determine benchmark values for radiomic features in the most commonly used clinical cardiac MRI sequences. We report both test-retest reproducibility and inter- and intraobserver reproducibility of radiomic features. Our results demonstrate that only a small subset of myocardial radiomic features are reproducible and that imaging sequences influence the reproducibility of the radiomic features differently.
Although no singular image filter was identified as highly reproducible throughout all experiments, the first-order and GLCM families were the most reproducible feature families identified across most experiments and sequences. Across all experiments and sequences, gray-level nonuniformity was the most frequently identified reproducible feature. First-order features represent intensity-based statistics such as mean, median, range, entropy, and energy. The GLCM represents the distribution of co-occurring values of neighboring pixels; we studied the distribution of pixels for Chebyshev distances of δ = 1 (ie, the distance to all eight adjacent neighboring pixels from the given point in two dimensions is defined by 1 unit). Gray-level nonuniformity measures the variability of gray-level intensity values in the image, for which a lower value indicates more homogeneity in the underlying tissue textures.
Radiomic reproducibility benchmarks should be sequence and tissue specific. Feature reproducibility patterns vary across different sequences. T1-weighted images had the highest number of reproducible features, which may reflect the sequence’s highest imaging signal-to-noise ratio. Quantitative parametric mapping sequences showed levels of reproducible features similar to those of qualitative imaging sequences, without the need to perform any image normalization prior to feature extraction. Our results also show varying reproducibility patterns in different fruit or vegetable radiomic phantoms, indicating different radiomic reproducibility levels based on the underlying tissue types. As expected, our study found greater variability between sessions than within sessions. Furthermore, inter- and intraobserver reproducibility showed greater variability compared with the test-retest reproducibility. Although inter- and intraobserver reproducibility is the more commonly used reproducibility test in the current practice of radiomic studies, it may not reveal all nonreproducible features.
A systematic review by Traverso et al (9) investigated the repeatability and reproducibility of radiomic features in 41 studies using various imaging modalities (PET, CT, cone-beam CT, and MRI) studied in human participants and phantoms and found no consensus regarding the most repeatable and reproducible features. A phantom study by Baessler et al (15) extracted radiomic features from standard clinical brain MRI sequences and identified 15 robust and reproducible features across all sequences. Although a direct comparison is not appropriate because of different software used to extract features (PyRadiomics vs LIFEx [https://www.lifexsoft.org]), many of the reproducible features identified in our study are similar to those identified by Baessler et al (15), such as gray-level nonuniformity in the GLRLM and GLZLM. Furthermore, some of these reproducible features were identified as clinically important in previous studies, such as T2 run-length nonuniformnity for the diagnosis of acute infarctlike myocarditis (6).
Calculation of texture indexes resulting from different software can differ, and results should be compared and interpreted with great care. For example, the calculation from the GLRLM can differ between PyRadiomics and LIFEx; PyRadiomics crops the matrix to fit minimum-to-maximum gray levels and run-length numbers, whereas LIFEx maintains the matrix index correspondence to the gray level and the number of runs. MATLAB Texture Analysis (https://www.mathworks.com/products/matlab.html), MaZda (http://www.eletel.p.lodz.pl/programy/mazda/), TexRAD (https://fbkmed.com/texrad-landing-2/), Chang Gung Image Texture Analysis (https://sites.google.com/site/deanfanglab/software), CERR (https://github.com/cerr/CERR/wiki), ImageJ (https://imagej.net/), OncoRadiomics (https://www.oncoradiomics.com/), and JFeatureLib (https://github.com/locked-fg/JFeatureLib) are examples of feature-analysis software, and the IBSI offers benchmarks to determine whether the software used to extract the set of image biomarkers is compliant with IBSI standards.
Our study had several limitations. It was a single-center study in which the data were acquired with a single 3-T MRI unit. We did not study the between-session test-retest reproducibility in patients. Furthermore, we only studied reproducibility of texture features in the myocardium, and the different reproducibility patterns in different tissues were simulated in our phantom study. How different imaging parameters, reconstructions, normalizations, and feature extraction settings could impact reproducibility is outside the scope of this study and should be investigated.
At MRI of the myocardium with commonly used sequences of cine bSSFP, T1-weighted and T2-weighted imaging, and quantitative T1 and T2 mapping in phantoms, 10 healthy participants, and 51 patients, only a small subset of radiomic features was reproducible, and these reproducible radiomic features varied among different sequences.
SUPPLEMENTAL TABLES
SUPPLEMENTAL FIGURES
Acknowledgments
Acknowledgment
We thank Warren J. Manning for editorial assistance.
R.N. supported by National Institutes of Health (R01HL129185-01, R01HL129157, and 1R01HL127015) and the American Heart Association Established Investigator Award (15EIA22710040).
Disclosures of Conflicts of Interest: J.J. disclosed no relevant relationships. L.H.N. disclosed no relevant relationships. J.M. disclosed no relevant relationships. S.K. disclosed no relevant relationships. J.R. disclosed no relevant relationships. P.P. disclosed no relevant relationships. B.G. disclosed no relevant relationships. R.N. Activities related to the present article: disclosed no relevant relationships. Activities not related to the present article: royalties from Philips and Samsung. Other relationships: disclosed no relevant relationships.
Abbreviations:
- cine bSSFP
- cine balanced steady-state free precession
- GLCM
- gray-level co-occurrence matrix
- GLRLM
- gray-level run-length matrix
- GLSZM
- gray-level size-zone matrix
- IBSI
- Image Biomarker Standardization Initiative
- ICC
- intraclass correlation coefficient
References
- 1.Gillies RJ, Kinahan PE, Hricak H. Radiomics: images are more than pictures, they are data. Radiology 2016;278(2):563–577. [DOI] [PMC free article] [PubMed] [Google Scholar]
- 2.Aerts HJ, Velazquez ER, Leijenaar RT, et al. Decoding tumour phenotype by noninvasive imaging using a quantitative radiomics approach. Nat Commun 2014;5(1):4006. [DOI] [PMC free article] [PubMed] [Google Scholar]
- 3.Parmar C, Leijenaar RT, Grossmann P, et al. Radiomic feature clusters and prognostic signatures specific for lung and head & neck cancer. Sci Rep 2015;5(1):11044. [DOI] [PMC free article] [PubMed] [Google Scholar]
- 4.Nie K, Shi L, Chen Q, et al. Rectal cancer: assessment of neoadjuvant chemoradiation outcome based on radiomics of multiparametric MRI. Clin Cancer Res 2016;22(21):5256–5264. [DOI] [PMC free article] [PubMed] [Google Scholar]
- 5.Schofield R, Ganeshan B, Fontana M, et al. Texture analysis of cardiovascular magnetic resonance cine images differentiates aetiologies of left ventricular hypertrophy. Clin Radiol 2019;74(2):140–149. [DOI] [PubMed] [Google Scholar]
- 6.Baessler B, Luecke C, Lurz J, et al. Cardiac MRI texture analysis of T1 and T2 maps in patients with infarctlike acute myocarditis. Radiology 2018;289(2):357–365. [DOI] [PubMed] [Google Scholar]
- 7.Baessler B, Luecke C, Lurz J, et al. Cardiac MRI and texture analysis of myocardial T1 and T2 maps in myocarditis with acute versus chronic symptoms of heart failure. Radiology 2019;292(3):608–617. [DOI] [PubMed] [Google Scholar]
- 8.Neisius U, El-Rewaidy H, Nakamori S, Rodriguez J, Manning WJ, Nezafat R. Radiomic analysis of myocardial native T1 imaging discriminates between hypertensive heart disease and hypertrophic cardiomyopathy. JACC Cardiovasc Imaging 2019;12(10):1946–1954. [DOI] [PMC free article] [PubMed] [Google Scholar]
- 9.Traverso A, Wee L, Dekker A, Gillies R. Repeatability and reproducibility of radiomic features: a systematic review. Int J Radiat Oncol Biol Phys 2018;102(4):1143–1158. [DOI] [PMC free article] [PubMed] [Google Scholar]
- 10.Balagurunathan Y, Gu Y, Wang H, et al. Reproducibility and prognosis of quantitative features extracted from CT images. Transl Oncol 2014;7(1):72–87. [DOI] [PMC free article] [PubMed] [Google Scholar]
- 11.Mackin D, Fave X, Zhang L, et al. Measuring computed tomography scanner variability of radiomics features. Invest Radiol 2015;50(11):757–765. [DOI] [PMC free article] [PubMed] [Google Scholar]
- 12.Leijenaar RT, Carvalho S, Velazquez ER, et al. Stability of FDG-PET radiomics features: an integrated analysis of test-retest and inter-observer variability. Acta Oncol 2013;52(7):1391–1397. [DOI] [PMC free article] [PubMed] [Google Scholar]
- 13.Forgacs A, Pall Jonsson H, Dahlbom M, et al. A study on the basic criteria for selecting heterogeneity parameters of F18-FDG PET images. PLoS One 2016;11(10):e0164113. [DOI] [PMC free article] [PubMed] [Google Scholar]
- 14.Schwier M, van Griethuysen J, Vangel MG, et al. Repeatability of multiparametric prostate MRI radiomics features. Sci Rep 2019;9(1):9441. [DOI] [PMC free article] [PubMed] [Google Scholar]
- 15.Baessler B, Weiss K, Pinto Dos Santos D. Robustness and reproducibility of radiomics in magnetic resonance imaging: a phantom study. Invest Radiol 2019;54(4):221–228. [DOI] [PubMed] [Google Scholar]
- 16.Zwanenburg A, Leger S, Vallières M, Löck S. Image biomarker standardisation initiative. ArXiv 161207003 [preprint] https://arxiv.org/abs/1612.07003. Posted December 21, 2016. Accessed September 1, 2019.
- 17.van Griethuysen JJM, Fedorov A, Parmar C, et al. Computational radiomics system to decode the radiographic phenotype. Cancer Res 2017;77(21):e104–e107. [DOI] [PMC free article] [PubMed] [Google Scholar]
- 18.Parmar C, Rios Velazquez E, Leijenaar R, et al. Robust radiomics feature quantification using semiautomatic volumetric segmentation. PLoS One 2014;9(7):e102107. [DOI] [PMC free article] [PubMed] [Google Scholar]
- 19.Lu L, Lv W, Jiang J, et al. Robustness of radiomic features in [11C]choline and [18F]FDG PET/CT imaging of nasopharyngeal carcinoma: impact of segmentation and discretization. Mol Imaging Biol 2016;18(6):935–945. [DOI] [PubMed] [Google Scholar]
Associated Data
This section collects any data citations, data availability statements, or supplementary materials included in this article.


