

Abstract
Molecular mechanisms mediating tonic secretion of parathyroid hormone (PTH) in response to hypocalcemia and hyperparathyroidism (HPT) are unclear. Here we demonstrate increased heterocomplex formation between the calcium-sensing receptor (CaSR) and metabotropic GABAB1 receptor (GABAB1R) in hyperplastic parathyroid glands (PTGs) of patients with primary and secondary HPT. Targeted ablation of GABAB1R or glutamic acid decarboxylase 1 and 2 in PTGs produces hypocalcemia and hypoparathyroidism and prevents PTH hypersecretion in PTGs cultured from mouse models of hereditary HPT and dietary calcium-deficiency. Co-binding of CaSR/GABAB1R complex by baclofen and high extracellular calcium blocks the coupling of heterotrimeric G-proteins to homomeric CaSRs in cultured cells and promotes PTH secretion in cultured mouse PTGs. These results combined with the ability of PTG to synthesize GABA support a critical autocrine action of GABA/GABAB1R in mediating tonic PTH secretion of PTGs and ascribe aberrant activities of CaSR/GABAB1R heteromer to HPT.
Keywords: Parathyroid glands, Ca2+-sensing receptor, GABAB1 receptor, hyperparathyroidism, PTH secretion, Family C GPCR
Land vertebrates develop a unique regulatory mechanism to maintain constant serum [Ca2+] against both hypocalcemic and hypercalcemic challenges to support vital physiologic functions. This mechanism begins with PTGs responding to small decreases in serum [Ca2+] by rapidly increasing PTH secretion, which in turn stimulates systemic calciotropic activities in the kidney, gut, and bone to raise serum [Ca2+]1. Once restored to normal blood levels, continuous increases in extracellular [Ca2+] ([Ca2+]e) suppress PTH secretion, thereby preventing the development of hyperparathyroidism (HPT) and hypercalcemia, through activation of homomeric CaSRs, a member of family C G protein-coupled receptor (GPCR-C) that stimulates Gi- and Gq/G11-mediated signaling cascades in parathyroid cells (PTCs)2. Defects in the latter CaSR-mediated negative feedback pathways cause HPT, a prevalent human disorder characterized by PTH hypersecretion that inappropriately raises serum Ca2+ levels and causes multiorgan complications in bone, kidney, gastrointestinal tract, heart, and central nervous system3,4.
Primary HPT (1° HPT) is a common endocrinopathy occurring in up to 1 in 300 postmenopausal women4. Most cases are due to single adenomas in PTGs that can be cured by surgical removal of glands (i.e., parathyroidectomy). Many patients with multigland disease or genetic forms of HPT, however, have recurrent hypercalcemia and require long-term follow-up and multiple surgeries to control the disease. Patients with chronic kidney disease (CKD) develop secondary HPT (2°HPT), often with severe PTH excess from 4-gland hyperplasia. This form of 2° HPT causes severe mineral disturbances, disabling bone disease, and ectopic calcifications, contributing to the high morbidity and mortality rates of CKD5,6. Medical therapies (such as active vitamin D analogs, calcimimetics, phosphate binders) are used to prevent progression of 2° HPT, but the most severe cases, which are refractory to medical therapies, often require subtotal or total parathyroidectomy. Among medical therapies, vitamin D analogs are effective in early 2° HPT, but less so as the disease advances with reduced vitamin D receptor expression in the PTG7–10 and the side-effects of drug therapy (hypercalcemia and hyperphosphatemia) are intolerable for patients. Calcimimetics, allosteric agonists of the CaSR, potentiate homomeric CaSR activation to suppress PTH secretion in patients with 2° HPT. They are, however, limited by gastrointestinal toxicity11,12 and hypocalcemia. Thus, better mechanistically directed therapies are sorely needed in CKD.
Reduced CaSR expression is also a hallmark in parathyroid adenomas commonly found in patients with 1°HPT13–15. Although reduced activities of homomeric CaSR are ascribed to PTH hypersecretion in PTCs and to PTH excess in circulation, molecular mechanisms mediating tonic hypersecretion of PTH in lieu of reduced CaSR expression or chronic dietary Ca2+ deficiency have never been established. Insights into the latter mechanisms are required for future designs of more effective drug management strategies for HPT. Given that GPCR-C members function exclusively in multimeric forms16–21 and that the GABAB1R, another member of GPCR-C, can physically interact with the CaSR in neurons22 and chondrocytes23 to mediate trafficking and surface expression of CaSR as well as CaSR-dependent signaling and cellular functions, we investigated whether PTGs express GABAB1Rs and other GPCR-C members to alter CaSR signaling and secretory functions of the glands. We further investigated whether PTCs express the rate-limiting enzymes, GAD1/2, to synthesize GABA as an autocrine factor underlying tonic PTH secretion in physiology and diseases.
RESULTS
Expression of GABAB1R and GAD1/2 and Synthesis of GABA in PTGs
As the CaSR also interacts with other GPCR-C members, including GABAB2R22, and metabotropic glutamate receptors 1 and 524, we performed a general survey for expression of GPCR-C members in normal mouse PTGs to identify potential players that can regulate CaSR signaling by heteromerization. By RNA assessment, we found that the GABAB1R is the only GPCR-C member remarkably coexpressed with the CaSR in the glands (Fig. 1a, top panel and Supplementary Fig. 1), however, at a lower level (≈20%) compared to CaSR expression. Interestingly, the expression of GABAB2R, a close dimeric partner of GABAB1R in the CNS19,25, was undetectable (Fig. 1a). Immunohistochemistry and immunoblotting confirmed the expression of core (≈100 kD) and glycosylated (≈130 and 150 kD) GABAB1R proteins in mouse PTGs (Fig. 1b, 1d-upper panel, and Extended Data Fig. 1a,1b).
Figure 1. Expression of GABAB1R and GAD1/2 and GABA synthesis in PTGs.

(a) qPCR analyses showed RNA expression of CaSR, GABAB1R, GAD1 and GAD2, but not GABAB2R in mouse PTGs, Mean ± s.e.m. of n = 5 batches of PTGs from 60 mice. (b–d) Representative immunohistochemistry (b, c) and immunoblotting (d) analyses that show the expression of ≈100 kD core and ≈130 and ≈150 kD glycosylated GABAB1R as well as the expression of 67 kD GAD1 and 65 kD GAD2 in mouse PTGs and hippocampi (Hipp). n = 5 batches of PTGs from 50 mice and 10 mouse brains. Brown DAB signals in panel b indicates GABAB1R immunoreactivity in mouse PTCs counterstained with blue hematoxylin. Green florescent FITC signals in panel c indicate GAD1/2 immunoreactivity in mouse PTCs counterstained with blue DAPI nuclear dye. (e) Representative immunohistochemical detection of GABA in mouse and human PTGs. n = 12 PTGs from 8 mice and 6 human PTGs. (f) GABA levels in human PTG and mouse brain were quantified by multiple reaction monitoring (MRM); Mean ± s.e.m. of n = 3 human PTGs and 3 mouse brains. The p-value was determined by 2-tails Student t-test. (g) Representative MRM chromatogram of d5-GABA (m/z 109.02 → 92.05) synthesis in human PTG extracts incubated with cofactor vitamin B6 in the presence (purple tracing) or absence (green tracing) of d5-glutamate. n = 3 independent assays from 3 human PTG lysates.
In the CNS, GAD 1 and 2 (GAD1/2) convert glutamic acids to GABA, which in turn binds and activates GABAB1R/GABAB2R heteromers19,25. A series of molecular biology approaches (qPCR, immunohistochemistry, and immunoblotting) revealed the expression of GAD1 (67-kD) and GAD2 (65-kD) at the RNA (Fig. 1a, bottom panel) and protein (Fig. 1c, 1d-bottom panel, and Extended Data Fig. 2a) levels, as well as the presence of their end product GABA in mouse PTGs and/or human parathyroid adenomas (Fig. 1e and Extended Data Fig. 2c). While expression patterns of GABAB1R and GAD1/2 proteins in PTGs are comparable to those in mouse hippocampi (Fig. 1d, mHIPP), the amount of endogenous GABA in cryopreserved human PTG (10.63 ± 1.88 ng per gram) is well below the level that found in mouse brain (198.29 ± 22.1 μg per gram) (Fig. 1f and Supplementary Fig. 2), thus implying an autocrine rather than endocrine action of GABA in PTGs. To further confirm the ability of GAD1/2 to synthesize GABA in PTGs, we incubated human PTG extracts with deuterated d5-glutamate, the precursor of GABA, and measured the resulting d5-GABA. Using the multiple reaction monitoring (MRM) protocol illustrated in the Supplementary Figure 3, we detected d5-GABA in the reactions by matching its MS fragmentation and retention time, and this d5-GABA signal was absent in reactions without d5-glutamate (Fig. 1g), thus demonstrating the ability of parathyroid GADs to synthesize GABA.
Impact of Parathyroid GABAB1R and GAD1/2 on PTH Secretion
To define the actions of GABAB1R, GABA, and GAD1/2 in PTGs, we studied the impact of GABAB1R agonists, baclofen (Bac) and GABA, and antagonist CGP54626 (CGP), on the [Ca2+]e-mediated secretory responses in PTGs freshly isolated from male wild-type C57/B6 (B6:Wt) mice or from mice lacking expression of GABAB1R (hereafter referred to as GABAB1R-KO or PTGGABAB1R−/− mice) or GAD1/2 (Gad1/2-DKO) specifically in the glands. We first confirmed the ability of the PTH-Cre driver26 to excise the Gabbr1 genes specifically in PTCs of PTGGABAB1R−/− mice by PCR analyses of their genomic DNA (Supplementary Fig. 4) and to abrogate GABAB1R protein expression by immunoblotting and immunohistochemistry (Extended Data Fig. 1a and 1b, respectively). The ability of the PTH-Cre to ablate GAD1/2 was also confirmed by the absence of GAD1/2 (Extended Data Fig. 2a) and GABA (Extended Data Fig. 2b) by immunoreactivity in PTGs isolated from the Gad1/2-DKO mice.
When treated with vehicle (0.1% dimethyl sulfoxide, DMSO) alone, PTGs from wild-type C57/BL6 (B6:Wt) mice secreted PTH at a mean maximal rate (PTH-Max) of ≈ 200 pg/hr/gland at [Ca2+]e of ≈0.75 mM (Fig. 2a, top panel, red circle) and displayed a mean Ca2+ set-point (defined as the [Ca2+]e at which there was 50% suppression of the Ca2+-suppressible PTH secretion) of 1.31 ± 0.05 mM as better shown in a concentration-effect curve normalized to the basal activity at 0.5 mM Ca2+ (Fig. 2a, bottom panel, red circle). Adding a saturating concentration of GABA (300 μM) significantly (p<0.01) shifted the Ca2+ set-point to 1.63 ± 0.08 mM (Fig. 2a, bottom panel, green triangle) without a significant change in PTH-Max (Fig. 2a, top panel, green triangle). In contrast, baclofen (Bac), a selective GABAB1R agonist, markedly (p=0.01) enhanced PTH-Max to ≈580 pg/hr/gland (Fig. 2a, top panel, blue square) in the lower range of [Ca2+]e without significantly changing the Ca2+ set-point (Fig. 2a, bottom panel, blue square). These results indicate the ability of GABAB1R agonists to stimulate acute PTH secretion, particularly in the lower range of [Ca2+]e encountered in hypocalcemic states. As homomeric CaSRs are anticipated to be inactive at low [Ca2+]e, our data reveals an additional GABAB1R-mediated mechanism, other than the simple inactivation of homomeric CaSR, in promoting tonic PTH secretion.
Figure 2. Impact of GABAB1R and GAD1/2 on PTH Secretion and Mineral and Skeletal Homeostasis.

(a,b) PTGs (2 or 4 per group) of 4-week-old C57/B6 wild-type (B6:Wt) mice were sequentially incubated with increasing [Ca2+]e from 0.5 to 3.0 mM (1 hr per concentration) in the presence of vehicle (Veh, 0.1% DMSO, red circle), (a) 300 μM GABAB1R agonist [GABA: green triangle or Baclofen (Bac): blue square], or (b) 10 μm GABAB1R antagonist, CGP54626 (CGP) (green triangle). Top panels show changes in the rate of PTH secretion on a per-gland and per-hour basis with raising [Ca2+]e to compare the maximal PTH secretion rate (PTH-Max). Bottom panels show normalized PTH secretion rate to the basal rate at 0.5 mM Ca2+ to better assess changes in the Ca2+-set-point ([Ca2+]e needed to suppress 50% of [Ca2+]e-suppressible PTH secretion). Color dotted vertical lines indicate Ca2+ set-points for the corresponding treatments. Mean ± s.e.m. of n = 4 groups of PTGs from 8 mice for each treatment in panel a and 5 (Veh) or 6 (CGP) pairs of PTGs from 5 or 6 mice for panel b; *P < 0.05; **P < 0.01, ***P < 0.001vs Vehicle by two-way ANOVA with Sidak’s multiple comparisons test using Prism 8 statistics software. (c) PTH secretory properties in PTGs (2 per group) from 3-month-old PTGGABAB1R−/− (KO) and control (Cont) littermates were assessed in the presence of vehicle (Veh, 0.1% DMSO, Cont: red circle, KO: red triangle) or baclofen (300 μM, Cont: blue square, KO: green triangle). Mean ± s.e.m., of n = 4–8 pairs of PTGs from 4–8 mice for each genotype and treatment; * P < 0.05, ** P < 0.01 vs Cont-Veh; &P < 0.01 KO-Bac vs Cont-Veh or Cont-Bac by two-way ANOVA with Sidak’s multiple comparisons test. (d) PTH secretory properties in PTGs (2 per group) from 3-month-old PTGGAD1−/−;GAD2−/− double KO (GAD1/2-DKO, magenta triangle) and control (Cont, red circle) littermates. Mean ± s.e.m. of n mice as indicated for each genotype; * P < 0.05, vs Cont by two-way ANOVA with Sidak’s multiple comparisons test. (e-h) Representative pictures (e), average body weights (B.Wt.) (f), serum PTH (sPTH) and total serum Ca2+ (sCa) levels (g), and skeletal parameters in trabecular (Tb) bone of distal femur and cortical (Ct.) bone in tibiofibular junction (h) of GABAB1R-KO mice and control (Cont) littermates with the n as indicated for each group. Tb.BV/TV: Tb bone fraction over total bone volume; Tb.Th: Tb thickness; Tb.BMD: Tb bone mineral density; Ct.TV: total Ct bone volume; Ct.Th: Ct thickness. Mean ± s.e.m. of n = mice as indicated, P-values were assessed by 2-tails Student’s t-test. (i-k) Average B.Wt. (i), sPTH and Ca2+ (sCa) levels (j), and PTG micrographs and quantified volumes (k) of GAD1/2-DKO mice and control (Cont) littermates with the n as indicated for each genotype. For panel K, PTGs were compressed into discs between a pair of glass slide and coverslip with a 120-μm spacer during fixation, washed, stained with blue fluorescent DAPI dye, and imaged. Glandular volumes were calculated as the products of glandular areas x 120 μm and presented in the scatter histograms. Mean ± s.e.m. of n mice as indicated per genotype. P-values were assessed by 2-tails Student’s t-test.
Further supporting the GABAB1R action was the ability of a specific GABAB1R antagonist CGP54626 (CGP) to significantly (p<0.01) reduce PTH-Max (Fig. 2b, top panel, green triangle) and left-shift the Ca2+ set-point from 1.22 ± 0.01 mM to 0.87 ± 0.03 mM (Fig. 2b, bottom panel, green triangle) in B6 PTGs. These actions of CGP on secretory properties (i.e., PTH-Max and Ca2+ set-point) could be replicated in PTGs isolated from PTGGABAB1R−/− (GABAB1R-KO) mice with Cre/loxP-mediated deletion of both Gabbr1 genes in their PTCs (see On-line Methods for the generation of the mice). These KO PTGs showed a reduction in tonic PTH secretion (PTH-Max) (Fig. 2c, top panel, GBR1-KO-Veh vs Cont-Veh), a left-shifted Ca2+ set-point from 1.35 ± 0.07 mM in control PTGs to 1.15 ± 0.08 mM (Fig. 2c, bottom panel, GBR1-KO-Veh vs Cont-Veh), and inability of Bac to increase PTH-Max in the GABAB1R-KO vs control PTGs (Fig. 2c, top panel, GBR1-KO-Bac vs Cont-Bac). These data not only support a critical role of GABAB1R in promoting tonic PTH secretion at low [Ca2+]e, but also specify the receptor as a target of Bac in PTGs.
We next tested whether production of endogenous GABA in PTGs is required for PTH secretion by examining the secretory properties of PTGs lacking GAD1/2. As we anticipated, PTGs from the mice with concurrent ablation of both Gad1 and Gad2 genes in PTCs (GAD1/2-DKO) displayed a left-shifted Ca2+ set-point (from 1.29 ± 0.06 in Cont to 0.95± 0.08 mM in DKO) (Fig. 2d, bottom panel). However, they showed an increased PTH-Max (Fig. 2d, top panel) instead of a reduced PTH-Max as seen in GABAB1R-deficient PTGs (Fig. 2c, top panel). It is plausible that the differential effects of GABA vs GABAB1R KO on the secretory properties of PTG are due to the ability of GABAB1R to interact with other ligands made in PTGs to drive tonic PTH secretion in the absence of GABA. Nevertheless, given the higher efficacy and selectivity of Bac for GABAB1R in PTGs, we utilized Bac in subsequent experiments to better define GABAB1R actions of in PTCs.
Impact of Parathyroid GABAB1R and GAD1/2 on Growth and Systemic Homeostasis
We next examined systemic impacts of parathyroid GABAB1R and GAD1/2 by comparing changes in growth, mineral, hormonal, and skeletal homeostasis in the PTGGABAB1R−/− (or GABAB1R-KO) and PTGGAD1/2−/− (or GAD1/2-DKO) mice vs their control (Cont) littermates. Both male and female mice were studied at 3 months of age and did not show significant sex differences. We, therefore, only reported data from the male mice. The GABAB1R-KO mice showed smaller body sizes (Fig. 2e) and weights by ≈10% (Fig. 2f, red vs gray circles), and all characteristics of hypoparathyroidism with significant lower serum PTH (sPTH) and Ca2+ (sCa) levels (Fig. 2g). Additionally, bones of the GABAB1R-KO mice were smaller and osteopenic (Fig. 2h), likely due to chronic PTH and Ca2+ insufficiency. On the other hand, GAD1/2-DKO mice did not show a significant change in body weight (Fig. 2i), but manifested significantly lower sPTH and sCa levels (Fig. 2j). Remarkably, GAD1/2-DKO mice showed enlarged PTGs (by ≈45%) compared to control (Cont) PTGs (Fig. 2k), indicating a glandular hyperplasia in lieu of chronic hypocalcemia. This could explain the increased PTH-Max of their glands (Fig. 2f, top panel). Nevertheless, these data together reveal previously unknown extraneuronal actions of GABAB1R and GAD1/2 in PTGs that critically regulate growth and skeletal development by maintaining adequate serum PTH and Ca2+ levels.
Heteromerization Between GABAB1R and CaSR in PTGs and in HEK293 Cells
To test our hypothesis that GABAB1R interacts with CaSR to regulate PTH secretion, we first confirmed the formation of native CaSR/GABAB1R heteromers in mouse PTGs (Fig. 3a, left panels) and human parathyroid adenomas (Fig. 3b, left panels) using a proximity ligation assay (PLA) with selective antibodies against the N-termini of these receptors. These PLA signals were considered specific as they were absent in PTGs from PTGGABAB1R−/− mice (Fig. 3a, right panels) or human PTGs incubated with anti-CaSR antibody only (Fig. 3b, right panels). The formation of GABAB1R/CaSR heteromer in PTGs was further supported by specific co-immunoprecipitation of the CaSR with the GABAB1R from human parathyroid adenomas (Fig. 3c), as this signal was profoundly reduced in samples co-immunoprecipitated with non-immune sera (Extended Data Fig. 1e).
Figure 3. Heteromerization of CaSR and GABAB1R in PTCs and HEK293 cells.

(a, b) Proximity ligation assay (PLA) with CaSR and GABAB1R antibodies show strong fluorescent signals (in red) of receptor heteromerization in (a) PTGs from control (Cont), but not PTGGABAB1R−/− KO mice, and in (b) PTGs from patients with 1° HPT incubated with both antibodies, but not in those treated with anti-CaSR alone. Blue: DAPI nuclear staining. Lower panels show digitally enlarged images of white boxed areas. n = 6 PTGs from 3 mouse or 3 human PTGs per group. (c) Membrane proteins (400 μg) extracted from human parathyroid adenomas were subjected to immunoprecipitation (Imppt) with either CaSR or GABAB1R antibodies and immunoblotted (IB) along with non-Imppt controls (input, 50 μg) with either CaSR or GABAB1R antibodies. Left two panels demonstrate the ability of CaSR antibody to pull down ≈140 and 150 kD glycosylated CaSR (arrowheads) and large aggregates (*) along with ≈100 kD unglycosylated and ≈130 kD glycosylated GABAB1R (open arrow). Two right panels demonstrate the ability of GABAB1R antibody to pull down ≈100 kD unglycosylated and ≈130 kD glycosylated GABAB1R (open arrow) along with the ≈140 kD glycosylated CaSR (arrowhead) and large aggregates (*). n = 3 different human PTG lysates. (d) An example of photobleaching experiment. Emission intensities of YFP (535 nm, orange) and CFP (480 nm, blue) recorded from a batch of 5 single cells coexpressing CaSR fused with CFP (CaSR-CFP) and GABAB1R fused with YFP (GABAB1R-YFP). Emission intensities were recorded before and after YFP was photobleached by exposure to continuous illumination at 500 nm. (e) Average recorded FRET efficiency was calculated according to equation (3) (see On-line Methods) from HEK-293 cells expressing a combination of receptors or proteins C-terminally tagged with CFP or YFP as indicated. Mean ± s.e.m. of n batches of cells (5 cells/batch) as indicated from 3 independent DNA transfections. P values between groups were assessed by one-way ANOVA Sidak’s multiple comparisons test. (f, g) (f) Multicolor BiFC detection of GABAB1R homomers and GABAB1R/CaSR or GABAB1R/GABAB2R heteromers. CaSR carrying an N-terminal fragment of CFP (CaSRN-CFP), GABAB1R carrying the N-terminus of the YFP (GABAB1RN-YFP), and GABAB1R carrying the C-terminus of CFP/YFP (GABAB1RC-CFP/YFP) were coexpressed in HEK-293 cells. The relative amount of homodimer versus heterodimer was visualized after excitation at 500 nm (YFP) or 436 nm (CFP), respectively. In separate experiments, similar BiFC approach and transfection protocols were used to assess heteromerization of GABAB1RN-CFP and GABAB2RC-CFP in HEK-293 cells. (g) CFP emission intensities recorded from HEK293 cells transfected with an increasing amount of CaSRN-CFP in combination with a fixed amount of GABAB1RC-CFP cDNAs. Mean ± s.e.m. of n batches of cells (5 cells/batch) as indicated from 3 independent DNA transfections. P values between groups were assessed by 2-tails Student’s t-test.
We further evaluated the propensity of GABAB1R and CaSR in heteromerization by a series of fluorescence resonance energy transfer (FRET) experiments using cultured human embryonic kidney (HEK)-293 cells expressing recombinant receptors. Specific intermolecular FRET was detected between CaSR and GABAB1R, which were C-terminally tagged with CFP and YFP, respectively (Fig. 3d), with an efficacy similar to the FRET signals recorded for the well-established GABAB1R/GABAB2R heteromer (Fig. 3e). The specificity of this CaSR/GABAB1R interaction is supported by minimal FRET signals between the plasma membrane-tagged CFP and YFP (CFPm and YFPm, respectively), or between CFP and YFP fused to the C-terminus of GABAB1R (GABAB1RCFP) and PTH receptor (PTHRYFP), respectively (Fig. 3e). We further corroborated the selectivity of CaSR/GABAB1R heteromer through a bimolecular fluorescence complementation (BiFC) assay. This assay is based on the generation of functionally complemented fluorescent protein (FP) by physical association of two halves (N− and C−) of FPs that are brought in close proximity by specific interactions of two molecules tagged with the complementary FP fragments27–29. Specifically, HEK-293 cells were transfected with equal molar ratio of cDNA to express simultaneously (i) the CaSR C-terminally fused to the N-terminus fragment of CFP (residues 1–158) (CaSRN-CFP), (ii) the GABAB1R C-terminally fused to N-terminus fragment of YFP (GB1RN-YFP), and (iii) the GABAB1R C-terminally fused to the C-terminus fragment of CFP (residues 158–239) (GABAB1RC-CFP/YFP), which is identical to and functionally exchangeable with the C-terminus fragment of YFP. The relative amount of CaSRN-CFP/GABAB1RC-YFP heteromer vs GABAB1RN-YFP/GABAB1RC-YFP homomer was then determined by recording BiFC-CFP vs BiFC-YFP fluorescence, respectively. We observed only a saturable CFP (CaSR/GABAB1R) signal (Fig. 3f, 3g) and minimal YFP (GABAB1R/GABAB1R) signal, indicating a preference in the formation of CaSR/GABAB1R heteromer over GABAB1R/GABAB1R homomer. The propensity of CaSR/GABAB1R heteromerization was again comparable to that of GABAB1R/GABAB2R heteromerization as indicated by their comparable BiFC signals (Fig. 3f). Taken together, our data reveal strong propensity of CaSR and GABAB1R to form heteromers in transfected cells and PTCs.
Impact of GABAB1R/CaSR Heteromer on Signaling Responses of Homomeric CaSRs
Given the ability of CaSR to chaperone GABAB1R to cell surface in the form of heteromer in transfected HEK293 cells22, we tested whether GABAB1R traffics with homomeric CaSR to cell surface and interfere with signaling responses of the latter receptor there, particularly in response to binding to GABAB1R agonists. As previous studies30,31 suggested that homomeric CaSR mediates the inhibitory action of extracellular Ca2+ on PTH secretion through Gq/G11 and Gi activation, we first confirmed this notion by assessing PTH secretion in PTGs cultured from mice with PTG-specific deletion of Gαq in the background of germ-line Gα11 KO (PTGGq−/−//G11−/−) and in wild-type PTGs treated with pertussis toxin (PTx) to block Gi activation, respectively. We showed that ablation of Gnaq and Gna11 genes in PTCs blocked the ability of raising [Ca2+]e to suppress PTH secretion as indicated by right-shifted Ca2+ set-points in a gene dosage-dependent manner (Extended Data Fig. 3), while PTx enhanced PTH secretion, particularly in the lower range of [Ca2+]e in which baclofen promotes PTH secretion (Extended Data Fig. 4). Interestingly, in PTGs cultured from the PTGGq−/−//G11−/− mice lacking Gαq and Gα11, we observed increases in PTH secretion with raising [Ca2+]e in the lower range of [Ca2+]e (0.5 to 1.5 mM) (Extended Data Fig. 3). The latter effects were, however, absent in PTGs cultured from mice lacking both alleles of Casr genes (Extended Data Fig. 3). These data not only confirmed the requirement of both Gq/11 and Gi activation in mediating the high [Ca2+]e-induced suppression of PTH, but also unveiled a Gq/11-independent action of Ca2+/CaSR, likely by activating the CaSR/GABAB1R heteromer to promote PTH secretion.
We then measured time courses of G-protein (Gq or Gi) activation using FRET-based biosensors32,33 in HEK-293 cells expressing the recombinant CaSR and/or GABAB1R. Application of Ca2+ to single cells expressing the CaSR alone induced a fast increase in FRET ratios reflecting Gq (Fig. 4a) or Gi (Fig. 4d) activation. Co-expression of GABAB1R with the CaSR suppressed the maximal activation of Gq (Fig. 4b) and Gi (Fig. 4e) mediated by Ca2+ by ≈30–50% (Fig. 4c, 4f). These inhibitory effects were further exacerbated by addition of baclofen (Fig. 4b, 4e), thus indicating reduced homomeric CaSR signaling when CaSR/GABAB1R complexes are activated by baclofen (Fig. 4c, 4f). Baclofen did not affect Gq or Gi activation via CaSR alone (Fig. 4a, 4d), nor did Ca2+ affect G-protein activation via GABAB1R when each receptor was expressed alone in HEK-293 cells. Similar inhibitory action of baclofen on Ca2+-mediated Gq activation were obtained in rat parathyroid-derived PTH-C1 cells34 (Extended Data Fig. 5a) with (left panel) or without (right panel) supplementation of exogenous CaSR and GABAB1R cDNAs.
Figure 4. Signaling properties of the CaSR/GABAB1R heteromer.

(a, b) Representative FRET experiments showing direct effect of Ca2+ (3 mM) alone or with baclofen (300 μM) in single HEK293 cells coexpressing the FRET-based Gq sensor (GqTurq/YFP) and CaSR (a) alone, or (b) in combination with GABAB1R. The change in FRET (NFRET) was calculated according to equation #2 (see On-line Methods) with the initial value at t = 0 set to 1. (c) Histograms represent the effects of Ca2+ and baclofen added alone or together on the level of Gq activation with 100% corresponding to an increase of the FRET ratio by 6%. Mean ± s.e.m. of N = 5 with 5 cells/ experiment; P values between groups were assessed by one-way ANOVA Sidak’s multiple comparisons test. (d–f) Similar experiments were done with the FRET-based Gi sensor (GiCFP/YFP) (d,e) and summarized (f). Mean ± s.e.m. of n = 4–5 experiments with 5 cells/experiment. P values between groups were assessed by one-way ANOVA Sidak’s multiple comparisons test. (g, h) Concentration-response relation for Ca2+ on the change in total inositol phosphate (InPTotal) production (g), and corresponding normalized histograms summarizing (h) the effects of baclofen on Ca2+-mediated InP production in cells coexpressing CaSR and/or GABAB1R. Mean ± s.e.m. of n = 6–10 experiments with 5 cells/experiment. P values between groups were assessed by one-way ANOVA Sidak’s multiple comparisons test. (i-k) Averaged time-courses of cAMP in PTH-C1 cells pretreated with cholera toxin (CTX, 1 μg/ml for 5 h) and expressing CaSR (i) alone or (j, k) with GABAB1R. Horizontal bars represent application of a saturating concentration of Ca2+ (3 mM) alone or in combination with baclofen (300 μM) and/or a GABAB1R antagonist, CGP54626 (10 μM), or forskolin (10 μM). Mean ± s.e.m. of n = 3 experiments with 10–15 cells/experiment.
The ability of baclofen to inhibit Ca2+-mediated Gi or Gq activation, when GABAB1R was coexpressed, was also observed at the second-messenger level. Specifically, we studied effects of high [Ca2+]e on receptor-mediated activation of total inositol phosphate turnover (IPTotal) and inhibition of cAMP in cells pretreated with cholera toxin (CTx) that induces persistent activation of the Gs/adenylate cyclase/cAMP pathway as readouts of downstream Gq and Gi signaling, respectively. In cells expressing CaSR alone, high [Ca2+]e stimulated IPTotal in a concentration-dependent manner (Fig. 4g, black circles). This effect of high [Ca2+]e decreased markedly when GABAB1R was coexpressed, and baclofen further decreased this effect by ≈15% (Fig. 4g, blue circles, and 4h). Pretreatment of PTH-C1 cells expressing CaSR alone with CTx increased the basal level of cAMP, and high [Ca2+]e markedly decreased the production of cAMP (Extended Data Fig. 5b and Fig. 4i). Coexpression of GABAB1R decreased the efficacy of high [Ca2+]e to block cAMP accumulation (Fig. 4j), and baclofen further prevented the inhibitory action of high [Ca2+]e (Fig 4k). The observed effect of baclofen likely resulted from a direct binding to GABAB1R because addition of a competitive GABAB1R antagonist, CGP54626, reversed the action of baclofen and restored the cAMP response to a level similar to that was caused by high [Ca2+]e in the absence of baclofen (Fig. 4k). Baclofen did not modulate IPtot or cAMP production by itself, thus indicating that these effects were dependent on the coactivation of both CaSR and GABAB1R by their respective ligands. These signaling data together suggest that following baclofen binding, a conformational change transmitted from the GABAB1R to the homomeric CaSRs reduces efficacy of Gq and Gi activation (extent and duration of G protein signaling) of the latter receptors as a molecular basis to promote PTH secretion.
Increased GABAB1R/CaSR Heteromers in Hyperplastic PTGs from 1°HPT and 2°HPT Patients
We reasoned that reduced CaSR expression in PTG, a well-established characteristic of both 1° and 2° HPT, renders a receptor stoichiometry favoring the formation of CaSR/GABAB1R heteromers, thus promoting PTH secretion. To test this hypothesis, we compared the expression of CaSR and GABAB1R by immunohistochemistry and expression of CaSR/GABAB1R heteromer by PLA in PTGs surgically removed from patients who were clinically diagnosed with 1° HPT or 2° HPT (Supplementary Table 1) to the levels in normal PTG tissues that were excised during parathyroid exploration or thyroidectomy for thyroid cancer. In the hyperplastic PTGs from both 1° HPT (Fig. 5a, regions 3 and 4) and 2° HPT (Fig. 5b, regions 3 and 4) patients, we observed significant increases in the expression of GABAB1R/CaSR heteromer by 3.4- and 5.2-fold (Fig. 5c), respectively, along with >50% reduction in CaSR expression (Fig. 5c and Supplementary Fig. 5a) and 30–40% reductions in GABAB1R expression (Fig. 5c and Supplementary Fig. 5b), when compared to adjacent normal parathyroid tissue and to normal PTGs (Fig. 5a, 5b: regions 1 and 2, and 5c). These data associate increased expression of GABAB1R/CaSR heteromer with PTH hypersecretion in these diseases.
Figure 5. Increased Expression of CaSR/GABAB1R Heteromers in PTGs from Patients with 1° HPT and 2° HPT.
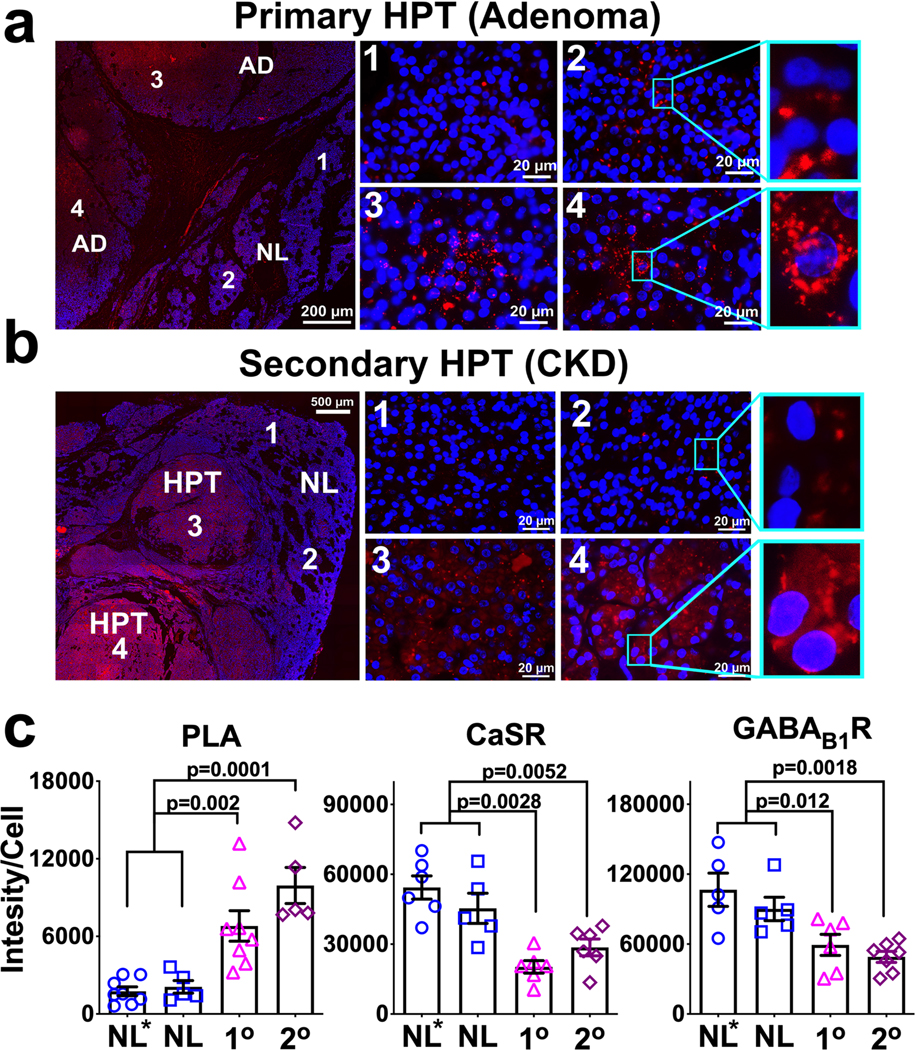
(a,b) Representative images of fluorescent PLA signals (in red) of CaSR/GABAB1R heteromers in parts of the excised glands that represent the adenoma (zones 3 and 4) and adjacent normal parathyroid tissue (zones 1 and 2) in sections of (a) PTG tumor from a patient with surgically proven 1° HPT, or (b) hyperplastic nodules in the PTG removed from a patient with 2° HPT. Blue fluorescence indicates DAPI nuclear staining. There sections from each sample (patents) were stained independently in 3 separate experiments and the averaged value was used for statistical analyses shown below. (c) Corresponding histograms comparing expression levels of CaSR/GABAB1R heteromers (left plot), or individual receptors (central and right plots) from abnormal parathyroid tissues to expression levels in normal parathyroid tissues (NL*) excised together with hyperplasic PTGs as seen in panels (a) and (b) or removed during thyroid surgery from patients without known parathyroid diseases (NL, images not shown). The increased levels of CaSR/GABAB1R heteromer were accompanied by reduced CaSR and GABAB1R expression (see Supplementary Fig. 5a,b for representative images) in both HPT states. Data are the Mean ± s.e.m. of n= 5–8 (NL*), 5 (NL) , 5–8 (1° HPT), and 5–7 (2° HPT) biologically independent PTGs samples (patients)/3 independent experiments. P-values between groups indicated were determined by one-way ANOVA with Sidak’s test.
The GABAB1R-mediated PTH Hypersecretion in CaSR-insufficient and calcium-deficient states
To test whether GABAB1R/CaSR heteromers contribute to PTH hypersecretion in states of CaSR insufficiency, as seen in 1° and 2° HPT, we studied effects of deleting Gabbr1 genes in mice lacking 1 ( PTGCaSR+/–) or 2 ( PTGCaSR−/−) alleles of Casr gene in their PTGs. As shown previously35, the PTGCaSR+/– mice, a hereditary mild 1°HPT model, developed normally along with increased body weights (Fig. 6b, blue circles), mild PTH excess (Fig. 6c), and hypercalcemia (Fig. 6d). Reducing or completely blocking GABAB1R/CaSR heteromerization by concurrent ablation of single (PTGCaSR+/–//GABAB1R+/–) or both (PTGCaSR+/–//GABAB1R−/−) alleles of Gabbr1 gene in PTCs of the mice, respectively, produced gene-dosage effects in alleviating serum PTH excess (Fig. 6c) and hypercalcemia (Fig. 6d). In fact, the PTGCaSR+/–//GABAB1R−/− mice had a sPTH level, which was lower than the level in control (PTGCaSR+/+//GABAB1R+/+) mice, likely due to the markedly reduced PTH-Max (Fig. 6e, top panel) and left-shifted Ca2+ set-point (Fig. 6e, bottom panel) in their PTGs. As seen in wild-type PTGs treated with GABA or baclofen (Fig. 2a, top panel, blue square), PTGs from the PTGCaSR+/– mice displayed biphasic secretory responses to [Ca2+]e: increasing PTH secretion at <1.0 mM Ca2+, and decreasing PTH secretion at > 1.0 mM Ca2+ (Fig. 6e, blue circle). The increasing phase of secretory response in the lower range of [Ca2+]e was completely abrogated in the PTGs of PTGCaSR+/–//GABAB1R−/− mice lacking both alleles of Gabbr1 genes (Fig. 6e, magenta square). These data suggest that increasing activation of CaSR/GABAB1R complexes may underlie the tonic PTH hypersecretion in the lower range of [Ca2+]e, particularly when the GABAB1R:CaSR stoichiometry is reduced in the condition of decreasing CaSR expression (in this case, due to deletion of one Casr gene allele).
Figure 6. Impacts of GABAB1R KO on PTH Secretory Functions and Mineral and Hormonal Status in Mouse Models of Hereditary HPT and Chronic Ca2+-deficiency.

(a) Pictures of 3-month-old male mice with heterozygous or homozygous GABAB1R KO in the background of heterozygous or homozygous CaSR KO in their PTCs and their control littermates and 3-week-old mice with homozygous CaSR KO, which usually die between 3–4 weeks of age. (b–d) Average body weights (B.Wt.) (c), sPTH (d) and Ca2+ levels (d) in mice with PTG-specific heterozygous (+/−) or homozygous (−/−) CaSR and heterozygous (+/−) or homozygous (−/−) GABAB1R KO and control littermates carrying floxed-alleles without PTH-Cre expression. Mean ± s.e.m. of n mice for each group as indicated below the genotype. *P < 0.05, **P < 0.01 between groups by one-way ANOVA with Sidak’s test. (e, f) Assessments of PTH secretory properties (PTH-Max and Ca2+-set-point) of PTGs (2 per group) from the 3-month-old mice with heterozygous (e) or homozygous (f) CaSR KO without (blue or brown circle) or with (magenta or yellow square) homozygous GABAB1R KO and their control littermates (gray circle). Mean ± s.e.m. of n mice as indicated in the plots. **P < 0.01 vs PTGCaSR+/–//GABAB1R+/+ mice in panel E or vs PTGCaSR−/−//GABAB1R+/+ mice in panel F by two-way ANOVA with Sidak’s test. (g) Serum PTH and Ca2+ levels in 16-wk-old male PTGGABAB1R−KO and Control (Cont) littermates after feeding with normal (1%) or low Ca2+ (0.02%) diets for 4 weeks. Mean ± s.e.m. of n = 8–12 mice as indicated, *P < 0.05 and **P < 0.01 between groups indicated by one-way ANOVA with Sidak’s test.
The PTGCaSR−/− mice with homozygous deletion of Casr genes in their PTGs, produced much more severe HPT, failed to thrive, and died before 3–4 weeks of age35 with reduced body sizes (Fig. 6a, CaSR-KO), ≈7-fold increase in sPTH (Fig. 6c, brown circle), and ≈70% increase in sCa levels (Fig. 6d, brown circle), when compared to 3-month-old control littermates. Remarkably, concurrent deletion of 1 (PTGCaSR−/−//GABAB1R+/–) or 2 (PTGCaSR−/−//GABAB1R−/−) alleles of Gabbr1 gene rescued the mice from early death and permitted a relatively normal growth, albeit with a slight decrease (≈5%) in body weight (Fig. 6b, orange or yellow circle). The severe HPT phenotypes were significantly alleviated as indicated by the much reduced sPTH (Fig. 6c) and sCa (Fig. 6d) levels, when compared to 3-week-old PTGCaSR−/− mice (Fig. 6b, 6c, brown circle). PTGs cultured from the PTGCaSR−/−//GABAB1R−/− mice also showed a much reduced PTH-Max when compared to the glands of PTGCaSR−/− mice (Fig. 6f, top panel, yellow square vs brown circle), despite the lack of apparent inhibitory responses to raising [Ca2+]e in both groups, when compared to control littermates (Fig. 6f, bottom panel, gray circle). These data not only confirm nonredundant roles of GABAB1R in mediating PTH hypersecretion in conditions of CaSR deficiency, but also suggest that GABAB1R may also contribute to tonic PTH secretion through a CaSR-independent pathway.
To test whether the parathyroid GABAB1R is involved in PTH hypersecretion resulting from chronic Ca2+-deficiency, we subjected the GABAB1R-KO mice and their control littermates to a continuous low Ca2+ diet (0.02% vs 1% in the normal diet) for 4 weeks. Our data showed that the ability of this diet to increase serum PTH levels (by ≈50%) in control littermates was completely lost in the GABAB1R-KO mice (Fig. 6g, left panel), despite the fact that their serum [Ca2+] remained lower than control mice (Fig. 6g, right panel), supporting a role for the GABAB1R in mediating hypocalcemia-induced PTH hypersecretion.
DISCUSSION
Our data unveil a biological action of the GABA/GABAB1R system in mediating PTH secretion to maintain mineral balance and normal skeletal development and a pathological role in enabling PTH hypersecretion in HPT states. Our demonstrations of GAD1/2 expression and GABA biosynthesis in PTGs and the ability of GAD1/2 KO to produce hypoparathyroidism further support an autocrine scheme in which PTCs release GABA to alter PTH secretion by attenuating homomeric CaSR signaling through allosteric interactions between the CaSR and GABAB1R receptors (Fig. 7). We speculate that inherent declines in CaSR expression in 1° and 2° HPT disease conditions decreases levels of CaSR homomers and at the same time increases the likelihood for GABAB1R/CaSR heteromer formation. However, concurrent reductions of GABAB1R and CaSR expression in PTGs of 1° HPT and 2° HPT patients suggest that mechanisms other than simple stoichiometric ratio changes in receptor expression (i.e., GABAB1R over CaSR) could also be involved to alter the propensity of GABAB1R/CaSR heteromerization.
Figure 7. Proposed Model Illustrating the Role of GABA and GABAB1R in PTGs.

We propose that GABA made by parathyroid GAD1/2 acts as an autocrine pathway to activate GABAB1R in the GABAB1R/CaSR heteromers to block G-protein signaling of the CaSR/CaSR homomers in PTGs, thus promoting PTH secretion, and that increased expression and/or activation of GABAB1R/CaSR heteromers underlie the PTH hypersecretion in different HPT states. The presented stoichiometric composition of the receptor complex is speculative and remains to be determined.
A notable observation is the distinct pharmacological profiles of Bac and GABA in mediating PTH secretion. The former tends to increase PTH-Max, while the latter shifts the Ca2+ set-points (Fig. 2a). Given that the only structural difference between GABA- and baclofen-occupied GABAB1R is the orientation adopted by its N-terminal extracellular residue W27636,37, the distinct efficacy and potency, by which GABA and baclofen act on GABAB1R/CaSR heteromer to interfere with the homomeric CaSR, might reflect distinct conformational change of the GABAB1R/CaSR heteromer when it interacts with GABA- vs. baclofen-bound GABAB1R. These differential signaling responses are also reflected by the different phenotypic manifestations between GABAB1R-KO and GAD1/2-DKO mice. GABAB1R-KO mice appear to produce more severe growth defects than the GAD1/2-DKO based on their body weights (Fig. 2f vs 2i). GABAB1R KO also had more profound impact on reducing PTH-Max than GAD1/2 DKO in the PTGs (Fig. 2g vs 2j).
Several questions remain to be answered to further understand the mechanism of the process described here. Among them are the following:
How does the CaSR heteromerize with the GABAB1R? While covalent disulfide bonding in the N-terminal extracellular domain (ECD) of the CaSR is involved in its homodimerization2, the ability of CaSR-ECD (a.a. 1–579) alone to complex with the GABAB1R22 that lacks a corresponding cysteine-rich domain in its ECD, however, supports critical noncovalent interactions between the ECDs of the receptors in CaSR/GABAB1R heteromerization. Given that a polar interface, instead of hydrophobic action seen in the dimerization of mGluRs, is critically involved in GABAB1R/GABAB2R heterodimerization38 and that GABAB1R and GABAB2R mutually compete for heterodimerization with CaSR22, it is an attractive hypothesis that formations of ionic salt-bridges between the ECDs of CaSR and GABAB1R as well as the helix:helix interactions in the hydrophobic transmembrane domains are needed to mediate the complex formation and perhaps their binding to the respective ligands (GABA and Ca2+). Mapping of the interaction sites between these two receptors may permit new strategies for blocking the formation and/or functions of CaSR/GABAB1R heteromers as a new pharmacological means to prevent PTH hypersecretion.
How does GABAB1R interfere with the coupling of homomeric CaSRs to downstream Gq/11 and Gi signaling responses? This interaction may take place in an acute dynamic fashion between two or more complexes (i.e., CaSR/GABAB1R heterodimers and CaSR/CaSR homodimer) immediately after binding to their respective ligands. However, given that simply coexpressing GABAB1R (without Bac) is sufficient to reduce coupling of CaSR to down-stream signaling responses, we prefer the model involving a pre-assembled higher-order receptor complex (e.g., trimer, tetramer, etc.) containing both CaSR/GABAB1R heterodimers and CaSR/CaSR homodimer with a pre-determined stoichiometric composition. In transfected HEK cells, we observed colocalization of recombinant CaSR and GABAB1R as early as in the perinuclear endoplasmic reticulum22, suggesting that this pre-assembled complex may take place immediately after protein synthesis.
Can additional parathyroid GPCRs be upregulated in pathological conditions and interact with CaSR and/or GABAB1R? This is particularly pertinent given that GPR64, an orphan adhesion GPCR whose expression is upregulated in parathyroid adenomas39 has been proposed to physically interact with the CaSR.
Can the GABAB1R regulate PTH secretion independently of the CaSR? While our present results demonstrate the interaction between CaSR and GABAB1R as a means to regulate PTH secretion from PTGs, the robust PTH secretion in the absence of CaSR in the PTGs of the PTGCaSR−/− mice (Fig. 6f, top panel, brown circles) and profound abrogation of this hypersecretory activity in PTGs of PTGCaSR−/−//GABAB1R−/− mice with concurrent GABAB1R KO (Fig. 6f, top panel, yellow squares) raise the possibility of a CaSR-independent action of GABAB1R in promoting PTH secretion. Alternatively, a minute amount (≈10%) of CaSR due to incomplete Casr gene excision could readily interact with GABAB1Rs to promote PTH secretion, as we showed previously that PTH-Cre permits ablation of ≈90% of CaSR in the PTGs of the PTGCaSR−/− mice40.
While future studies are required to address these questions, our results unveil the unexpected and determinant role of GABA and GABAB1R in regulating CaSR signaling and PTG functions. Considering that the GABAB1R and CaSR, are expressed in central neurons and many vital peripheral tissues, we anticipate that the regulation of CaSR signaling and function by the GABAB1R also impacts biological processes beyond mineral and skeletal homeostasis. Development of targeted pharmaceuticals against cell and/or subcellular domain-specific heteromers could also improve the effectiveness of disease treatment and prevent the unwanted side-effects of more generalized pharmaceutics such as baclofen that has been used to treat neurological disorders.
METHODS
Detailed information on experimental design and reagents included in the study is attached in the affiliated “Reporting Summary” document.
Mice
All animal procedures were approved by the Institutional Animal Care and Use Committee of the San Francisco Department of Veteran Affairs Medical Center (Protocol numbers: 2012–035, 2015–029, and 2015–003). Wild-type C57/B6 and PTH-Cre mice26 (Stock No:005989) were purchased from Jackson Laboratory (JAX; Bar Harbor, Maine, USA). Floxed-GABAB1R mice were provided by Dr. Bernhard Bettler (University of Basel, Switzerland)41. Floxed-GAD1;GAD2 mice42,43 were generated by Dr. Richard Palmiter (University of Washington) and obtained from Dr. Qi Wu (Baylor College of Medicine). Floxed-CaSR mice were made previously40. PTH-Cre, Floxed-GABAB1R, and/or Floxed-CaSR mice were bred to obtain male PTGCaSR+/–//GABAB1R+/– and female CaSRflox/wt//GABAB1Rflox/wt mice, which were then used to produce PTGGABAB1R−/−, PTGCaSR+/–, PTGCaSR−/−, PTGCaSR+/–//GABAB1R+/–, PTGCaSR+/–//GABAB1R−/−, and PTGCaSR−/−//GABAB1R−/− mice and control (Cont) littermates. The latter controls carry 1 or 2 alleles of floxed-CaSR and/or floxed-GABAB1R without PTH-Cre transgene. PTH-Cre and Floxed-GAD1;GAD2 mice were bred to obtain PTGGAD1−/−//GAD2−/− and female GAD1flox/flox//GAD2flox/flox mice which were then crossed to produce PTGGAD1−/−//GAD2−/− double KO (or PTGGAD1/2−/− and GAD1/2-DKO) mice and control (Cont) mice carrying floxed-GAD1 and floxed-GAD2 alleles without PTH-Cre expression. Mice carrying floxed-Gnaq alleles in the background of germline Gna11 KO were provided by Dr. Jurgen Wess (National Institutes of Health, Bethesda, MD) and were bred with PTH-Cre mice to produce PTGGq−/− , PTGGq−/−//G11+/–, and PTGGq−/−//G11−/− mice and control littermates. All transgenic mice were bred into C57/BL6 background before studies were performed at 12 weeks of age, or as specified, along with their control littermates. All mice were kept in a climate-controlled room with a 12-hour light/12-hour dark cycle with standard diets as previously described40. Both male and female mice were studied and did not show significant sex differences. We, therefore, only reported data from male mice. For dietary experiments, 12-wk-old male PTGGABAB1R−/− and control littermates were fed with normal (1%) or low Ca2+ (0.02%) diets for 4 weeks. All serum and tissue collections were performed under anesthesia by Isoflurane at the specified ages. All animal experiments were performed in accordance with the ARRIVE (Animal Research Reporting of In Vivo Experiments) guideline.
Mouse genotypes were determined by PCR analysis of genomic DNA extracted from tail snips using primer sets reported previously40,41. To detect the presence of the exon8-less Gabbr1 allele, genomic DNA from different tissues of PTGGABAB1R−/− and their control littermates were analyzed by PCR using primers flanking the exon 8 the gene (upper primer, 5’-ATC TCT TCC TTG GCT GGG TCT TTG CTT CGC TCG-3’; lower primer, 5’-GGG TTA TTG AAT ATG ATC GGA ATT CCT CGA CT-3’)41 to give a 0.36 kb DNA fragment indicative of gene excision. PTG-specific ablation of the exon 7 of the Casr gene in PTGCaSR−/− mice was determined as described previously40.
Cell Culture, Transfection and plasmids
Cell culture reagents were obtained from Corning (CellGro). Human embryonic kidney cells (HEK-293; ATCC, Georgetown, DC) stably expressing the recombinant mouse CaSR were grown in selection medium (DMEM, 10% FBS, penicillin/streptomycin 5%, 500 μg/ml neomycin) at 37°C in a humidified atmosphere containing 5% CO2. The parathyroid PTH-C1 cells were generously given by Dr. Maria Luisa Brandi and cultured in DMEM/F12 (Corning #10–090-CV)34. For transient expression, cells were seeded on glass coverslips coated with poly-D-lysine (50 μg/ml H2O) in 6-well plates and cultured for 24 hours prior transfection with the appropriate cDNAs using Fugene-6 (Promega) or Lipofectamine 3000 (Life Technologies) for 48–72 hrs before experiments. We optimized expression conditions to ensure the expression of fluorescently labeled proteins was similar in examined cells by performing experiments in cells displaying comparable fluorescence levels. Plasmids used to express recombinant receptors and FRET-based sensors were previously reported: for cAMP32, Gi and Gq proteins33, and for CaSR and GABAB1R23.
Ex vivo PTG cultures
Mouse PTGs were isolated, dissected free of thyroid and surrounding fibrous tissues, and cultured to assess PTHmax (maximal PTH secretion rate) and Ca2+ set-point ([Ca2+]e needed to suppress 50% of PTHmax)35,40. Briefly, PTGs were incubated with a series of DMEM media containing increasing [Ca2+]e sequentially with or without compounds to be tested. The PTHmax and Ca2+ set-points were extrapolated from each Ca2+/PTH response curve and used for statistical analyses. After secretion assays, some PTGs were compressed into 120 μm-thick discs using a pair of standard glass slide and coverslip with a Secure-Seal™ spacer (S24737, Invitrogen by Thermo Fisher Scientific) during fixation by 4% paraformaldehyde. After 3 washes, PTG disks were stained with blue fluorescent DAPI dye, and imaged. Glandular volumes were calculated individually as the products of glandular areas x 120 μm and used for statistical comparisons.
Human PTGs
Deidentified parathyroid tissues (nine 1°HPT, seven 2°HPT, and five normal controls; see Supplementary Table 1), were obtained by endocrine surgical collaborators in the Department of Surgery, University of California San Francisco as a routine patient treatment procedure, after obtaining a general informed consent. The PTG samples were later retrieved by Dr. Khanafshar from the archives of Department of Pathology, University of California San Francisco under a human research protocol (#15–17253) approved by UCSF Institutional Review Board based on the following clinical criteria verified by medical record review by Drs. Khanafshar, Shoback, and Herberger. Criteria used for selection of the tissues for study were the following. 1° HPT: (i) serum Ca ≥ 10.2 and ≤ 13.5 mg/dL; (ii) elevated serum PTH levels in setting of hypercalcemia; and (iii) the absence of a known genetic basis for the 1° HPT (e.g., MEN1). 2° HPT: (i) CKD stage 5 on dialysis; (ii) elevated serum PTH levels; and (iii) symptoms of uremic 2° HPT necessitating surgical intervention as determined by referring nephrologists. Normal PTGs: (i) glands inadvertently removed during thyroid operations identified in the pathologic specimens; (ii) no known abnormality in serum Ca homeostasis; and (iii) PTGs classified as histologically normal by attending pathologists. The PTGs were fixed in 4% PFA, embedded in paraffin, sectioned in 5-μm thickness, and subjected to PLA assay and immunohistochemical detection for CaSR and/or GABABR1 as described below.
Immunohistochemistry
Mouse PTGs microdissected free of thyroid and other soft tissues from wild-type C57/B6 mice and PTGGABAB1R−/− and control littermates were embedded in paraffin, and sectioned in 5 μm thickness. Immunohistochemical detection of CaSR, GABAB1R, GABA, and GAD1/2 in mouse and/or human PTG sections were performed with a rabbit custom-made rabbit polyclonal anti-N-CaSR (VA609, ADDDYGRPGIEKFREEAEERDI) (1 μg/ml)22, a guinea pig anti-GABAB1R-C (CPSEPPDRLSSDGSRVHLLYK) (1 μg/ml)22, a rabbit anti-GABA (Cat.# A2052, SIGMA), or a rabbit anti-GAD1/2 (Cat.Ab49832, Abcam), and corresponding peroxidase- or FITC-conjugated secondary antibodies, and 3,3’-diaminobenzidine (DAB)-substrate as previously described22. The specificity of anti-GABAB1R-C, anti-N-CaSR, Anti-GAD1/2 and Anti-GABA antibodies was confirmed by the lack of immunoreactivity in protein lysates (Extended Data Fig. 1a, 1c) or tissue sections (Extended Data Fig. 1b and 1d and Extended Data Fig. 2a and 2b) of PTGs isolated from PTGGABAB1R−/−, PTGCaSR−/− , and PTGGAD1/2−/− mice, respectively. The specificity of anti-GABA was further verified by the lack of immunoreactivity in adjacent tissue sections subjected to non-immune IgG controls (Extended Data Fig. 2c).
PLA assays
This technique permits the detection and quantification of protein–protein interactions. In brief, when two selective antibodies are in proximity (< 30 nm) due to protein complex formation, complementary DNA strands attached to the secondary antibodies are allowed to be ligated, massively replicated, and visualized with fluorescence-conjugated DNA probes 44. To detect in situ CaSR/GABAB1R complexes, proximity ligation assays (PLA) were performed using Duo link in Situ Detection kits (Sigma-Aldrich Corp., St Louis, MO) according to manufacturer’s instruction on sections of PTGs from PTGGABAB1R−/− mice and control littermates and sections of human PTGs. Briefly, deparaffinized mouse and human PTG sections were rehydrated, washed, permeabilized with 1% NP-40 in phosphate-buffered saline for 5 min, and incubated in blocking buffer (5% horse serum, 1% BSA, 0.01% Tween-20) for 30 minutes. Sections were incubated with a mouse monoclonal antibody against the N-terminus of GABAB1R (Abcam ab55051; 20 μg/ml) and anti-N-CaSR (VA609; 4 μg/ml) at 4°C overnight, followed by sense and anti-sense oligonucleotide-conjugated secondary antibodies at 37°C for 1 hour. DNA ligation was performed with DNA ligase (25U/ml) at 37°C for 1 hour, followed by DNA amplification by polymerase I (12.5U/ml) for 100 min at 37°C. After incubation with red fluor-conjugated DNA probes and washing, the sections were mounted with DAPI-containing mounting medium, imaged with a Zeiss Axio Imager 2 Microscopes (Carl Zeiss, Germany), and quantified using automated TissueQuest Analysis software (TissueGnositics USA, Ltd, Tarzana, CA). Total PLA activities in the regions of interest (ROIs) were divided by total DAPI-positive cell number in the ROI to obtain mean PLA activity/cell. The specificity of anti-N-GABAB1R (Abcam ab55051) was demonstrated by the lack of PLA signaling in the PTGGABAB1R−/− mice (Fig. 3a).
Immunoprecipitation and immunoblotting
Membrane proteins (400 μg) extracted from human parathyroid adenoma were immunoprecipitated with 7.5 μg of mouse monoclonal antibody against CaSR C-terminal tail (1C7E4–1B, CKSNSEDRFPQPERQKQ) or guinea pig polyclonal antibody against GABAB1R or pre-immune guinea pig IgG as described previously4. Immunoprecipitated and naive membrane protein (50 μg) were electrophoresed on polyacrylamide gels, transferred onto PDVF membrane, and immunoblotted with a guinea pig polyclonal antibody against GABABR1 (1:1000 dilution) or a rabbit polyclonal antibody against CaSR (VA609; 1:1000 dilution) as previously described4,5. Protein reactivity was detected using the Clarity Western ECL substrate (BIO-RAD laboratories, Inc., Hercules, CA) and visualized by a LAS4000 imaging system (Fujifilm Life Science, Stamford, CT). The data presented are representative of 4 independent experiments.
Total proteins (50 μg) extracted from mouse hippocampus and PTGs were immunoblotted with a custom-made rabbit anti-CaSR antibody (1 μg/ml, AB1511, Millipore Corp. USA), a guinea pig anti-GABAB1R, or a rabbit anti-GAD1/2 antibody (1 μg/ml, Cat.Ab49832, Abcam), and/or corresponding horseradish peroxidase (HRP)-conjugated antibodies (2 μg/ml) using standard blotting techniques4,5. Uncrooped
Uncropped immunoblots for Figures 1d and 3c and Extended Data Figure 1 are shown in Supplementary Figures 6, 7, and 8, respectively.
Microscopic FRET measurements of G-protein activation
FRET experiments were performed as previously described45. In brief, cells grown on coverslips were maintained in HEPES buffer (137 mM NaCl, 5 mM KCl, 0.25 mM CaCl2, 1 mM MgCl2, 20 mM HEPES, 0.1% (w/v) bovine serum albumin (BSA), pH 7.4) at room temperature and placed on a Zeiss inverted microscope (Axiovert 200) equipped with an oil immersion 60X objective and a dual emission photometric system (TILL Photonics). Samples were excited with a xenon lamp from a polychrome V (TILL Photonics). FRET was monitored as a YFP/CFP emission intensity ratio upon excitation at 436 nm (filter 436 ± 10 nm and a beam splitter dichroic long-pass (DCLP) 460 nm). The emission fluorescence intensities were determined at 535 ± 15 nm (YFP) and 480 ± 20 nm (CFP) with a beam splitter DCLP of 505 nm. The FRET ratio for single experiments was corrected according to equation (1) as previously detailed45:
| (1) |
Where and represent respectively the emission intensities of YFP or Venus (recorded at 535 nm) and CFP or Cerulean (recorded at 480 nm) upon excitation at 436 nm; a and b represent correction factors for the bleed-through of CFP or cerulean into the 535 nm channel (a = 0.40) and the cross-talk due to the direct YFP or Venus excitation by light at 436 nm (b = 0.07). represents the emission intensity of YFP or Venus (recorded at 535 nm) upon direct excitation at 500 nm. To ensure that CFP- and YFP-labeled molecule expression were similar in examined cells, we performed experiments in cells displaying comparable fluorescence levels. The means of intermolecular FRET experiments were calculated according to equation (2) to normalize for different expression levels of CFP and YFP molecules:
| (2) |
To determine agonist induced changes in FRET, cells were continuously superfused with the HEPES buffer and the agonist was applied using a computer-assisted, solenoid-valve controlled rapid superfusion device (ALA-VM8, ALA Scientific Instruments; solution exchange 5 to 10 ms). Signals detected by avalanche photodiodes were digitalized using an analog to digital converter (Digidata1322A, Axon Instruments) and stored on PC computer using Clampex 9.0 (Axon Instruments). Data were analyzed using OriginPro 8.0 and plotted in GraphPad Prism 7.0.
Photobleaching experiments
FRET between CFP and YFP in cells expressing the receptor constructs was also determined by donor recovery after acceptor bleaching45. The emission intensity of CFP was first recorded at 436-nm excitation (CFPbefore), followed by direct illumination of YFP at 500 nm for 3–5 min. Subsequently, the emission intensity of CFP was recorded again (CFPafter). FRET efficiency was calculated according to equation (3).
| (3) |
Serum chemistries
Blood was drawn from mice by cardiac puncture under anesthesia by isoflurane inhalation, followed by tissue harvest. Serum samples were prepared by centrifugation and analyzed for total serum calcium by an automated ACE Alera Clinical Chemistry bioanalyzer (Alfa Wassermann, Inc, West Caldwell, NJ, USA) and serum PTH by commercial intact PTH ELISA kit (Immutopics, San Clemente, Ca, USA), following manufacturer instructions.
Quantitative real-time PCR (qPCR) analyses for gene expression
Total RNA was isolated from human adenomas and microdissected mouse PTGs devoid of thyroid and fibrous tissues by an RNA STAT60 kit (Amsbio LLC, Cambridge, MA), reverse transcribed by M-MLV reverse transcriptase into cDNA, and subjected to qPCR40 for gene expression profiles using commercial TaqMan-based sets of primers and probes (Applied Biosystems). Expression levels of genes of interest were presented as the percentage of level of the mitochondrial ribosomal protein L19.
Skeletal analyses by micro-computed tomography (μCT)
To compare bone mineral content and structural parameters, we performed micro–computed tomography (μCT) scans at two sites: distal femur for trabecular (Tb) bone and tibio-fibular junction (TFJ) for cortical (Ct) bone as described35. Briefly, femurs and tibias were isolated, fixed in 10% Neutral Buffered Formalin (PBF) for 24 hours, stored in 70% ethanol, and scanned by a SCANCO viva CT 40 scanner (SCANCO Medical AG, Basserdorf, Switzerland) with 10.5 μm voxel size and 55-kV X-ray energy. For Tb bone in the distal femoral metaphysis, 100 serial cross-sectional scans (1.05 mm) of the secondary spongiosa were obtained from the end of the growth plate extending proximally. For Ct bone, 100 serial cross-sections (1.05 mm) of the tibia were obtained from the TFJ extending proximally. A threshold of 420 mg hydroxyapatite (HA)/mm3 was applied to segment total mineralized bone matrix from soft tissue. Linear attenuation was calibrated using a μCT HA phantom. 3-D image reconstructions and analyses were performed using the manufacturer’s software to obtain the following structural parameters: Tb tissue volume (Tb.TV), Tb bone volume (Tb.BV), Tb bone fraction (Tb.BV/TV, %), Tb number (Tb.N), Tb connectivity density (Tb.CD), Tb thickness (Tb.Th), Tb spacing (Tb.Sp), Ct tissue volume (Ct.TV), and Ct bone volume (Ct.BV).
Live cell cAMP signaling
PTH-C1 cells were transiently transfected with CaSR, GABAB1R and the intramolecular cAMP FRET sensor (epac1-CFP/YFP) using lipofecatamine 3000 (Thermofischer). Cells were next plated on 25 mm glass coverslips coated with collagen and mounted in Attofluor cell chambers (Life Technologies), maintained in HEPES buffer and transferred on a Nikon Ti-E equipped with an oil immersion 40× N.A. 1.30 Plan Apo objective and a moving stage (Nikon Corporation). FRET measurement was monitored as previously describe (NCB 2017). Cells pretreated with cholera toxin (CTx) for 1 hour to elevate basal cAMP then changes in cAMP dynamics were monitored following the addition of CaSR and/or GABAB1R ligands.
Inositiol Phosphate signaling
Levels of total inositol phosphates (InsPs) including all isomers of InsP3, InsP2, and InsP1 as an index of PLC activation were determined in HEK-293 cells transiently transfected with CaSR and GABAB1R cDNA individually or in combination after incubating the cells with different [Ca2+]e (0.5–10 mM) with or without baclofen (300 μM) for 60 min as reported previously5. Prelabeling of membrane polyphosphoinositides with 3H-myoinositol was done before stimulating the cells.
Detection of GABA by mass spectrometry
(1) Sample preparation. Human PTG and mice brain tissues were homogenized individually by RIPA buffer (20 mM Tris-HCL pH 7.4, 150 mM NaCl, 1 mM EDTA, 1% Triton-X100, 1% sodium deoxycholate, 0.1% SDS) with freshly added PMSF to 1 mM and with freshly added aprotinin and leupeptin to 5 μg/ml just before use. Additionally, 50 μΜ d5-glutamic acid and 50 μΜ pyridoxal 5′-phosphate hydrate were added into the lysate to synthesize d5-GABA. Proteins were precipitated by acetonitrile with 0.5% TFA. The supernatant was dried in vacuum and resuspended in acetonitrile and water (50:50, v/v) for C18-desalting. Finally, the desalted product was dried and stored at −80°C until the LC-MS/MS analysis. (2) GABA measurement by using liquid chromatography–tandem mass spectrometry (LC-MS/MS). Calibration standards for GABA were prepared at concentrations of 5, 10, 25, 50, 100, 250, 500, 1,000, 2,500 nM in acetonitrile and water (50:50, v/v). Quality control (QC) samples were prepared independently, including low, middle, and high concentrations (10, 500, and 5,000 nM). All samples were stored at −80°C until the LC-MS/MS analysis. Liquid chromatography was achieved by an ACQUITY UPLC System (Waters) and separation was carried out using a BEH HILIC column (2.1×50 mm, 1.7 μm) at 30 °C. Acetonitrile was used as the mobile phase, and 0.3% formic acid in water was used as the aqueous phase. The flow rate was set at 0.4 mL/min, and the injection volume was 5 μL. The UPLC system was coupled to a Waters Xevo TQD mass spectrometer (Waters). The ESI mode was positive ionization with following parameters: capillary voltage, 3.05 kV; nebulizer gas (N2) flow rate, 10.8 L/min; gas temperature, 450°C. A triple quadrupole mass spectrometer in Multiple Reaction Monitoring (MRM) mode was employed to identify and quantify GABA (transition: m/z 104.02 [M+H]+→87.1, collision energy 8 V) and IS (d5-GABA, transition: m/z 110.02 [M+H]+→93.1). The Q1 mass analyzer first filters the parental ion of GABA (m/z 104.02). Only ions whose m/z value is 104.02 enter the collision cell for fragmentation. The transition of m/z 104.02 →87.05 is followed for GABA detection and quantitation in the Q3 mass analyzer. All data were analyzed using the MassLynx software package (Waters).
Statistics
Comparisons between groups were subjected to statistical analysis using 2-tails Student’s t test for two groups or one-way or two-way ANOVA followed by Sidak’s for multiple comparisons using Prism 8 (GraphPad Software, Inc., La Jolla, CA, USA). Animal, organ culture, and cultured cell sample sizes were determined by a power analysis using the following parameters: standard deviation=5–10% depending on the assay, two-sided test, p value=0.05, power of the test=0.8. Data from two groups were represented as mean ± standard error of the mean (s.e.m.). Significance was assigned for P-value < 0.05.
Extended Data
Extended Data Fig. 1: Expression of CaSR and GABAB1R in mouse and human PTGs.

(a, b) Membrane protein lysates (50 μg/lane) (a) and tissue sections (b) of PTGs from PTGGABAB1R+/+ (control) and PTGGABAB1R−/− (KO) mice were probed with anti-GABAB1R-C antibody for expression of GABAB1R as described in On-line Methods. In panel (a), a dominant ≈100 kD (unglycosylated) GABAB1R and minor ≈130 kD and ≈150 kD (presumably glycosylated) were detected in the control, but not KO, PTGs. n = 2 batches of PTGs from a total of 20 mice/genotype. (c, d) Membrane protein lysates (50 μg/lane) (c) and tissue sections (d) of PTGs from PTGCaSR+/+ (control) and PTGCaSR−/− (KO) mice were probed with anti-N-CaSR (VA609) antibody for expression of CaSR. In panel (c), a dominant ≈120 kD (unglycosylated) CaSR and ≈140 kD and ≈160 kD glycosylated (arrowheads) and larger aggregates were detected in the control, but not KO PTGs. n = 2 batches of PTGs with a total of 16 mice/genotype. Panels b and d show brown DAB staining, indicating immunoreactivity of GABAB1R and CaSR, respectively, and blue/purple hematoxylin counterstaining in mouse PTGs. (e) Membrane proteins (400 μg) extracted from human parathyroid adenomas were subjected to immunoprecipitation (Imppt) with CaSR antibodies or non-immune IgG and immunoblotted (IB) along with non-Imppt controls (input, 50 μg) with either CaSR or GABAB1R antibodies. Left panels demonstrate the ability of CaSR antibody to pull down ≈140 and 150 kD glycosylated CaSR (arrowheads) and large aggregates (*) along with ≈100 kD unglycosylated and ≈130 kD glycosylated GABAB1R (open arrow). Two right panels demonstrate the ability of GABAB1R antibody to pull down ≈100 kD unglycosylated and ≈130 kD glycosylated GABAB1R (open arrow) along with the ≈140 kD glycosylated CaSR (arrowhead) and large aggregates (*). n = 3 human PTG lysates.
Extended Data Fig. 2: Expression of GAD1/2 and GABA in mouse and/or human PTGs.

(a,b) Sections of PTGs from control (Cont) and GAD1/2-DKO mice were probed with anti-GAD1/2 antibody and FITC-conjugated secondary Ab and counterstained with blue fluorescent DAPI nuclear dye (a) or probed with anti-GABA2 antibody and HRP-conjugated secondary Ab and counterstained with hematoxylin (b) as described in On-line Methods. Inserts show digitally enlarged views of the white box areas. n = 12 PTGs from 6 mice for each genotype. (c) PTG sections from B6:Wt mice (top panels) and patients with 1° HPT (bottom panels) were probed with anti-GABA antibody (left panels) or non-immune IgG, followed by horseradish peroxidase (HRP)-conjugated secondary Ab. For panels (b) and (c), brown immunoreactivity signals were developed by immersing the sections with 3,3’-diaminobenzidine (DAB) substrate and counterstained with blue hematoxylin as described in On-line Methods. n = 8 PTGs from 4 mice and 4 human PTGs.
Extended Data Fig. 3: PTH secretion from PTGs lacking Gq and G11 or CaSR.

Secretory properties of PTGs from 8-wk-old male PTGGq−/−//G11+/+ (n = 12 pairs PTGs from 12 mice), PTGGq−/−//G11+/– (n =15 pairs PTGs from 15 mice), and PTGGq−/−//G11−/− (n =3 pairs PTGs from 3 mice) mice, which carry PTG-specific Gnaq and/or germ-line Gna11 gene KO alleles, 4-wk-old PTCCaSR−/− mice, which carry PTG-specific Casr gene KO alleles (n =5 pairs PTGs from 5 mice), and control littermates (n =7 pairs PTGs from 7 mice), which carry floxed-Gnaq and wild-type Gna11 without Cre expression, were assessed by incubating the glands with a series of media containing increasing [Ca2+] (from 0.5 to 3 mM). PTH secretory rates were normalized to the rate of basal secretion rate at 0.5 mM Ca2+ to calculate the Ca2+ set-points, indicated by vertical dashed lines. Mean ± s.e.m.
Extended Data Fig. 4: Effect of pertussis toxin on PTH secretion from PTGs.

PTGs (2 per group) from wild-type C57/B6 were sequentially incubated with increasing [Ca2+]e from 0.5 to 2.0 mM (1 hr for each concentration) in the presence of vehicle (0.1% DMSO) or baclofen (Bac, 300 μM) with or without preincubation with pertussis toxin (PTx, 100 μg/ml, 3 hrs). Mean ± s.e.m. of n pairs of PTGs from n mice as indicated. P values vs Vehicle controls were assessed by 2-way ANOVA with Sidak’s test.
Extended Data Figure 5. Signaling responses to Ca2+ and/or baclofen in parathyroid-derived PTH-C1 cells.

(a) Time-course of Gq activation. Representative FRET experiments showing stimulatory effect of Ca2+ (10 mM) which is suppressible by baclofen (300 μM) in PTH-C1 cells coexpressing the FRET-based Gq sensor (GqTurq/YFP) without (−) or with (+) coexpression of recombinant (Recom) CaSR and GABAB1R. The change in FRET (NFRET) was calculated according to equation #2 (see On-line Methods) with the initial value at t = 0 set to 1. Similar results were obtained from 2 independent experiments. (b) Averaged time courses of cAMP in PTH-C1 cells expressing CaSR without (control in blue) or with pretreatment with cholera toxin (CTx in black). Cells were continuously perfused with buffer without or with extracellular Ca2+ or forskolin (horizontal bar). Data were normalized to control with the initial value at t = 0 set to 1 and represent the mean ± SEM of n = 45 cells from 3 separate experiments
Supplementary Material
ACKNOWLEDGEMENTS
We thank Dr. Bernhard Bettler (University of Basel), Drs. Richard Palmiter (University of Washington) and Qi Wu (Baylor College of Medicine), and Maria Luisa Brandi (University of Florence) for providing the floxed-Gabbr1 mice, floxed-Gad1;Gad2 mice, and PTH-C1 cells, respectively. This work was supported by: the Department of Veterans Affairs grant IK6BX004835–01, I01BX001960 and I01BX003453 (to W.C.); the National Institute of Diabetes and Digestive and Kidney Diseases (NIDKK), the National Institute of Arthritis and Musculoskeletal and skin diseases (NIAMS), and the National Institute for General Medicine (NIGMS) of the US National Institutes of Health (NIH) under award numbers R01-DK087688, R01-DK102495, and R01-DK11142 (to J-P.V.), R01DK121656–01, R01-AR067291 and P30-AR066262 (to W.C.), R01DK122259 (to W.C. and J-P.V), R01-AR056256 (to C.L.T.), F32DK107177 (to A.H.), and the Cotswold Foundation Fellowship Award (F.G.J-A, and A.D.W.).
Footnotes
Data Availability: All materials, data, animal models, and associated protocols will be made available to all qualified investigators from the corresponding authors upon reasonable request or with a simple institutional material transfer agreement.
Competing interests The authors declare no competing interests.
REFERENCES
- 1.Hannan FM, Kallay E, Chang W, Brandi ML & Thakker RV. The calcium-sensing receptor in physiology and in calcitropic and noncalcitropic diseases. Nat Rev Endocrinol 15, 33–51 (2018). [DOI] [PMC free article] [PubMed] [Google Scholar]
- 2.Conigrave AD. & Ward DT. Calcium-sensing receptor (CaSR): pharmacological properties and signaling pathways. Best Pract Res Clin Endocrinol Metab 27, 315–331 (2013). [DOI] [PubMed] [Google Scholar]
- 3.Bandeira F, et al. Bone disease in primary hyperparathyroidism. Arq Bras Endocrinol Metabol 58, 553–561 (2014). [DOI] [PMC free article] [PubMed] [Google Scholar]
- 4.Bandeira L. & Bilezikian J. Primary Hyperparathyroidism. F1000Res 5(2016). [DOI] [PMC free article] [PubMed] [Google Scholar]
- 5.Brancaccio D. & Cozzolino M. CKD-MBD: an endless story. J Nephrol 24 Suppl 18, S42–48 (2011). [DOI] [PubMed] [Google Scholar]
- 6.Svara F. Chronic kidney disease-mineral and bone disorder (CKD-MBD): a new term for a complex approach. J Ren Care 35 Suppl 1, 3–6 (2009). [DOI] [PubMed] [Google Scholar]
- 7.Uchiyama T, et al. Hypermethylation of the CaSR and VDR genes in the parathyroid glands in chronic kidney disease rats with high-phosphate diet. Hum Cell 29, 155–161 (2016). [DOI] [PubMed] [Google Scholar]
- 8.Buchwald PC, Westin G. & Akerstrom G. Vitamin D in normal and pathological parathyroid glands: new prospects for treating hyperparathyroidism (review). Int J Mol Med 15, 701–706 (2005). [PubMed] [Google Scholar]
- 9.Valimaki S, Farnebo F, Forsberg L, Larsson C. & Farnebo LO. Heterogeneous expression of receptor mRNAs in parathyroid glands of secondary hyperparathyroidism. Kidney Int 60, 1666–1675 (2001). [DOI] [PubMed] [Google Scholar]
- 10.Latus J, et al. Analysis of alpha-klotho, fibroblast growth factor-, vitamin-D and calcium-sensing receptor in 70 patients with secondary hyperparathyroidism. Kidney Blood Press Res 37, 84–94 (2013). [DOI] [PubMed] [Google Scholar]
- 11.Manaka K, et al. Effectiveness and safety of cinacalcet for primary hyperparathyroidism: a single center experience. Endocr J 66, 683–689 (2019). [DOI] [PubMed] [Google Scholar]
- 12.Sekercioglu N, et al. Cinacalcet versus standard treatment for chronic kidney disease: a systematic review and meta-analysis. Ren Fail 38, 857–874 (2016). [DOI] [PubMed] [Google Scholar]
- 13.Hong AR, et al. A Possible Link Between Parathyroid Hormone Secretion and Local Regulation of GABA in Human Parathyroid Adenomas. J Clin Endocrinol Metab 101, 2594–2601 (2016). [DOI] [PubMed] [Google Scholar]
- 14.Varshney S, et al. Simultaneous expression analysis of vitamin D receptor, calcium-sensing receptor, cyclin D1, and PTH in symptomatic primary hyperparathyroidism in Asian Indians. European journal of endocrinology / European Federation of Endocrine Societies 169, 109–116 (2013). [DOI] [PubMed] [Google Scholar]
- 15.Latus J, et al. Involvement of alpha-klotho, fibroblast growth factor-, vitamin-D- and calcium-sensing receptor in 53 patients with primary hyperparathyroidism. Endocrine 44, 255–263 (2013). [DOI] [PubMed] [Google Scholar]
- 16.Pin JP, Kniazeff J, Prezeau L, Liu JF. & Rondard P. GPCR interaction as a possible way for allosteric control between receptors. Mol Cell Endocrinol 486, 89–95 (2019). [DOI] [PubMed] [Google Scholar]
- 17.Moller TC, Moreno-Delgado D, Pin JP. & Kniazeff J. Class C G protein-coupled receptors: reviving old couples with new partners. Biophys Rep 3, 57–63 (2017). [DOI] [PMC free article] [PubMed] [Google Scholar]
- 18.Kniazeff J, Prezeau L, Rondard P, Pin JP. & Goudet C. Dimers and beyond: The functional puzzles of class C GPCRs. Pharmacol Ther 130, 9–25 (2011). [DOI] [PubMed] [Google Scholar]
- 19.Margeta-Mitrovic M, Jan YN. & Jan LY. Function of GB1 and GB2 subunits in G protein coupling of GABA(B) receptors. Proc Natl Acad Sci U S A 98, 14649–14654 (2001). [DOI] [PMC free article] [PubMed] [Google Scholar]
- 20.Pin JP. & Bettler B. Organization and functions of mGlu and GABAB receptor complexes. Nature 540, 60–68 (2016). [DOI] [PubMed] [Google Scholar]
- 21.Zhang Z, Sun S, Quinn SJ, Brown EM. & Bai M. The extracellular calcium-sensing receptor dimerizes through multiple types of intermolecular interactions. The Journal of biological chemistry 276, 5316–5322 (2001). [DOI] [PubMed] [Google Scholar]
- 22.Chang W, et al. Complex formation with the Type B gamma-aminobutyric acid receptor affects the expression and signal transduction of the extracellular calcium-sensing receptor. Studies with HEK-293 cells and neurons. The Journal of biological chemistry 282, 25030–25040 (2007). [DOI] [PubMed] [Google Scholar]
- 23.Cheng Z, et al. Type B gamma-aminobutyric acid receptors modulate the function of the extracellular Ca2+-sensing receptor and cell differentiation in murine growth plate chondrocytes. Endocrinology 148, 4984–4992 (2007). [DOI] [PubMed] [Google Scholar]
- 24.Gama L, Wilt SG. & Breitwieser GE. Heterodimerization of calcium sensing receptors with metabotropic glutamate receptors in neurons. The Journal of biological chemistry 276, 39053–39059 (2001). [DOI] [PubMed] [Google Scholar]
- 25.Margeta-Mitrovic M, Jan YN. & Jan LY. Ligand-induced signal transduction within heterodimeric GABA(B) receptor. Proc Natl Acad Sci U S A 98, 14643–14648 (2001). [DOI] [PMC free article] [PubMed] [Google Scholar]
- 26.Libutti SK, et al. Parathyroid gland-specific deletion of the mouse Men1 gene results in parathyroid neoplasia and hypercalcemic hyperparathyroidism. Cancer Res 63, 8022–8028 (2003). [PubMed] [Google Scholar]
- 27.Ciruela F, Vilardaga JP. & Fernandez-Duenas V. Lighting up multiprotein complexes: lessons from GPCR oligomerization. Trends Biotechnol 28, 407–415 (2010). [DOI] [PMC free article] [PubMed] [Google Scholar]
- 28.Kerppola TK. Design and implementation of bimolecular fluorescence complementation (BiFC) assays for the visualization of protein interactions in living cells. Nat Protoc 1, 1278–1286 (2006). [DOI] [PMC free article] [PubMed] [Google Scholar]
- 29.Kerppola TK. Bimolecular fluorescence complementation (BiFC) analysis as a probe of protein interactions in living cells. Annu Rev Biophys 37, 465–487 (2008). [DOI] [PMC free article] [PubMed] [Google Scholar]
- 30.Wettschureck N, et al. Parathyroid-specific double knockout of Gq and G11 alpha-subunits leads to a phenotype resembling germline knockout of the extracellular Ca2+ -sensing receptor. Mol Endocrinol 21, 274–280 (2007). [DOI] [PubMed] [Google Scholar]
- 31.Nesbit MA, et al. Mutations affecting G-protein subunit alpha11 in hypercalcemia and hypocalcemia. N Engl J Med 368, 2476–2486 (2013). [DOI] [PMC free article] [PubMed] [Google Scholar]
- 32.Ferrandon S, et al. Sustained cyclic AMP production by parathyroid hormone receptor endocytosis. Nat Chem Biol 5, 734–742 (2009). [DOI] [PMC free article] [PubMed] [Google Scholar]
- 33.Nikolaev VO, Hoffmann C, Bunemann M, Lohse MJ. & Vilardaga JP. Molecular basis of partial agonism at the neurotransmitter alpha2A-adrenergic receptor and Gi-protein heterotrimer. The Journal of biological chemistry 281, 24506–24511 (2006). [DOI] [PubMed] [Google Scholar]
- 34.Fabbri S, et al. PTH-C1: a rat continuous cell line expressing the parathyroid phenotype. Endocrine 47, 90–99 (2014). [DOI] [PubMed] [Google Scholar]
- 35.Cheng Z, et al. Sex and age modify biochemical and skeletal manifestations of chronic hyperparathyroidism by altering target organ responses to Ca(2+) and PTH in mice. J Bone Miner Res (2012). [DOI] [PMC free article] [PubMed] [Google Scholar]
- 36.Geng Y, Bush M, Mosyak L, Wang F. & Fan QR. Structural mechanism of ligand activation in human GABA(B) receptor. Nature 504, 254–259 (2013). [DOI] [PMC free article] [PubMed] [Google Scholar]
- 37.Frangaj A. & Fan QR. Structural biology of GABAB receptor. Neuropharmacology 136, 68–79 (2018). [DOI] [PMC free article] [PubMed] [Google Scholar]
- 38.Geng Y, et al. Structure and functional interaction of the extracellular domain of human GABA(B) receptor GBR2. Nat Neurosci 15, 970–978 (2012). [DOI] [PMC free article] [PubMed] [Google Scholar]
- 39.Balenga N, et al. Orphan Adhesion GPCR GPR64/ADGRG2 Is Overexpressed in Parathyroid Tumors and Attenuates Calcium-Sensing Receptor-Mediated Signaling. Journal of Bone and Mineral Research 32, 654–666 (2017). [DOI] [PMC free article] [PubMed] [Google Scholar]
- 40.Chang W, Tu C, Chen TH, Bikle D. & Shoback D. The extracellular calcium-sensing receptor (CaSR) is a critical modulator of skeletal development. Sci Signal 1, ra1 (2008). [DOI] [PMC free article] [PubMed] [Google Scholar]
Methods-only References
- 41.Haller C, et al. Floxed allele for conditional inactivation of the GABAB(1) gene. Genesis 40, 125–130 (2004). [DOI] [PubMed] [Google Scholar]
- 42.Chattopadhyaya B, et al. GAD67-mediated GABA synthesis and signaling regulate inhibitory synaptic innervation in the visual cortex. Neuron 54, 889–903 (2007). [DOI] [PMC free article] [PubMed] [Google Scholar]
- 43.Heusner CL, Beutler LR, Houser CR. & Palmiter RD. Deletion of GAD67 in dopamine receptor-1 expressing cells causes specific motor deficits. Genesis 46, 357–367 (2008). [DOI] [PMC free article] [PubMed] [Google Scholar]
- 44.Soderberg O, et al. Direct observation of individual endogenous protein complexes in situ by proximity ligation. Nat Methods 3, 995–1000 (2006). [DOI] [PubMed] [Google Scholar]
- 45.Vilardaga JP. Studying ligand efficacy at G protein-coupled receptors using FRET. Methods Mol Biol 756, 133–148 (2011). [DOI] [PMC free article] [PubMed] [Google Scholar]
Associated Data
This section collects any data citations, data availability statements, or supplementary materials included in this article.