

Abstract

New ways and technologies for synthesizing adsorbent materials have been emerging based on the green chemistry concept for the sustainable use of available resources. In this sense, the chitosan-based products arise as a promising technology alternative for application of several fields that include mitigation, prevention, and control of environmental issues. Nevertheless, there is a lack of information about the development and behavior of these topologies at the industrial scale. This study addressed the techno-economic and sensitivity analyses as decision-making tools to assess promising topologies for production of chitosan-based bio-adsorbents. From the data provided by process inventory, economic analysis of these routes was implemented. The evaluation allowed obtaining a start point market price for chitosan microbeads (64.40 $/t) and chitosan microbeads modified with TiO2 nanoparticles (37 $/t). The economic analysis also showed that there is a vast potential to explore the chitosan market that enables generation of very profitable businesses from the implementation of those processes, considering the obtained economic performance indicators for both topologies. It is crucial to highlight that these indicators were slightly higher for chitosan microbead production. In addition, the sensitivity analysis indicated that the chitosan-TiO2 process could resist higher fluctuations in the operating costs, which might indicate that this topology might be a reliable alternative between evaluated cases.
1. Introduction
Nowadays, the application of green chemistry principles for the development of novel topologies has attracted much interest to mitigate environmental impacts, energy consumption, and overuse of nonrenewable resources.1 So, the use of chitosan, obtained through environmentally friendly transformation processes, represents a promising alternative for accomplishing sustainable objectives.2 One of those ways to sustainably produce chitosan is through chitin extraction from shrimp exoskeleton and further deacetylation process.3 In this sense, there is a vast potential to integrate pathways for production of chitin, astaxanthin, and chitosan into the productive aquaculture chain, counting the rates of generation shell wastes from the industrial or semi-industrial activities of this sector.4 The implementation of such mechanisms could lead to mitigation of the effects of insufficient final disposal of produced residues; henceforth, the option of treating this type of biomass for generating valuable products arises as a promising way to overcome the previously mentioned issues.5 Chitosan is an eco-friendly product, considering its biodegradability, antibacterial, and harmless properties, with the potential to be used as a final-use product and also as a primary feedstock for the production of bio-adsorbents with applications in a wide range of fields.6 Previous studies have demonstrated the use of chitosan-based materials for several purposes. Zhou et al.7 studied the effectiveness of employing a chitosan adsorbent modified with thiourea for adsorbing platinum (IV) and palladium (II) both dissolved in aqueous solution. Zahedi et al.8 evaluated the catalytic effects of chitosan nanoparticles for the synthesis of dihydropyrroles. Liu et al.9 studied the capacity of a dextran-chitosan resin adsorbent to remove heavy metal ions from aquatic systems.
The previously described contributions indicate that there is an enthusiasm for generating research and new entrepreneurship from the use of chitosan materials. Therefore, the ongoing development of this alternative has to consider the behavior of large-scale production and its expected performance under technical aspects. It is imperative to study the marketable features of chitosan and bio-adsorbents produced from renewable sources (such as shrimp shell wastes) under sustainability criteria. Furthermore, exploring reported investigations about chemical processes and bioprocesses, this study found that the examination of economic potentials and profitability could provide useful information for decision-making about the feasibility of its scaling up. One of the most crucial aspects in the design of chemical processes is economic performance. Many researchers and designers have used a variety of indicators, indexes, methodical procedures, among others, for measuring the overall economic performance of a chemical plant. Such parameters comprise the return-on-investment (ROI) metric, payback period (PBP), gross profit (GP), net present value (NPV), among others.10 Many authors have proposed and developed several methods and indicators to determine the economic performance of emerging or existing chemical processes. Jaramillo et al.11 evaluated an oil extraction from Chlorella vulgaris using a techno-economic assessment (and environmental analysis) method. Four routes for producing methanol from shale gas were simulated and analyzed through economic and environmental assessments. Hernández et al.12 applied the techno-economic (and environmental) assessment of an olive stone-based biorefinery. Do et al.13 evaluated the use of palm dry fruits for producing bio-oil using techno-economic analysis. A relevant feature of the techno-economic analysis is the possibility to use this methodology as a decision-making tool in process design. Likewise, Carvajal et al.14 compared different lignin extraction processes through techno-economic assessment. Panjapakkul and El-Halwagi15 assessed process alternatives for producing isopropanol based on the techno-economic analysis. Jasper and El-Halwagi16 compared two methanol-propylene processes under techno-economic analysis. Pérez-Uresti et al.17 examined benzene synthesis (from shale gas) under techno-economic assessment. Morales-Carvajal et al.18 implemented the techno-economic analysis to study aspects of the feasibility of an astaxanthin production system from Haematococcus pluvialis in northern Colombia.
Other studies have reported techno-economic evaluation along with the implementation of economic sensitivity analysis for counting the effects of changes in the operating cost, selling price of raw material, among others. In this sense, Perez et al.19 introduced the techno-economic sensitivity analysis for the development of biorefinery design of palm-based topologies. This approach allows estimating the response of the economic performance indicators in the operating costs of the plant. Also, other studies have used this approach to evaluate agroindustry production chains.20 Herrera-Rodriguez et al.21 assessed agar production from red algae under the techno-economic sensitivity analysis. Cogollo-Herrera et al. applied the sensitivity analysis under economic indicators to assess the production process of chitosan from shrimp exoskeleton.24 It is worth mentioning that the advantage of using techno-economic sensitivity analysis is enabling determination of the capacity of a process to hold variation in its economic environment. Therefore, the implementation of a methodology that combines the features of the traditional evaluation of chemical processes (using NPV, PBP, among others) and the advantages of the information provided by the techno-economic sensitivity analysis might generate comprehensive insights into the process’s performance. Obtaining data for industrial-scale behavior of emerging technologies is not a straightforward task, so the application of these economic assessment methods might be a strategic option for the development of these types of topologies from a laboratory-scale protocol to a large-scale operation.
So, this work is addressing a computer-aided techno-economic sensitivity evaluation of two topologies for the sustainable use of chitosan for production of chitosan microbeads (CM) and chitosan microbeads modified with TiO2 nanoparticles (CMTiO2). Data provided by the previous modeling and simulation of these topologies were used. These evaluation tools generate information concerning process profitability, economic behavior, resilience, among others, and relevant insights. Otherwise, studies addressing a combination of both techno-economic and sensitivity analyses under CAPE applied to biotechnological large-scale production processes are largely absent. In this sense, Table 1 reports related relevant contributions to the evaluation of techno-economic and safety aspects of physical–chemical processes.
Table 1. Related Studies about Techno-economic Analysis Applied to Physical–Chemical Processes11,15−17,21−24.

Table 1 indicates that recent contributions have had the interest to study process economics of emerging technologies, but some of these have not considered comprehensive aspects combining technical, economic, and uncertainty aspects as developed by this work. Also, this study presents the economic evaluation of novel topologies for production of chitosan-based bio-adsorbents, suggesting market values that are already unknown for these materials. The novelty also relies on the consideration of uncertainties for decision-making associated with financial parameters on the economic performance indicators. Therefore, the selection of the most profitable alternative not only comes from the obtained economic potentials but also includes the response of the assessed processes to hold variations examined in the proposed sensitivity analysis.
2. Results
This section presents the techno-economic sensitivity analysis of the CM and CMTiO2 processes. The first step was the estimation of equipment and utility costs through the Aspen Economic Analyzer. The economic calculations needed data reported in process design books and estimation using Excel worksheets. The total equipment cost for the CM process is 874,600 $, while the utility cost based on production capacity was 150.00 $/t of raw materials. These values for the CMTiO2 process correspond to 4,312,064 $ and 520 $/t of raw materials, respectively. It is worth highlighting that the basis for the calculation of feedstock cost and economic evaluation for both processes involved the consideration of the same processing capacity of 680 t/year of raw chitosan (as a primary raw material). In the case of the CMTiO2 process, it was considered that lemongrass is available given its vast availability in the Colombian geography.
Table 2 shows the assumptions for the large-scale production of chitosan microbeads and chitosan microbeads modified with TiO2 nanoparticles. Table 3 shows the total capital investment (TCI) for the evaluated topologies, while Table 4 shows the direct operating costs, fixed charges, and general costs. Both operating and fixed costs were calculated under Colombian economic conditions.19 The used tax rate relates the full corporative tax rate that for Colombia, it corresponds to 39%, while the interest rate is 9%.25 The corporate tax rate counts the fixed rate (33%) and other concepts linked with particular aspects of the Colombian tax regulations. The application of the associated rates in the valid corporate tax can vary and is not straightforward to establish which of these apply before construction and operation stages. Thus, this study fixed the full corporative rate (39%), considering the obligatory rates and associated expenses based on regulations, trading off the discounts in the taxes implemented by the government for deduction of industry taxation.26 The economic analysis encompassed an initial evaluation of the break-even point for the selling price of chitosan microbeads and chitosan microbeads modified with TiO2, considering that these materials are novel products. Therefore, there is a lack of reported reference market prices for these substances. In the case of the CM process, the raw material comprises chitosan (as primary feedstock), acetic acid, and sodium hydroxide. In contrast, the CMTiO2 process counted chitosan, titanium tetra-isopropoxide (TTIP), acetic acid, and sodium hydroxide as primary reagents.
Table 2. Main Assumptions for Economic Analysis of the CM and CMTiO2 Processes.
| parameter | CM process | CMTiO2 process |
|---|---|---|
| process capacity (t/year) | 680.00 | 2242 |
| mass flow of raw material (t/year) | 17,768.41 | 22,372 |
| raw material cost ($/t) | 1920 | 1633 |
| product selling price ($/t) | 64,400 | 37,000 |
| plantlife (year) | 15 | 15 |
| salvage value | 10% depreciable | 10% depreciable |
| construction period (year) | 3 | 3 |
| location | north of Colombia | north of Colombia |
| tax rate | 39% | 39% |
| type of process | novel | novel |
| contingency percentage | 20% | 20% |
| utilities | steam, water, gas, electricity | steam, water, gas, electricity |
| process fluids | solid–liquid–gas | solid–liquid–gas |
| depreciation | lineal | lineal |
Table 3. Capital Investment Costs of Evaluated Topologies for Chitosan-Based Bio-adsorbents.
| capital investment cost | CM process ($) | CMTiO2 process ($) |
|---|---|---|
| equipment cost | 874,600.24 | 4,312,064.16 |
| purchased equipment (installation) | 174,920.05 | 862,412.83 |
| instrumentation | 69,968.02 | 344,965.13 |
| piping | 174,920.05 | 862,412.83 |
| electrics | 113,698.03 | 560,568.34 |
| buildings | 349,840.10 | 1,724,825.66 |
| utility installations | 262,380.07 | 1,293,619.25 |
| DFCI total | 2,020,326.56 | 9,960,868.20 |
| land | 87,460.02 | 431,206.42 |
| land Improvements | 349,840.10 | 1,724,825.66 |
| engineering | 279,872.08 | 1,379,860.53 |
| equipment (I + D) | 87,460.02 | 431,206.42 |
| construction expenses | 297,364.08 | 1,466,101.81 |
| legal expenses | 8746.00 | 43,120.64 |
| contractor fees | 141,422.86 | 697,260.77 |
| contingency | 262,380.07 | 1,293,619.25 |
| IFCI total | 1,514,545.24 | 7,467,201.50 |
| fixed capital investment | 3,534,871.80 | 17,428,069.70 |
| working capital | 2,120,923.08 | 10,456,841.82 |
| start-up | 353,487.18 | 1,742,806.97 |
| total capital investment | 6,009,282.06 | 29,627,718.49 |
Table 4. Operating Costs of Evaluated Topologies for Chitosan-Based Bio-adsorbents.
| operating costs | CM process ($) | CMTiO2 process ($) |
|---|---|---|
| raw material | 26,719,198.85 | 36,646,301.70 |
| utilities | 2,665,261.50 | 11,668,082.40 |
| maintenance and repairs | 176,743.59 | 871,403.48 |
| operating suppliers | 26,511.54 | 130,710.52 |
| operating labor (OL) | 117,000.00 | 117,000.00 |
| direct supervision and office job | 17,550.00 | 17,550.00 |
| laboratory charges | 11,700.00 | 11,700.00 |
| patents and royalties | 35,348.72 | 174,280.70 |
| direct production cost (DPC) | 29,769,314.20 | 49,637,028.80 |
| depreciation (D) | 229,827.45 | 1,133,124.22 |
| local taxes | 106,046.15 | 522,842.09 |
| insurance | 35,348.72 | 174,280.70 |
| interest rate | 60,092.82 | 296,277.18 |
| fixed charges (FCH) | 431,315.14 | 2,126,524.19 |
| plant overhead (POH) | 70,200.00 | 70,200.00 |
| total manufacturing cost (TMC) | 30,270,829.34 | 51,833,753.00 |
| general expenses (GE) | 7,567,707.34 | 12,958,438.25 |
| total production cost (TPC) | 37,838,536.68 | 64,792,191.25 |
This study examined the break-even point, finding the selling price in which the profits after taxes (PAT) are equal to zero. The above data enable determination of profitable and marketable selling prices for both nonmodified and modified chitosan microbeads. So, it involved construction graphics comparing different values of the selling price and the PAT for each evaluated topology. This evaluation allowed this study to propose an initial market price for the bio-adsorbents that are attractive from a distribution market point of view in the related chemical industry and also offer promising economic results for the implementation of this technology through new entrepreneurship. Figure 1 displays the behavior of the profits after taxes by changes in the chitosan microbead selling price for determining the break-even point. This assessment showed that the break-even point of this process is 58.80 $/kg of chitosan microbeads.
Figure 1.

Break-even analysis of selling price by changes in PAT for the CM process.
From the analysis of Figure 1, this study fixed a start-point selling price for the product to be 15% higher than the current break-even price. Thus, the offering selling price corresponds to 64.40 $/kg. From this point, it was possible to proceed with the sensitivity analysis to contemplate uncertainties associated with different financial and technical aspects concerning the CM process.
As developed by the CM process, this study found the break-even price of chitosan microbeads modified with TiO2, proposing a suitable market price for the modified microbeads, taking into account the competitiveness of the market (for application of adsorbents) and the profitability of this process. Figure 2 shows how the behavior of the PAT changes with the CMTiO2 selling price. In this case, the break-even point was 29.60 $/kg of CMTiO2. This study fixed a start-point selling price for the product to be 25% higher than the current break-even price based on Figure 2. Thus, this condition corresponded with a price of 37.00 $/kg of product. The estimation of the CMTiO2 selling price enabled implementation of the sensitivity analysis and the evaluation of associated uncertainties. The estimation of the operating, fixed, and total annualized costs enabled calculation of the economic performance indicators, as reported in Table 5.
Figure 2.

Break-even analysis of selling price for the CMTiO2 process.
Table 5. Economic Indicators for Evaluated Topologies for Chitosan-Based Bio-adsorbents.
| indicator | CM process | CMTiO2 process |
|---|---|---|
| economic potential [$/year] 1 | 17,072,801 | 45,546,363 |
| economic potential [$/year] 2 | 14,407,540 | 33,878,281 |
| economic potential [$/year] 3 | 5,953,463 | 17,400,473 |
| cumulative cash flow (1/year) | 0.99 | 0.59 |
| discounted payback period (year) | 8.02 | 7.36 |
| %ROI | 58.27% | 33.67% |
| NPV (MM$) | 35.97 | 135.16 |
| annual revenue | 4.38 | 16.47 |
The results summarized in Table 5 indicate that the CM process is profitable with a competitive NPV of 35.97 MM$ and annual revenue of 4.38 MM$, along with a discounted payback period (DPBP) of 8.02 years. In addition, the obtained %ROI is quite attractive, showing 58.27%, indicating that this process design might be an excellent option for business development. On the other hand, the CMTiO2 process seems to be also an attractive alternative, considering its competitive NPV (135.16 MM$) and annual revenue (16.47 MM$). Also, this design showed a DPBP of 7.36 years and %ROI of 33.67%. These results may indicate that the CMTiO2 can also be a promising option for investment in new businesses and entrepreneurship based on the green chemistry principles and the sustainable use of a renewable material using nanotechnology applications.
The techno-economic sensitivity analysis encompasses a comprehensive assessment of the break-even point, on-stream efficiency, cost of raw materials, profit after taxes, and %ROI. Figure 3 shows the relationship between the annualized operating cost (AOC) and annual sales by changes in the production capacity of the processes. The break-even point was found at an approximate capacity of 3000 t/year of raw materials, which in proportion represents 115.60 t/year of crude chitosan. Thus, the CM process remains feasible, even for a decrease of 80% of the current processing capacity. This fact indicates that this design can hold unexpected changes in the availability of feedstock, mainly chitosan, which is the critical reagent in this process. The analysis for the CMTiO2 process showed that the break-even point is located at a processing capacity of 7480 t/year, which corresponds to 250 t/year of raw chitosan. This value represents 34% of the design capacity, indicating that the CMTiO2 process has a wide margin to operate above the break-even point.
Figure 3.

Analysis of the break-even point for the CM and CMTiO2 processes.
Figure 4 shows the effect of product selling price variations on the on-stream efficiency of both topologies. It is easy to realize that when the product selling price ranges between 56,000 and 62,500 $/t, the efficiency at the break-even point is very sensible by changes in the process sales. The fixed market price of chitosan microbeads is 64,400 $/t; therefore, the process has efficiency in the flow of 10%. The range between 65,000 and 80,000 $/t is highly feasible because it belongs to the reliable zone, according to Figure 3. In the case of the CMTiO2 process, the high-sensible zone locates between 29,600 and 33,000 $/t. This process had efficiency in the flow of 16%, considering the fixed selling price of the product. When the price of CMTiO2 is beyond 40,000 $/t, the process becomes even more feasible and economically safer as long as that range comprises the reliable zone according to Figure 4.
Figure 4.

Effect of the price of the bio-adsorbents on the on-stream efficiency at the equilibrium point.
CM process.
Figure 5 displays the sensitivity of profit after taxes by changes in raw material cost. The CM process presented a high sensitivity to this parameter, with a critical point of 1900 $/t. This value corresponds to a purchase price for crude chitosan of 44,200 $/t. Consequently, this process can hold increases by up to 26% and remains profitable. At that price, the process will become noneconomic. This finding might show that the profits for this project are highly sensible with respect to the cost of the main raw material. Furthermore, the CMTiO2 process had a high sensitivity to the feedstock price, with a critical purchase cost of 2177 $/t. This value corresponds to a cost for raw chitosan of approximately 47,200 $/t. Additionally, this design can resist rises in the feedstock cost up to 33% and still gives profits. The CMTiO2 process would be giving economic losses for higher costs.
Figure 5.

Effect of the cost of raw materials on the profit after taxes for CM and CMTiO2 processes.
Figure 6 shows the effect of the operating costs on %ROI. The return on investment for the CM process presented a strong dependence on the normalized variable operating cost (NVOC), which can modify its performance over an extensive range. For 100% of production capacity, the economic analysis showed an NVOC of approximately 2105.10 $/t, which represents in terms of crude chitosan a normalized operating cost of 49,000 $/t. Under that condition, the CM process obtained an ROI of 58.30%. Otherwise, the critical NVOC in which the ROI became null is 2424.53 $/t, corresponding to the 56,435 $/t crude chitosan basis. In this case, the critical point is moderately close to the current operational point (100% of capacity), which might indicate that this design can be susceptible to severe decreases in its investment return. In the case of CMTiO2 topology, the ROI% had a moderate dependence on the variable operating costs. For 100% of the production capacity of this process, the NVOC was 2793 $/t. Under the design operating conditions, the CMTiO2 process posted an ROI of 33.67%. The critical NVOC (ROI = 0%) corresponded to 3515 $/t, indicating that this design can hold increases of 26% of the current normalized operating cost. A positive finding is that the critical NVOC is far enough from the actual process configuration. This fact might indicate the effectivity of this design to hold rises in the operating cost, with this being a promising positive finding from the economic viewpoint.
Figure 6.
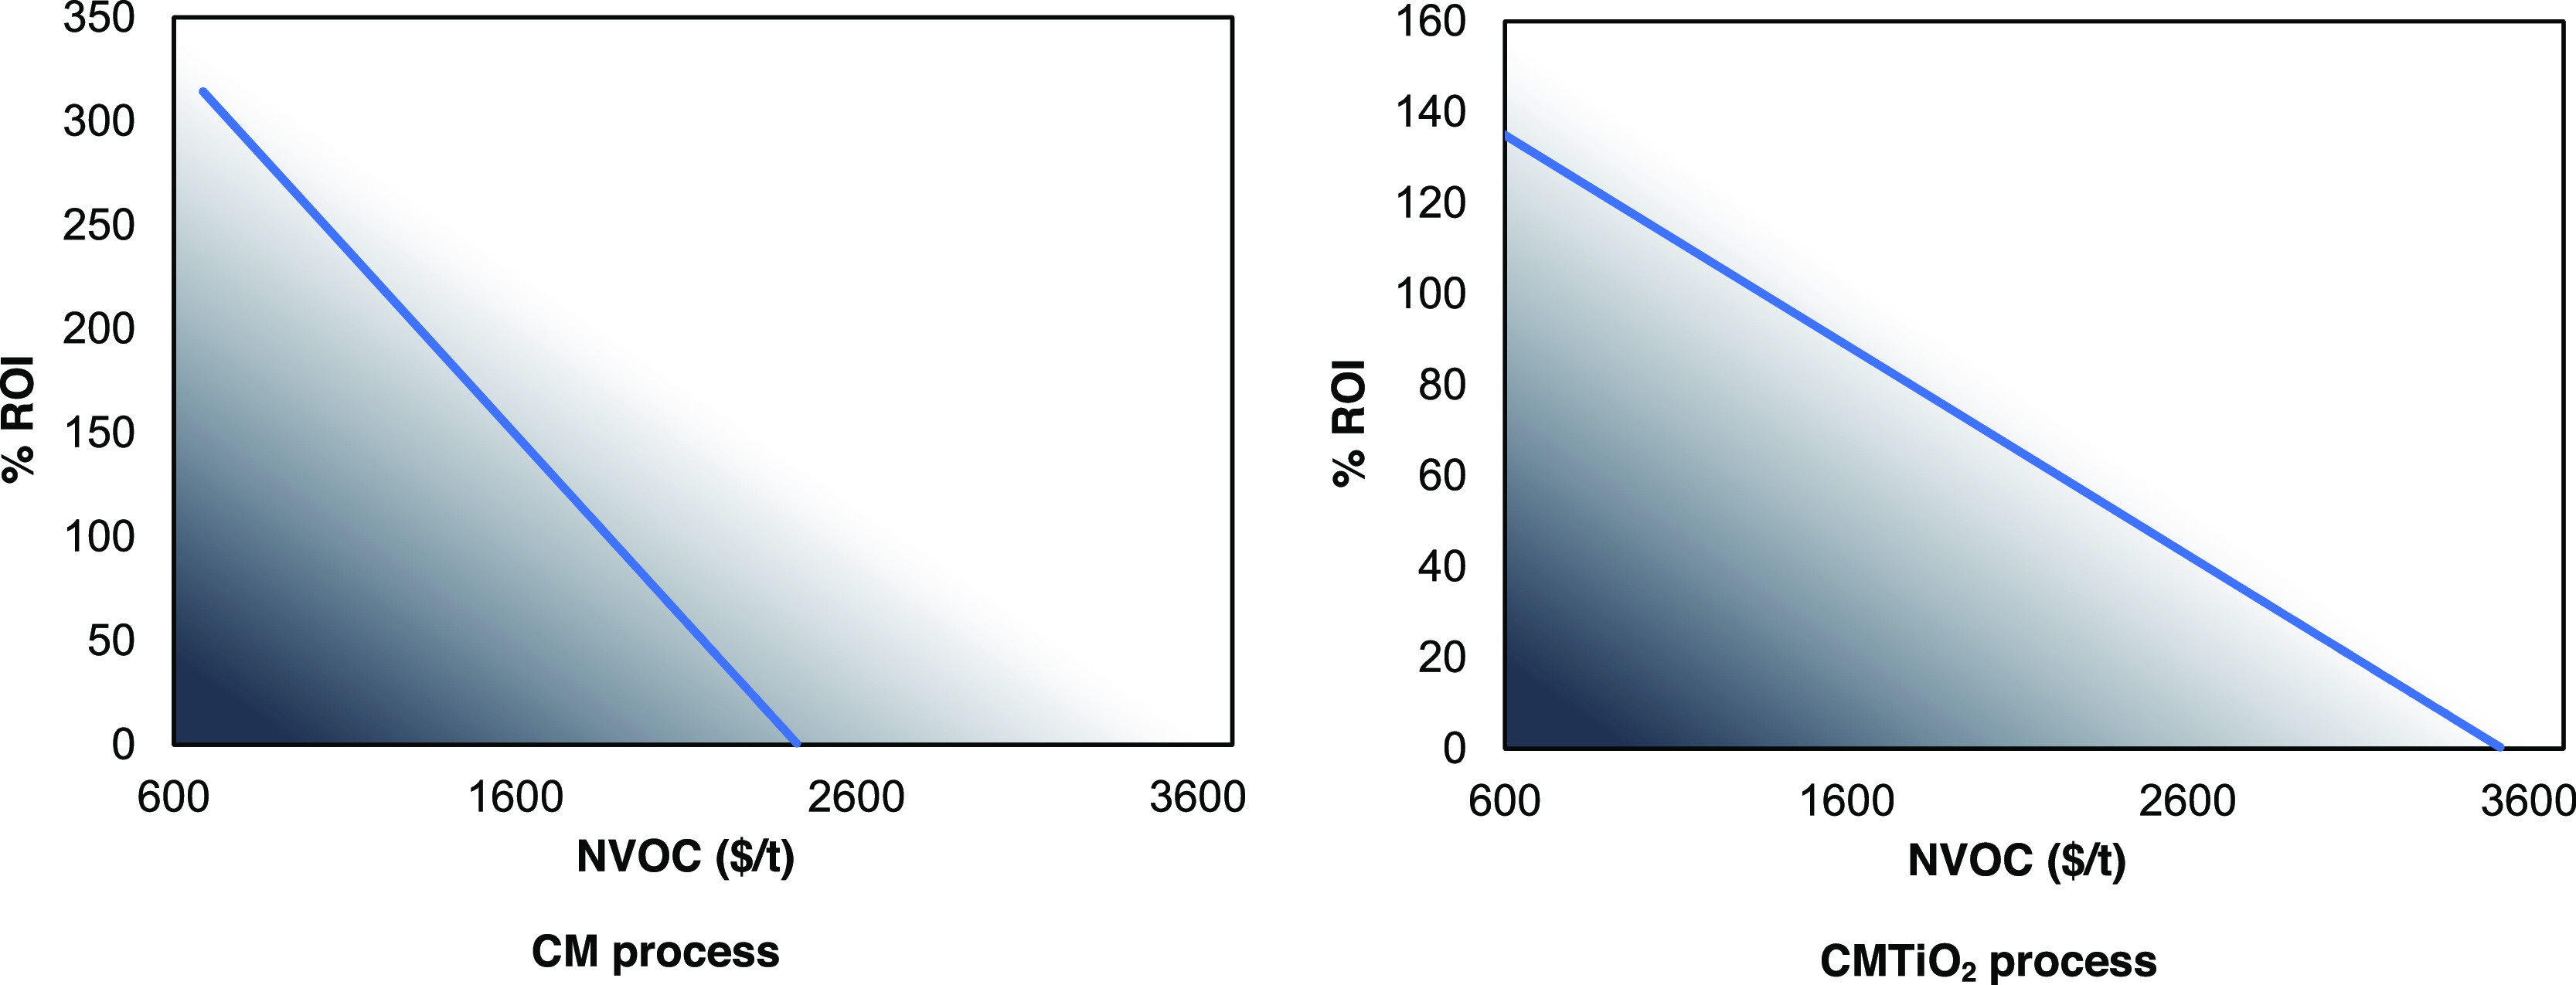
Effect of operating costs on %ROI for CM and CMTiO2 processes.
3. Discussion
The results of %ROI sensitivity revealed that even though this process presented competitive economic performance (at the 100% capacity), it rapidly can become noneconomical, as demonstrated in Figure 6. A good reason to explain this behavior might come from the current chitosan cost, which can quickly increase the operating cost of the plant. The CM process at the current capacity can trade off its production costs and economic indicators, taking into account the moderately low equipment cost and, consequently, small TCI, compared with the operating cost. If the market for chitosan can remain stable over time, then this design will generate very high profits. Another option for keeping the process profitable is to join the chitosan production process (previously described), taking shrimp exoskeleton as feedstock instead of directly buying processed chitosan. Comparing the results of the sensitivity analysis of the CM and CMTiO2 processes, first examination of the economic indicators would reflect that the first bio-adsorbent design is a slightly better economic option than the second one. Nevertheless, examining sensibility results in detail, it is palpable that although the values for %ROI is higher for the CM process, the CMTiO2 alternative presents greater resilience to changes in the operating costs, can hold higher rises in the price of raw chitosan, and also presents higher NPV and lower DPBP, meaning that it is in a better economic behavior under uncertainties. Another fact that supports this finding is the more competitive market price of the CMTiO2 (37.00 $/kg) compared with the price of the microbeads without modification (64.40 $/kg).
4. Conclusions
This work presented comprehensive computer-aided techno-economic and sensitivity analyses of production processes for sustainably using raw chitosan and TTIP to produce chitosan-based adsorbents modified with nanoparticles. The gained outcomes provided new knowledge and insights concerning industrial-scale production of chitosan microbeads and chitosan microbeads modified with TiO2. The evaluation of the bio-adsorbent topologies included a sensitivity analysis to offer a profitable selling price, taking into account the novelty of these materials in chemical and material markets. These values corresponded to 64.40 $/kg of CM and 37.00 $/kg of CMTiO2. Furthermore, this work implemented a sensitivity analysis to study economic uncertainties and check how fluctuations in the operating costs can affect the economic performance of the plants. Despite the fact that the CM process showed better %ROI and DPBP, the techno-economic sensitivity analysis demonstrated that the CMTiO2 process could resist higher increases in the NVOC and still be a profitable alternative. It is worth mentioning that the significant difference in the selling price for the bio-adsorbents was an unexpected result as long as the price of CM is the double of the nanoparticle-based adsorbent. A suitable clarification for this finding is that the CM process uses a costly raw material (crude chitosan) even having a high process yield, so to compensate that cost, the analysis valorized the product at a higher price. In the case of CMTiO2, its production involved the transformation of raw chitosan along with other feedstocks such as titanium tetra-isopropoxide for producing TiO2, which compensates the total weighted raw material purchased cost of that process. Also, for the same amount of chitosan (principal raw material for both processes), the nanoparticle-based topology produces almost three times the equivalent mass flow of chitosan microbeads formed in the other process. Directions for further studies might involve the evaluation of business development aspects along with the examination of marketing issues of the products for breaking the adsorbent materials market. In addition, the addition of logistics features might also be interesting to enhance the economic perspective discussed in this work.
5. Methods
Figure 7 shows the step-wise method followed in this work. This study proposes an approach for assessing emerging and existing chemical processes to diagnose and select suitable design alternatives from the evaluation of techno-economic parameters combining the traditional economic evaluation method and techno-economic sensitivity analysis proposed by Romero-Perez et al.19 The first step involved the knowledge of the selected renewable resources, products, and available processes to accomplish the defined task, which is the production of the targeted value-added substances. Subsequently, the methodology required gathering data about the interconnected units for producing the defined products. This goal involves assembling data of preliminary mass and energy balances, production yields, and block diagram flowsheet. In this regard, the authors have previously published the results for the simulation of large-scale production of chitosan microbeads27 and chitosan microbeads modified with TiO2 nanoparticles.28 So, this study took the generated data to apply the proposed methodology under techno-economic and sensitivity analyses.
Figure 7.

Step-wise method proposed for assessing chemical processes under techno-economic and sensitivity analyses.
The second step involves the computer-aided evaluation of process alternatives under techno-economic sensitivity analysis. The extended mass and energy balances provided by process inventory, along with the information about production yields and processing units, were used to perform the method.29 Several plots and quantitative data show the resulting performance from the application of this analysis, allowing the identification and diagnosis about operating and fixed costs, market, and financial data, project evaluation indicators, economic resilience of the plant by cost fluctuations, uncertainties, and further insights to seek improvement opportunities from technical and economic viewpoints. Also, the implementation of the proposed sensitivity analysis allows evaluating the response of the processes by variations of different economic parameters, including uncertainties associated with the raw material prices and availability, changes in the operating costs, efficiency at the equilibrium point, among others.
5.1. Description of the Chitosan Microbead Production Process
The chitosan microbeads are prepared based on subsequential stages comprised of the following units: (i) raw chitosan preparation, (ii) microbead precipitation, (iii) washing, and (iv) drying operations. The development of this process at a large scale used scaling up from the experimental procedure or laboratory protocol. Figure 8 shows the overall block diagram of the chitosan production process. This topology considered a processing capacity of 680.00 t/year of raw chitosan, which is the primary feedstock. As mentioned before, the process started with raw material preparation, involving an aqueous solution of 2% (w/v) chitosan with 4% (w/v) acetic acid. These substances are put under an agitation system to form the chitosan gelling dissolution, guaranteeing the uniformity of the mixture.30 The mainstream continues to the microbead precipitation stage, in which through a coagulation process, the system forms the wet chitosan microbeads. This procedure demands the addition of a coagulant agent (NaOH).31 As it is desirable to obtain a dehydrated product, the process continues to further stages for accomplishing that condition.
Figure 8.

General block diagram of the CM process.
It is worth to mention that the formation of the microbeads is mainly a physical process, in which a secondary reaction between the solvent and coagulation agent forms an organic salt (CH3COONa). The mainstream goes to the washing stage for the removal of nondesired substances and residual reagents. The process added a dryer for removal of water content in the material, ending the processing through a cooling stage to get the product under environment standard conditions, as long as during the last operation, the dryer increased the microbead temperature. Process simulation of this topology provides the needed data, which include mass and energy balances, operating settings, among others, to perform the techno-economic and sensitivity analyses.32 In summary, the described production topology employed 680.00 t/year of crude chitosan, 2175.73 t/year of acetic acid, and 14,913.00 t/year of sodium hydroxide, representing a total feedstock flow of 17,768.41 t/year to produce 679.92 t/year of chitosan microbeads.
5.2. Description of the Production Process of Chitosan Microbeads Modified with TiO2
The chitosan microbeads modified with TiO2 are synthesized as developed for the nonmodified process; however, this topology not only contemplated the formation of the adsorbent and further addition of nanoparticles but also considered the formation of TiO2 based on a green synthesis procedure. Therefore, this topology takes titanium tetra-isopropoxide (TTIP) as a primary reagent for nanoparticle formation via hydrolysis. More details of that synthesis are reported by Meramo-Hurtado et al.33 From a holistic viewpoint, the process mainly involves two subprocesses: (i) TiO2 nanoparticle formation and (ii) chitosan microbead formation (same steps for the previously described synthesis) and modification. All these subprocesses involved several stages and unit operations like mixing, drying, heat exchanging, separation processes, among others. Figure 9 depicts the block diagram of the CMTiO2 process. As developed for the CM process, in this case, this study sets a processing capacity of 676.29 t/year of raw chitosan (same basis), along with the transformation of 29,621 t/year of lemongrass (used in the TiO2 synthesis), and 1491.12 t/year of TTIP, along with 1554.72 t/year of acetic acid and 18,646.90 t/year of sodium hydroxide, for a total feedstock flow of 51,993.03 or 22,372.03 t/year (without including lemongrass).
Figure 9.

General block diagram of the CMTiO2 process.
As explained, the first stage is the synthesis of TiO2 nanoparticles using TTIP hydrolysis and lemongrass oil extraction. The oil extract is mainly composed of water, myrcene, undecyne, neral, among other organic compounds.34 This subprocess uses this substance to guarantee the nanosize of TiO2 particles, considering its surfactant properties. Once the oil is available, the mainstream continues to the hydrolysis reactor, in which TTIP reacts with water to form TiO2.35 In addition, this mechanism forms propanol as a nondesired by-product. The system generates highly wet nanoparticles, so the process employs successive separation operations in a purification train to obtain this intermediate with the lowest possible moisture content at the highest concentration. This stage included three washing units, for neutralizing the pH concentration, using ethanol (70%, v/v) and water entering streams. An ending separation unit decreases the water content of chitosan-modified materials up to 0% dry basis.
As mentioned earlier, the second processing stage is the formation and modification of chitosan microbeads with TiO2 nanoparticles. This unit started following the separation train of the second stage. It uses crude chitosan to prepare the chitosan microbeads. The first part of this subprocess is quite similar to the synthesis of the nonmodified chitosan process but incorporated an additional blending unit to mix the synthesized TiO2 nanoparticles with the gelling chitosan dissolution. This operation is developed, keeping a mixture proportion of 1:2 for chitosan to TiO2. The main product formation entails setting alkaline media conditions; consequently, NaOH is used (as done for the chitosan microbead process) to reach the needed concentration.2 This operation employs an ultrasound-assisted agitation system that physically mixes the formed microbeads. As the medium employs large amounts of water, the system obtained the produced material with a high moisture concentration. The process included a final separation stage (third stage) composed of washing and drying units to extract the bio-adsorbents wholly dried. Finally, this topology produces chitosan microbeads modified with TiO2 with a mass flow of 2242 t/year.
5.3. Techno-economic Analysis
The techno-economic sensitivity assessment developed in this study considers a plantlife of 15 periods. This method took some equations from the economic analysis model proposed by El-Halwagi.10 This analysis used data provided by the literature, chemical engineering magazines, vendors, and suppliers (like Alibaba or Matche) to determine and estimating equipment costs, installation cost, piping, raw material/reagents costs, among others. The analysis also takes into account regional conditions for Colombia and Latin America concerning utility cost estimation.19 Besides, many engineers around the globe commonly use the Marshall and Swift (M&S) Equipment Cost Index in Chemical Engineering Magazine to determine the actualized equipment and plant costs. The total capital investment is estimated, considering the fixed capital investment, working capital investment (WCI), and start-up costs (SUC). Otherwise, the total operating cost (TOC) counts several aspects, including the direct production cost (DPC), fixed charges (FCH), overhead (POH), and general expenses (GE).36 Therefore, the calculation of annualized fixed cost (AFC) and annualized operating cost (AOC) involves fixed capital investment and calculated operating costs as shown in eqs 1–3.
| 1 |
| 2 |
| 3 |
FCIO is
the initial value of depreciable fixed cost, FCIS is the
savage value for the depreciable fixed cost, N is
the plantlife period, and TAC is the total annualized cost. Equation 4 shows the estimation
of the break-even point (mRM – BEP), which allows identifying when the production costs are equal to
benefits for sales. Otherwise, on-stream efficiency ( ) trades
off raw material and production
costs, considering ranges based on the maximum production capacity
(see eq 5). Equations 6–9 give other economic performance parameters. Also, this analysis
considers the evaluation of variables like accumulated cash flow (CCF),
payback period (PBP), return of investment, and net present value.37 It is worth pointing out that this methodology
considered the evaluation of the discounted payback period (DPBP)
as long as the traditional PBP does not takes into account the change
in the value of money over plantlife.38
) trades
off raw material and production
costs, considering ranges based on the maximum production capacity
(see eq 5). Equations 6–9 give other economic performance parameters. Also, this analysis
considers the evaluation of variables like accumulated cash flow (CCF),
payback period (PBP), return of investment, and net present value.37 It is worth pointing out that this methodology
considered the evaluation of the discounted payback period (DPBP)
as long as the traditional PBP does not takes into account the change
in the value of money over plantlife.38
| 4 |
| 5 |
| 6 |
| 7 |
| 8 |
| 9 |
NVOC is the normalized variable operating cost,  is the selling price of product i, mi is the mass flow of product i, PAT is the profit after taxes, int is the interest rate,
AFC is the annualized fixed cost, FCH is the fixed costs, AOC is the
annualized operational costs, TCI is the total capital investment,
and FCI is the fixed capital investment.39
is the selling price of product i, mi is the mass flow of product i, PAT is the profit after taxes, int is the interest rate,
AFC is the annualized fixed cost, FCH is the fixed costs, AOC is the
annualized operational costs, TCI is the total capital investment,
and FCI is the fixed capital investment.39
5.4. Sensitivity Analysis
This procedure encompasses the evaluation of uncertainty associated with economic parameters, including the evaluation of the effect on the break-even point based on the production capacity. This sensitivity allows determining the point in which the plant starts to generate profits. The sensitivity assessment also analyzes the effect on the on-stream efficiency by changes in the product selling price based on a range of different prices for products, taking values above and below the current price. The third sensitivity assesses the variation of feedstock purchase costs on the profit after taxes. The above provides information about the resilience of the plant under rises of raw material costs. The techno-economic assessment also counts the effects of the normalized operating costs on the return on investment. It enables determining when the plant has 0% ROI (or below) by a change in the operating costs.
Acknowledgments
The authors want to thank the Universidad de Cartagena and the Fundacion Universitaria Colombo Internacional for their support in the development of this research.
The authors declare no competing financial interest.
References
- Ruiz-Mercado G. J.; Carvalho A.; Cabezas H. Using Green Chemistry and Engineering Principles to Design, Assess, and Retrofit Chemical Processes for Sustainability. ACS Sustainable Chem. Eng. 2016, 4, 6208–6221. 10.1021/acssuschemeng.6b02200. [DOI] [PMC free article] [PubMed] [Google Scholar]
- Bonfante-Alvarez H.; De Avila-Montiel G.; Herrera-Barros A.; Torrenegra-Alarcon M.; Gonzalez-Delgado A. D. Evaluation of Five Chitosan Production Routes with Astaxanthin Recovery from Shrimp Exoskeletons. Chem. Eng. Trans. 2018, 70, 1969–1974. 10.3303/CET1870329. [DOI] [Google Scholar]
- Meramo-Hurtado S.; Alarcón-Suesca C.; González-Delgado Á. D. Exergetic Sensibility Analysis and Environmental Evaluation of Chitosan Production from Shrimp Exoskeleton in Colombia. J. Cleaner Prod. 2020, 248, 119285. 10.1016/j.jclepro.2019.119285. [DOI] [Google Scholar]
- Arbia W.; Arbia L.; Adour L.; Amrane A. Chitin Recovery Using Biological Methods. Food Technol. Biotechnol. 2013, 51, 12–25. [Google Scholar]
- EL Knidri H.; Dahmani J.; Addaou A.; Laajeb A.; Lahsini A. Rapid and Efficient Extraction of Chitin and Chitosan for Scale-up Production: Effect of Process Parameters on Deacetylation Degree and Molecular Weight. Int. J. Biol. Macromol. 2019, 139, 1092–1102. 10.1016/j.ijbiomac.2019.08.079. [DOI] [PubMed] [Google Scholar]
- Meramo-Hurtado S.; Herrera-Barros A.; González-Delgado Á. Evaluation of Large-Scale Production of Chitosan Microbeads Modified with Nanoparticles Based on Exergy Analysis. Energies 2019, 12, 1200. 10.3390/en12071200. [DOI] [Google Scholar]
- Zhou L.; Liu J.; Liu Z. Adsorption of Platinum (IV) and Palladium(II) from Aqueous Solution by Thiourea-Modified Chitosan Microspheres. J. Hazard. Mater. 2009, 172, 439–446. 10.1016/j.jhazmat.2009.07.030. [DOI] [PubMed] [Google Scholar]
- Zahedi S.; Ghomi J. S.; Shahbazi-Alavi H. Preparation of Chitosan Nanoparticles from Shrimp Shells and Investigation of Its Catalytic Effect in Diastereoselective Synthesis of Dihydropyrroles. Ultrason. Sonochem. 2018, 40, 260–264. 10.1016/j.ultsonch.2017.07.023. [DOI] [PubMed] [Google Scholar]
- Liu Y.; Hu L.; Tan B.; Li J.; Gao X.; He Y.; Du X.; Zhang W.; Wang W. Adsorption Behavior of Heavy Metal Ions from Aqueous Solution onto Composite Dextran-Chitosan Macromolecule Resin Adsorbent. Int. J. Biol. Macromol. 2019, 141, 738–746. 10.1016/j.ijbiomac.2019.09.044. [DOI] [PubMed] [Google Scholar]
- El-Halwagi M. M.Sustainable Design Through Process Integration: Fundamentals and Applications to Industrial Pollution Prevention, Resource Conservation, and Profitability Enhancement; Butterworth-Heinemann: 2017, 10.1016/B978-1-85617-744-3.00001-1. [DOI] [Google Scholar]
- Jaramillo J. J.; Naranjo J. M.; Cardona C. A. Growth and Oil Extraction from Chlorella Vulgaris: A Techno-Economic and Environmental Assessment. Ind. Eng. Chem. Res. 2012, 51, 10503–10508. 10.1021/ie300207x. [DOI] [Google Scholar]
- Hernández V.; Romero-García J. M.; Dávila J. A.; Castro E.; Cardona C. A. Techno-Economic and Environmental Assessment of an Olive Stone Based Biorefinery. Resour., Conserv. Recycl. 2014, 92, 145–150. 10.1016/j.resconrec.2014.09.008. [DOI] [Google Scholar]
- Do T. X.; Lim Y.-i.; Yeo H. Techno-Economic Analysis of Biooil Production Process from Palm Empty Fruit Bunches. Energy Convers. Manage. 2014, 80, 525–534. 10.1016/j.enconman.2014.01.024. [DOI] [Google Scholar]
- Carvajal J. C.; Gómez Á.; Cardona C. A. Comparison of Lignin Extraction Processes: Economic and Environmental Assessment. Bioresour. Technol. 2016, 214, 468–476. 10.1016/j.biortech.2016.04.103. [DOI] [PubMed] [Google Scholar]
- Panjapakkul W.; El-Halwagi M. M. Technoeconomic Analysis of Alternative Pathways of Isopropanol Production. ACS Sustainable Chem. Eng. 2018, 6, 10260–10272. 10.1021/acssuschemeng.8b01606. [DOI] [Google Scholar]
- Jasper S.; El-Halwagi M. M. A Techno-Economic Comparison between Two Methanol-to-Propylene Processes. Processes 2015, 3, 684–698. 10.3390/pr3030684. [DOI] [Google Scholar]
- Pérez-Uresti S. I.; Adrián-Mendiola J. M.; El-Halwagi M. M.; Jiménez-Gutiérrez A. Techno-Economic Assessment of Benzene Production from Shale Gas. Processes 2017, 5, 33. 10.3390/pr5030033. [DOI] [Google Scholar]
- Morales-Carvajal J.; Villabona-Nuncira R.; González-Delgado A. D.; Barajas-Ferreira C.; Barajas-Solano A. Technical-Economic Prefeasibility Study of Astaxanthin Production System from H. Pluvial Microalgae in Colombia. Indian J. Sci. Technol. 2018, 11, 1–8. 10.17485/ijst/2018/v11i34/122627. [DOI] [Google Scholar]
- Romero-Perez J. C.; Vergara-Echeverry L. A.; Peralta-Ruiz Y. Y.; Gonzalez-Delgado A. D. A Techno-Economic Sensitivity Approach for Development of a Palm-Based Biorefineries in Colombia. Chem. Eng. Trans. 2017, 57, 13–18. 10.3303/CET1757003. [DOI] [Google Scholar]
- González-Delgado Á.; Peralta-Ruiz Y. A Hierarchical Techno-Economic Sensitivity Approach for Evaluation of Agroindustrial Production Chains. Int. J. ChemTech Res. 2017, 10, 921–929. [Google Scholar]
- Herrera-Rodriguez T.; Parejo-Palacio V.; Gonzalez-Delgado Á. D. Technoeconomic Sensibility Analysis of Industrial Agar Production from Red Algae. Chem. Eng. Trans. 2018, 70, 2029–2034. 10.3303/CET1870339. [DOI] [Google Scholar]
- Mahmood R.; Parshetti G. K.; Balasubramanian R. Energy , Exergy and Techno-Economic Analyses of Hydrothermal Oxidation of Food Waste to Produce Hydro-Char and Bio-Oil. Energy 2016, 102, 187–198. 10.1016/j.energy.2016.02.042. [DOI] [Google Scholar]
- Marsiglia-López D.; Ramirez-Uribe M.; González-Delgado Á.; Ojeda-Delgado K.; Sánchez-Tuirán E. Computer-Aided Economic Evaluation of Pectin Extraction from Cocoa Pod Husk (Theobroma Cacao L.). Contemp. Eng. Sci. 2017, 10, 1493–1500. 10.12988/ces.2017.710140. [DOI] [Google Scholar]
- Cogollo-Herrera K.; Bonfante-Alvarez H.; De Ávila-Montiel G.; Herrera-Barros A.; Gonzalez-Delgado A. D. Techno-Economic Sensitivity Analysis of Large Scale Chitosan Production Process from Shrimp Shell Wastes. Chem. Eng. Trans. 2018, 70, 2179–2184. 10.3303/CET1870364. [DOI] [Google Scholar]
- Corporate - Taxes on corporate income; https://taxsummaries.pwc.com/colombia/corporate/taxes-on-corporate-income (accessed May 27, 2020).
- Galindo A. J.; Meléndez M. Corporate Tax Stimulus and Investment in Colombia. SSRN Electron. J. 2010, 31. 10.2139/ssrn.1817287. [DOI] [Google Scholar]
- Moreno-Sader K.; Meramo-Hurtado S. I.; González-Delgado A. D. Environmental Sustainability Analysis of Chitosan Microbeads Production for Pharmaceutical Applications via Computer-Aided Simulation , WAR and TRACI Assessments. Sustainable Chem. Pharm. 2020, 15, 100212. 10.1016/j.scp.2020.100212. [DOI] [Google Scholar]
- Meramo-Hurtado S.; Urbina-Suaréz N.; González-Delgado Á. Computer-Aided Environmental and Exergy Analyses of a Large-Scale Production of Chitosan Microbeads Modified with TiO2 Nanoparticles. J. Cleaner Prod. 2019, 273. 10.1016/j.jclepro.2019.117804. [DOI] [Google Scholar]
- Mio A.; Limleamthong P.; Guillén-Gosálbez G.; Fermeglia M. Sustainability Evaluation of Alternative Routes for Fine Chemicals Production in an Early Stage of Process Design Adopting Process Simulation along with Data Envelopment Analysis. Ind. Eng. Chem. Res. 2018, 57, 7946–7960. 10.1021/acs.iecr.7b05126. [DOI] [Google Scholar]
- Balcerzak J.; Kucharska M.; Gruchała B. Preparation of Micro and Nanostructures of Chitosan by Ultrasonic Coalescence of W/O Emulsions. Prog. Chem. Appl. Chitin Its Deriv. 2013, 18, 13–20. [Google Scholar]
- Tedesco M. T.; Di Lisa D.; Massobrio P.; Colistra N.; Pesce M.; Catelani T.; Dellacasa E.; Raiteri R.; Martinoia S.; Pastorino L. Soft Chitosan Microbeads Scaffold for 3D Functional Neuronal Networks. Biomaterials 2018, 156, 159–171. 10.1016/j.biomaterials.2017.11.043. [DOI] [PubMed] [Google Scholar]
- Haigh K. F.; Petersen A. M.; Gottumukkala L.; Mandegari M.; Naleli K.; Görgens J. F. Simulation and Comparison of Processes for Biobutanol Production from Lignocellulose via ABE Fermentation. Biofuels, Bioprod. Biorefin. 2018, 12, 1023–1036. 10.1002/bbb.1917. [DOI] [Google Scholar]
- Meramo-Hurtado S.; Moreno-Sader K.; González-Delgado Á. D. Computer-aided Simulation and Exergy Analysis of TiO2 Nanoparticles Production via Green Chemistry. PeerJ 2019, e8113 10.7717/peerj.8113. [DOI] [PMC free article] [PubMed] [Google Scholar]
- Ranitha M.; Nour A. H.; Sulaiman Z. A.; Nour A. H.; Thana R. S. A Comparative Study of Lemongrass (Cymbopogon Citratus) Essential Oil Extracted by Microwave-Assisted Hydrodistillation (MAHD) and Conventional Hydrodistillation (HD) Method. Int. J. Chem. Eng. Appl. 2014, 5, 104–108. 10.7763/IJCEA.2014.V5.360. [DOI] [Google Scholar]
- Askari M. B.; Banizi Z. T.; Seifi M.; Dehaghi S. B.; Veisi P. Synthesis of TiO2 Nanoparticles and Decorated Multi-Wall Carbon Nanotube (MWCNT) with Anatase TiO2 Nanoparticles and Study of Optical Properties and Structural Characterization of TiO2/MWCNT Nanocomposite. Optik 2017, 149, 447–454. 10.1016/j.ijleo.2017.09.078. [DOI] [Google Scholar]
- Perez Zúñiga D. L.; Luna Barrios E. J.; Peralta-Ruiz Y. Y.; González-Delgado A. D. Techno-Economic Sensitivity of Bio-Hydrogen Production from Empty Palm Fruit Bunches under Colombian Conditions. Chem. Eng. Trans. 2016, 52, 1117–1122. 10.3303/CET1652187. [DOI] [Google Scholar]
- Ebrahimi-Moghadam A.; Moghadam A. J.; Farzaneh-Gord M. Comprehensive Techno-Economic and Environmental Sensitivity Analysis and Multi-Objective Optimization of a Novel Heat and Power System for Natural Gas City Gate Stations. J. Cleaner Prod. 2020, 262, 121261. 10.1016/j.jclepro.2020.121261. [DOI] [Google Scholar]
- Hosseini T.; De Girolamo A.; Zhang L. Energy Evaluation and Techno-Economic Analysis of Low-Rank Coal (Victorian Brown Coal) Utilization for the Production of Multi-Products in a Drying-Pyrolysis Process. Energy Fuels 2018, 32, 3211–3224. 10.1021/acs.energyfuels.7b03840. [DOI] [Google Scholar]
- AlNouss A.; Parthasarathy P.; Shahbaz M.; Al-Ansari T.; Mackey H.; McKay G. Techno-Economic and Sensitivity Analysis of Coconut Coir Pith-Biomass Gasification Using ASPEN PLUS. Appl. Energy 2020, 261, 114350. 10.1016/j.apenergy.2019.114350. [DOI] [Google Scholar]