

Abstract
INTRODUCTION:
Laboratory mice are a mainstay of biomedical research and have been instrumental for many important discoveries in the field of immunology. However, there are also major limitations, including conflicting results rooted in divergent microbiota among research facilities and the limited ability to predict the complex immune responses of humans. Recent studies have shown that conventional laboratory mice are too far removed from natural environmental conditions to faithfully mirror the physiology of free-living mammals like humans. Mammals and their immune systems evolved to survive and thrive in a microbial world and behave differently in a sanitized environment.
RATIONALE:
To generate a mouse model that more closely resembles the natural mammalian meta-organism with co-evolved microbes and pathogens, we transferred C57BL/6 embryos into wild mice. This resulted in a colony of C57BL/6 mice, which we call “wildlings”.
RESULTS:
Wildlings resembled wild mice and differed significantly from conventional laboratory mice with regards to their bacterial microbiome at important epithelial barrier sites (gut, skin, and vagina), their gut mycobiome and virome, and their level of pathogen exposure. The natural microbiota of wildlings were stable over multiple generations and resilient against antibiotic, dietary, and microbial challenges.
Next, we delineated the immune landscape of wildlings, wild mice, and laboratory mice at immunologically important barrier sites (gut, skin, and vagina), a central non-lymphoid organ (liver), and a central lymphoid organ (spleen) by mass cytometry. Additionally, we characterized the blood immune cell profile by RNA sequencing. The differential contribution of microbial and host genomes in shaping the immune phenotype varied among tissues. Wildlings closely mirrored the wild mouse immune phenotype in the spleen and blood.
Finally, we tested the translational research value of wildlings in a retrospective bench-to-bedside approach. This required well-documented, rodent-based studies that had failed upon transitioning to clinical trials in humans. We chose the CD28-superagonist (CD28SA) trial as representative for treatments targeting adaptive immune responses. Although CD28SA expanded anti-inflammatory regulatory T cells (Tregs) in laboratory mice and showed therapeutic effects in multiple models of autoimmune/inflammatory diseases, the first phase I clinical trial resulted in life-threatening activation of inflammatory T cells and cytokine storms. Similarly, the CD28-superagonist treatment of wildlings, but not laboratory mice, resulted in an inflammatory cytokine response and lack of Treg expansion. As representative for trials targeting innate immune responses, we chose anti-TNF-α treatment (anti-TNF-α or TNF-receptor:Fc fusion protein) during septic shock, which was successful in animal models, but failed in humans. Anti-TNF-α treatment during lethal endotoxemia rescued laboratory mice, but not wildlings. Thus, wildlings better phenocopied human immune responses than conventional laboratory mice in the two models studied.
CONCLUSION:
The wildling model combines resilient natural microbiota and pathogens at all body sites and the tractable genetics of C57BL/6. Given the wide-ranging effects of microbiota on host physiology, natural microbiota-based models may benefit different research fields (e.g. metabolism and neurodegenerative diseases) and may also be applicable to other animals. Such models may enhance the validity and reproducibility of biomedical studies among research institutes, facilitate the discovery of disease mechanisms and treatments that cannot be studied in regular laboratory mice, and increase the translatability of immunological results to humans.
Laboratory mouse studies are paramount for understanding basic biological phenomena, but also have limitations. These include conflicting results due to divergent microbiota and limited translational research value. To address both shortcomings, we transferred C57BL/6 embryos into wild mice creating “wildlings”. These mice had a natural microbiota and pathogens at all body sites and the tractable genetics of C57BL/6. The bacterial microbiome, mycobiome, and virome of wildlings affected the immune landscape of multiple organs. Their gut microbiota outcompeted laboratory microbiota and demonstrated resilience to environmental challenges. Wildlings, but not conventional laboratory mice, phenocopied human immune responses in two preclinical studies. A combined natural microbiota- and pathogen-based model may enhance the reproducibility of biomedical studies and increase bench-to-bedside safety and success of immunological studies.
Graphical Abstract
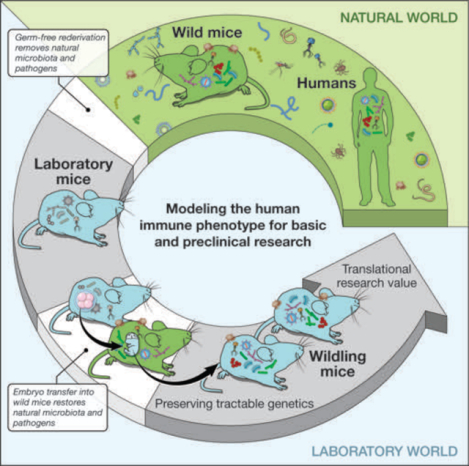
Harnessing natural microbiota and pathogens to address shortcomings of current mouse models. To restore the natural microbiome while preserving the research benefits of tractable genetics, we transferred C57BL/6 embryos into wild mice and created a colony of C57BL/6 mice, which we call “wildlings”. Their microbiome was stable over time and resilient to environmental challenges. Wildlings also exhibited an increased translational research value in immunological studies.
One Sentence Summary:
A mouse model combining wild mouse microbiota with naturally occurring pathogens has increased resilience and translational research value.
Laboratory mice are a mainstay of biomedical research, and have been instrumental for many discoveries in the field of immunology. However, current mouse models have several major limitations, which include conflicting results rooted in divergent microbiota among research facilities (1–3) and the limited ability to predict complex physiological responses of humans (4–10).
Divergent microbiota contribute to variable and sometimes contradictory experimental results obtained from genetically identical animals in different academic and commercial vivaria (1–3). Therefore, scientific journal editors have recently called for the mandatory documentation of all factors that may influence the microbiome (3, 11). Such factors include, for example, the pH and treatment of drinking water; the composition, storage and treatment of the diet; and the type and amount of the bedding and nesting material. Although such documentation may clarify differences among studies, it does not correct the causative problem of divergent laboratory microbiota. To address this, others have called for a standardized microbiota to be shared among institutions (12, 13). Due to feasibility concerns and the absence of an evidence-based rationale for choosing a suitable standard, no specific candidate has yet been proposed. A further complication is that conventional laboratory microbiota lack resilience and change in composition upon even minor disturbances (e.g. transfer of mice to a different barrier within the same facility) (14). Therefore, standardization with low-resilience conventional microbiota will ultimately result in the reemergence of divergent microbiota and produce conflicting results between institutions.
The laboratory mouse also has limited translational research value (e.g. the transition from preclinical studies in mice to bedside practice in humans suffers a high failure rate) (4–10). This is primarily attributed to differences in physiology and genetics between mice and humans. However, recent studies have shown that conventional laboratory mice are additionally too far removed from natural environmental conditions to faithfully mirror the physiology of free-living mammals like humans (15–19). Mammals and their immune systems evolved to survive and thrive in a microbial world and behave differently in a sanitized environment. In an effort to improve the translational research value of mouse models, two concepts have been proposed. The “dirty mouse” approach exposes conventional laboratory mice to pathogens that may, or may not, represent natural exposure (16, 17). In contrast, the “natural microbiota” approach engrafts a naturally co-evolved but pathogen-free microbiota from wild mice into laboratory mice (15). It remains uncertain whether these efforts result in mouse models that better recapitulate human immune responses in preclinical studies.
Creation of the wildling model through the process of inverse germ-free rederivation
To address the shortcomings described above, we generated a mouse model that more closely resembles the natural mammalian meta-organism with co-evolved microbes and pathogens while preserving the tractable genetics of laboratory mice. Building on our previous work (15), we aimed for a model that harbored natural microbiota and natural pathogens not only in the gastrointestinal tract (gut) but at all barrier sites. In contrast to previous work (16, 17), our model sought to include pathogens that were naturally selected for in the mouse’s original habitat. Microbiota and pathogens should exert their effects throughout all germinal, embryonic, and fetal developmental stages, followed by natural vertical transfer during birth and subsequent colonization in early life. Since conventional laboratory mice have lost their naturally co-evolved microbiota and pathogens through germ-free rederivation, we inverted this process. Specifically, we transferred C57BL/6 (B6) embryos into pseudo-pregnant female wild mice (Mus musculus domesticus). The B6 strain was chosen over other inbred strains, because it is the most commonly used laboratory mouse strain, particularly in immunological research. The wild dams gave birth to and founded a distinct colony of B6 mice, which we called “wildlings”.
The wildling bacterial microbiome resembles that of wild mice and differs significantly from conventional laboratory mice
We utilized 16S rRNA gene profiling to characterize and compare the bacterial component of the microbiota from wildlings, wild mice (Wild), and specific-pathogen-free (SPF) conventional laboratory mice. Gut, skin, and vagina were surveilled because they represent major microbial niches and immunologically important epithelial barriers.
As illustrated by principal coordinates analysis (PCoA), the gut microbiota of wildlings and wild mice formed wider, more heterogenous clusters than the gut microbiota of conventional laboratory mice. Clusters of all three groups were distinct and significantly different from each other (Fig. 1A). Assessment of taxon abundance at the rank of phylum and family suggested that wildling microbiota resembled wild mouse microbiota and were distinct from conventional laboratory microbiota (Fig. 1B and C, Table S1). Wildlings interspersed with wild mice in an unsupervised hierarchical analysis of the 16S data, whereas conventional laboratory mice formed a distinct group (Fig. 1D). This was confirmed by shotgun metagenomics (Fig. S1). Finally, we assessed the bacterial microbiome at barrier sites with low biomass. Similarly, the skin and vaginal microbiota of wildlings resembled wild mice and differed significantly from conventional laboratory mice (Fig. 1, Table S1). Thus, inverse germ-free rederivation transfers the bacterial microbiome of wild mice to wildlings with regards to major microbial niches and immunologically important epithelial barriers.
Fig. 1. Wildlings resemble wild mice and differ significantly from conventional laboratory mice in their bacterial microbiome at major microbial niches and immunological barrier sites.
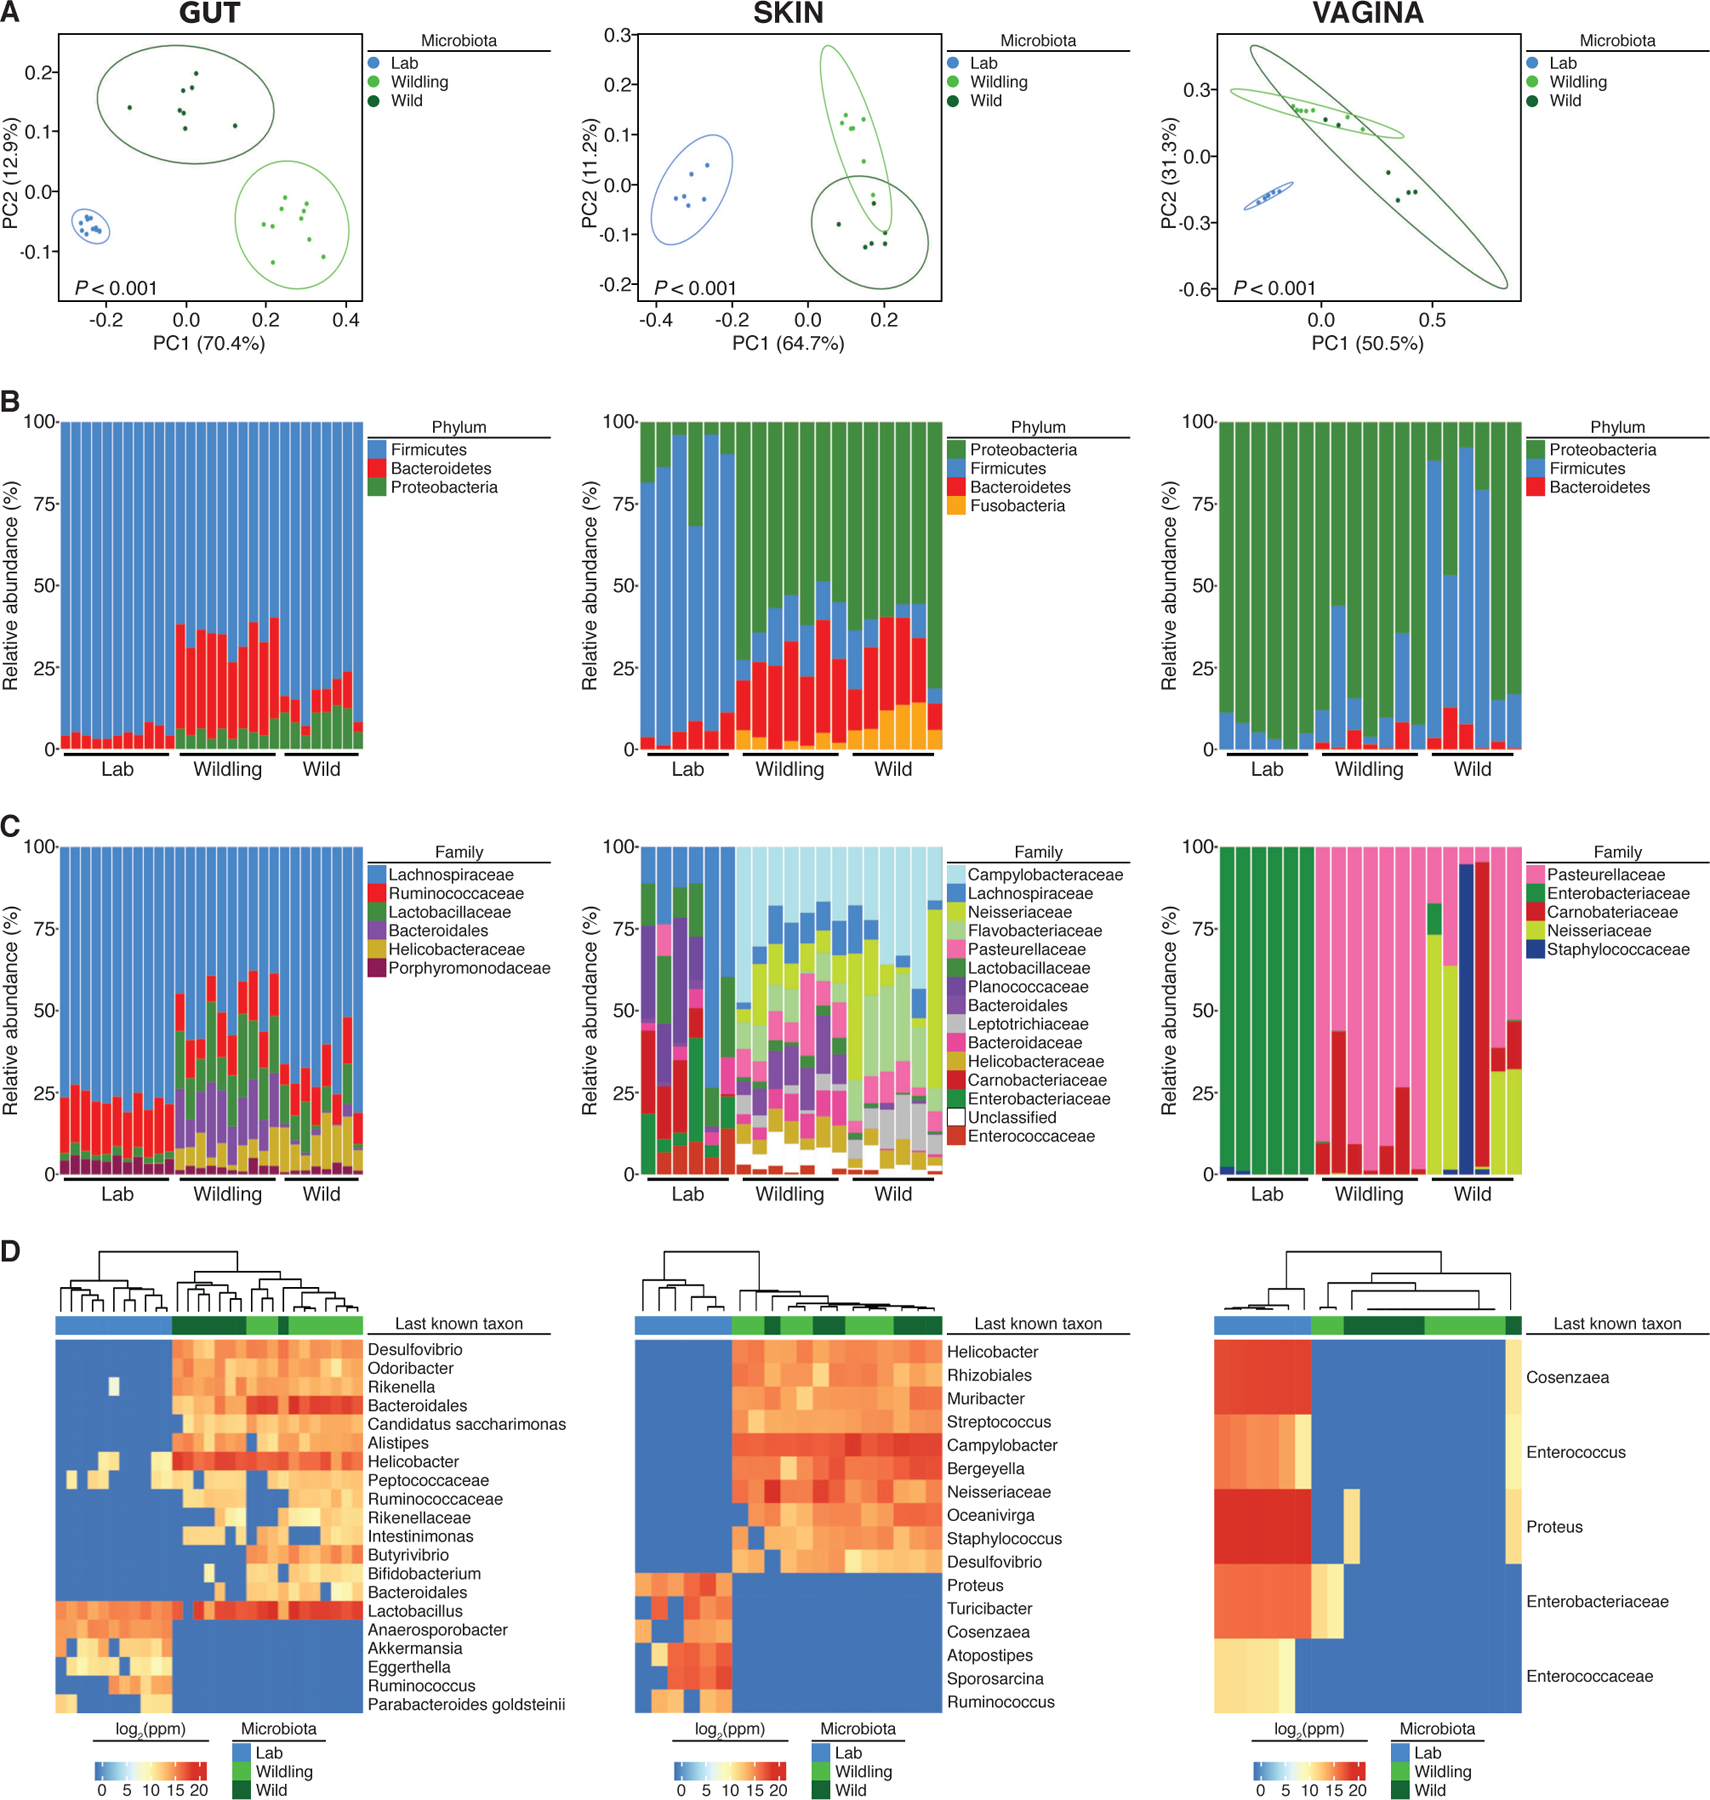
The bacterial microbiome of wildlings, wild mice (Wild), and conventional laboratory mice (Lab) was profiled at gut, skin and vagina by 16S rRNA sequencing: (A) Weighted UniFrac PCoA. (B and C) Relative abundance at the rank of phylum and family. (D) The heatmap shows the last known taxa with greatest variance among groups (log2-fold change values). Data shown are from 6 to 11 independent biological replicates per group. Each skin and vaginal replicate represents tissue pooled from 3 mice. Significance in (A) was determined by PERMANOVA.
Wildlings resemble wild mice and differ significantly from conventional laboratory mice in the composition and size of the gut mycobiome and virome
Gut microbiota have a major and systemic impact on many aspects of host physiology (12, 20) and there is an increasing appreciation for their non-bacterial constituents, specifically fungi (21, 22) and viruses (23–26). Consequently, we next compared the gut mycobiome and virome of wildlings, wild mice, and conventional laboratory mice.
We found significantly more fungal DNA relative to total DNA in wildlings and wild mice than in conventional laboratory mice (Fig. 2A). There was a significantly higher relative abundance of Ascomycota and a significantly lower relative abundance of Basidiomycota in wildlings and wild mice as compared to conventional laboratory mice (Fig. 2A). Similarly, there were significantly more viral reads in wildlings and wild mice than in conventional laboratory mice (Fig. 2B). Eukaryotic viral reads were found in 15 of 16 wildlings and wild mice tested, but only in 3 of 8 conventional laboratory mice (Fig. 2B). In addition to gross compositional differences, the alpha diversity of eukaryotic viruses in wildlings and wild mice was significantly greater than in conventional laboratory mice (Fig. 2B). We also found significantly more phage reads and greater alpha diversity in wildlings than in conventional laboratory mice (Fig. 2B). However, these phage differences were minor, and there was no obvious compositional disparity between the three groups (Fig. 2B). The characterization of wildlings was completed by screening for pathogens that are typically absent in conventional laboratory mice housed under SPF conditions. Based on antibody and PCR testing, wildlings and wild mice were exposed to similar viral, bacterial, and fungal pathogens and to members of the meiofauna such as unicellular protozoa and complex multicellular organisms (Table S2). Thus, inverse germ-free rederivation generates a natural microbiota- and pathogen-based wildling model that closely resembles wild mice and significantly differs from conventional laboratory mice at all barrier sites surveyed.
Fig. 2. Wildlings resemble wild mice and differ significantly from conventional laboratory mice in the composition and size of the gut mycobiome and virome.
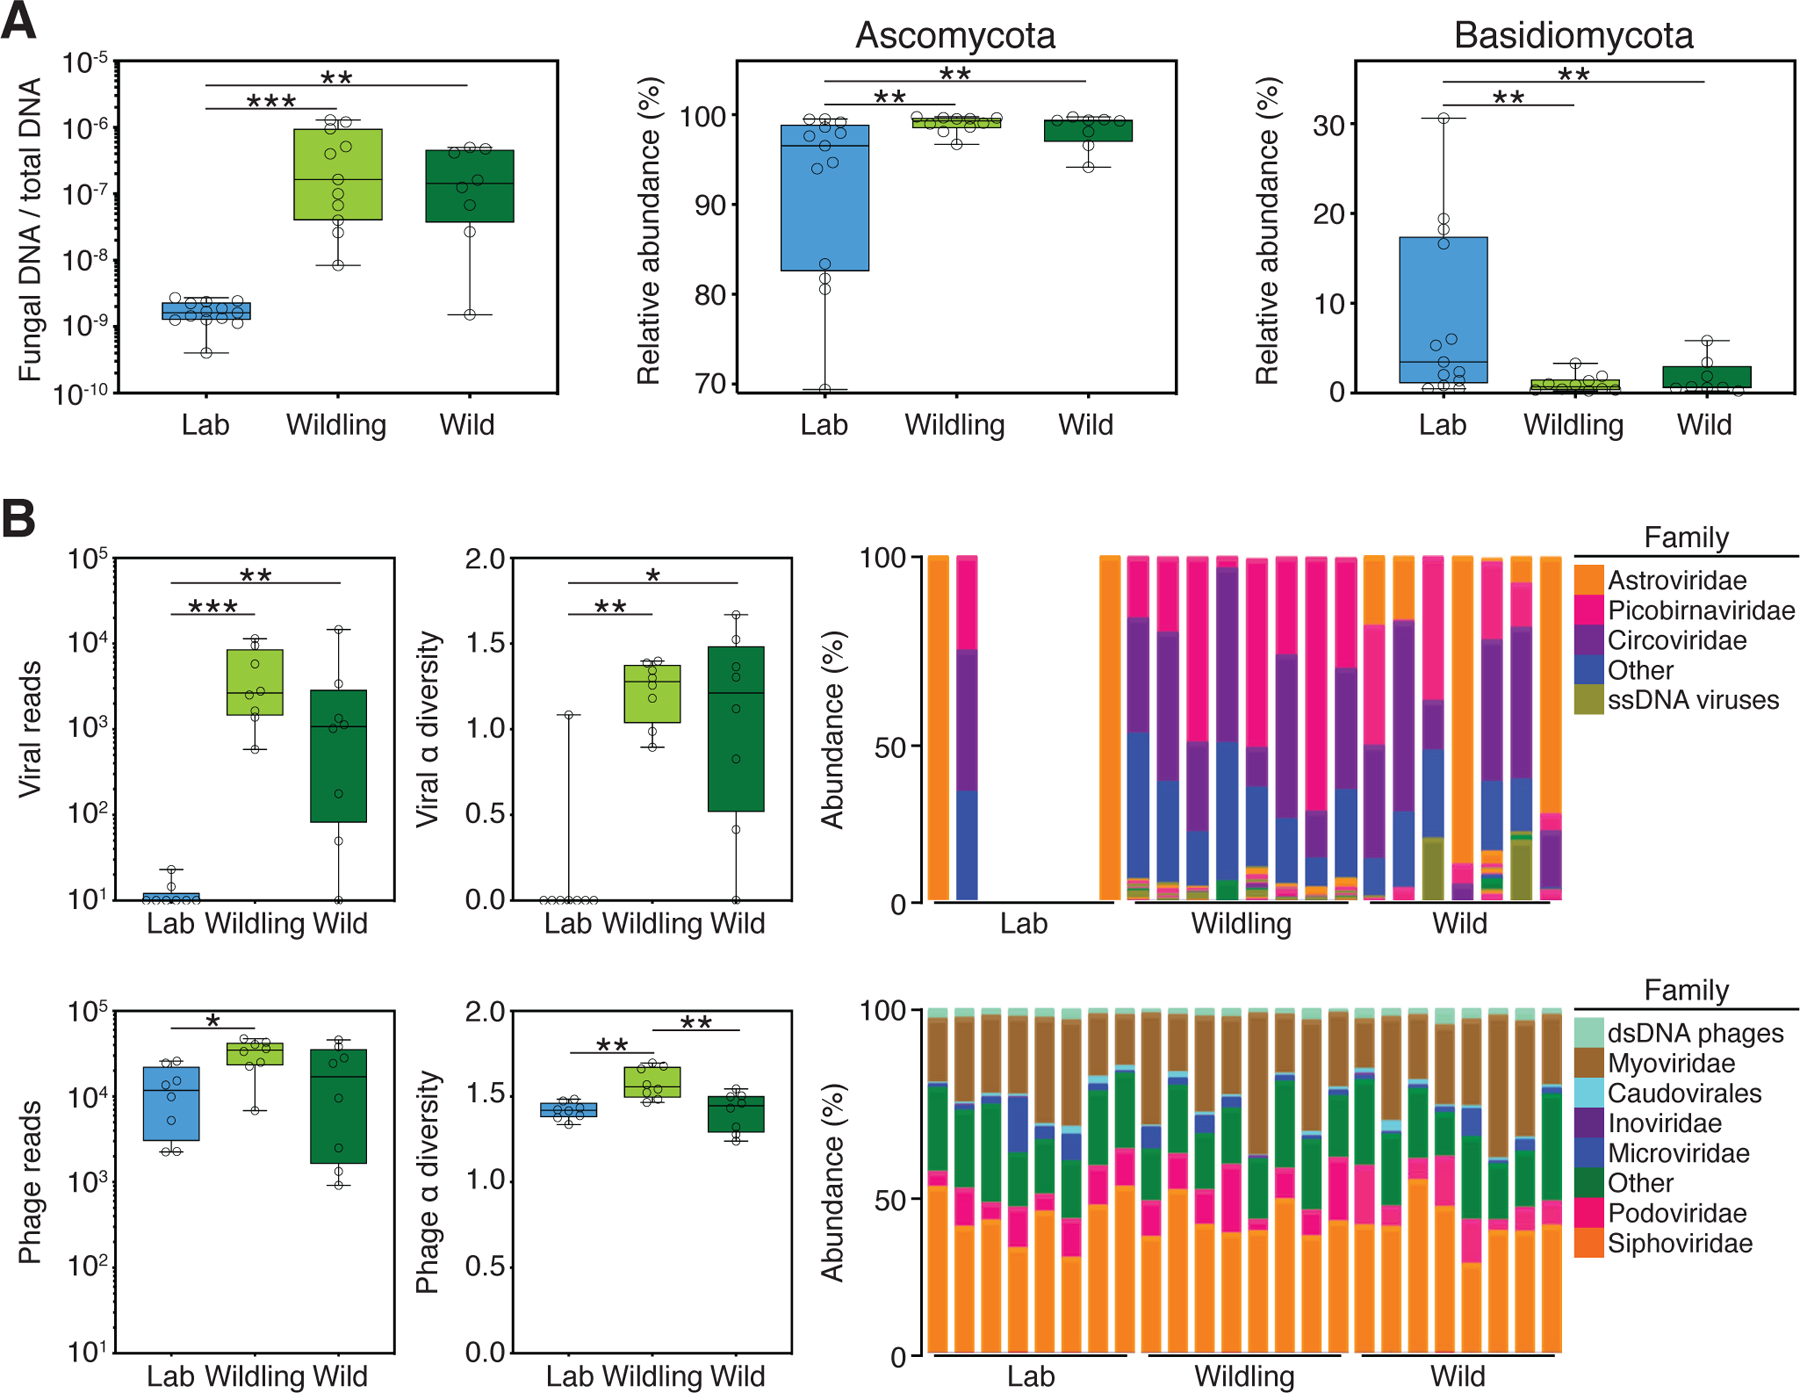
ITS1–2 rDNA profiling and next generation virome sequencing data comparing the gut microbiome of wildlings, wild mice (Wild), and conventional laboratory mice (Lab). (A) Relative abundance of fungi by qPCR (18S) and ITS1–2 rDNA next generation sequencing; fungal DNA relative to total DNA (left); relative abundance at the rank of phylum by next generation sequencing (center and right). (B) Next-generation sequencing data for viruses and phages. Left panel: Total amount of reads. Center panel: Shannon α diversity index. Right panel: Relative abundance at the rank of family. Data shown are from 8–13 independent biological replicates per group. Box plots show median, IQR (box), and minimum to maximum (whiskers). *P < 0.05, **P < 0.01, ***P < 0.001; as determined by parametric one-way ANOVA with Tukey multiple comparison with 95% confidence interval (Gaussian model), or non-parametric Kruskal–Wallis H test with Dunn’s multiple comparison.
The microbial genome shapes the immune landscape of the spleen and blood
To assess the impact of the combined natural microbiota- and pathogen-based approach on host immunity, we characterized the immune landscape of major microbial niches and immunologically important epithelial barriers (gut, skin, and vagina), a central non-lymphoid organ (liver), and a central lymphoid organ (spleen) by mass cytometry (CyTOF). Wildlings and wild mice had different host genomes, but a similar microbial genome (microbiota and pathogens). Conversely, wildlings and conventional laboratory mice had the same host genome, but different microbial genomes. Thus, if the microbial genome shapes the immune phenotype within a given species and tissue, wildlings should phenocopy wild mice. If instead the host genome shapes the immune phenotype, however, wildlings should phenocopy conventional laboratory mice.
As illustrated by t-SNE plots (Fig. 3, Fig. S2), each tissue displayed a unique immune phenotype. Within each tissue, we observed differences in the immune phenotype of each mouse group. To estimate the relative contribution of the microbial and host genomes to the immune phenotype, we identified the relatedness of wildling, wild mouse, and conventional laboratory mouse immune phenotypes by unsupervised hierarchical clustering based on the cell subsets identified by Rphenograph (Fig. 3). For the gut, we saw that 50% of wildlings clustered with conventional laboratory mice, whereas the other 50% clustered with wild mice (Fig. 3B). For the skin (Fig. 3D) and the vagina (Fig. 3F), wildlings clustered primarily with conventional laboratory mice. For the liver, the majority of wildlings clustered separately but in close proximity to conventional laboratory mice and distinct from wild mice (Fig. 3H). Interestingly, we saw the opposite pattern for the spleen; wildlings clustered separately but in close proximity to wild mice and distinct from conventional laboratory mice (Fig. 3J). Thus, the immune phenotype of the spleen (central lymphoid organ) appears to depend primarily on the microbial genome (microbiota and systemic pathogens). The microbial genome also affects, to varying degrees, the immune landscape of immunologically active barrier sites and the liver as a central non-lymphoid organ.
Fig. 3. The microbial genome shapes the immune landscape of the spleen and contributes to the immune landscape of barrier sites and the liver.
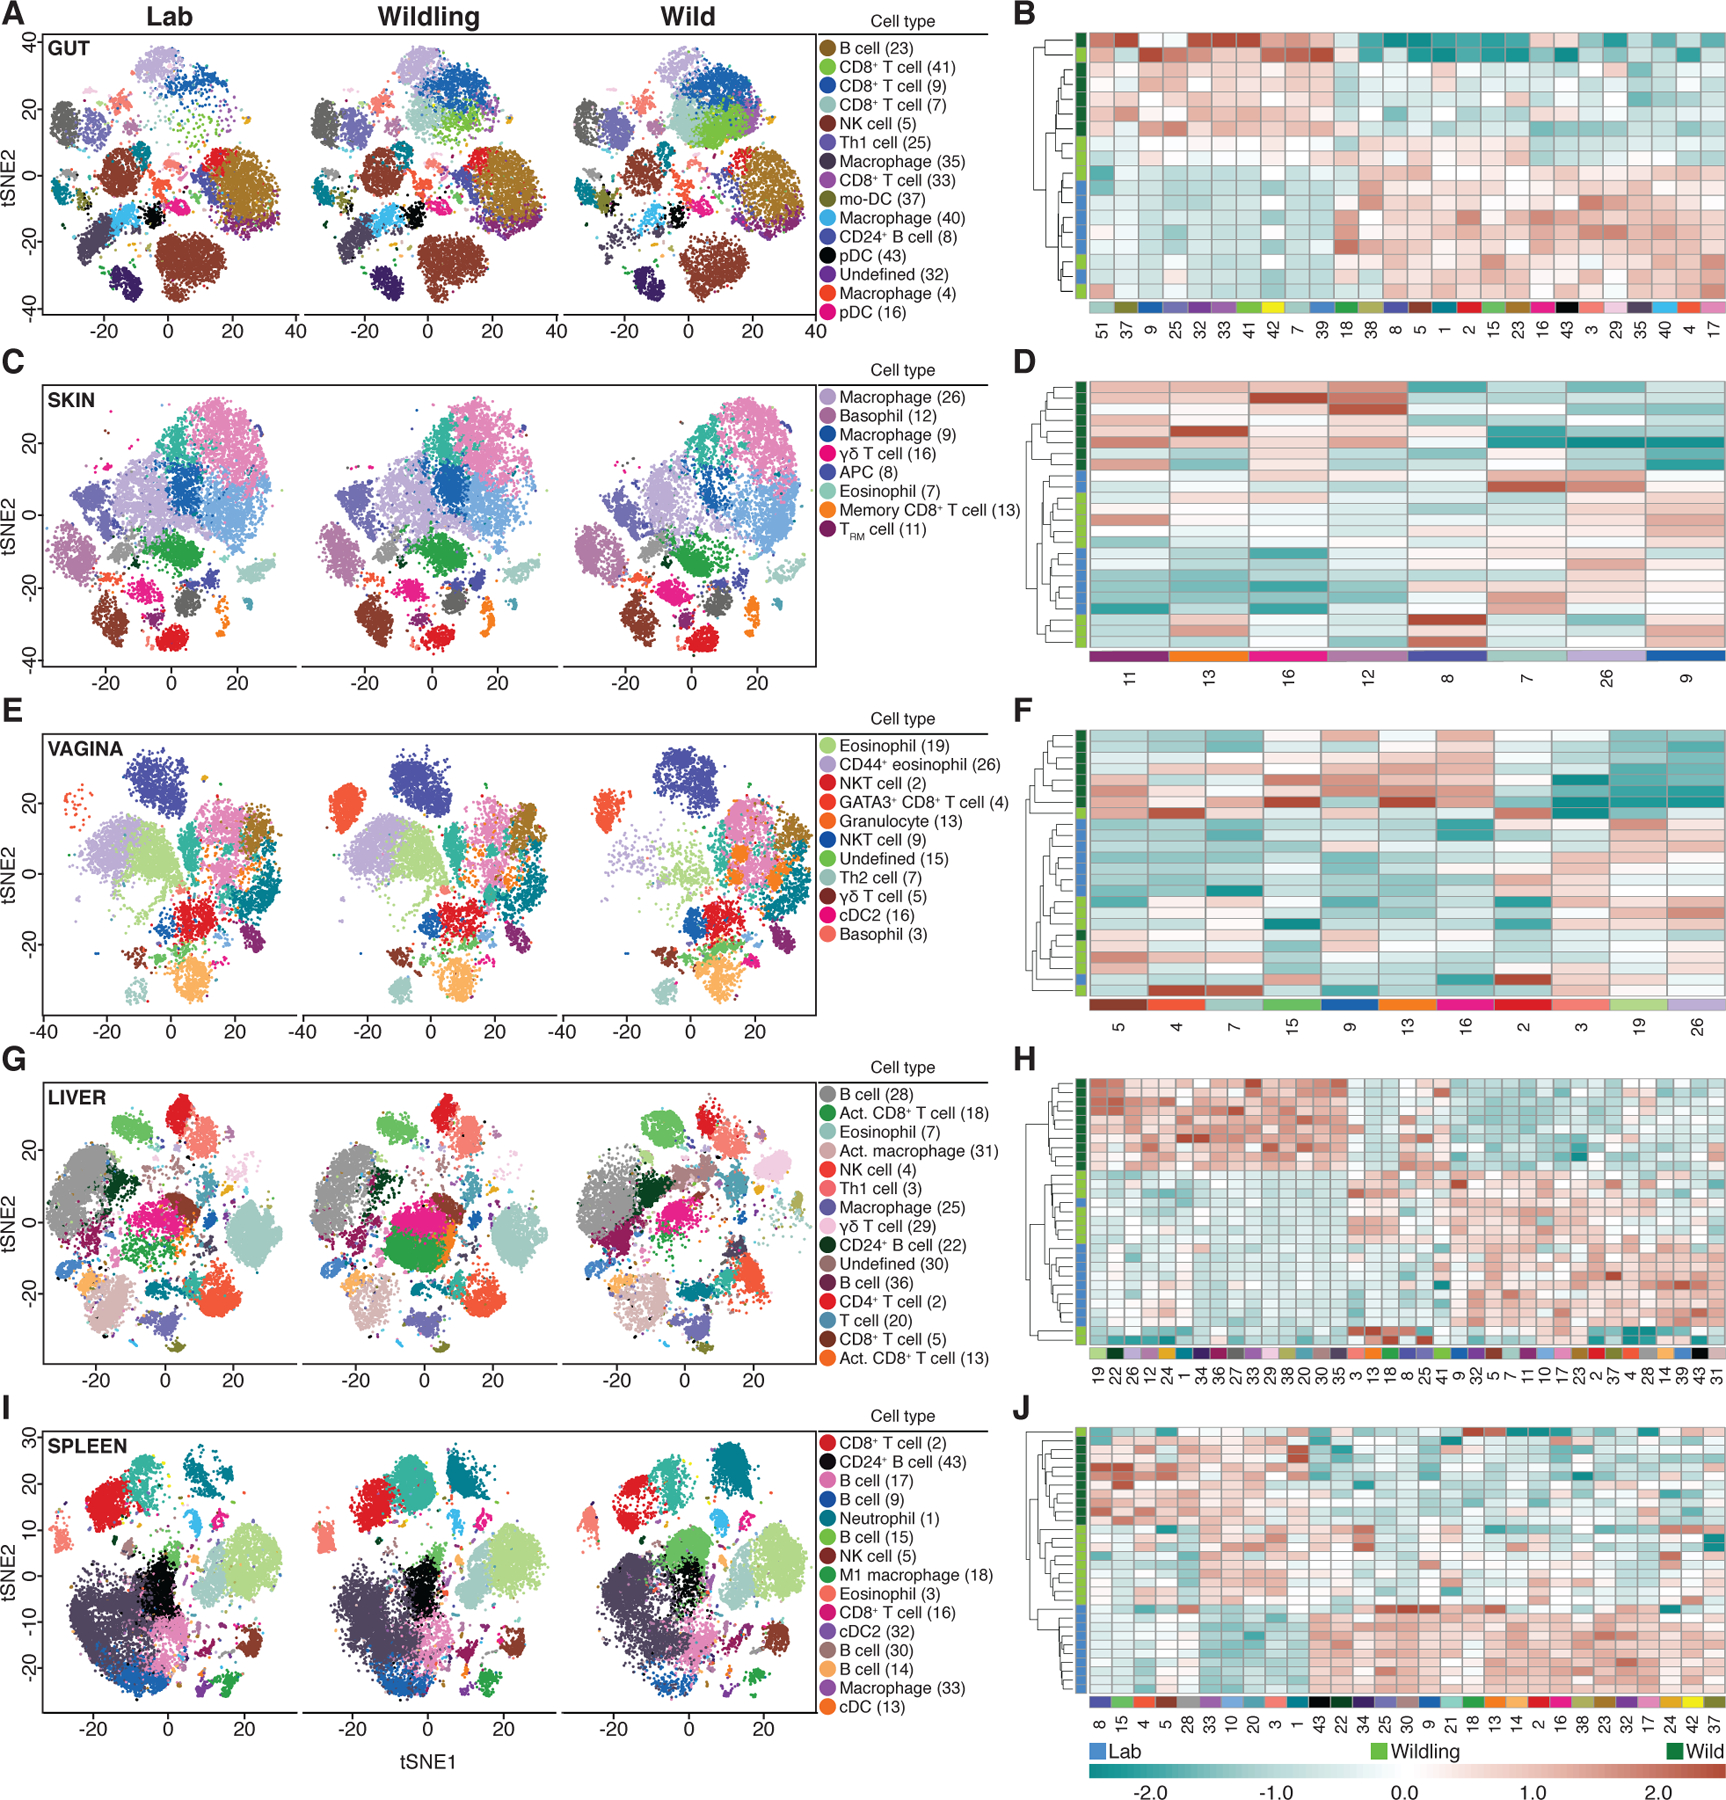
CyTOF data characterizing and comparing the immune phenotype of wildlings, wild mice (Wild), and conventional laboratory mice (Lab) at major microbial niches and immunologically important epithelial barriers (A, B: Gut; C, D: Skin; E, F: Vagina), a central non-lymphoid organ (G, H: Liver), and a central lymphoid organ (I, J: Spleen).Left panels: Rphenograph analysis of immune phenotypes. Right panels: Unsupervised clustering of significantly different cell subsets. Labelled clusters are the most abundant and significantly different cell subsets between Lab and Wild. Each cell subset and heatmap row is labelled with the corresponding cluster numbers; median marker expression values of each cluster are visualized in Fig. S2. Data shown are from 6–10 independent biological replicates per group.
Next, we used RNA sequencing to characterize and compare the immune phenotype of blood mononuclear cells of the three mouse groups. Using a gene list covering innate and adaptive immunity (27), we identified immune-related genes that were significantly differentially expressed in wild mice versus conventional laboratory mice. Based on the resulting gene list, we created a principal component analysis (PCA), in which wildlings clustered separately from conventional laboratory mice and closer to wild mice along the first principal component (Fig. 4A). The expression pattern of immune-related genes in wildlings followed that of wild mice for genes that were differentially expressed in wild mice versus conventional laboratory mice. Unsupervised clustering further confirmed this finding, placing wildlings closer to wild mice than to conventional laboratory mice (Fig. 4B). Finally, we performed a gene set enrichment analysis (GSEA) to evaluate all genes with RPKM above 5, without focusing on immune-related genes. Most gene sets upregulated in wild mice were also upregulated in wildlings when compared to conventional laboratory mice; the same was true for the 100 most downregulated gene sets (Fig. 4C). Similarly, most gene sets upregulated in wildlings were also upregulated in wild mice when compared to conventional laboratory mice; the same was true for the 100 most downregulated gene sets (Fig. 4D). Thus, wildlings and wild mice share similar immune gene expression profiles, despite genetic differences. These data underscore the differential contribution of the microbial and host genomes in shaping the immune phenotype varies among tissues.
Fig. 4. The microbial genome shapes the immune landscape of blood.
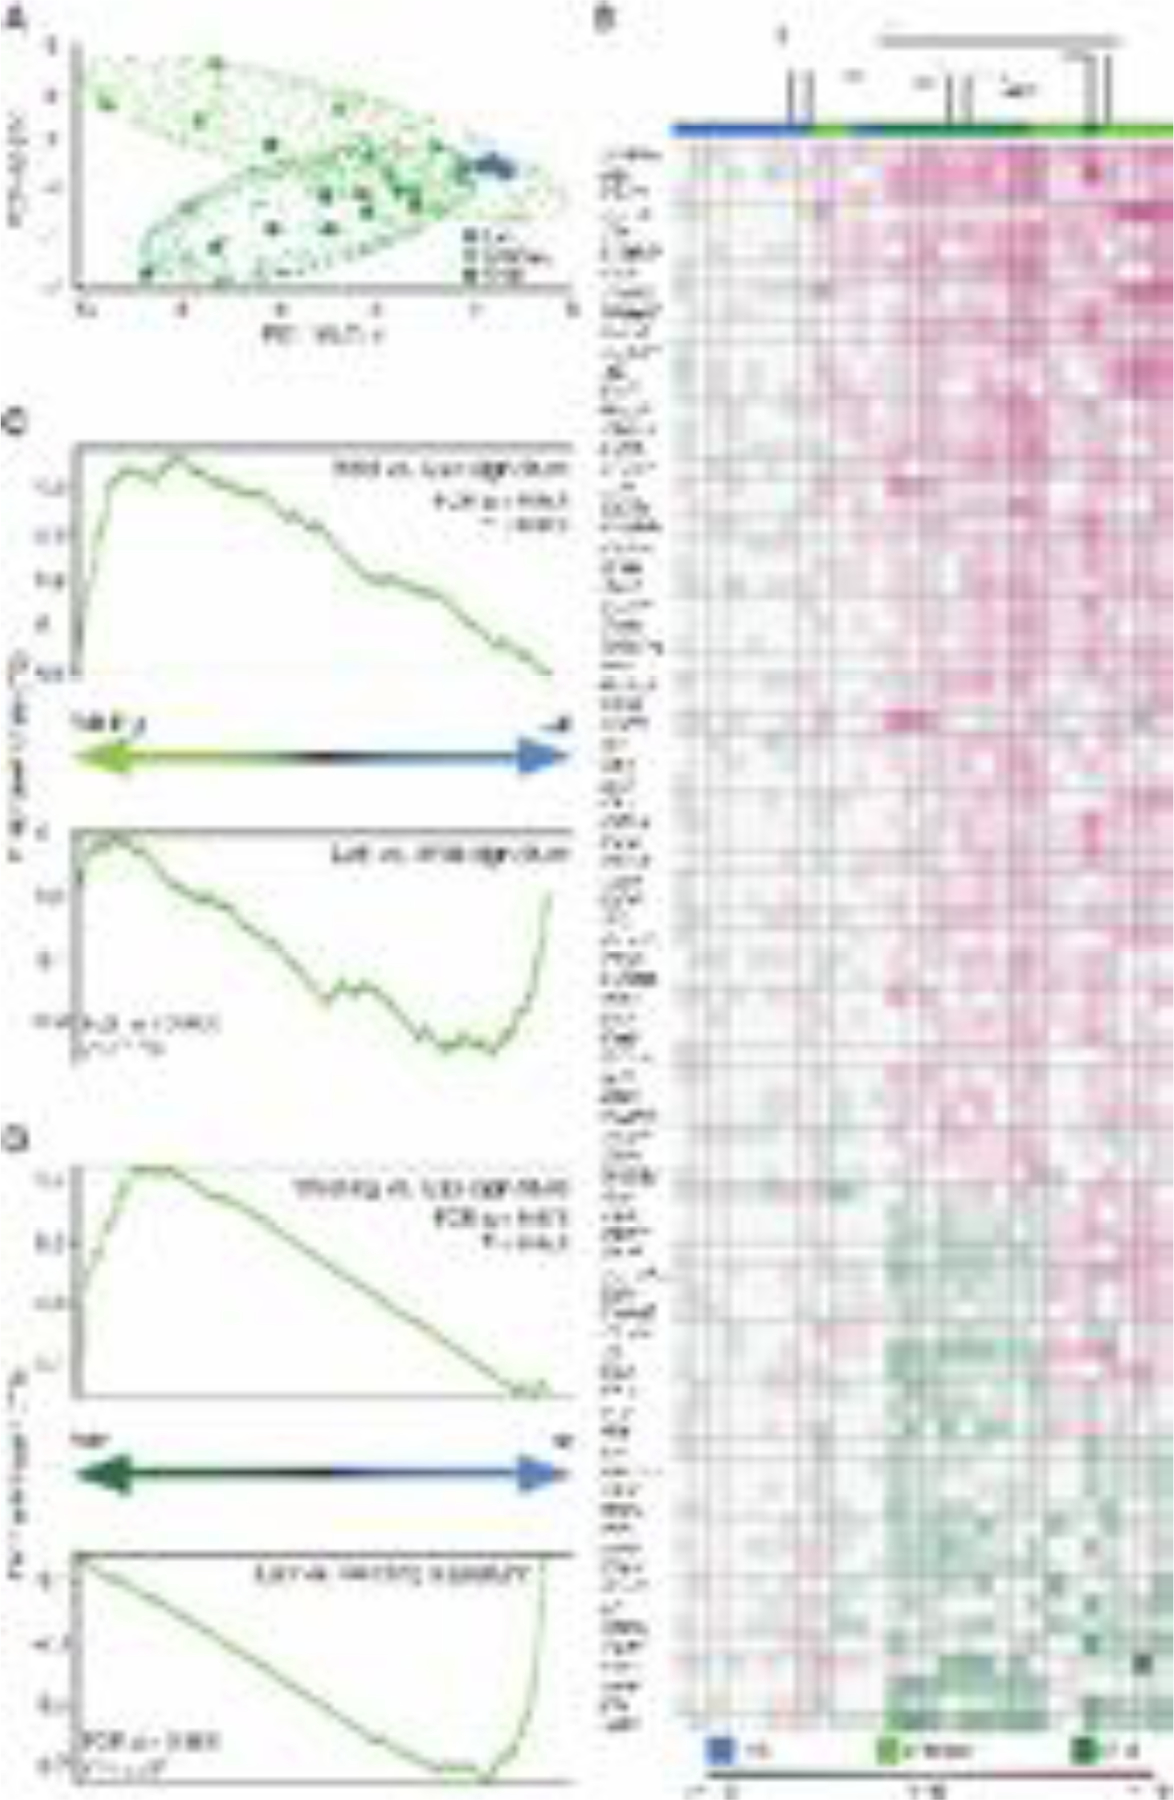
RNA sequencing data comparing the transcriptional profile of wildlings, wild mice (Wild), and conventional laboratory mice (Lab). (A) Principal component analysis of reads per kilobase million (RPKM) values of significantly deregulated immune-related genes in blood mononuclear cells. (B) Unsupervised clustering (Kendal) of immune-related genes that are differentially expressed in Wild versus Lab (log2–fold change values). (C, D) Gene set enrichment analysis (GSEA) of all genes with RPKM > 5. (C) Gene sets ranked by differential expression in wildling versus Lab; Wild vs. Lab and Lab vs. Wild signature (top 100 gene sets). (D) Gene sets ranked by differential expression in Wild versus Lab; Wildling vs. Lab and Lab vs. Wildling signature (top 100 gene sets). Data shown are from 9–10 independent biological replicates per group.
Natural gut microbiota are stable and resilient, and outcompete the microbiota of conventional laboratory mice
Next, we assessed stability and resilience of natural microbiota, which are important characteristics in addressing microbiota-associated conflicting results among research facilities. Overall, the gut bacterial microbiome, mycobiome, and virome as well as the vaginal and skin bacterial microbiome of the Wildling F5 generation resembled that of the F2 generation (Fig. S3 and S4). Of note, there was a separation of F5 and F2 generation at the level of last known taxa in the skin bacterial microbiome. Interestingly, Astroviridae were more abundant in the F5 than in the F2 generation (Fig. S4), but also frequent in wild mice (Fig. 2).
To assess the resilience of bacterial gut microbiota, we subjected wildlings and conventional laboratory mice to strong environmental disturbances. First, we used a 7-day treatment with amoxicillin/clavulanate, the most common broad-spectrum antibiotic regimen. The gut microbiota of all three groups changed significantly after 7 days of antibiotic treatment (Fig. 5A). The conventional gut microbiota of laboratory mice from two vendors (Taconic and Jackson) were unable to recover, whereas the natural microbiota of wildlings recovered partially by day 7 and fully by day 14 after cessation of antibiotic treatment. Second, we placed wildlings and conventional laboratory mice on a 10-week high-fat choline-deficient diet (HFD). The gut microbiota of conventional laboratory mice changed significantly over 10 weeks of HFD and diverged even further from baseline during the 3-week recovery phase on chow diet (Fig. 5B). In contrast, the natural microbiota of wildlings changed only slightly during HFD and fully recovered thereafter.
Fig. 5. Natural gut microbiota are resilient and outcompete gut microbiota of conventional laboratory mice.
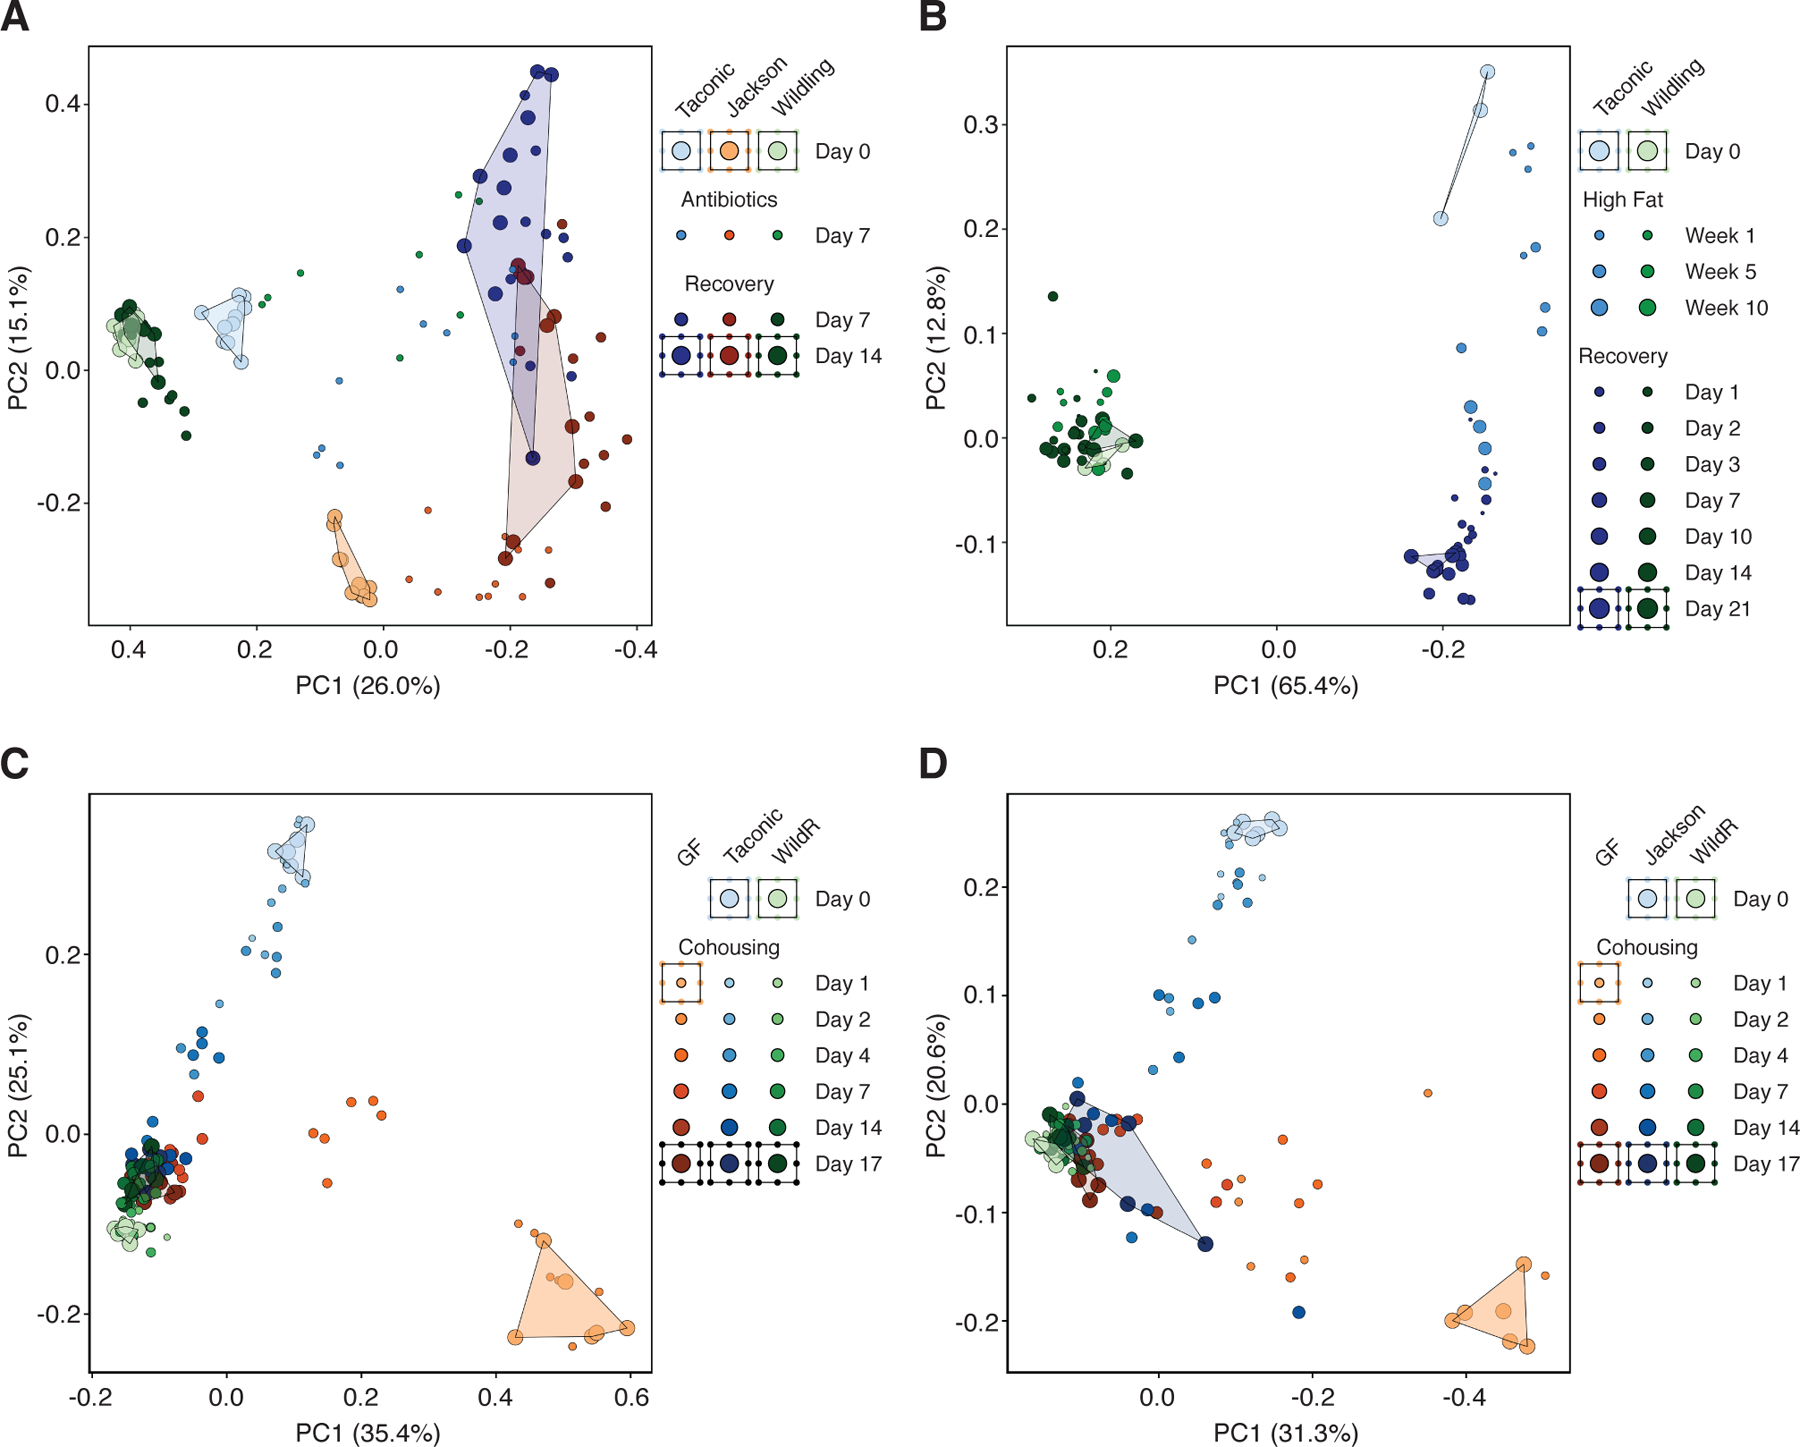
16S rRNA gene profiling data of bacterial gut microbiota during strong environmental disturbances, displayed by unweighted UniFrac PCoA’s. (A) Antibiotic challenge (amoxicillin/clavulanate) of wildlings, and conventional laboratory mice from Taconic and Jackson.(B) Dietary challenge (high-fat diet) of wildlings and conventional laboratory mice from Taconic. (C,D) Microbiological challenge through cohousing of 3 mice: a B6 mouse with pathogen-free wild mouse gut microbiota (WildR), a germ-free C57BL/6 mouse (GF) and a B6 mouse with conventional laboratory gut microbiota from Taconic (C), or Jackson (D). Data in panel B are from one experiment with 3–4 mice per group; data in panels A, C and D are from two independent experiments with 5–6 mice per group.
Next, we asked if natural gut microbiota are better adapted to the mouse gastrointestinal niche than conventional laboratory microbiota. To probe this question, we utilized the coprophagic behavior of mice. Cohoused mice ingest the fecal pellets of cage mates, leading to an exchange of gut microbiota and subsequent microbial disturbance (28). The resilience of a gut microbiota can be evaluated by their persistence despite novel microbial exposure during cohousing. Likewise, their evolutionary adaption and fitness can be evaluated by their ability to invade the gastrointestinal niche of microbiologically distinct cage mates (28). Three mice were co-housed per cage: a pathogen-free B6 mouse with wild mouse gut microbiota (15), a B6 mouse with conventional laboratory gut microbiota from a commercial vendor, and a germ-free B6 mouse. We chose previously described WildR mice with pathogen-free wild mouse gut microbiota (15) for this experiment to assess the ecological succession of microbiota without bias from pathogen-induced disease or death. At the beginning of the experiment (day 0) gut microbiota of all mouse groups clustered separately. By days 7–17, the gut microbiota of conventional laboratory mice from Taconic and germ-free mice resembled the natural microbiota of WildR mice (Fig. 5C). In contrast, the microbiota of WildR mice did not shift throughout the course of the experiment. We repeated the experiment with conventional laboratory mice from Jackson and obtained similar results (Fig. 5D). In summary, natural microbiota are stable for at least five generations of Widlings. Natural bacterial gut microbiota are more resilient and better adapted to the mouse gut conventional laboratory microbiota.
Unlike standard laboratory models, the wildling model predicts the results of two clinical trials
Finally, we tested the translational research value of the wildling model. To that end, we utilized a retrospective bench-to-bedside approach, which required well-documented rodent-based studies that failed upon transitioning to clinical trials in humans.
First, we chose the CD28-superagonist (CD28SA) trial as representative for treatments targeting adaptive immune responses (29). In rodent preclinical trials, treatment with CD28SA monoclonal antibody efficiently activated and expanded anti-inflammatory regulatory T cells (Tregs) and was therapeutically effective in multiple models of autoimmune disease, inflammatory disease and transplantation (30, 31). However, the first human phase I clinical trial did not recapitulate the preclinical data. Rather, it resulted in an unexpected and devastating activation of inflammatory T cell subsets followed by a life-threatening cytokine storm (29). The expansion of Tregs was the misleading hallmark in the preclinical study that motivated further evaluation of the agent’s therapeutic potential in humans. We therefore assessed the expansion of Tregs upon CD28SA treatment in wildlings and conventional laboratory mice. At baseline, there was no difference in the absolute number of Tregs and a minor, but a significant difference in serum cytokine levels between both groups. As expected, conventional laboratory mice displayed a significant, approximately ninefold increase in the absolute number of splenic Tregs on day 4 post intraperitoneal CD28SA injection (Fig. 6A) accompanied by an increase in serum IL-10 (Fig. 6B). In contrast, wildlings showed no increase in Treg number and significantly less IL-10. Rather, they exhibited significantly higher levels of serum IFN-γ, IL-1β, IL-2, IL-4, IL-6, and TNF-α than laboratory mice (Fig. 6B). Thus, wildlings phenocopied the immune response observed in humans during the corresponding phase I trial (29).
Fig. 6. In contrast to standard laboratory models, the wildling model faithfully predicts the results of two clinical trials.
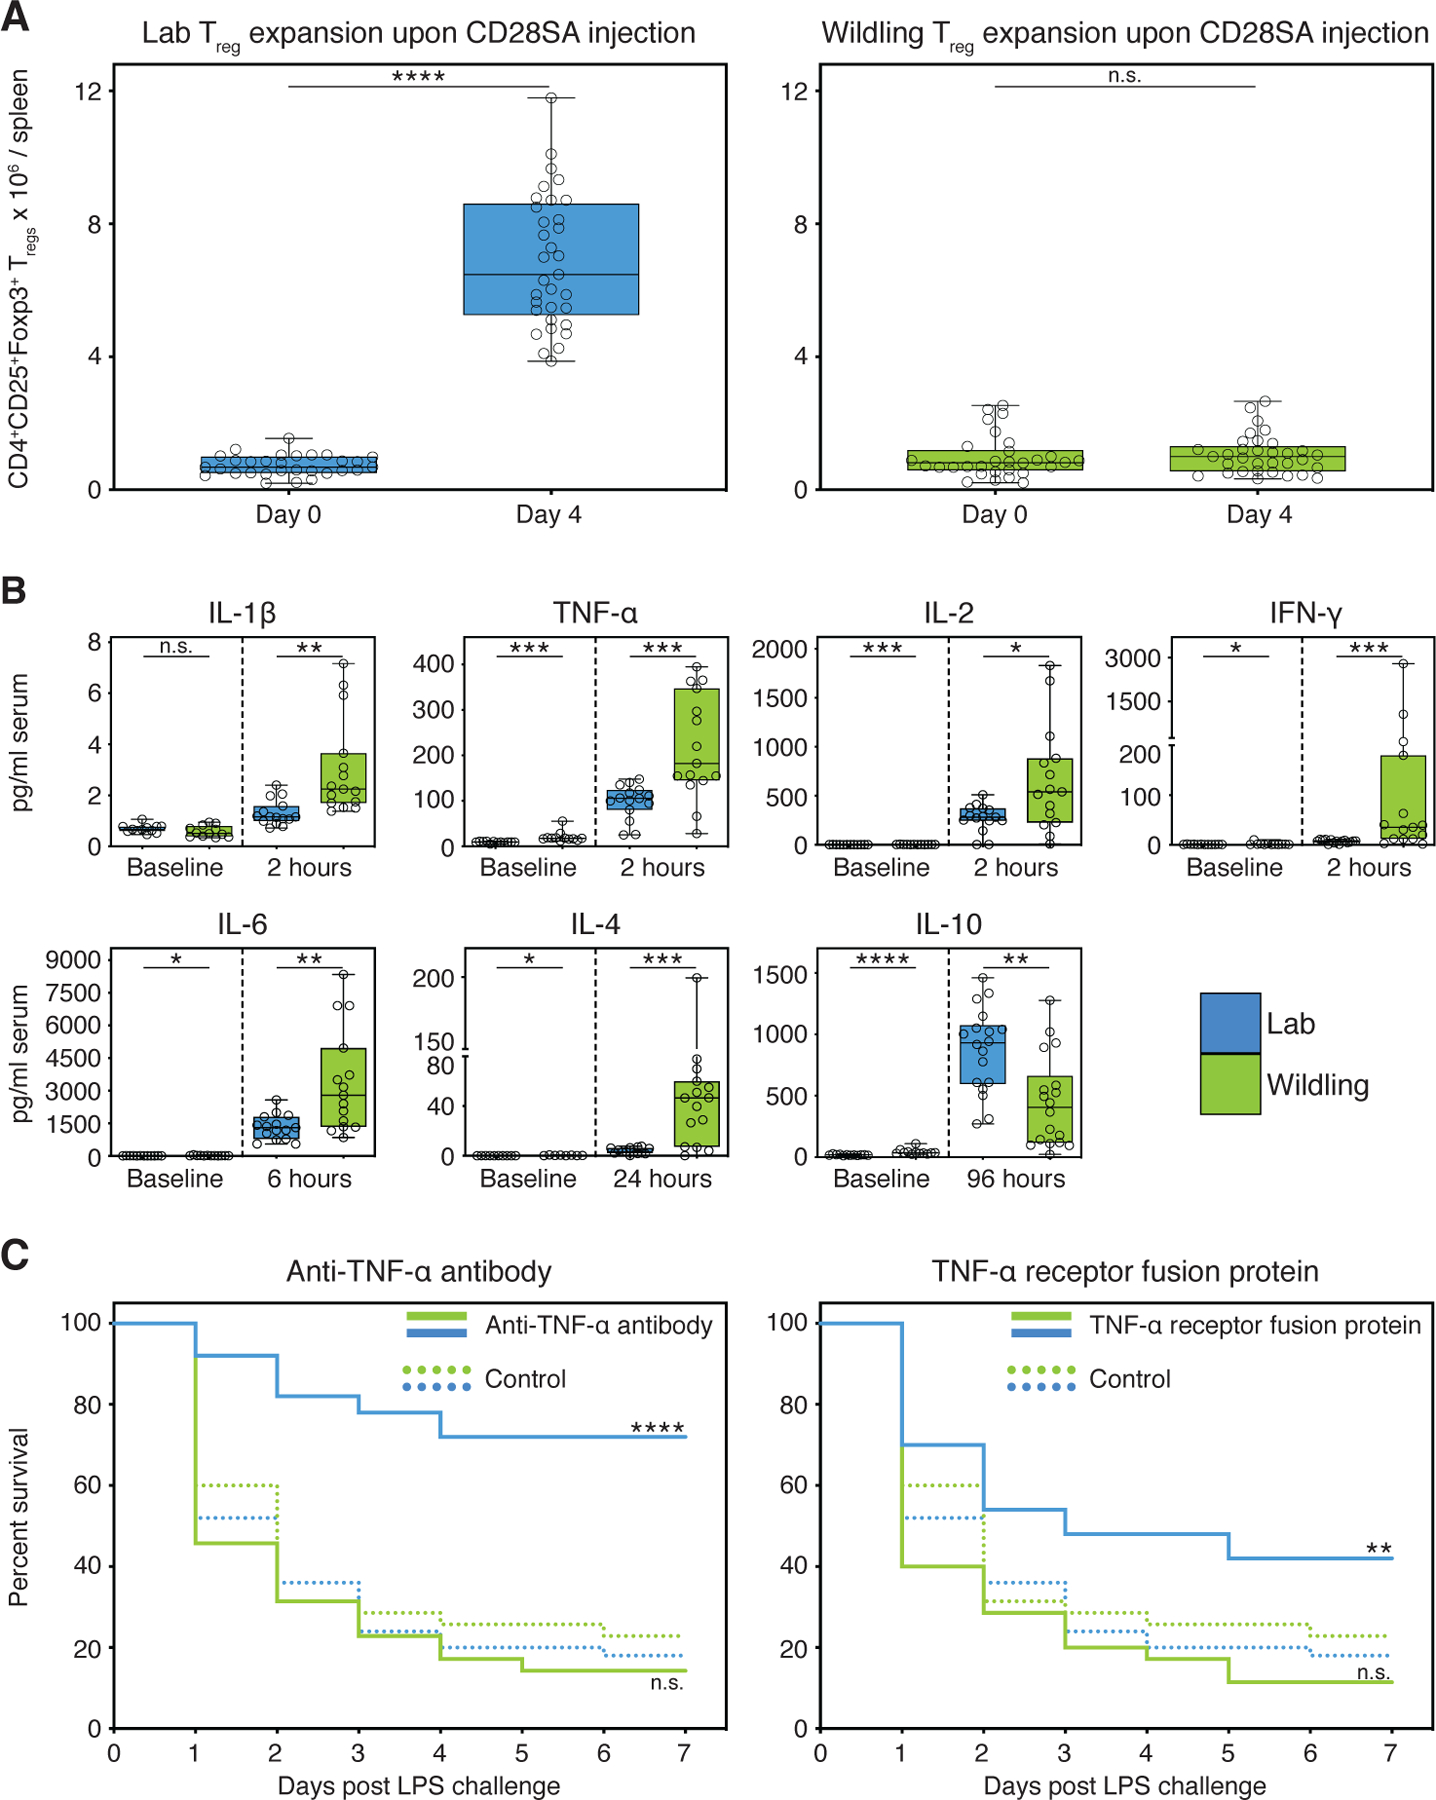
(A) Absolute numbers of Tregs at baseline (day 0) and day 4 post intraperitoneal CD28SA injection in wildlings and conventional laboratory mice (Lab). (B) Blood cytokine concentrations (pg/ml) at timepoint of greatest significant difference between wildlings and conventional laboratory mice. Significance was determined using unpaired two-tailed Student’s t-test (Gaussian model), or non-parametric Mann–Whitney U test. (C) Kaplan–Meier survival curves of wildlings in comparison to conventional laboratory mice (Lab). Mice were intraperitoneally injected with anti-TNF-α antibody, or TNF receptor:Fc fusion protein, or control antibody at hour −6, followed by a lethal intraperitoneal injection of Escherichia coli strain 0127:B8 LPS at hour 0. Data shown are from ≥ 3 independent experiments with 5–20 mice per group. Box plots show median, IQR (box), and minimum to maximum (whiskers). *P < 0.05, **P < 0.01, ***P < 0.001, ****P < 0.0001; as determined by log-rank (Mantel–Cox) analysis, n.s. = not significant.
As representative for trials targeting innate immune responses, we chose a multicenter human clinical trial that assessed the efficacy of anti-TNF-α treatment during septic shock (32). Preclinical animal models of sepsis generally fail to translate into the clinical setting, leaving an urgent need for better animal models of human sepsis (33). Originally discovered in a preclinical rodent trial, TNF-α blockade through passive immunization with TNF-α neutralizing antibody protected mice from death in the lipopolysaccharide (LPS) model of lethal endotoxemia (34). Subsequent preclinical studies with anti-TNF-α or TNF receptor:Fc fusion protein (TNFR:Fc) confirmed the protective effect, even when treatment was given shortly after the microbial or endotoxin insult (33). However, TNF-α blockade did not reduce mortality of patients with septic shock. On the contrary, higher doses of TNFR:Fc appeared to be associated with increased mortality leading to the early termination of the study due to harm (32). We therefore assessed the survival of wildlings and conventional laboratory mice that were treated with isotype control antibody, anti-TNF-α, or TNFR:Fc in the LPS model of lethal endotoxemia. The two mouse groups did not differ in their survival when treated with isotype control antibody (Wildling 23%, Lab 18% survival). As expected, conventional laboratory mice treated with anti-TNF-α had a 54% higher survival rate than the corresponding isotype control group (Fig. 6C). In contrast, anti-TNF-α treatment did not increase the survival rate of wildlings. As observed in the clinical trial, the survival rate of the treatment group was lower than in the corresponding isotype control group, although this difference was not significant (Fig. 6C). Consistent results were obtained with TNFR:Fc treatment (Fig. 6C). Thus, wildlings better recapitulate human immune responses than conventional laboratory mice in selected preclinical models.
Concluding remarks
The mammalian microbiome is an extremely diverse ecosystem comprised of all host-associated microorganisms (bacteria, viruses, fungi, protozoans, and multicellular organisms) present at all epithelial barrier sites, and its complexity is likely potentiated by trans-kingdom interactions between these commensals. (3, 24). Together with host genetics, this complex ecosystem shapes the meta-organism and its physiology through multi-factorial, non-linear interactions (3, 24). Experimental models of translational research must navigate this complexity, and it appears impossible to fully decipher multi-factorial microbiota-related physiological mechanisms by focusing exclusively on one component of the microbiome (e.g., bacteria). Rather, a full description of the microbiome is prerequisite to mechanistic studies. To date, few studies have characterized the mycobiome (35, 36) and virome (26) and no study has accounted for all microbial components simultaneously in distinct immunological barriers to clearly define an experimental model system. In this regard, our study is a valuable resource for other investigators and may facilitate a better understanding of multi-factorial microbiota-related mechanisms.
It is now widely accepted that the mammalian phenotype is largely driven by the combination of the host genome and microbial genome, together referred to as the metagenome. The immune phenotype of wild-living Mus musculus domesticus and pet store mice differs significantly from that of conventional laboratory mice (18, 37). However, the relative contributions of the host versus the microbial genome in driving these phenotypic differences remain unknown. Our experimental approach isolates the microbial genome on an isogenic background in a controlled environment, allowing us to estimate the relative contributions of the host genome and the microbial genome to the immune phenotype of different organs. These data emphasize the vast differences between the laboratory and the natural mammalian meta-organism.
Conflicting research results rooted in divergent microbiota among different facilities are a concern to the scientific community (1–3). Some researchers propose that standardized microbiota shared between institutions (12, 13) may improve reproducibility, but no candidate for a standard microbiome has been identified and standardized microbiota might not be desirable in all situations (3). Standard microbiota must either be stable across generations and/or readily refreshable from a sustainable source (e.g. wild mice) in addition to possessing resilience against abiotic and microbiological environmental challenges. Whereas conventional laboratory microbiota readily change upon minor environmental disturbances (14), we now demonstrate that natural microbiota are resilient to major disturbances and better adapted to the mouse gastrointestinal tract. The stability and resilience of natural gut microbiota are important characteristics for a standardized microbiome and may aid studies in which institutions deem a sharable microbiota feasible and beneficial.
Although the study of human gut microbiota in mice can provide insight into certain traits such as microbiota-associated obesity (38), mice colonized with human microbiota also display global immune defects similar to those observed in germ-free mice and suffer higher susceptibility to enteric and disseminated infections (39). Thus, a host-specific microbiome appears critical for a healthy immune system. The wildling model, alternatively, implements a host-specific combination of complex natural microbiota and pathogens. The study of this meta-organism may reveal mechanisms that are relevant for all mammals, including humans. Reproducible phenotypes and disease mechanisms (e.g. response to drug treatments) identified within this complex model should better mirror the antigen-experienced immune responses of humans, as shown here for two preclinical studies in the field of autoimmune/inflammatory diseases and sepsis. In both preclinical studies, the wildling model but not the conventional laboratory mouse model phenocopied the response of humans and could have prevented two major failed clinical trials. However, it is important to recognize that faithful prediction of human responses to therapeutic interventions requires both a physiologically relevant model and an optimal experimental strategy to fully mirror clinical conditions. In this regard, the published preclinical trials of TNF-α blockade started treatment earlier than feasible in clinical settings (33).
We anticipate that the wildling model could be used more widely because immunotherapy, in particular with antibody-based drugs, is becoming an increasingly important strategy for the treatment of a wide range of diseases including transplant rejection, graft-versus-host diseases, cancer, infectious diseases, allergies, various autoimmune and inflammatory diseases, and even cardiovascular diseases (40). Given the wide-ranging effects of the microbial genome on host physiology, natural microbiota may benefit different research fields (e.g. metabolism and neurodegenerative diseases) and may also be applicable to other animal models. Ultimately, this approach may be combined with the collaborative cross (41) to implement a complex microbiome alongside complex host genetics and thereby better mirror the physiology of the heterogenous human population. Such models may enhance the validity and reproducibility of biomedical studies among research institutes, facilitate the discovery of disease mechanisms and treatments that cannot be studied in regular laboratory mice, and increase the translatability of immunological results from animal models to humans.
Materials and Methods
Mice and housing conditions
Wild mice (Mus musculus domesticus), wildlings (C57BL/6NTac mice with wild mouse bacterial, viral and fungal microbiome at all body sites and pathogens), WildR mice (C57BL/6NTac mice with pathogen-free wild mouse gut microbiome (15)), and conventional C57BL/6 from Taconic Biosciences and The Jackson Laboratory were used for this study.
Wild mice (Mus musculus domesticus) were trapped in geographically distinct horse stables throughout Maryland and the District of Columbia (USA) using autoclaved live animal aluminum traps (H. B. Sherman) with peanut butter as bait as previously described (15). In general, traps were checked twice daily (8 am and 8 pm) to avoid long captivity times. Animals were pre-selected based on appearance to exclude other animals such as deer mice and young/immature mice (15). The remaining wild mice were brought to an NIH animal facility (separate from other animal facility rooms) and housed in microisolator cages under static conditions for subsequent procedures.
Wildlings were generated through inverse germ-free rederivation. Briefly, embryos of C57BL/6 mice were generated in vivo at the NIDDK animal facility, isolated, and stored in the liquid phase of a liquid nitrogen tank for subsequent surgical embryo transfer (42). Thirty trapped male wild mice were surgically vasectomized and after recovery paired with adult female wild mice to generate pseudo-pregnant females (42). Subsequently, we surgically transferred C57BL/6 embryos into 23 timed pseudo-pregnant wild mice. Eleven of these wild mice gave birth to a healthy litter of C57BL/6 offspring (48% success rate). We used these litters to establish a wildling breeding colony. Data are from generation F2 through F5, unless otherwise stated. Due to the presence of multiple pathogens (Table S2), wild mice and wildlings were handled under BSL2 conditions with three practices in an animal facility room separate from standard SPF facilities. Mice were housed under a 12:12 light:dark cycle in microisolator cages under static conditions with autoclaved rodent chow (NIH-31 open formula) and autoclaved tap water ad libitum, autoclaved Nestlets (Enviropak) and bedding (Sani-Chips from Aspen). Breeding cages housed two wildlings per cage. To minimize potential divergence of microbiota and cage effects, pups from several wildling breeding cages were weaned into one large mouse cage (1355 square centimeters interior floor area/cage, Lab Products). Subsequent wildling breeders were sourced from different large cages to facilitate constant microbial cross-exposure of mice within the colony. For experiments, five wildlings were housed per cage (Lab Products; 484 square centimeters interior floor area) unless otherwise stated.
WildR mice were sourced from our previously published WildR colony (15). That colony was generated by oral gavage of bio-banked ileocecal content from specific-pathogen-free wild mice into pregnant C57BL/6 mice from Taconic Biosciences (15). The WildR colony was maintained in isolators, food, water, bedding, and nesting materials matched those of wildling mice.
Conventional specific-pathogen-free C57BL/6 (B6) mice from Taconic Biosciences and/or The Jackson Laboratory between 8–12 weeks of age were included in all experiments with wildlings and wild mice. These were non-randomized, sex- and age-matched.
The number of animals needed to reach statistical significance was determined on the basis of previous experience. Investigators were not blinded. Female mice were used for all experiments unless otherwise stated. All studies and procedures were performed in accordance with the Guide for the Care and Use of Laboratory Animals under an animal study proposal approved by the NIDDK Animal Care and Use Committee in American Association for the Accreditation of Laboratory Animal Care (AALAC)-accredited animal facilities at the National Institute for Diabetes, Digestive and Kidney Diseases (NIDDK).
Assessment of microbiome resilience (antibiotic treatment, high-fat diet challenge and co-housing studies)
For the antibiotic challenge experiment, wildlings, and conventional laboratory B6 mice (Taconic Biosciences, The Jackson Laboratories) were treated in groups of five animals per cage with amoxicillin/clavulanate (SANDOZ) in drinking water at a final concentration of 0.5 mg/ml amoxicillin and 0.07 mg/ml clavulanate for a duration of 7 days. Bottles were changed on a daily basis. Antibiotic treatment was discontinued at day 7 and mice were followed for a recovery period of 14 days. Two experiments with three experimental groups (wildlings, conventional laboratory mice from Taconic Biosciences and conventional laboratory mice from The Jackson Laboratory). Fecal pellets were collected from each mouse on day 0 (baseline), day 7 (end of antibiotic treatment period) and days 7 and 14 (antibiotic recovery period).
For the HFD challenge experiment, wildlings and conventional laboratory B6 mice (Taconic Biosciences) were switched from standard rodent chow (NIH-31 open formula) to high-fat, choline-deficient diet (Research Diets Inc.), which they received in groups of four animals/cage for 10 weeks. Mice were then returned to standard rodent chow and followed for a recovery period of 3 weeks. Fecal pellets were collected from each mouse on day 0 (chow diet baseline), days 7, 35, and 70 (HFD treatment period) and days 1, 2, 4, 7, 14, and 21 (chow diet recovery period).
To assess the resilience of natural microbiota upon novel microbial exposure, previously described WildR mice with natural pathogen-free gut microbiota (15) were co-housed with germ-free mice and conventional B6 mice. WildR mice rather than wildlings were chosen to assess the ecological succession of microbiota without bias from pathogen-induced disease or death. Each experiment was performed in separate isolators, each with six microisolator cages (with lids). Every experimental cage contained three age-matched cohoused mice: one C57BL/6 mouse with natural pathogen-free wild mouse microbiota (15), one C57BL/6 mouse with conventional laboratory microbiota (Taconic Biosciences, or The Jackson Laboratory), and one germ-free C57BL/6 mouse. In addition, we used two separate control isolators throughout the duration of the experiment. One control isolator with two microisolator cages (with lids), each holding one age-matched C57BL/6 mice with natural pathogen-free wild mouse microbiota (15) and another control isolator with two microisolator cages (with lids), each holding one age-matched C57BL/6 mice with conventional laboratory microbiota (Taconic Biosciences, or The Jackson Laboratory). Fecal pellets were collected from each mouse on days 0, 1, 2, 4, 7, 14, and 17 for subsequent 16S rRNA gene profiling.
Harvest and storage of mouse tissue, serum and plasma, gut, skin, and vaginal microbiota
Gut microbiota analysis was based on cecal material, unless otherwise stated. Mucosal-associated and luminal microbiota were harvested from cecal material as previously described (15). Fecal pellets were collected for some experiments as indicated (Fig. 5 and Fig. S5). To harvest skin microbiota, ears were excised from three mice under sterile conditions and pooled into a sterile DNA-free Eppendorf Biopur® tube containing 600 μl of PBS. This was followed by shaking at 1,000 rpm and 37°C for 30 min and centrifugation at 5,000 × g for 10 min. After removal of the supernatant, pellets were snap-froze and stored at −80°C. To harvest vaginal microbiota, vaginas were carefully swabbed through a gentle rotating motion to reduce host DNA contamination, while avoiding any contamination with skin microbiota (COPAN Diagnostics Inc., FLOQSwab certified DNA free). Vaginal samples were processed identically to skin samples with the exception of shaking at 20°C. All samples were frozen at −80°C until use. Blood was drawn via cardiac puncture and processed in either Serum micro tubes Z-Gel (Sarstedt) or K2 EDTA Plasma tubes (Sarstedt) according to manufacturer recommendations, snap-frozen, and stored at −80°C.
DNA extraction from cecal, fecal, vaginal, and skin samples
Cecal and fecal DNA was extracted with the MagAttract PowerMicrobiome DNA/RNA Kit (Qiagen) following the manufacturer’s instructions; all steps were automated on liquid handling robots (Eppendorf, epMotion 5075 and epMotion 5073). For skin and vaginal samples, 600 μl of solution PM1 (Qiagen) were added to the pellets obtained from vaginal and skin preparations, followed by mechanical disruption in a TissueLyser LT (Qiagen) at 30 Hz. Subsequently, DNA was extracted using AllPrep PowerViral DNA/RNA Kit (Qiagen) following the manufacturer’s instructions and frozen in DNA LoBind Tubes (Eppendorf).
16S rRNA gene sequencing and compositional analysis
The gene-specific sequences used in this protocol target the 16S V4 region (515F-806R). Next-generation 16S sequencing was carried out on the Illumina MiSeq platform (using a paired-end 2×300bp reads). The 16S (V4) data was analyzed using DADA2 (43) to obtain sequence variants which were analyzed at the phylum and family levels and visualized using the R package “phyloseq” (44). Differences between Lab, Wild, and wildlings were visualized using Principle Coordinate Analysis (45) and the significance of group differences was estimated by PERMANOVA (46). Differential abundance of taxa was analyzed using DESeq2 (47). Additionally, multiple other helper functions and graphing tools were utilized in the R environment.
For data displayed in Fig. 5C and D, rarefied biom-format tables were processed using R version 3.5.0 with multiple packages and graphing tools, the R packages phyloseq (1.24.0) and vegan (2.5–2) were used for downstream analysis.
Shotgun metagenomics and compositional analysis
NGS paired-end libraries were built using the Nextera FLEX kit (Illumina). Next-generation sequencing was carried out on the Illumina HiSeq platform. Bioinformatic analysis was done using an in-house package in R (JAMS v1.13 - https://github.com/johnmcculloch/JAMS_BW). Briefly, sequencing reads were quality-trimmed and adapter clipped using Trimmomatic (48). Reads were then aligned to the Mus musculus genome (all chromosomes plus mitochondria) to filter out host reads with Bowtie2 (49). Unaligned reads were then assembled using Megahit version v1.1.3 (50). The resulting contigs were annotated using Prokka v1.13 (51) also yielding the predicted proteome. The trimmed sequencing reads were aligned back to the metagenomic contigs using Bowtie2 to gauge depth. Reads unaligned to the contigs (unassembled reads) were collected. The metagenomic contigs and the unassembled reads were taxonomically classified by k-mer analysis using kraken v1.0 (52) with a custom-build database comprising of all the complete and draft genome sequences in GenBank of all Bacteria, Archaea, Fungi, Viruses, Protozoa plus the genomes of Mus musculus and Homo sapiens. Each sequence classified (either contig or read) was attributed to its Last Known Taxon (LKT). The relative abundance of each Last Known Taxon in the sample was computed by the number of bases covering contigs belonging to that LKT plus the number of bases from unassembled reads belonging to that LKT divided by the total number of bases sequenced in that sample. The R programming language (v3.5.0) was used to integrate all metagenomic data. Heatmaps were plotted using the ComplexHeatmap package v3.8 (53).
Mycobiome sequencing analysis, Illumina library generation and sequencing
Mouse fungal microbiomes were sequenced using the Illumina MiSeq platforms. Fungal ITS1–2 regions were amplified by PCR using primers modified to include sample barcodes and sequencing adaptors. Fungal primers: ITS1F 5′-CTTGGTCATTTAGAGGAAGTAA-3′; ITS2R 5′-GCTGCGTTCTTCATCGATGC-3′. ITS1 amplicons were generated with 35 cycles, whereas 16S amplicons were generated with 25 cycles using Invitrogen AccuPrime PCR reagents (Carlsbad, CA). Amplicons were then used in the second PCR reaction, using Illumina Nextera XT v2 (San Diego, CA) barcoded primers to uniquely index each sample and 2 × 300 paired end sequencing was performed on the Illumina MiSeq (Illumina, CA). DNA was amplified as follows: Initial denaturation at 94°C for 10 min, followed by 40 cycles of denaturation at 94°C for 30 sec, annealing at 55°C for 30 sec, and elongation at 72°C for 2 min, followed by an elongation step at 72°C for 30 min. Quality control was performed using qPCR, DNA 1000 Bioanalyzer (Agilent), and Qubit (Life Technologies). Raw FASTQ ITS1 sequencing data were filtered to enrich for high quality reads, removing the adapter sequence by cutadapt v1.4.1 or any reads that do not contain the proximal primer sequence (54). Sequence reads were then quality-trimmed (54). These reads were aligned to Targeted Host Fungi (THF: https://risccweb.csmc.edu/microbiome/thf/) ITS1 database, using BLAST v2.2.22 and the pick_otus.py pipeline in QIIME v1.6 with an identity percentage ≥ 97% for operational taxonomic unit (OTU) picking (55). The alignment results were then tabulated across all reads, using the accession identifier of the ITS reference sequences as surrogate OTUs and using a Perl script (54). The R packages Phyloseq (1.16.2) and Vegan (2.4–3) were used for downstream analysis. R version 3.3.1 was used.
Next-generation virome sequencing and compositional analysis
Cecal samples were diluted in PBS and 0.45-μm-filtered. Supernatant was extracted for total nucleic acid, including both DNA and RNA. To detect both DNA and RNA viruses, total nucleic acid was subjected to sequence independent DNA and RNA amplification (56, 57). We prepared libraries using nucleic acids isolated from the filtered cecal samples. Next-generation sequencing was carried out on a single run of 24 samples, using the paired-end 2 × 250 nt Illumina MiSeq platform (58). VirusSeeker Virome (59) was used to detect sequences with nucleotide- and protein-level sequence similarity to known viruses. Sequences were adapter-trimmed, joined if paired-end reads overlapped, and quality controlled. Viral sequences were queried against the NCBI nt/nr databases, and sequences exclusively matched to viral sequences were retained for analysis. Virus-aligning sequences were classified into families based on NCBI taxonomic identity. Read counts were normalized by dividing taxa counts by the average sequencing depth per sample (i.e., approximately 250,000 filtered unique reads per sample). Filtering was applied by removing taxa present in fewer than five reads at a normalized read depth. Diversity and other ecological analyses were calculated using the vegan package (Oksanen J, et al (2015). vegan: Community Ecology Package. R package version 2.3–1. in R.
Pathogen screening
Blood drops dried on EZ-SPOT® (Charles River Laboratories), body swabs, oral swabs, fecal pellets, and lung tissue were harvested according to Charles River Laboratories sampling guidelines and screened for pathogens by PCR and Serology with the Mouse PRIA™ (PCR Rodent Infectious Agent) Panel Surveillance Plus and the Serology Profile Assessment Plus by Charles River infectious agent testing (Charles River Laboratories). A mouse was considered pathogen-exposed if it tested positive in at least one of these assays.
Mass cytometry
Mononuclear cells from liver, spleen, gastrointestinal tract lamina propria, skin, and vagina were harvested and processed as previously described (60, 61). Metal-labeled antibodies were purchased from Fluidigm or conjugated in-house with Maxpar (MP) antibody conjugation kits (Fluidigm) following the manufacturer’s protocol. The antibody panel and reagents summary can be found in Table S3. Each antibody was validated, titrated and the optimal staining concentration used in the panel. Washes and incubations were performed with Maxpar Cell Staining Buffer (MP CSB) unless otherwise specified. A total of 1 × 10⁶ cells per sample were transferred in a 96-well plate and washed with MP PBS. Individual samples were incubated with 2.5 μM Cisplatin (Fluidigm) at 1 × 10⁷ cells per ml in MP PBS for 3 min on ice, followed by two washes and pre-incubated with Fcreceptor blocking solution (rat anti-mouse CD16/32, clone 93, Biolegend, at 5 μg/ml in MP PBS supplemented with 0.5% BSA) for 15 min on ice. Cells were then stained for CD5, CD8b, FcεRI, Siglec F, Thy1.1, Thy1.2, and TCR antigens with the antibodies described in Table S3 for 30 min on ice. After washing twice, cells were fixed in 1.6% paraformaldehyde in MP PBS for 10 min at room temperature. Individual samples were barcoded using six palladium metal isotopes according to the manufacturer’s instructions (Cell-ID 20-plex Pd barcoding kit; Fluidigm) to reduce tube-to-tube variability. Up to 18 samples per tissue were combined and subsequently stained as multiplexed sample by incubating with the remaining antibodies for 30 min at 4°C. For staining of intranuclear Foxp3, GATA3, T-bet, and RORγt antigens, samples were subsequently stained with the respective antibodies (Table S3) in MP Nuclear Antigen Staining Buffer Set (Fluidigm) for additional 30 min at room temperature. Finally, samples were washed twice and incubated in 125 nM 191/193Ir DNA intercalator solution (Cell-ID Intercalator-Ir in Maxpar Fix/Perm buffer) overnight at 4°C. Prior to acquisition on a Helios mass cytometer, samples were washed twice with MP CSB and once with MP water. Data were normalized for detector sensitivity by adding five-element beads to the sample and processed as previously described (62).
Pre-processing of mass cytometry data
Samples were debarcoded using the Zunder lab single-cell debarcoder (https://github.com/zunderlab/single-cell-debarcoder) in MATLAB and files uploaded in Cytobank. Raw data were manually gated to exclude debris, doublets, dead cells, normalization beads and live single CD45 cell events (193Ir_DNA+, 195Pt_Cisplatin-, 140Ce_EQbeads-) were exported from Cytobank.
Automated population identification in high-dimensional data analysis
Gated FCS file data were subjected to arcsinh transformation (cofactor = 5) and clustering was performed with Rphenograph (https://bioconductor.org/packages/release/bioc/vignettes/cytofkit/inst/doc/cytofkit_example.html) (63) using the default settings for Rphenograph and all markers in the panel with the exception of CD45 and the blocking marker CD16/32. The resulting cell cluster datasets were used for generation of a global lineage t-SNE map and unsupervised heatmap for each tissue. Expert-guided definition of cell clusters was done based on heatmaps of median expression values of the initial PhenoGraph nodes. A generalized linear mixed model and general linear hypothesis testing were used to identify significantly differentially abundant clusters between conventional laboratory mice and wild mice (P < 0.05). The proportion of cells from each sample belonging to each cluster was determined and hierarchical clustering was applied to the arcsinh scaled and z-score normalized proportion values for each of the significant clusters. Functions for normalization and the identification of significantly differentially abundant clusters between populations were adapted from the Robinson workflow (64).
RNA sequencing of mouse total peripheral blood mononuclear cells
Blood was collected at baseline via cardiac puncture into K2 EDTA Plasma tubes (Sarstedt). Red blood cells were lysed with ACK lysis buffer, cells were washed, gently pelleted and resuspended in 500 μl of TRIzol (Invitrogen Life Technologies). RNA was extracted using TRIzol according to manufacturer’s instructions. rRNA was removed using the NEBNext rRNA Depletion Kit (NEB), followed by cDNA library preparation using the NEBNext Ultra RNA Library Prep Kit for Illumina (NEB). The libraries were sequenced on illumina HiSeq 3000 and the sequenced reads were aligned to the mouse genome using TopHat (65, 66). Cufflinks and Cuffdiff were used to quantify transcripts and determine differential expression (65, 66). Further analysis and visualization were performed using PARTEK and R.
CD28SA study including flow cytometry and serum cytokine assessment
The monoclonal antibody CD28SA was purified from tissue culture supernatant from D665 hybridoma (kindly provided by T. Hünig) at Bio X Cell® at low endotoxin formulation (< 0.5 EU/mg) and negative for infectious agents in a MAP2 screening. CD28SA was injected intraperitoneally at a dose of 300 μg per mouse. At the indicated time points relative to CD28SA injection, animals were euthanized and spleens were processed. Processed cells were counted using the Cellometer Auto 2000 Cell viability counter (Nexcelom Bioscience). Cell viability was determined using Zombie Aqua™ Fixable Viability Kit (Biolegend), followed by Fc-Block (2.4G2). The cell surface antigens CD4, CD8a, CD25, Thy1.2, NK1.1, CD11b, and B220 were stained with antibodies listed in Table S4. The intranuclear antigen Foxp3 was stained with the corresponding antibody (Table S4) using the Foxp3/Transcription Factor Staining Buffer Set (Affymetrix eBiosciences) following the manufacturer’s instructions. All antibodies were purchased from either BD Biosciences, Biolegend, or Affymetrix eBiosciences (Table S4). The stained samples were acquired using an LSRII flow cytometer (Becton Dickinson) and analyzed with FlowJo software (Tree Star, Inc.) using the gating strategy described in Fig. S5. The antibody panel and reagents summary can be found in Table S4. Mice were euthanized at baseline and multiple timepoints post-intraperitoneal injection of CD28SA. Blood was collected via cardiac puncture, serum was processed, snap-frozen and stored at −80°C until cytokine measurement. Serum cytokines and chemokines were quantified using the Mouse VPLEX Plus Pro-Inflammatory Panel 1 Mouse Kit (Meso Scale Discovery) following the manufacturer’s instructions.
TNF-α neutralization study
Monoclonal TNF-α antibody (clone XT3.11, InVivoPlus) and isotype control (clone HRPN, InVivoPlus) were purchased from Bio X Cell® at low endotoxin formulation and negative for infectious agents in a MAP2 screening, TNF receptor:Fc fusion protein ENBREL® (etanercept) from Amgen. Female mice were intraperitoneally injected with either TNF-α blocking treatment (50 mg/kg body weight anti-TNF-α, or 10 mg/kg body weight TNFR:Fc, or 50 mg/kg body weight isotype control antibody 6 hrs before intraperitoneal LPS injection). At hour 0, we intraperitoneally injected a lethal dose (60 mg/kg body weight) of Escherichia coli strain 0127:B8 LPS (Sigma). Animals were monitored for 1 hr after LPS injection, then every 2 hrs during the first day and multiple times daily thereafter including weighing once daily for 7 days post LPS injection. The study endpoints were death, moribundity, or weight loss > 30% of the initial body weight. Moribund mice and animals with a weight loss of 30% or more were euthanized and scored as dead.
Statistical analysis
Data were subjected to the D’Agostino–Pearson omnibus normality test. If a Gaussian model of sampling was satisfied, parametric tests (unpaired two-tailed Student’s t-test for two groups, or one-way ANOVA with Tukey multiple comparison with 95% confidence interval for more than two groups) were used. Otherwise, non-parametric t-tests were used (Mann–Whitney U test for two groups, or Kruskal–Wallis H test with Dunn’s multiple comparison for more than two groups). Analyses were performed with GraphPad Prism 6.0f (GraphPad Software) unless otherwise stated. Two-tailed P-values less than 0.05 were considered significant.
Supplementary Material
Acknowledgements:
We thank C. Ohuigin, G. Wallace, and V. Thovarai (Cancer Inflammation Program Microbiome and Genetics Core, NCI) for 16S rRNA gene sequencing; B. Tran (Sequencing Facility at Leidos Biomedical Research, Inc / Frederick National Laboratory for Cancer Research) for metagenomic sequencing; the staff of the University of Virginia flow cytometry facility for acquisition and normalization of CyTOF data; T. Hünig (University of Würzburg Germany) for providing the D665 hybridoma producing CD28SA; H. Lu (NIDDK) for advice on the surgical embryo transfer; and G. Nolan and S.Y. Chen (Stanford University) for advice on the CyTOF analysis.
Funding:
This study was supported by the intramural research programs of NIDDK, NCI, NIAMS and NIAID and the NIH DDIR’s Innovation Award. A.A.S. was supported by postdoctoral fellowship 2015-06376 from the Swedish Resarch Council, I.L. by the Crohn’s and Colitis Foundation award, S.T. by European Molecular Biology Organization fellowship ALTF1535-2014 and by the ARC Foundation for Cancer Research, B.H. by research fellowship HI 2088/1-1 from the Deutsche Forschungsgemeinschaft, and I.D.I. by NIH grants DK113136, AI137157-01, the Kenneth Rainin Foundation, and the Crohn’s and Colitis Foundation Senior Research Award.
Abbreviations
- B6
C57BL/6
- Lab
conventional laboratory mouse
- E. coli
Escherichia coli
- gut
gastrointestinal tract
- GSEA
gene set enrichment analysis
- HFD
high-fat choline-deficient diet
- LPS
lipopolysaccharide
- CyTOF
mass cytometry
- MP
Maxpar
- PRIA™
PCR Rodent Infectious Agent
- PCA
principal component analysis
- PCoA
principal coordinates analysis
- RPKM
Reads Per Kilobase Million
- SPF
specific-pathogen-free
- CD28SA
superagonistic CD28-specific monoclonal antibodies
- t-SNE
t-Distributed Stochastic Neighbor Embedding
- TNFR:Fc
TNF receptor:Fc fusion protein
- Tregs
regulatory T cells
- Wild
wild mouse
Footnotes
Competing interests:
Authors declare no competing interests. S.P.R. and B.R. disclose that Taconic Biosciences licensed WildR mice with natural gut microbiota from NIDDK.
Data and materials availability:
Raw sequence data from all 16S, ITS1–2, viral sequencing, shotgun metagenomics and RNA sequencing experiments are deposited in the NCBI Sequence Read Archive under BioProject accession number PRJNA540893.
References and Notes:
- 1.Ivanov II et al. , Induction of intestinal Th17 cells by segmented filamentous bacteria. Cell 139, 485–498 (2009). [DOI] [PMC free article] [PubMed] [Google Scholar]
- 2.Servick K, Of mice and microbes. Science 353, 741–743 (2016). [DOI] [PubMed] [Google Scholar]
- 3.Stappenbeck TS, Virgin HW, Accounting for reciprocal host-microbiome interactions in experimental science. Nature 534, 191–199 (2016). [DOI] [PubMed] [Google Scholar]
- 4.von Herrath MG, Nepom GT, Lost in translation: barriers to implementing clinical immunotherapeutics for autoimmunity. J Exp Med 202, 1159–1162 (2005). [DOI] [PMC free article] [PubMed] [Google Scholar]
- 5.Hay M, Thomas DW, Craighead JL, Economides C, Rosenthal J, Clinical development success rates for investigational drugs. Nat Biotechnol 32, 40–51 (2014). [DOI] [PubMed] [Google Scholar]
- 6.Seok J et al. , Genomic responses in mouse models poorly mimic human inflammatory diseases. Proc Natl Acad Sci U S A 110, 3507–3512 (2013). [DOI] [PMC free article] [PubMed] [Google Scholar]
- 7.Mestas J, Hughes CC, Of mice and not men: differences between mouse and human immunology. J Immunol 172, 2731–2738 (2004). [DOI] [PubMed] [Google Scholar]
- 8.Shay T et al. , Conservation and divergence in the transcriptional programs of the human and mouse immune systems. Proc Natl Acad Sci U S A 110, 2946–2951 (2013). [DOI] [PMC free article] [PubMed] [Google Scholar]
- 9.Mak IW, Evaniew N, Ghert M, Lost in translation: animal models and clinical trials in cancer treatment. Am J Transl Res 6, 114–118 (2014). [PMC free article] [PubMed] [Google Scholar]
- 10.Payne KJ, Crooks GM, Immune-cell lineage commitment: translation from mice to humans. Immunity 26, 674–677 (2007). [DOI] [PubMed] [Google Scholar]
- 11.Omary MB et al. , Not all mice are the same: standardization of animal research data presentation. Hepatology 63, 1752–1754 (2016). [DOI] [PubMed] [Google Scholar]
- 12.Hooper LV, Littman DR, Macpherson AJ, Interactions between the microbiota and the immune system. Science 336, 1268–1273 (2012). [DOI] [PMC free article] [PubMed] [Google Scholar]
- 13.Macpherson AJ, McCoy KD, Standardised animal models of host microbial mutualism. Mucosal Immunol 8, 476–486 (2015). [DOI] [PMC free article] [PubMed] [Google Scholar]
- 14.Ericsson AC et al. , The influence of caging, bedding, and diet on the composition of the microbiota in different regions of the mouse gut. Sci Rep 8, 4065 (2018). [DOI] [PMC free article] [PubMed] [Google Scholar]
- 15.Rosshart SP et al. , Wild mouse gut microbiota promotes host fitness and improves disease resistance. Cell 171, 1015–1028 e1013 (2017). [DOI] [PMC free article] [PubMed] [Google Scholar]
- 16.Beura LK et al. , Normalizing the environment recapitulates adult human immune traits in laboratory mice. Nature 532, 512–516 (2016). [DOI] [PMC free article] [PubMed] [Google Scholar]
- 17.Reese TA et al. , Sequential infection with common pathogens promotes human-like immune gene expression and altered vaccine response. Cell Host Microbe 19, 713–719 (2016). [DOI] [PMC free article] [PubMed] [Google Scholar]
- 18.Abolins S et al. , The comparative immunology of wild and laboratory mice, Mus musculus domesticus. Nat Commun 8, 14811 (2017). [DOI] [PMC free article] [PubMed] [Google Scholar]
- 19.Leung JM et al. , Rapid environmental effects on gut nematode susceptibility in rewilded mice. PLoS Biol 16, e2004108 (2018). [DOI] [PMC free article] [PubMed] [Google Scholar]
- 20.Belkaid Y, Hand TW, Role of the microbiota in immunity and inflammation. Cell 157, 121141 (2014). [DOI] [PMC free article] [PubMed] [Google Scholar]
- 21.Underhill DM, Iliev ID, The mycobiota: interactions between commensal fungi and the host immune system. Nat Rev Immunol 14, 405–416 (2014). [DOI] [PMC free article] [PubMed] [Google Scholar]
- 22.Iliev ID, Leonardi I, Fungal dysbiosis: immunity and interactions at mucosal barriers. Nat Rev Immunol 17, 635–646 (2017). [DOI] [PMC free article] [PubMed] [Google Scholar]
- 23.Virgin HW, The virome in mammalian physiology and disease. Cell 157, 142–150 (2014). [DOI] [PMC free article] [PubMed] [Google Scholar]
- 24.Norman JM, Handley SA, Virgin HW, Kingdom-agnostic metagenomics and the importance of complete characterization of enteric microbial communities. Gastroenterology 146, 1459–1469 (2014). [DOI] [PMC free article] [PubMed] [Google Scholar]
- 25.Lim ES, Wang D, Holtz LR, The bacterial microbiome and virome milestones of infant development. Trends Microbiol 24, 801–810 (2016). [DOI] [PubMed] [Google Scholar]
- 26.Pfeiffer JK, Virgin HW, Viral immunity. Transkingdom control of viral infection and immunity in the mammalian intestine. Science 351, (2016). [DOI] [PMC free article] [PubMed] [Google Scholar]
- 27.Bhattacharya S et al. , ImmPort: disseminating data to the public for the future of immunology. Immunol Res 58, 234–239 (2014). [DOI] [PubMed] [Google Scholar]
- 28.Seedorf H et al. , Bacteria from diverse habitats colonize and compete in the mouse gut. Cell 159, 253–266 (2014). [DOI] [PMC free article] [PubMed] [Google Scholar]
- 29.Suntharalingam G et al. , Cytokine storm in a phase 1 trial of the anti-CD28 monoclonal antibody TGN1412. N Engl J Med 355, 1018–1028 (2006). [DOI] [PubMed] [Google Scholar]
- 30.Tacke M, Hanke G, Hanke T, Hunig T, CD28-mediated induction of proliferation in resting T cells in vitro and in vivo without engagement of the T cell receptor: evidence for functionally distinct forms of CD28. Eur J Immunol 27, 239–247 (1997). [DOI] [PubMed] [Google Scholar]
- 31.Hunig T, Dennehy K, CD28 superagonists: mode of action and therapeutic potential. Immunol Lett 100, 21–28 (2005). [DOI] [PubMed] [Google Scholar]
- 32.Fisher CJ Jr. et al. , Treatment of septic shock with the tumor necrosis factor receptor:Fc fusion protein. The Soluble TNF Receptor Sepsis Study Group. N Engl J Med 334, 1697–1702 (1996). [DOI] [PubMed] [Google Scholar]
- 33.Dyson A, Singer M, Animal models of sepsis: why does preclinical efficacy fail to translate to the clinical setting? Crit Care Med 37, S30–37 (2009). [DOI] [PubMed] [Google Scholar]
- 34.Beutler B, Milsark IW, Cerami AC, Passive immunization against cachectin/tumor necrosis factor protects mice from lethal effect of endotoxin. Science 229, 869–871 (1985). [DOI] [PubMed] [Google Scholar]
- 35.Ackerman AL, Underhill DM, The mycobiome of the human urinary tract: potential roles for fungi in urology. Ann Transl Med 5, 31 (2017). [DOI] [PMC free article] [PubMed] [Google Scholar]
- 36.Leonardi I et al. , CX3CR1(+) mononuclear phagocytes control immunity to intestinal fungi. Science 359, 232–236 (2018). [DOI] [PMC free article] [PubMed] [Google Scholar]
- 37.Japp AS et al. , Wild immunology assessed by multidimensional mass cytometry. Cytometry A 91, 85–95 (2017). [DOI] [PubMed] [Google Scholar]
- 38.Ridaura VK et al. , Gut microbiota from twins discordant for obesity modulate metabolism in mice. Science 341, 1241214 (2013). [DOI] [PMC free article] [PubMed] [Google Scholar]
- 39.Chung H et al. , Gut immune maturation depends on colonization with a host-specific microbiota. Cell 149, 1578–1593 (2012). [DOI] [PMC free article] [PubMed] [Google Scholar]
- 40.Carter PJ, Lazar GA, Next generation antibody drugs: pursuit of the ‘high-hanging fruit’. Nat Rev Drug Discov 17, 197–223 (2018). [DOI] [PubMed] [Google Scholar]
- 41.Threadgill DW, Miller DR, Churchill GA, de Villena FP, The collaborative cross: a recombinant inbred mouse population for the systems genetic era. ILAR J 52, 24–31 (2011). [DOI] [PubMed] [Google Scholar]
- 42.Anne McLaren DM, Studies on the transfer of fertilized mouse mggs to uterine foster-mothers. Journal of Experimental Biology 33, 394–416 (1956). [Google Scholar]
- 43.Callahan BJ et al. , DADA2: high-resolution sample inference from Illumina amplicon data. Nat Methods 13, 581–583 (2016). [DOI] [PMC free article] [PubMed] [Google Scholar]
- 44.McMurdie PJ, Holmes S, phyloseq: an R package for reproducible interactive analysis and graphics of microbiome census data. PLoS One 8, e61217 (2013). [DOI] [PMC free article] [PubMed] [Google Scholar]
- 45.Gower JC, Some distance properties of latent root and vector methods used in multivariate analysis. Biometrika 53, 325–& (1966). [Google Scholar]
- 46.MJ A, A new method for non-parametric multivariate analysis of variance. Austral Ecology 26, 32–46 (2001). [Google Scholar]
- 47.Love MI, Huber W, Anders S, Moderated estimation of fold change and dispersion for RNA-seq data with DESeq2. Genome Biol 15, 550 (2014). [DOI] [PMC free article] [PubMed] [Google Scholar]
- 48.Bolger AM, Lohse M, Usadel B, Trimmomatic: a flexible trimmer for Illumina sequence data. Bioinformatics 30, 2114–2120 (2014). [DOI] [PMC free article] [PubMed] [Google Scholar]
- 49.Langmead B, Salzberg SL, Fast gapped-read alignment with Bowtie 2. Nat Methods 9, 357359 (2012). [DOI] [PMC free article] [PubMed] [Google Scholar]
- 50.Li D, Liu CM, Luo R, Sadakane K, Lam TW, MEGAHIT: an ultra-fast single-node solution for large and complex metagenomics assembly via succinct de Bruijn graph. Bioinformatics 31, 1674–1676 (2015). [DOI] [PubMed] [Google Scholar]
- 51.Seemann T, Prokka: rapid prokaryotic genome annotation. Bioinformatics 30, 2068–2069 (2014). [DOI] [PubMed] [Google Scholar]
- 52.Wood DE, Salzberg SL, Kraken: ultrafast metagenomic sequence classification using exact alignments. Genome Biol 15, R46 (2014). [DOI] [PMC free article] [PubMed] [Google Scholar]
- 53.Gu Z, Eils R, Schlesner M, Complex heatmaps reveal patterns and correlations in multidimensional genomic data. Bioinformatics 32, 2847–2849 (2016). [DOI] [PubMed] [Google Scholar]
- 54.Tang J, Iliev ID, Brown J, Underhill DM, Funari VA, Mycobiome: approaches to analysis of intestinal fungi. J Immunol Methods 421, 112–121 (2015). [DOI] [PMC free article] [PubMed] [Google Scholar]
- 55.Altschul SF, Gish W, Miller W, Myers EW, Lipman DJ, Basic local alignment search tool. J Mol Biol 215, 403–410 (1990). [DOI] [PubMed] [Google Scholar]
- 56.Finkbeiner SR et al. , Metagenomic analysis of human diarrhea: viral detection and discovery. PLoS Pathog 4, e1000011 (2008). [DOI] [PMC free article] [PubMed] [Google Scholar]
- 57.Holtz LR et al. , Geographic variation in the eukaryotic virome of human diarrhea. Virology 468–470, 556–564 (2014). [DOI] [PMC free article] [PubMed] [Google Scholar]
- 58.Handley SA et al. , SIV infection-mediated changes in gastrointestinal bacterial microbiome and virome are associated with immunodeficiency and prevented by vaccination. Cell Host Microbe 19, 323–335 (2016). [DOI] [PMC free article] [PubMed] [Google Scholar]
- 59.Zhao G et al. , VirusSeeker, a computational pipeline for virus discovery and virome composition analysis. Virology 503, 21–30 (2017). [DOI] [PMC free article] [PubMed] [Google Scholar]
- 60.Han SJ et al. , White adipose tissue is a reservoir for memory T cells and promotes protective emory responses to infection. Immunity 47, 1154–1168 e1156 (2017). [DOI] [PMC free article] [PubMed] [Google Scholar]
- 61.Linehan JL et al. , Non-classical immunity controls microbiota impact on skin immunity and tissue repair. Cell 172, 784–796 e718 (2018). [DOI] [PMC free article] [PubMed] [Google Scholar]
- 62.Finck R et al. , Normalization of mass cytometry data with bead standards. Cytometry A 83, 483–494 (2013). [DOI] [PMC free article] [PubMed] [Google Scholar]
- 63.Levine JH et al. , Data-driven phenotypic dissection of AML reveals progenitor-like cells that correlate with prognosis. Cell 162, 184–197 (2015). [DOI] [PMC free article] [PubMed] [Google Scholar]
- 64.Nowicka M et al. , CyTOF workflow: differential discovery in high-throughput highdimensional cytometry datasets. F1000Res 6, 748 (2017). [DOI] [PMC free article] [PubMed] [Google Scholar]
- 65.Trapnell C et al. , Differential analysis of gene regulation at transcript resolution with RNAseq. Nat Biotechnol 31, 46–53 (2013). [DOI] [PMC free article] [PubMed] [Google Scholar]
- 66.Trapnell C et al. , Differential gene and transcript expression analysis of RNA-seq experiments with TopHat and Cufflinks. Nat Protoc 7, 562–578 (2012). [DOI] [PMC free article] [PubMed] [Google Scholar]
Associated Data
This section collects any data citations, data availability statements, or supplementary materials included in this article.