

Abstract

Zone annealing, a directional crystallization technique originally used for the purification of semiconductors, is applied here to crystalline polymers. Tight control over the final lamellar orientation and thickness of semicrystalline polymers can be obtained by directionally solidifying the material under optimal conditions. It has previously been postulated by Lovinger and Gryte that, at steady state, the crystal growth rate of a polymer undergoing zone annealing is equal to the velocity at which the sample is drawn through the temperature gradient. These researchers further implied that directional crystallization only occurs below a critical velocity, when crystal growth rate dominates over nucleation. Here, we perform an analysis of small-angle X-ray scattering, differential scanning calorimetry, and cross-polarized optical microscopy of zone-annealed poly(ethylene oxide) to examine these conjectures. Our long period data validate the steady-state ansatz, while an analysis of Herman’s orientation function confirms the existence of a transitional region around a critical velocity, vcrit, where there is a coexistence of oriented and isotropic domains. Below vcrit, directional crystallization is achieved, while above vcrit, the mechanism more closely resembles that of conventional isotropic isothermal crystallization.
A promising technique that has found extensive use in semiconductor processing is zone annealing (ZA). In this methodology, a sample is subjected to a moving temperature gradient that induces melting, followed by the directional solidification of the material and the accompanying segregation of impurities to the sample extremities. Metallurgists have extensively utilized ZA to produce very pure semiconductors.1,2 The directional morphology induced by the crystal front results in anisotropic properties, which have been exploited in applications. These concepts associated with ZA have been applied to both amorphous block copolymer3−8 and semicrystalline polymer systems.9−17
Nearly 50 years ago, Lovinger and Gryte (L&G) were one
of the first to have applied ZA to polymers using semicrystalline
poly(ethylene oxide) (PEO);9,10,18 this technique was later applied to isotactic polypropylene,11 even–even polyamides,12,13 and poly(vinylidene fluoride).14 L&G
postulated that the effective directional crystallization of polymers
only occurs when the crystal growth rate, G, exceeds
the nucleation rate, N. In other situations, when
the nucleation rate is high, the sample typically crystallizes isotropically
due to radial growth around the large number of primary nuclei. The
question, then, is what determines the G and N and the conditions under which directional crystallization
occurs. From in situ microscopy during ZA, L&G
confirmed that the solid–melt interface remained stationary
in a moving frame of reference.19 This
allowed them to propose that under steady-state conditions the growth
rate, G, must equal the rate at which the heat source
moves relative to the sample. This conjecture of steady-state operation,
while logical, has not been proven to date. Further, this ansatz implies
that the translation rate can be used to map the ZA protocol onto
an effective isothermal crystallization process with the same G. We term this effective isothermal crystallization temperature,
which has the same G, as Tc,eff. From this effective isothermal crystallization temperature, the
nucleation rate per unit volume in the sample follows 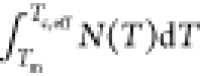 , where N(T) is the instantaneous nucleation rate at temperature T. This past work raises two questions that are assumed to be correct
but are unproven: (i) How reasonable is it to map the ZA protocol
onto an isothermal crystallization process at Tc,eff? (ii) How do we locate the transition from isotropic
to directional growth as the velocity of the moving source is varied
systematically? In this work, we address these two underpinning questions
by conducting detailed studies of PEO crystallized in the presence
of a moving heat source.
, where N(T) is the instantaneous nucleation rate at temperature T. This past work raises two questions that are assumed to be correct
but are unproven: (i) How reasonable is it to map the ZA protocol
onto an isothermal crystallization process at Tc,eff? (ii) How do we locate the transition from isotropic
to directional growth as the velocity of the moving source is varied
systematically? In this work, we address these two underpinning questions
by conducting detailed studies of PEO crystallized in the presence
of a moving heat source.
The ZA setup was modeled after the design of Singh et al.6 The temperature gradient was generated by sandwiching a hot resistance wire between two water-chilled cold plates (Figure 1A) at 34 °C. This produces a peak temperature of 115 °C. The maximum gradient, dT/dx, was 8 °C/mm. This gradient produced a molten zone at its maximum of approximately 35% of the sample length (Figure 1B), while laterally the temperature remained relatively constant with minor edge effects. The sample holder was translated at a constant velocity, vZA, over this heat source. PEO (Mw = 100 kg/mol, Mw/Mn ∼ 4) was used in our experiments. The samples were unconfined rectangular films between two quartz slides such that they could undergo changes in the lateral and pulling directions, but there was no appreciable change in sample geometry after ZA. The detailed protocol for ZA is in the SI.
Figure 1.

(A) Zone-annealing setup (AutoDesk Inventor rendering). (B) Temperature gradient profile on a sample holder. (C) Cross-polarized optical microscopy of zone-annealed PEO and a schematic of the proposed mechanism of crystallization. Scale bars are 100 μm. (D) Isothermal crystal growth rate data from polarized light optical microscopy20 and Lauritzen–Hoffman analysis.
The isothermal crystal growth rates of PEO were determined by tracking
the rate of spherulitic growth using cross-polarized optical microscopy
(CPOM). In particular, we used the published data of Jimenez et al.20 for a variety of PEO systems. To compare to
ZA samples, these growth rates were fit to Lauritzen–Hoffman
theory:21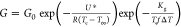 where G0 is a preexponential
constant; U* is an activation energy characteristic
of the transport of polymer segments across the melt-crystal front
(6280 J mol–1); R is the gas constant
(8.314 J mol–1 K–1); T∞ is Tg – 30
(178.15 K); Tg is the glass transition
temperature; Kg is the rate of surface
nucleation; f is a factor defined as
where G0 is a preexponential
constant; U* is an activation energy characteristic
of the transport of polymer segments across the melt-crystal front
(6280 J mol–1); R is the gas constant
(8.314 J mol–1 K–1); T∞ is Tg – 30
(178.15 K); Tg is the glass transition
temperature; Kg is the rate of surface
nucleation; f is a factor defined as  that corrects for the
temperature dependence of the heat of fusion; ΔT = Tm0 – Tc; and Tm is the equilibrium
melting temperature (352.15 K).22 For simplicity,
all parameters were assumed to be constant except for Tc, ΔT, Kg, and f. A linear fit of ln(G)
vs
that corrects for the
temperature dependence of the heat of fusion; ΔT = Tm0 – Tc; and Tm is the equilibrium
melting temperature (352.15 K).22 For simplicity,
all parameters were assumed to be constant except for Tc, ΔT, Kg, and f. A linear fit of ln(G)
vs  was used to interpolate
the G vs Tc data. These
data provide the Tc,eff corresponding
to each growth rate, G, assuming that the L&G
ansatz works (see Figure 1D). However, it is unclear if the other structural characteristics
of the ZA samples (i.e., long period, crystallinity, crystal thickness)
also map to the isothermally crystallized samples. That is, we ask
if a ZA sample takes on the same crystalline properties as a sample
isothermally crystallized at Tc,eff or
not.
was used to interpolate
the G vs Tc data. These
data provide the Tc,eff corresponding
to each growth rate, G, assuming that the L&G
ansatz works (see Figure 1D). However, it is unclear if the other structural characteristics
of the ZA samples (i.e., long period, crystallinity, crystal thickness)
also map to the isothermally crystallized samples. That is, we ask
if a ZA sample takes on the same crystalline properties as a sample
isothermally crystallized at Tc,eff or
not.
To this end, we characterize samples processed with these two techniques with differential scanning calorimetry (DSC) and small-angle X-ray scattering (SAXS). Before obtaining structural parameters, note that ZA samples are anisotropic scatterers, so that performing a full azimuthal integration of the 2D SAXS patterns is inappropriate (see Figure 2A for the scattering pattern of a sample crystallized at vZA = 0.05 μm/s). To address this anisotropy, a wedge integration of 25° centered on the angle of maximum intensity (Figure 2A) was used. The corresponding orthogonal wedge integration (Figure 2B) was also performed to delineate the visually clear anisotropy in the scattering patterns. The Lorentz-corrected scattering profiles for the maximum intensity and orthogonal wedge integrations are presented in Figures 2C and 2D, respectively.
Figure 2.

SAXS data obtained on crystallized PEO samples employing the ZA method described in Figure 1. (A) Representative 2D scattering pattern (vZA = 0.05 μm/s) showing wedge integration of 25° centered on the angle of maximum intensity and (B) 25° centered orthogonal to the angle of maximum intensity. (C) Representative Lorentz-corrected SAXS profiles for wedge integration around angle of maximum intensity and (D) orthogonal to the angle of maximum intensity. (E) Corresponding correlation functions for angle of maximum intensity and (F) orthogonal to angle of maximum intensity.
The first-order scattering peak
in Figure 2C was fit
to extract the peak scattering vector, q*, from which
the long period, L, was calculated as  . The same procedure was used for the 2D patterns from the isothermal
experiments, except that the full azimuthal average was used due to
the isotropic scattering. Figure 3A illustrates the long period from SAXS for the ZA
(blue) and isothermally (orange symbols) crystallized PEO. It is immediately
clear that above Tc,eff ≈ 54 °C,
the long periods for both ZA and isothermal crystallization virtually
coincide. Thus, at this level, the equivalence between an effective
isothermal temperature and the ZA velocity, vZA, holds. Below Tc,eff ≈
54 °C, this equivalence breaks down, which possibly indicates
that somewhere in this range is a critical velocity, vcrit, above which the directional process is no longer
equivalent to the corresponding isothermal crystallization process.
Again, this was previously postulated by L&G;9 the phenomenon of a critical velocity has also been reported
for directional crystallization of nickel and copper.23,24
. The same procedure was used for the 2D patterns from the isothermal
experiments, except that the full azimuthal average was used due to
the isotropic scattering. Figure 3A illustrates the long period from SAXS for the ZA
(blue) and isothermally (orange symbols) crystallized PEO. It is immediately
clear that above Tc,eff ≈ 54 °C,
the long periods for both ZA and isothermal crystallization virtually
coincide. Thus, at this level, the equivalence between an effective
isothermal temperature and the ZA velocity, vZA, holds. Below Tc,eff ≈
54 °C, this equivalence breaks down, which possibly indicates
that somewhere in this range is a critical velocity, vcrit, above which the directional process is no longer
equivalent to the corresponding isothermal crystallization process.
Again, this was previously postulated by L&G;9 the phenomenon of a critical velocity has also been reported
for directional crystallization of nickel and copper.23,24
Figure 3.

(A)
Long period, with  , from Lorentz-corrected profiles for zone annealing (blue) and isothermally
crystallized samples (orange); the position of the first maximum for
the correlation function derived from the zone annealing samples (red)
is also plotted. (B) Bulk crystalline volume fraction φc,v from DSC (blue) and linear crystallinity
, from Lorentz-corrected profiles for zone annealing (blue) and isothermally
crystallized samples (orange); the position of the first maximum for
the correlation function derived from the zone annealing samples (red)
is also plotted. (B) Bulk crystalline volume fraction φc,v from DSC (blue) and linear crystallinity 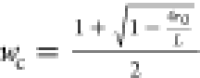 from the correlation function
for zone annealing (red). r0 is the position
where the correlation function first crosses zero. (C) Lamellar thickness,
calculated as L × φc,v, from
the Lorentz-corrected profiles and DSC (blue) and L × wc from the
correlation function for zone annealing (red).
from the correlation function
for zone annealing (red). r0 is the position
where the correlation function first crosses zero. (C) Lamellar thickness,
calculated as L × φc,v, from
the Lorentz-corrected profiles and DSC (blue) and L × wc from the
correlation function for zone annealing (red).
The bulk crystalline fraction is measured via DSC. The integral under
the heat flow curve during the first heating cycle provides the enthalpy
of fusion, which when normalized by the enthalpy for 100% crystalline
PEO (205.4 J/g)25 yields φc,w, the crystal weight fraction.20 The crystal
volume fraction, φc,v, is then obtained from the
relation26 , where
ρc and ρa are the crystalline27 and amorphous28 densities,
respectively. It should be noted that the ZA samples were cooled to
room temperature before heating in the DSC. The heating scans included
crystals formed during the cooling process, while the isothermal samples
were heated in the DSC directly from Tc. Therefore, the heating scans included crystals formed at that temperature
only. Additionally, errors in the determination of the crystalline
fraction are typically in the 10–15% range. These factors contribute
to the fact that the φc,v values are not comparable
across the crystallization methods. We therefore only present the
zone annealing φc,v in Figure 3B (blue); the full data set is shown in the SI. The crystal lamellar thickness follows naturally
as l = L*φc,v;
these values are plotted in blue for ZA in Figure 3C.
, where
ρc and ρa are the crystalline27 and amorphous28 densities,
respectively. It should be noted that the ZA samples were cooled to
room temperature before heating in the DSC. The heating scans included
crystals formed during the cooling process, while the isothermal samples
were heated in the DSC directly from Tc. Therefore, the heating scans included crystals formed at that temperature
only. Additionally, errors in the determination of the crystalline
fraction are typically in the 10–15% range. These factors contribute
to the fact that the φc,v values are not comparable
across the crystallization methods. We therefore only present the
zone annealing φc,v in Figure 3B (blue); the full data set is shown in the SI. The crystal lamellar thickness follows naturally
as l = L*φc,v;
these values are plotted in blue for ZA in Figure 3C.
To independently verify the structural parameters from SAXS and DSC, the correlation function for each scattering profile was calculated and analyzed. This procedure was originally published by Strobl and Schneider29 and later used by other researchers30−32 (details can be found in the SI). In short, the long period, linear crystallinity, and crystal thickness can be extracted under the assumption of a periodic, two-phase model. Representative correlation function profiles for each vZA, calculated from the wedge integration centered on the angle of maximum intensity, are shown in Figure 2E. The corresponding correlation function profiles for the orthogonal integrations are presented in Figure 2F.
The calculation of the correlation function typically requires extrapolation of the intensity data to both q = 0 and q → ∞. Throughout our analysis, it was found that only the invariant was affected significantly by incorporating the extrapolated data into the integral; the structural parameters studied here were not affected appreciably. However, for completeness, the extrapolation to both extremes was performed (see SI).
The structural parameters extracted from SAXS, DSC, and the correlation function analysis are listed in Table 1 and shown in Figure 3.33 These structural parameters are consistent between the analysis methods, thus validating the two methods employed. The deviation of the lamellar thickness for the fastest vZA (lowest Tc,eff) can be explained by the DSC crystallinity being a bulk measurement, while the correlation function linear crystallinity is a localized value for a region of the sample with high anisotropy. We speculate that this might reflect the fact that isotropic (maybe nonisothermal) crystallization processes are competing with the directional crystallization process at the fastest vZA.
Table 1. Structural Parameters from SAXS and DSC of ZA Samples.
| vZA [μm/s] | 0.05 | 0.09 | 0.21 | 0.39 | 0.78 |
| Tc,eff [°C] | 57.3 | 56.5 | 55.4 | 54.4 | 53.1 |
| L [nm]a | 35.0 ± 0.7 | 32.2 ± 0.8 | 30.3 ± 0.3 | 28.7 ± 1.1 | 29.5 ± 0.8 |
| L [nm]b | 35.5 ± 0.9 | 32.4 ± 1.4 | 30.8 ± 0.7 | 29.1 ± 1.0 | 28.6 ± 0.6 |
| φc,vc | 0.81 ± 0.03 | 0.79 ± 0.01 | 0.78 ± 0.02 | 0.79 ± 0.02 | |
| wcb | 0.81 ± 0.01 | 0.80 ± 0.01 | 0.78 ± 0.01 | 0.75 ± 0.02 | 0.70 ± 0.01 |
| lca,c | 26.0 ± 1.1 | 23.9 ± 0.5 | 22.5 ± 1.1 | 23.3 ± 0.8 | |
| lcb | 28.8 ± 0.8 | 26.0 ± 1.2 | 24.0 ± 0.6 | 21.9 ± 0.9 | 20.0 ± 0.5 |
From Lorentz-corrected scattering profiles
From the correlation function
From DSC.
Given that we
probed velocities around vcrit, it is
instructional to examine the scattering anisotropy as in Figure 2A to further elucidate
the characteristics of this critical velocity. Parenthetically, we
note that the X-ray spot sizes here are 200 μm. The intensities
as a function of the azimuthal angle ϕ are plotted in Figure 4A. The extent of
anisotropy is quantified using Herman’s orientation function,
which is the ensemble average of the second Legendre polynomial:34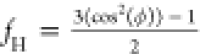 where
where  .
Note that we carry out the integration to 180° instead of 90°
due to the 2-fold symmetry of our SAXS patterns. The reference angle
in our system, ϕ = 0°, is chosen to be the direction associated
with vZA. When fH = 0, the scatterers are isotropically distributed; when fH = 1, the intensity is purely along the reference
ZA direction; and when fH = −0.5,
the intensity is solely perpendicular to the reference angle direction
(see SI for calculations of fH for these extremes). Values in between these extremes
indicate intermediate orientation. For each vZA, 42–87 scattering patterns on different spots were
collected over 2–4 samples, and fH was calculated for each spot. The average fH for each vZA is plotted in Figure 4B; the normalized
distributions of fH for each vZA are presented in Figure 4C. For the fastest vZA,
i.e., for the lowest Tc,eff, the fH is zero, within error, indicating that the
lamellae have no statistical preference in their direction of crystallization
relative to the ZA direction. This again confirms that the polymer
chains are crystallizing isotropically at this vZA. The uniform distribution of fH about zero for this fastest vZA further
proves this point.
.
Note that we carry out the integration to 180° instead of 90°
due to the 2-fold symmetry of our SAXS patterns. The reference angle
in our system, ϕ = 0°, is chosen to be the direction associated
with vZA. When fH = 0, the scatterers are isotropically distributed; when fH = 1, the intensity is purely along the reference
ZA direction; and when fH = −0.5,
the intensity is solely perpendicular to the reference angle direction
(see SI for calculations of fH for these extremes). Values in between these extremes
indicate intermediate orientation. For each vZA, 42–87 scattering patterns on different spots were
collected over 2–4 samples, and fH was calculated for each spot. The average fH for each vZA is plotted in Figure 4B; the normalized
distributions of fH for each vZA are presented in Figure 4C. For the fastest vZA,
i.e., for the lowest Tc,eff, the fH is zero, within error, indicating that the
lamellae have no statistical preference in their direction of crystallization
relative to the ZA direction. This again confirms that the polymer
chains are crystallizing isotropically at this vZA. The uniform distribution of fH about zero for this fastest vZA further
proves this point.
Figure 4.

(A) Representative intensity profiles as a function of azimuthal angle, ϕ, for all probed vZA. ϕ = 0° corresponds to the pulling direction. (B) Average Herman’s orientation function for zone-annealed PEO as a function of Tc,eff. (C) Normalized distributions of Herman’s orientation function measured across the area of the sample.
Moving to slower vZA (i.e., higher Tc,eff), the distribution shifts to more negative values, indicating that the crystal correlations are perpendicular to the pulling direction; this can be seen in the 2D pattern in Figure 2A and in the additional SAXS patterns provided in the SI. At vZA = 0.39 μm/s, there are two populations of fH: one is effectively isotropic (fH = 0), and the other is directional (fH < 0). This is the critical velocity, vcrit, below which fH shifts primarily to negative values.
Before concluding, it is appropriate
to compare this protocol with another one which results in oriented
morphologies, i.e., flow-induced crystallization. In the latter case,
it is now well-established that flow-induced precursors, e.g., those
created by the orientation of long chains, lead to directed crystallization.35 As expected, these phenomena manifest themselves
at large flow rates where long chains themselves orient. Our results
are opposite in spirit, namely, that directed crystallization preferentially
occurs at low velocities; in contrast, large velocities yield isotropic
orientations (Figure 4). We estimate the time scale for the flow to convect a chain its
own size to be 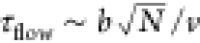 , where N is the chain length and b is the Kuhn
length of the chains in question. For the chain lengths used and the
critical velocity, this corresponds to τflow ∼
0.1 s. This is comparable to the relaxation time of the chains at
a temperature of 373 K obtained from the rheological crossover of G′ and G′′, the storage
and loss moduli of the viscoelastic response, respectively (unpublished
data from our laboratory). So, for smaller velocities, the chains
are able to fully relax, and thus they are not likely to be distorted
by the flow. Indeed, the chain orientation that is deduced based on
our results (schematic Figure 1C), i.e., normal to the velocity (or temperature gradient)
direction, clearly argues against any flow-induced chain orientation
effects. An analogous case, that of transcrystallization, also originates
from molecularly oriented precursors, typically fibrillar fillers
which template the polymer matrix.36 Thus,
some other mechanism must be operative, and we believe that the L&G
conjecture that the dominance of crystal growth over nucleation, accompanied
by the presence of a temperature gradient, plays a central role in
the orientation obtained.
, where N is the chain length and b is the Kuhn
length of the chains in question. For the chain lengths used and the
critical velocity, this corresponds to τflow ∼
0.1 s. This is comparable to the relaxation time of the chains at
a temperature of 373 K obtained from the rheological crossover of G′ and G′′, the storage
and loss moduli of the viscoelastic response, respectively (unpublished
data from our laboratory). So, for smaller velocities, the chains
are able to fully relax, and thus they are not likely to be distorted
by the flow. Indeed, the chain orientation that is deduced based on
our results (schematic Figure 1C), i.e., normal to the velocity (or temperature gradient)
direction, clearly argues against any flow-induced chain orientation
effects. An analogous case, that of transcrystallization, also originates
from molecularly oriented precursors, typically fibrillar fillers
which template the polymer matrix.36 Thus,
some other mechanism must be operative, and we believe that the L&G
conjecture that the dominance of crystal growth over nucleation, accompanied
by the presence of a temperature gradient, plays a central role in
the orientation obtained.
In this work, we have established the validity of the steady-state conjecture for the zone crystallization of polymers, allowing direct mapping of the structural parameters of ZA samples to isothermally crystallized ones. We also verify the existence of a critical velocity, vcrit, which delineates the transition between nominally oriented crystals and isotropic crystals, from the distributions of Herman’s orientation function. Taken in conjunction, these discoveries should allow us to exert greater control over the final lamellar orientation and crystal thickness of semicrystalline polymers. Mechanistically, below vcrit, the b-axis of the polymer chain orients preferentially along the pulling direction (Figure 1C), while above vcrit, this order is absent. This transition is not abrupt since intermediate velocities show the coexistence of order and disorder. These data provide evidence for the validity of previously proposed directional crystallization mechanisms of Asano et al. for crystallization of polyethylene under a moving temperature gradient,15 as well as L&G for poly(ethylene oxide).10 Finally, although not discussed extensively, we find that the geometry of the sample (confined in a tube vs unconfined film) does not impact the mechanism.
Acknowledgments
This work was supported by grants DE-SC0018182, DE-SC0018135, and DE-SC0018111, funded by the U.S. Department of Energy, Office of Science. A.A.K. acknowledges funding from the Gates Millennium Scholars program under Grant No. OPP1202023 from the Bill & Melinda Gates Foundation. A.J.M. acknowledges funding from the Basque Government through grant IT1309-19. We are grateful to Dr. Andrew J. Lovinger for critically reviewing the manuscript and offering multiple comments that have helped us to significantly improve our paper. We would also like to thank Beatrice Bellini for experimental assistance.
Supporting Information Available
The Supporting Information is available free of charge at https://pubs.acs.org/doi/10.1021/acsmacrolett.0c00346.
Experimental methods, discussion of Lauritzen–Hoffman analysis, extrapolation of SAXS data and correlation function analysis, comparison of correlation functions calculated with and without extrapolation of SAXS data, Herman’s orientation function calculation for delta function intensities, additional SAXS 2D scattering patterns, additional CPOM micrographs, DSC heat flow curves, and isothermal DSC and crystal lamellar thickness data set (PDF)
Author Contributions
The manuscript was written through contributions of all authors. All authors have given approval to the final version of the manuscript.
The authors declare no competing financial interest.
Supplementary Material
References
- Pfann W. G. Zone Melting. Science (Washington, DC, U. S.) 1962, 135 (3509), 1101–1109. 10.1126/science.135.3509.1101. [DOI] [PubMed] [Google Scholar]
- Tiller W. A.; Jackson K. A.; Rutter J. W.; Chalmers B. The Redistribution of Solute Atoms during the Solidification of Metals. Acta Metall. 1953, 1 (4), 428–437. 10.1016/0001-6160(53)90126-6. [DOI] [Google Scholar]
- Majewski P. W.; Yager K. G. Millisecond Ordering of Block Copolymer Films via Photothermal Gradients. ACS Nano 2015, 9 (4), 3896–3906. 10.1021/nn5071827. [DOI] [PubMed] [Google Scholar]
- Samant S.; Strzalka J.; Yager K. G.; Kisslinger K.; Grolman D.; Basutkar M.; Salunke N.; Singh G.; Berry B.; Karim A. Ordering Pathway of Block Copolymers under Dynamic Thermal Gradients Studied by in Situ GISAXS. Macromolecules 2016, 49 (22), 8633–8642. 10.1021/acs.macromol.6b01555. [DOI] [Google Scholar]
- Mita K.; Takenaka M.; Hasegawa H.; Hashimoto T. Cylindrical Domains of Block Copolymers Developed via Ordering under Moving Temperature Gradient: Real-Space Analysis. Macromolecules 2008, 41 (22), 8789–8799. 10.1021/ma801750c. [DOI] [Google Scholar]
- Singh G.; Yager K. G.; Smilgies D. M.; Kulkarni M. M.; Bucknall D. G.; Karim A. Tuning Molecular Relaxation for Vertical Orientation in Cylindrical Block Copolymer Films via Sharp Dynamic Zone Annealing. Macromolecules 2012, 45 (17), 7107–7117. 10.1021/ma301004j. [DOI] [Google Scholar]
- Singh G.; Batra S.; Zhang R.; Yuan H.; Yager K. G.; Cakmak M.; Berry B.; Karim A. Large-Scale Roll-to-Roll Fabrication of Vertically Oriented Block Copolymer Thin Films. ACS Nano 2013, 7 (6), 5291–5299. 10.1021/nn401094s. [DOI] [PubMed] [Google Scholar]
- Xue J.; Singh G.; Qiang Z.; Yager K. G.; Karim A.; Vogt B. D. Facile Control of Long Range Orientation in Mesoporous Carbon Films with Thermal Zone Annealing Velocity. Nanoscale 2013, 5 (24), 12440–12447. 10.1039/c3nr03591c. [DOI] [PubMed] [Google Scholar]
- Lovinger A. J.; Gryte C. C. The Morphology of Directionally Solidified Poly(Ethylene Oxide) Spherulites. Macromolecules 1976, 9 (2), 247–253. 10.1021/ma60050a014. [DOI] [Google Scholar]
- Lovinger A. J.; Lau C. M.; Gryte C. C. Microstructure of Directionally Solidified Poly(Ethylene Oxide). Polymer 1976, 17 (7), 581–586. 10.1016/0032-3861(76)90273-1. [DOI] [Google Scholar]
- Lovinger A. J.; Chua J.; Gryte C. C. Studies on the α and β Forms of Isotactic Polypropylene by Crystallization in a Temperature Gradient. J. Polym. Sci., Polym. Phys. Ed. 1977, 15, 641–656. 10.1002/pol.1977.180150405. [DOI] [Google Scholar]
- Lovinger A. J. Crystallographic Factors Affecting the Structure of Polymeric Spherulites. I. Morphology of Directionally Solidified Polyamides. J. Appl. Phys. 1978, 49, 5003. 10.1063/1.324447. [DOI] [Google Scholar]
- Lovinger A. J. Crystallographic Factors Affecting the Structure of Polymeric Spherulites. II. X-Ray Diffraction Analysis of Directionally Solidified Polyamides and General Conclusions. J. Appl. Phys. 1978, 49, 5014. 10.1063/1.324448. [DOI] [Google Scholar]
- Lovinger A. J.; Wang T. T. Investigation of the Properties of Directionally Solidified Poly(Vinylidene Fluoride). Polymer 1979, 20, 725–732. 10.1016/0032-3861(79)90247-7. [DOI] [Google Scholar]
- Asano T.; Mina F.; Nishida A.; Yoshida S.; Fujiwara Y. Crystallization of a Low Molecular Weight Polyethylene and Paraffins Under A Temperature Gradient. J. Macromol. Sci., Part B: Phys. 2001, B40, 355–367. 10.1081/MB-100106164. [DOI] [Google Scholar]
- Ye C.; Zhang L.; Fu G.; Karim A.; Kyu T.; Briseno A. L.; Vogt B. D. Controlled Directional Crystallization of Oligothiophenes Using Zone Annealing of Preseeded Thin Films. ACS Appl. Mater. Interfaces 2015, 7 (41), 23008–23014. 10.1021/acsami.5b06344. [DOI] [PubMed] [Google Scholar]
- Ye C.; Wang C.; Wang J.; Wiener C. G.; Xia X.; Cheng S. Z. D.; Li R.; Yager K. G.; Fukuto M.; Vogt B. D. Rapid Assessment of Crystal Orientation in Semi-Crystalline Polymer Films Using Rotational Zone Annealing and Impact of Orientation on Mechanical Properties. Soft Matter 2017, 13 (39), 7074–7084. 10.1039/C7SM01366C. [DOI] [PubMed] [Google Scholar]
- Lovinger A. J.; Gryte C. C. Model for the Shape of Polymer Spherulites Formed in a Temperature Gradient. J. Appl. Phys. 1976, 47 (5), 1999–2004. 10.1063/1.322926. [DOI] [Google Scholar]
- Lovinger A. J.; Chua J.; Gryte C. C. An Apparatus for in Situ Microscopy of Zone Solidifying Polymers. J. Phys. E: Sci. Instrum. 1976, 9, 927. 10.1088/0022-3735/9/11/010. [DOI] [Google Scholar]
- Jimenez A. M.; Krauskopf A. A.; Pérez-Camargo R. A.; Zhao D.; Pribyl J.; Jestin J.; Benicewicz B. C.; Müller A. J.; Kumar S. K. Effects of Hairy Nanoparticles on Polymer Crystallization Kinetics. Macromolecules 2019, 52, 9186–9198. 10.1021/acs.macromol.9b01380. [DOI] [PMC free article] [PubMed] [Google Scholar]
- Hoffman J. D.; Miller R. L. Kinetics of Crystallization from the Melt and Chain Folding in Polyethylene Fractions Revisited: Theory and Experiment. Polymer 1997, 38 (13), 3151–3212. 10.1016/S0032-3861(97)00071-2. [DOI] [Google Scholar]
- Wu L.; Lisowski M.; Talibuddin S.; Runt J. Crystallization of Poly(Ethylene Oxide) and Melt-Miscible PEO Blends. Macromolecules 1999, 32 (5), 1576–1581. 10.1021/ma981169o. [DOI] [Google Scholar]
- Baker I.; Li J. Directional Annealing of Cold-Rolled Copper Single Crystals. Acta Mater. 2002, 50, 805–813. 10.1016/S1359-6454(01)00384-6. [DOI] [Google Scholar]
- Li J.; Johns S. L.; Iliescu B. M.; Frost H. J.; Baker I. The Effect of Hot Zone Velocity and Temperature Gradient on the Directional Recrystallization of Polycrystalline Nickel. Acta Mater. 2002, 50, 4491–4497. 10.1016/S1359-6454(02)00265-3. [DOI] [Google Scholar]
- Mark J. E.Physical Properties of Polymers Handbook; 2007. [Google Scholar]
- Lorenzo A. T.; Arnal M. L.; Albuerne J.; Müller A. J. DSC Isothermal Polymer Crystallization Kinetics Measurements and the Use of the Avrami Equation to Fit the Data: Guidelines to Avoid Common Problems. Polym. Test. 2007, 26 (2), 222–231. 10.1016/j.polymertesting.2006.10.005. [DOI] [Google Scholar]
- Wunderlich B.Macromolecular Physics; 1973. 10.1016/B978-0-12-765601-4.50007-X. [DOI] [Google Scholar]
- Zhu L.; Cheng S. Z. D.; Calhoun B. H.; Ge Q.; Quirk R. P.; Thomas E. L.; Hsiao B. S.; Yeh F.; Lotz B. Phase Structures and Morphologies Determined by Self-Organization, Vitrification, and Crystallization: Confined Crystallization in an Ordered Lamellar Phase of PEO-b-PS Diblock Copolymer. Polymer 2001, 42, 5829–5839. 10.1016/S0032-3861(00)00902-2. [DOI] [Google Scholar]
- Strobl G. R.; Schneider M. Direct Evaluation of the Electron Density Correlation Function of Partially Crystalline Polymers. J. Polym. Sci., Polym. Phys. Ed. 1980, 18, 1343–1359. 10.1002/pol.1980.180180614. [DOI] [Google Scholar]
- Russell T. P.; Ito H.; Wignall G. D. Neutron and X-Ray Scattering Studies on Semicrystalline Polymer Blends. Macromolecules 1988, 21 (6), 1703–1709. 10.1021/ma00184a029. [DOI] [Google Scholar]
- Talibuddin S.; Wu L.; Runt J.; Lin J. S. Microstructure of Melt-Miscible. Macromolecules 1996, 29 (23), 7527–7535. 10.1021/ma960508f. [DOI] [Google Scholar]
- Fragiadakis D.; Runt J. Microstructure and Dynamics of Semicrystalline Poly(Ethylene Oxide)-Poly(Vinyl Acetate) Blends. Macromolecules 2010, 43, 1028–1034. 10.1021/ma9020938. [DOI] [Google Scholar]
- There is one missing crystallinity value as we do not have access to the laboratory to complete this measurement.
- White J. L.; Spruiell J. E. The Specification of Orientation and Its Development in Polymer Processing. Polym. Eng. Sci. 1983, 23 (5), 247–256. 10.1002/pen.760230503. [DOI] [Google Scholar]
- Somani R. H.; Yang L.; Zhu L.; Hsiao B. S. Flow-Induced Shish-Kebab Precursor Structures in Entangled Polymer Melts. Polymer 2005, 46 (20), 8587–8623. 10.1016/j.polymer.2005.06.034. [DOI] [Google Scholar]
- Dufresne A.; Kellerhals M. B.; Witholt B. Transcrystallization in Mcl-PHAs/Cellulose Whiskers Composites. Macromolecules 1999, 32, 7396–7401. 10.1021/ma990564r. [DOI] [Google Scholar]
Associated Data
This section collects any data citations, data availability statements, or supplementary materials included in this article.