Abstract
Introduction
Mirtazapine is commonly prescribed to patients diagnosed with major depressive disorder.Some proportion of these patients do not show adequate response to treatment regimen containing mirtazapine, whereas many of them experience dose-dependent adverse drug reactions. Results of the previous studies showed that CYP2D6 is involved in the biotransformation of mirtazapine, the activity of which is highly dependent on the polymorphism of the gene encoding it.
Objective
The objective of our study was to investigate the influence of 1846G>A polymorphism of the CYP2D6 gene on the concentration/dose indicator of mirtazapine, using findings on enzymatic activity of CYP2D6 (as evaluated by the 6M-THBC/pinoline ratio measurement) and on CYP2D6 expression level obtained by measuring the hsa-miR-370-3p plasma levelsin patients suffering from recurrent depressive disorder.
Material and Methods
Our study included 192 patients with major depressive disorder (age – 41.4 ± 15.6 years). Treatment regimen included mirtazapine in an average daily dose of 37.4 ± 13.5 mg per week. Treatment efficacy was evaluated using the international psychometric scales. Therapy safety was assessed using the UKU Side-Effect Rating Scale. For genotyping and estimation of the microRNA (miRNA) plasma levels we performed the real-time polymerase chain reaction. The activity of CYP2D6 was assessed with HPLC-MS/MS method by the content of the endogenous substrate of given isoenzyme and its metabolite in urine (6M-THBC/pinoline). Therapeutic drug monitoring (TDM) has been performed using HPLC-MS/MS.
Results
Our study revealed the statistically significant results in terms of the treatment efficacy evaluation (HAMD scores at the end of the treatment course): (GG) 10.0 [9.0; 11.0] and (GA) 12.0 [11.0; 12.0], p < 0.001; at the same time, the statistical significance in the safety profile was obtained (the UKU scores): (GG) 3.0 [2.0; 4.0] and (GA) 4.0 [3.0; 5.0], p < 0.001. We didn’t reveal a statistical significance for concentration/dose indicator of mirtazapine in patients with different genotypes: (GG) 0.229 [0.158; 0.468] and (GA) 0.290 [0.174; 0.526], p = 0.196. Analysis of the results of the pharmacotranscriptomic part of the study didn’t demonstrate the statistically significant difference in the hsa-miR-370-3p plasma levels in patients with different genotypes: (GG) 23.6 [17.6; 28.0], (GA) 21.8 [17.2; 27.0], p = 0.663. At the same time, correlation analysis didn’t reveal a statistically significant relationship between the mirtazapine efficacy profile evaluated by changes in HAMD scale scores and the hsa-miR-370-3p plasma concentration: rs = 0.05, p = 0.460. Also, we didn’t reveal the correlation between the miRNA concentration and safety profile: rs = 0.11, p = 0.124. In addition, we revealed the relationship between the CYP2D6 enzymatic activity (as evaluated by 6M-THBC/pinoline ratio measurement) and the hsa-miR-370-3p plasma concentration: rs = –0.32, p < 0.001. At the same time, correlation analysis revealed a statistically significant relationship between the mirtazapine concentration and the hsa-miR-370-3p plasma concentration: rs = 0.31, p < 0.001.
Conclusion
Thus, the effect of genetic polymorphism of the CYP2D6 gene on the efficacy and safety profiles of mirtazapine was demonstrated in a group of 192 patients with recurrent depressive disorder. At the same time, hsa-miR-370-3p remains a promising biomarker for assessing the level of CYP2D6 expression, because it correlates with encoded isoenzyme activity.
Keywords: mirtazapine, CYP2D6, pharmacogenetics, biotransformation, personalized medicine, depressive spectrum disorders, alcohol use disorder
Introduction
Depressive disorders are among the most common comorbid psychiatric disorders in patients with alcoholism.2 Antidepressants are used to treat patients suffering from depressive disorders,10 and mirtazapine is a representative of this drug group.10 Although tetracyclic antidepressants are included in guidelines for the treatment patients with patients suffering from depressive spectrum disorders, the count of resistant patients and those with type A adverse drug reactions (type A ADRs) remains high.11
CYP2D6 participates in the pharmacokinetics of many drugs used for psychopharmacotherapy of patients with major depressive disorder.4 Meanwhile, gene encoding CYP2D6, is highly polymorphic, which can affect the activity of CYP2D6.9 Changes in activity may affect the rate of metabolism of xenobiotics, including substrate drugs, which, in turn, may have an impact on their efficacy and safety profiles.16 There are four groups of metabolizers distinguished by their metabolic rates: extensive metabolizers having normal metabolic rate; poor metabolizers with mutations in the CYP2D6, gene, which may result in the decreased activity of the encoded protein, as well as a slowdown in the biotransformation of substrate drugs, which may lead to an increased risk of dose-dependent adverse drug reactions; intermediate ones having a mutation in only one of the homologous chromosomes, which reduces the activity of CYP2D6, however, to a lesser degree than in poor metabolizers; ultra-rapid metabolizers having the congenital increased activity of CYP2D6, which, may lead to the accelerated biotransformation of substrate drugs along with the reduced treatment efficacy.1 So, changes in the profiles of the efficacy and safety of mirtazapine may depend on, inter alia, the changes in genes, encoded elements of pharmacodynamics and pharmacokinetics and, inter alia, CYP2D6.
Concerning the pharmacotranscriptomic part of the study, the in vitro studies revealed the correlation between the plasma concentration of microRNA hsa-miR-370-3p and CYP2D6 activity.15
The objective of this study was to evaluate the impact of 1846G>A polymorphism of the CYP2D6 gene on the concentration/dose indicator of mirtazapinepatients suffering from recurrent depressive disorder, using findings on enzymatic activity of CYP2D6 (as evaluated by the 6M-THBC/pinoline ratio measurement) and on CYP2D6 expression level obtained by measuring the hsa-miR-370-3p plasma levelspatients diagnosed with major depressive disorder.
Material and Methods
Clinical Characteristics of the Study Subjects
The study involved 192 male patients (average age — 41.41 ± 15.57 years). The inclusion criteria were the existence of two diagnoses: “Depressive episode (F32.x, according to ICD-10)”, and “Mental and behavioral disorders due to use of alcohol. Dependence syndrome. Currently abstinent but in a protected environment (F.10.212)”; signed informed consent, and 8-weeks mirtazapine monotherapy. Exclusion criteria were presence of any other mental disorders; presence of severe somatic disorders (except alcoholic hepatitis and toxic encephalopathy); presence of any other psychotropic medications in treatment regimen; creatinine clearance values <50 mL/min, creatinine concentration in plasma >1.5 mg/dL (133 mmol/L), bodyweight less than 60 kg or greater than 100 kg, age of 75 years or more and presence of any contraindications for mirtazapine use.
Therapy Efficacy and Safety Evaluation
In order to assess mirtazapine efficacy, several international psychometric scales were used: Hospital Anxiety and Depression Scale (HADS),5 The assessment of depression states by rating (HAMD), UKU Side-Effect Rating Scale (UKU),3 NA,17 NA.6 The safety profile was evaluated using the UKU Side-Effect Rating Scale (UKU).8 Patients were examined on weeks 1, 4 and 8 of mirtazapine therapy.
Genotyping
For genotyping, venous blood samples were collected into VACUETTE® (Greiner Bio-One, Austria) vacuum tubes on the 8 week of mirtazapine therapy. The DNA amplifiers “Dtlite” by DNA Technology (Moscow, Russia), CFX96 Touch Real-Time System with CFX Manager software by Bio-Rad Laboratories Inc. (Hercules, CA, USA) and the “SNP-screen” sets by “Syntol” (Moscow, Russia) were used to perform the real-time polymerase chain reaction in order to determine the single-nucleotide polymorphisms (SNPs) 1846G>A of the CYP2D6 (rs3892097) gene. We used two allele-specific hybridizations in every “SNP-screen” set, which have enabled us to determine separately two alleles of the studied SNP on two fluorescence channels.
Phenotyping
CYP2D6 enzymatic activity was evaluated on the 1st and the 8th weeks by determining the urinary concentration of endogenous substrate of the enzyme and its metabolite, 6M-THBC/pinoline ratio,7,13,12 using high-performance liquid chromatography-mass spectrometry (HPLC-MS/MS). Results of the isoenzyme activity evaluation are demonstrated in arbitrary units.
Therapeutic Drug Monitoring
For TDM, venous blood samples were collected on the week 8th of mirtazapine therapy. The plasma calibration standards (St) and quality control samples (QC) were made from a stock solution prepared by consistent dissolving of substantial amounts in methanol with subsequent dilution to the relevant concentrations. Calibration curve was created using 5, 10, 20, 50, 100, 200, 500, 1000, 2000 ng/mL calibration standards along with 5 ng/mL (LLOQ), 15 ng/mL (Low QC), 1000 ng/mL (Medium QC), and 1500 ng/mL (High QC) quality control samples (QC). Diazepam (250 ng/mL in acetonitrile) was used as the internal standard.
Sample Preparation
Samples were prepared using a protein precipitation method. A 1.5 mL tube was filled with 200 mcL of analyzed plasma sample and 600 mcL of acetonitrile containing the internal standard. The mixture was shaken on Vortex for 10 minutes, and then samples were centrifuged at 14,500 g for 10 minutes at 4°C. Then the supernatant was transferred to an autosampler vial. Samples were analyzed using the HPLC system Agilent 1260 (Agilent Technologies, California, USA) and tandem mass selective detector Agilent 6460 (Agilent Technologies, California, USA) with Jet Stream Electrospray Ionization Source.
Conditions of Chromatographic Analysis
Stationary phase: column Agilent Poroshell 120 EC-C18 (2.7 μm, 3.0 mm × 50 mm) with the precolumn InfinityLab Poroshell 120 EC-C18 (2.7 μm, 3.0 mm × 5.0 mm) (Agilent Technologies, California, USA). The column temperature was 50°C. The mobile phase consisted of the A eluent (10 mM ammonium formate in 0.1% formic acid) and B eluent (methanol in 0.1% formic acid). The flow rate was 0.4 mL/min. Gradient elution process was performed; the gradient of the mobile phase is presented in Table 1. The analysis time was 9.0 minutes for every sample. The volume of the inserted sample was 2 mcL. Retention time under the given conditions was 4.75 min for mirtazapine and 4.84 min for diazepam.
Table 1. Gradient of the Mobile Phase.
| TIME OF ANALYSIS, MIN | ELUENT A VOLUME RATIO, % | ELUENT B VOLUME RATIO, % | ||
| 0.00 | 95 | 5 | ||
| 0.50 | 95 | 5 | ||
| 1.00 | 50 | 50 | ||
| 1.50 | 5 | 95 | ||
| 3.00 | 5 | 95 | ||
| 3.01 | 95 | 5 | ||
| 5.00 | 95 | 5 |
Conditions of Mass-spectrometry Determination
We used positive mode electrospray ionization for mass-selective detection. Detector registered following MRM-transitions: from 349.0 m/z [M+H+] to 206.1 m/z (collision cell energy 40 V) and from 349.0 m/z [M+H+] to 184.0 m/z (collision cell energy 32 V) for mirtazapine; from 285.1 m/z [M+H+] to 193.1 m/z (collision cell energy 32 V) and from 285.1 m/z [M+H+] to 154.1 m/z (collision cell energy 24 V) for diazepam (the internal standard). The voltage on phragmentor for mirtazapine and diazepam was 156 V and 166 V, respectively. The voltage on capillary was 3.5 kV, the temperature of desiccant gas was 350°C, nitrogen flow was 6 L/min. Nebulizers pressure was 45 psi, sheath gas temperature was 375°C, sheath gas flow was 11 L/min.
Method Validation
The methodology used in the study met FDA Guidance for Industry: Bioanalytical method validation. Calibration dependence was linear for diapason at 0.5–200 ng/mL. Correlation coefficients were normal (at least 0.99). We evaluated the intra- and inter-cycles precision and accuracy rates. Precision and accuracy rates were normal (no more than 20% at LLOQ, no more than 15% for other points). The matrix effect had no influence.
Determination of the MiRNA Levels
Blood was collected into sterile tubes containing EDTA. A closed tube with blood was turned over several times to mix blood with anticoagulant. To obtain plasma, the tube was centrifuged for 10 minutes at an acceleration of 2000 g, after which supernatant was transferred to sterile 2 or 1.5 mL tubes and stored before use at −80°C. Total RNA, including miRNA, was isolated using Trizol (Life Technologies, Carlsbad, USA) and a set of miRNeasy Mini Kit (Qiagen, Hilden, Germany) following the protocol of manufacturers with small modifications. Trizol was added to 500 μl of plasma in a volume ratio of 2:1. After chloroform was added to the tube and then centrifuged to separate phases, the aqueous phase was transferred to a new tube, and 1.5 times the volume of 100% ethanol was added to it. The solution containing RNA was loaded into the miRNeasy column and further washed according to the manufacturer’s instructions. The final volume of elution was 15 μl. Concentration and purity of the obtained RNA were estimated on the NanoDrop 2000 microvolume spectrophotometer (Thermo Fisher Scientific, New York, USA). The extraction process was repeated for each sample until a sufficient amount of RNA was obtained for the next steps. Reverse transcription was performed using the MiScript II RT Kit (Qiagen) under the recommended protocol. To obtain cDNA, 300 ng of total RNA extracted from each sample was used, which was added to the reaction mixture (4 μl 5× 5× miScript HiFlex Buffer, 2 μl 10X miScript Nucleics Mix, 1 μl of Reverse Transcriptase Mix miScript and RNAz-free water up to 20 μl) and was incubated for 60 minutes at 37°C, followed by an increase in temperature up to 95°C for 5 minutes to inactivate transcriptase. Real-time PCR was performed with three repetitions for each of the analyzed miRNAs, as well as endogenous control of RNU6B, using the MiScript SYBR Green PCR Kit (Qiagen) and presynthesized miScript Primer Assay (Qiagen) primers in the volume of the reaction mixture of 12 μl (2 μl of cDNA obtained), 5 μl 2× QuantiTect SYBR Green PCR Master Mix, 1 μl 10× 10× miScript Universal Primer, 1 μl 10× miScript Primer Assay to the studied microRNA and RNAz-free water up to 12 μl). Real-time PCR was performed on the CFX96 Real-Time PCR Detection System (Bio-Rad, Hercules, USA) according to manufacturer’s recommended program (15 minutes at 95°C to activate the HotStarTaq DNA Polymerase and 40 three-step cycles (94°C – 15 seconds, 55°C – 30 seconds, 70°C – 30 seconds)).
Local Ethical Committee
The local ethical committee of the Russian Medical Academy of Continuous Professional Education of the Ministry of Health of the Russian Federation approved the research (The protocol No. 6 from 5/16/2017).
Statistical Analysis
Statistical analysis of the results was performed with non-parametric methods using the “Statsoft Statistica v. 10.0” (Dell Statistica, Tulsa, OK, USA). The normality of sample distribution was evaluated using the W-Shapiro-Wilk test and taken into account when choosing a method. The differences were considered statistically significant at p < 0.05 (power above 80 %). Two samples of continuous independent data were compared using the Mann-Whitney U-test, which takes into account the abnormal nature of data distribution, with further correction of the obtained p-value using the Benjamin-Hochberg test, due to the multiple comparison procedure. Several samples of continuous data were analyzed using the Kruskal-Wallis H-test. Correlation analysis was performed using the Spearman nonparametric test, taking into account the abnormal nature of sample distribution. Pearson’s Chi2 test for evaluation of the sampling distribution of the alleles (Hardy Weinberg equilibrium) has been used. Research data are presented in the form of the median and interquartile range (Me [Q1; Q3]), or in case of their normal distribution, as the arithmetic mean and standard deviation (Mean ± SD).
Study results
The CYP2D6 genotyping by polymorphic marker 1846G>A (rs3892097) performed in 192 subjects have revealed the following:
The amount of patients with the GG genotype was 154 (80.2%);
The number of patients with the GA genotype was 38 (19.8%);
There were no subjects with the AA genotype.
Genotype distributions followed a Hardy–Weinberg equilibrium (Chi2 = 2.32, p-value = 0.13).
The results of data analysis performed for psychometric assessments (HADS, HAMD) and side-effect rating scale (UKU) on weeks 1, 4 and 8 in patients who were administered mirtazapine can be found in Table 2.
Table 2. Data from the Psychometric Assessments and Side-Effect Rating Scale in Patients who Received Mirtazapine, on Weeks 1, 4 and 8 of the Study.
| SCALE | GG | GA | P-VALUE | |||
| Week 1 | ||||||
| HADS | 37.0 [36.0; 38.0] | 36.0 [36.0; 38.0] | 0.777 | |||
| HAMD | 22.0 [21.0; 23.0] | 22.0 [21.0; 23.0] | 0.688 | |||
| UKU | 0.0 [0.0; 0.0] | 0.0 [0.0; 0.0] | 0.287 | |||
| Week 4 | ||||||
| HADS | 22.0 [20.0; 26.0] | 24.5 [21.0; 27.8] | 0.050 | |||
| HAMD | 13.0 [11.0; 15.0] | 14.5 [13.2; 16.0] | 0.001 | |||
| UKU | 3.0 [2.0; 4.0] | 3.0 [2.0; 4.0] | 0.445 | |||
| Week 8 | ||||||
| HADS | 15.0 [9.2; 19.0] | 18.0 [13.0; 21.0] | 0.013 | |||
| HAMD | 10.0 [9.0; 11.0] | 12.0 [11.0; 12.0] | <0.001 | |||
| UKU | 3.0 [2.0; 4.0] | 4.0 [3.0; 5.0] | <0.001 | |||
p – p-value obtained in Benjamini-Hochberg multiple testing correction (based on the results of Mann-Whitney U test), Data are presented as Me and IQR.
Dynamics of changes in HAMD scale scores among the patients with different genotypes are demonstrated in Figure 1 week hadn’t statistically significant differences: (GG) 22.0 [21.0; 23.0], (GA) 22.0 [21.0; 23.0], p = 0.688. By week 4 statistically significant differences remained in patients with different genotypes: (GG) 13.0 [11.0; 15.0], (GA) 14.5 [13.2; 16.0], p = 0.001. On the last 8th week of the study, statistically significant differences were also observed: (GG) 10.0 [9.0; 11.0], (GA) 12.0 [11.0; 12.0], p < 0.001. For other psychometric scales, the same dynamics of changes in scores as in the HAMD scale was obtained.
Figure 1.
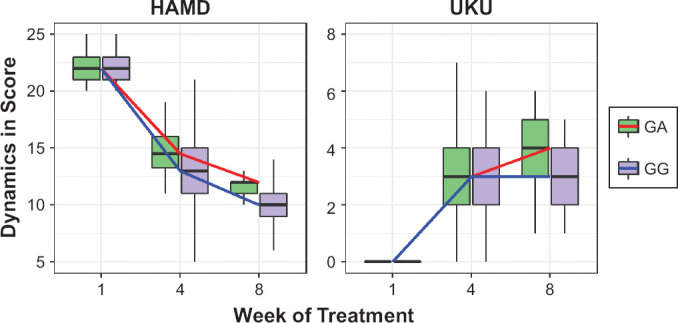
Dynamics of Changes in the HAMD and UKU Scales Scores Across Patients with Different Genotypes by the Polymorphic Marker 1846G>A Gene CYP2D6 (rs3892097)
Data are presented as Me and IQR (colored lines connect the medians on different week of the study).
Dynamics of changes in UKU scores among the patients are presented at Figure 1 of the research the compared groups had no statistically significant differences: (GG) 0.0 [0.0; 0.0], (GA) 0.0 [0.0; 0.0], p = 0.287. By week 4, a statistically significant differences were not observed, as well as like on the 1st visit: (GG) 3.0 [2.0; 4.0], (GA) 3.0 [2.0; 4.0], p = 0.001. A statistically significant difference remained on week 8 of therapy: (GG) 3.0 [2.0; 4.0], (GA) 4.0 [3.0; 5.0], p < 0.001.
Investigation of the effect of 1846G>A polymorphism of the CYP2D6 gene (rs3892097) on the isoenzyme activity (as evaluated by 6M-THBC/pinoline), didn’t demonstrate presence of statistically significant differences in patients with different genotypes: (GG) 8.5 [5.9; 11.3], (GA) 7.6 [5.3; 9.9], p = 0.081 (Table 3, Figure 2). Figure 3 describes a correlation between the difference in HAMD scores and CYP2D6 enzymatic activity (as evaluated by 6M-THBC/pinoline ratio measurement). Calculation of correlation coefficients between the mirtazapine efficacy profile and CYP2D6 activity rates revealed the presence of a statistically significant weak inverse correlation (rs = −0.225, p = 0.002). Correlation analysis between the safety profile (as evaluated by the dynamics of changes in UKU scale scores) and CYP2D6 enzymatic activity (as evaluated by 6M-THBC/pinoline ratio measurement) showed an inverse correlation. The correlation coefficient was also statistically significant (rs = −0.349, p < 0.001). The data are demonstrated in Figure 3.
Table 3. 6M-THBC/Pinoline in Patients with Different Genotypes by the Polymorphic Marker 1846G>A Gene CYP2D6 (rs3892097).
| PARAMETER | GG | GA | P-VALUE | |||
| THBC/Pinoline ratio (n.u) | 8.48 [5.90; 11.29] | 7.56 [5.33; 9.93] | 0.081 | |||
| Pinoline (pg/ml) |
1529.92 [1152.30; 1925.10] |
1454.22 [1103.83; 1875.98] |
0.595 | |||
| 6M-THBC (pg/ml) |
12436.14 [8135.67; 17629.38] |
11212.37 [6783.96; 14713.54] |
0.131 |
p – p-value obtained in Benjamini-Hochberg multiple testing correction (based on the results of Mann-Whitney U test), Data are presented as Me and IQR.
Figure 2.
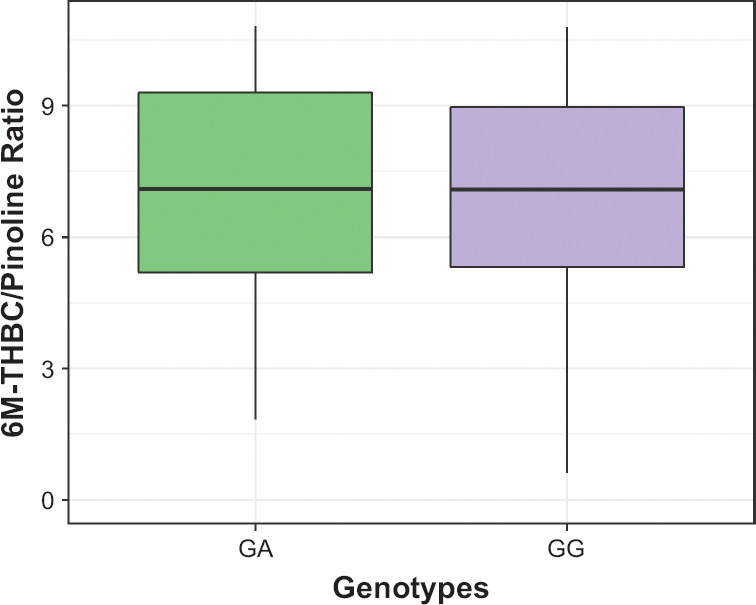
Differences in CYP2D6 Enzymatic Activity Rates (As Evaluated by the 6M-THBC/Pinoline Ratio Measurement) Across Patients With Different Genotypes by the Polymorphic Marker 1846G>A of the CYP2D6 Gene (rs3892097)
Data are presented as Me and IQR.
Figure 3.
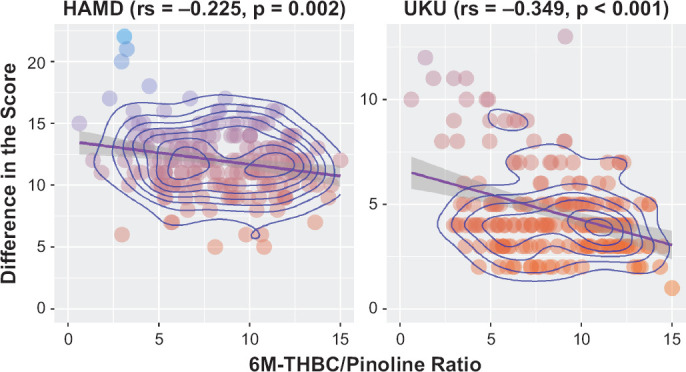
Relationship of CYP2D6 Activity Rates (As Evaluated by the 6M-THBC/Pinoline Ratio Measurement) to the Differences in HAMD and UKU Scores in Patients With Major Depressive Disorder
Table 4 summarizes the data on concentration/dose ratio (C/D) values obtained for mirtazapine through pharmacokinetic studies in terms of quantitative and nominal units. We didn’t reveal a statistical significance for C/D indicator in patients with different genotypes: (GG) 0.229 [0.158; 0.468], (GA) 0.290 [0.174; 0.526], p = 0.196 (Figure 4). Spearman’s correlation analysis revealed the statistically significant correlation between C/D indicator mirtazapine and the activity of CYP2D6 (as evaluated by 6M-THBC/pinoline): rs = −0.391, p < 0.001 (Figure 5).
Table 4. The Values of Mirtazapine Equilibrium Concentration in Patients With Different Genotypes by the Polymorphic Marker 1846G>A Gene CYP2D6 (rs3892097).
| PARAMETER | GG | GA | P-VALUE | |||
| Concentration of mirtazapine, ng/ml | 9.60 [5.79; 14.55] | 9.48 [6.26; 16.65] | 0.297 | |||
| C/D of mirtazapine, u.e. | 0.23 [0.16; 0.47] | 0.29 [0.17; 0.53] | 0.196 |
p – p-value obtained in Benjamini-Hochberg multiple testing correction (based on the results of Mann-Whitney U test), Data are presented as Me and IQR.
Figure 4.
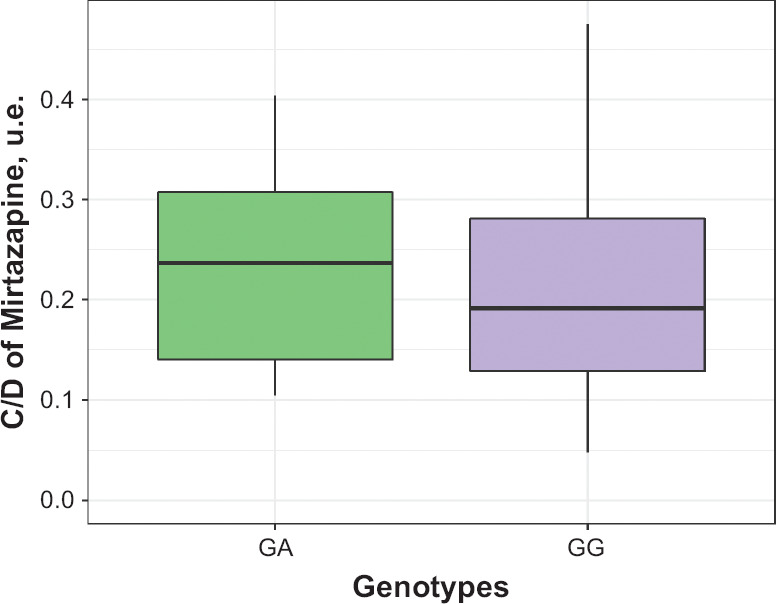
Differences in the Value Mirtazapine Concentration/Dose in Patients With Different Genotypes by the Polymorphic Marker 1846G>A of the CYP2D6 Gene (rs3892097)
Data are presented as Me and IQR.
Figure 5.
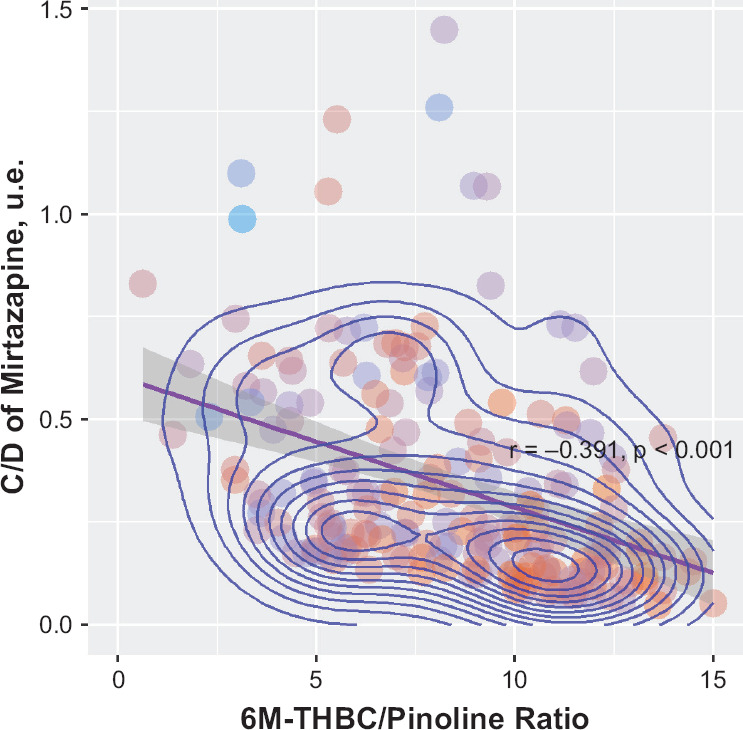
Relationship of CYP2D6 Activity Rates (As Evaluated by the 6M-THBC/Pinoline Ratio Measurement) and the Value of Mirtazapine Conctretation/Dose in Patients With Major Depressive Disorder
Analysis of results of the pharmacotranscriptomic part of our study didn’t show the statistically significant difference in the hsa-miR-370-3p plasma levels in patients with different genotypes (Figure 6): (GG) 23.6 [17.6; 28.0], (GA) 21.8 [17.2; 27.0], p = 0.663. Correlation analysis revealed a statistically significant relationship between the mirtazapine steady-state concentration and the hsa-miR-370-3p plasma concentration: rs = 0.309, p < 0.001 (Figure 7). At the same time, correlation analysis wasn’t observed a statistically significant relationship between the mirtazapine efficacy profile evaluated by changes in HAMD scale scores and the hsa-miR-370-3p plasma concentration: rs = 0.054, p = 0.460 (Figure 7). Also, we didn’t find the correlation between the miRNA concentration and safety profile: rs = 0.111, p = 0.124 (Figure 7). In addition, we evaluated the relationship between the CYP2D6 enzymatic activity (as evaluated by 6M-THBC/pinoline ratio measurement) and the hsa-miR-370-3p plasma concentration: rs = −0.318, p < 0.001 (Figure 7).
Figure 6.
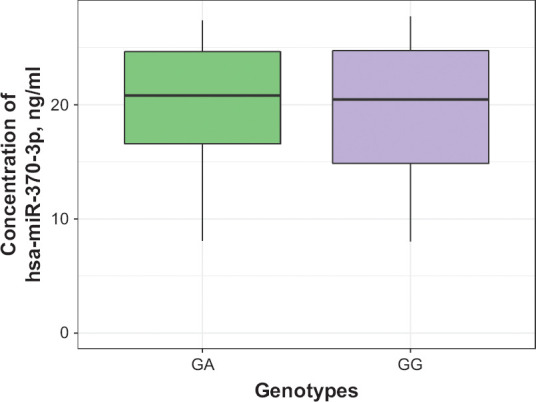
Differences in hsa-miR-370-3p miRNA Plasma Levels Across Patients With Different Genotypes by the Polymorphic Marker 1846G>A of the CYP2D6 Gene (rs3892097)
Data are presented as Me and IQR.
Figure 7.
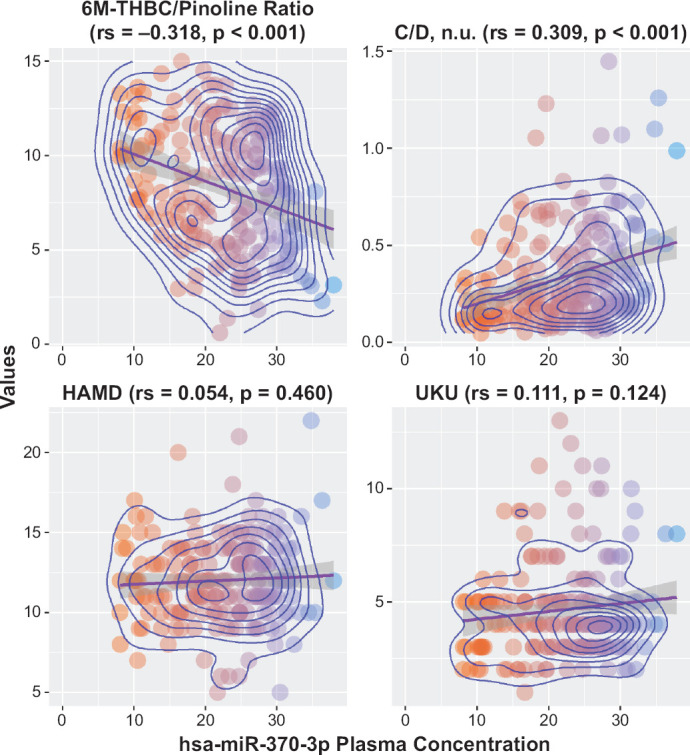
Relationship of CYP2D6 Expression Levels (As Evaluated by Measuring the hsa-miR-370-3p Plasma Levels) to CYP2D6 Activity Rates (As Evaluated by the 6M-THBC/Pinoline Ratio Measurement), Efficacy, Safety and C/D of Mirtazapine
Discussion
The findings of this study didn’t reveal a statistically significant difference between the values of mirtazapine equilibrium concentration in patients with different genotypes of the CYP2D6 gene by polymorphic marker 1846G>A (rs3892097): patients carrying the A allele have a lower level of drug equilibrium concentration than those with the G allele, but a statistical significance wasn’t found (p = 0.196). Therefore, carriage of the G allele doesn’t lead to a cumulation of the drug in plasma, so may not lead to an increased risk of adverse drug reactions and pharmacoresistance, as we have concluded in our previous research.
Statistical analysis of the data on the clinical efficacy profile of mirtazapine in patients with different genotypes by the polymorphic marker 1846G>A of the CYP2D6 gene (rs3892097) revealed the statistically significant differences in the efficacy rates (p < 0.001). The analysis of mirtazapine safety data also revealed the existence of a statistically significant difference (p < 0.001). The value of these parameters is statistically significantly higher for carriers of the minor allele than for carriers of the dominant allele. This may indicate that the carriage of this polymorphic marker may lead to an increased risk of the adverse drug reactions of mirtazapine in comparison with carriers of nonmutant alleles, which is probably due to a reduction of the activity of CYP2D6 in these patients, the substrate of which is mirtazapine, a decrease in the rate of its biotransformation and elimination, and accumulation in plasma level of the drug.
Correlation analysis between the C/D indicator of mirtazapine and the activity of CYP2D6 reveal inverse a statisitcal significant correlation (rs = −0.391, p < 0.001). Probably, this may indicate that the plasma concentration of mirtazapinedepends on the activity of CYP2D6: the lower the value of one, the lower the value of the other. Probably, it may indicate that there is the influence of the activity of CYP2D6 on the C/D indicator. Thus, a plasma concentration of mirtazapine in patients with high activity of CYP2D6 may be lower than in patients with low activity of CYP2D6, which will receive the same dose of mirtazapine. It could be due to high rate of elimination of mirtazapine, since this drug is a substrate of CYP2D6. As a result, this may lead to reduced the efficacy of the therapy of these patients and increase the risk of a pharmacoresistanse. In patients with low activity of CYP2D6, the opposite a rate of elimination of mirtazapine may reduced and it may due to cumulation of the concentration of drug in blood plasma and the risk of adverse drug reactions. It contradicts the genotyping results, because the genotyping didn’t reveal a statistical significant difference in C/D indicator in patients with different genotypes.
Analyzing the relationship between the mirtazapine efficacy profile (dynamics of changes in HAMD scale scores) and safety profile (dynamics of changes in UKU scale scores) and CYP2D6 enzymatic activity (as evaluated by 6M-THBC/pinoline ratio measurement), we revealed a statistically significant relationship between these parameters (rs = −0.225, p = 0.002 and rs = −0.349, p < 0.001, respectively). Thus, based on the results of correlation analysis, we can say that the higher the value of the 6M-THBC/pinoline metabolic ratio, i.e., the higher the CYP2D6 activity, the lower the value of concentration/dose for mirtazapine. It is likely to indicate that CYP2D6 activity may have an impact on the efficacy and safety profiles of mirtazapine: the higher CYP2D6 activity, the lower the medication efficacy, as mirtazapine is likely to be eliminated more rapidly from the body. In turn, patients with reduced CYP2D6 activity will have an increased risk of type A ADRs, as mirtazapine will be slowly eliminated from the body.
It is interesting to note that results of the pharmacometabolomic study and specifically the comparison of CYP2D6, enzymatic activity (as evaluated by 6M-THBC/pinoline ratio measurement) in patients with different genotypes by the polymorphic marker 1846G>A of the CYP2D6 gene (rs3892097), didn’t show the presence a statistically significant difference (p = 0.081). That is, in this part of the study, the question of the validity of this marker can be posed, because its values are not statistically significantly different in patients with different genotypes, although it was assumed that there should be differences, since the carriage of the minor allele by the studied polymorphic marker should change activity CYP2D6, which should also affect the level of concentrations of isoenzyme substrates. Although according to studies by other authors, the validity of this marker is confirmed, including at the level of in vitro studies.
In the final part of the study, the possibility of using a new biomarker (hsa-miR-370-3p) to evaluate the effect of the CYP2D6 expression level on the equilibrium concentration, as well as the efficacy and safety rates of mirtazapine was investigated. Statistical analysis of the results didn’t show a difference in the hsa-miR-370-3p plasma levels in patients with different genotypes by the polymorphic marker 1846G>A of the CYP2D6 gene (p = 0.663). The correlation analysis between the hsa-miR-370-3p plasma concentration and the C/D indicator of mirtazapine has been revealed statistically significant results (rs = 0.309, p < 0.001), that can be explained as a presence of the influence on the expression of CYP2D6 of pharmacokinetics of mirtazapine. The correlation analysis between the hsa-miR-370-3p plasma concentration and the efficacy and safety profiles hasn’t been revealed statistically significant results (rs = 0.054, p = 0.460 and rs = 0.111, p = 0.124, respectively). Also, we evaluated the correlation between the hsa-miR-370-3p plasma levels and CYP2D6 activity (as evaluated by 6M-THBC/pinoline ratio measurement). The results of the analysis showed a statistically significant relationship between these parameters, which may indicate that the CYP2D6 expression level is associated with CYP2D6 activity (rs = −0.318, p < 0.001).
Thus, based on the results obtained that the genetic polymorphism affects affects the efficacy and safety rates of mirtazapine therapy in patients with recurrent depressive disorder, it is possible to assume that before prescribing mirtazapine to such patients it is not necessary to take into account the results of genotyping by the loci of this gene. According to the results of our earlier studies, it was also shown that polymorphism of the CYP2D6 gene should be taken into account when administering mirtazapine, as this may have an impact on the efficacy and safety profile of mirtazapine in this category of patients.13,14
Funding
This work was financially supported by the project 16-15-00227 entitled “Fundamental research and exploratory research in priority areas of research” of the Russian Science Foundation.
Conflict of interest
The authors declare that there is no conflict of interest regarding the publication of this article.
Conclusion
Thus, the effect of genetic polymorphism of the CYP2D6 gene on the efficacy and safety profiles of mirtazapine was demonstrated in a group of 192 patients with recurrent depressive disorder. At the same time, hsa-miR-370-3p remains a promising biomarker for assessing the level of CYP2D6 expression, because it correlates with the encoded isoenzyme activity.
Footnotes
Funding Source
This work was supported by the grant of the Russian Science Foundation (project No. 18-75-10073).
Disclosure
The authors report no conflicts of interest in this work.
References
- 1.Bertilsson L, Dahl ML, Dalen P, Al-Shurbaji A. Molecular genetics of CYP2D6: clinical relevance with focus on psychotropic drugs. Br J Clin Pharmacol. 2002;53(2):111–122. doi: 10.1046/j.0306-5251.2001.01548.x. doi. [DOI] [PMC free article] [PubMed] [Google Scholar]
- 2.Boschloo L, Vogelzangs N, Smit JH, van den Brink W, Veltman DJ, Beekman AT, Penninx BW. Comorbidity and risk indicators for alcohol use disorders among persons with anxiety and/or depressive disorders: findings from the Netherlands Study of Depression and Anxiety (NESDA) J Affect Disord. 2011;131(1-3):233–242. doi: 10.1016/j.jad.2010.12.014. [DOI] [PubMed] [Google Scholar]
- 3.Busner J, Targum SD. The clinical global impressions scale: applying a research tool in clinical practice. Psychiatry (Edgmont) 2007 Jul;4(7):28–37. [PMC free article] [PubMed] [Google Scholar]
- 4.D Empaire I, Guico-Pabia CJ, Preskorn SH. Antidepressant treatment and altered CYP2D6 activity: are pharmacokinetic variations clinically relevant? J Psychiatr Pract. 2011;17(5):330–339. doi: 10.1097/01.pra.0000405363.95881.01. doi. [DOI] [PubMed] [Google Scholar]
- 5.Flannery BA, Volpicelli JR, Pettinati HM. Psychometric properties of the Penn Alcohol Craving Scale. Alcohol Clin Exp Res. 1999;23(8):1289–1295. [PubMed] [Google Scholar]
- 6.Hamilton M. A rating scale for depression. J Neurol Neurosurg Psychiatry. 1960;23:56–62. doi: 10.1136/jnnp.23.1.56. [DOI] [PMC free article] [PubMed] [Google Scholar]
- 7.Jiang XL, Shen HW, Yu AM. Pinoline may be used as a probe for CYP2D6 activity. Drug Metab Dispos. 2009;37(3):443–446. doi: 10.1124/dmd.108.025056. doi. Epub 2008 Dec 18. [DOI] [PMC free article] [PubMed] [Google Scholar]
- 8.Lingjaerde O, Ahlfors UG, Bech P, Dencker SJ, Elgen K. The UKU side effect rating scale. A new comprehensive rating scale for psychotropic drugs and a cross-sectional study of side effects in neuroleptic-treated patients. Acta Psychiatr Scand Suppl. 1987;334:1–100. doi: 10.1111/j.1600-0447.1987.tb10566.x. [DOI] [PubMed] [Google Scholar]
- 9.Neafsey P, Ginsberg G, Hattis D, Sonawane B. Genetic polymorphism in cytochrome P450 2D6 (CYP2D6): Population distribution of CYP2D6 activity. J Toxicol Environ Health B Crit Rev. 2009;12(5-6):334–361. doi: 10.1080/10937400903158342. doi. [DOI] [PubMed] [Google Scholar]
- 10.Shiv G, Akhilesh J, Manaswi G. Guidelines for the Pharmacological Management of Depression. Indian J Psychiatry. 2017;59(1):34–50. doi: 10.4103/00195545.196973. doi. [DOI] [Google Scholar]
- 11.Spear BB, Heath-Chiozzi M, Huff J. Clinical application of pharmacogenetics. Trends Mol Med. 2001;7(5):201–204. doi: 10.1016/s1471-4914(01)01986-4. PMID:11325631. [DOI] [PubMed] [Google Scholar]
- 12.Sychev DA, Zastrozhin MS, Smirnov VV, Grishina EA, Savchenko LM, Bryun EA. The correlation between CYP2D6 isoenzyme activity and haloperidol efficacy and safety profile in patients with alcohol addiction during the exacerbation of the addiction. Pharmgenomics Pers Med. 2016;9:89–95. doi: 10.2147/PGPM.S110385. eCollection 2016. [DOI] [PMC free article] [PubMed] [Google Scholar]
- 13.Zastrozhin MS, Skryabin VY, Smirnov VV, Grishina EA, Ryzhikova KA, Chumakov EM, Bryun EA, Sychev DA. Effects of CYP2D6 activity on the efficacy and safety of mirtazapine in patients with depressive disorders and comorbid alcohol use disorder. Can J Physiol Pharmacol. 2019;97(8):781–785. doi: 10.1139/cjpp-2019-0177. doi. Epub 2019 May 17. [DOI] [PubMed] [Google Scholar]
- 14.Zastrozhin MS, Sorokin AS, Agibalova TV, Grishina EA, Antonenko AP, Rozochkin IN, Duzhev DV, Skryabin VY, Galaktionova TE, Barna IV, Orlova AV, Aguzarov AD, Savchenko LM, Bryun EA, Sychev DA. Using a personalized clinical decision support system for bromdihydrochlorphenylbenzodiazepine dosing in patients with anxiety disorders based on the pharmacogenomic markers. Hum Psychopharmacol. 2018;33(6):e2677. doi: 10.1002/hup.2677. doi. Epub 2018 Oct 25. [DOI] [PubMed] [Google Scholar]
- 15.Zeng L, Chen Y, Wang Y, et al. MicroRNA hsa-miR-370-3p suppresses the expression and induction of CYP2D6 by facilitating mRNA degradation. Biochem Pharmacol. 2017;140:139–149. doi: 10.1016/j.bcp.2017.05.018. doi. [DOI] [PMC free article] [PubMed] [Google Scholar]
- 16.Zhou SF. Polymorphism of human cytochrome P450 2D6 and its clinical significance: Part I. Clin Pharmacokinet. 2009;48(11):689–723. doi: 10.2165/11318030-000000000-00000. doi. [DOI] [PubMed] [Google Scholar]
- 17.Zigmond AS, Snaith RP. The hospital anxiety and depression scale. Acta Psychiatr Scand. 1983 Jun;67(6):361–370. doi: 10.1111/j.1600-0447.1983.tb09716.x. [DOI] [PubMed] [Google Scholar]


