Abstract
Upon activation, macrophages undergo extensive metabolic rewiring1,2. Production of itaconate through the inducible enzyme IRG1 is a key hallmark of this process3. Itaconate inhibits succinate dehydrogenase (SDH)4,5, has electrophilic properties6, and is associated with a change in cytokine production4. Here, we compare the metabolic, electrophilic, and immunologic profiles of macrophages treated with unmodified itaconate and a panel of commonly used itaconate derivatives to examine its role. Using wild type and Irg1−/− macrophages, we show that neither dimethyl itaconate (DI), 4-octyl itaconate (4OI), nor 4-monoethyl itaconate (4EI) are converted into intracellular itaconate, while exogenous itaconic acid readily enters macrophages. We find that only DI and 4OI induce a strong electrophilic stress response, in contrast to itaconate and 4EI. This correlates with their immunosuppressive phenotype: DI and 4OI inhibit IκBζ and pro-IL-1β induction, as well as IL-6, IL-10, and IFN-β secretion in an Nrf2-independent manner. In contrast, itaconate treatment only suppressed IL-1β secretion but not pro-IL-1β levels, and, surprisingly, strongly enhanced LPS-induced IFN-β secretion. Consistently, Irg1−/− macrophages produced lower levels of interferon and reduced transcriptional activation of this pathway. Our work establishes itaconate as an immunoregulatory, rather than strictly immunosuppressive metabolite, and highlights the importance of using unmodified itaconate in future studies.
The body of work investigating itaconate’s immunoregulatory activity can be broadly subdivided into studies using Irg1-deficient macrophages that examine the properties of endogenous itaconate4,6, and studies employing treatment with itaconate derivatives to explore the mechanistic details of how this metabolite regulates immune response4,6,7. These approaches are often complementary: recently, using Irg1−/− macrophages Bambouskova et al6 established that endogenous itaconate triggers NRF2- and ATF3-driven responses in activated macrophages, and the same pathways were shown to be induced using dimethyl itaconate6 (DI) or 4-octyl itaconate (4OI, for the NRF2 pathway only)7.
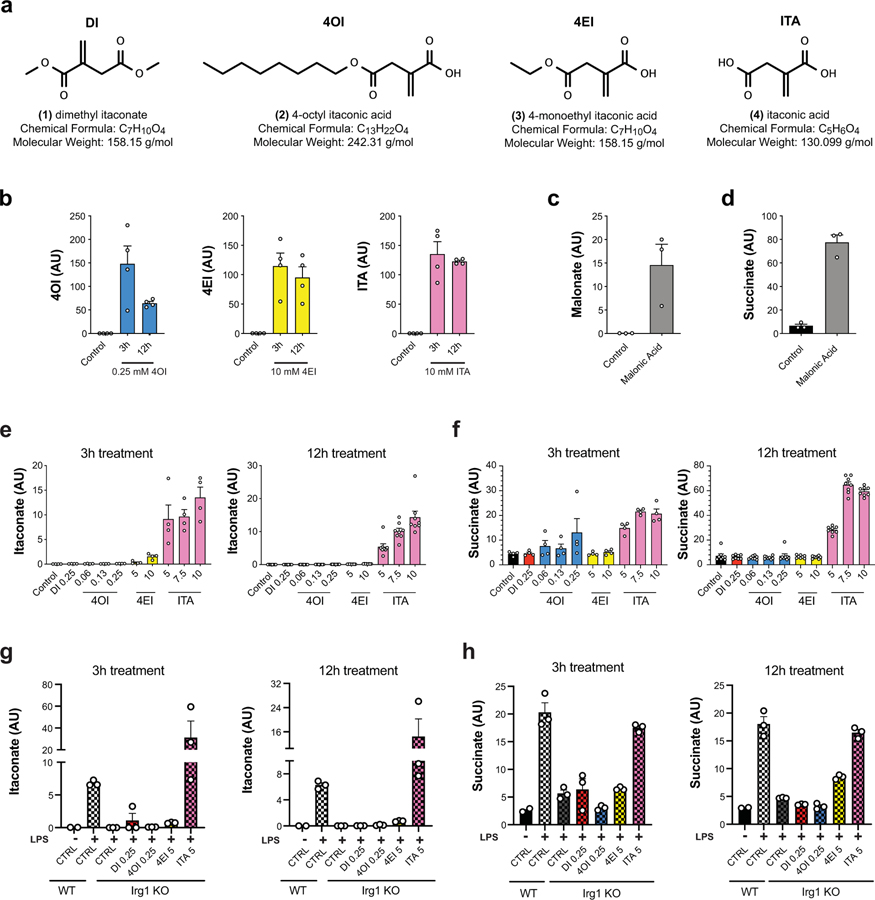
Esterified derivatives of natural metabolites are commonly used to enhance cell permeability of negatively charged, polar metabolites, whereby non-specific cellular esterases can potentially hydrolyze the ester group and release the physiologically relevant form of the molecule intracellularly8. However, these derivatives may not actually recapitulate the effects of the endogenous compounds. While later studies explicitly distinguished between DI and endogenous itaconate when comparing their immunological impact6 (as DI is not metabolized into itaconate in macrophages9), other studies made no distinction between the effects of 4OI and the behavior of endogenous itaconate7,10. At the same time, several reports demonstrated that the non-esterified, physiological form of itaconate can accumulate in cells when added exogenously: RAW264.7 macrophages, A549 lung adenocarcinoma cells, and brown adipocytes accumulate substantial intracellular itaconate levels after treatment with unmodified itaconate5,11, yet the immunological effects of this accumulation were not considered. Furthermore, studies employing these compounds differed in the type of ester modification, experimental incubation time, and formulation: 3 hour incubation time with DMSO as the primary solvent7 versus 12 hour incubation with direct addition of compounds to media4,6. Altogether, the variability in experimental conditions and itaconate-based compounds presents a significant challenge in interpreting the key aspects of itaconate immunology and underscores the need to determine the optimal investigative tool compound and protocol for exogenous treatment of the cells (see ‘Outstanding Questions’ Box in O’Neill & Artyomov, 201912). Thus, we set out to perform a systematic comparison of the metabolic, electrophilic, and immunological properties of the four major compounds reported in the literature to date: itaconate (ITA), dimethyl itaconate (DI), 4-octyl itaconate (4OI), and 4-monoethyl itaconate (4EI) (Fig. 1a).
Figure 1: Unmodified itaconate accumulates in macrophages and promotes succinate accumulation.
a, Chemical structures of itaconate and its derivatives. b, Intracellular levels (n = 4 cultures) of 4OI (blue), 4EI (yellow), and itaconate (pink) after 3h or 12h treatment with the indicated compound in WT BMDMs. Intracellular detection of DI is not amenable to the electrospray ionization LCMS method used for these experiments. c, d, Intracellular levels (n = 3 cultures) of malonate (c) and succinate (d) in WT BMDMs after 3h treatment with 5 mM malonic acid. e, Intracellular levels of itaconate after 3h (n = 4 cultures) or 12h (n = 8 cultures) treatment with the indicated compounds in WT BMDMs. f, Intracellular levels of itaconate after 3h or 12h treatment (n = 3 cultures, except for WT CTRL n = 2 cultures) with the indicated compounds followed by 24h static incubation (unstimulated) or 24h LPS stimulation in WT or Irg1−/− BMDMs. g, Intracellular levels of succinate after 3h (n = 4 cultures) or 12h (n = 8 cultures) treatment with the indicated compounds in WT BMDMs. h, Intracellular levels of succinate after 3h or 12h treatment (n = 3 cultures, except for WT CTRL n = 2 cultures) with the indicated compounds followed by 24h static incubation (unstimulated) or 24h LPS stimulation in WT or Irg1−/− BMDMs. Treatment concentrations for all experiments are listed in mM. All bar plots representative of mean ± s.e.m., except where n < 3 only the mean is depicted. AU = arbitrary units based on mass spectrometry peak area and is not directly comparable between experiments.
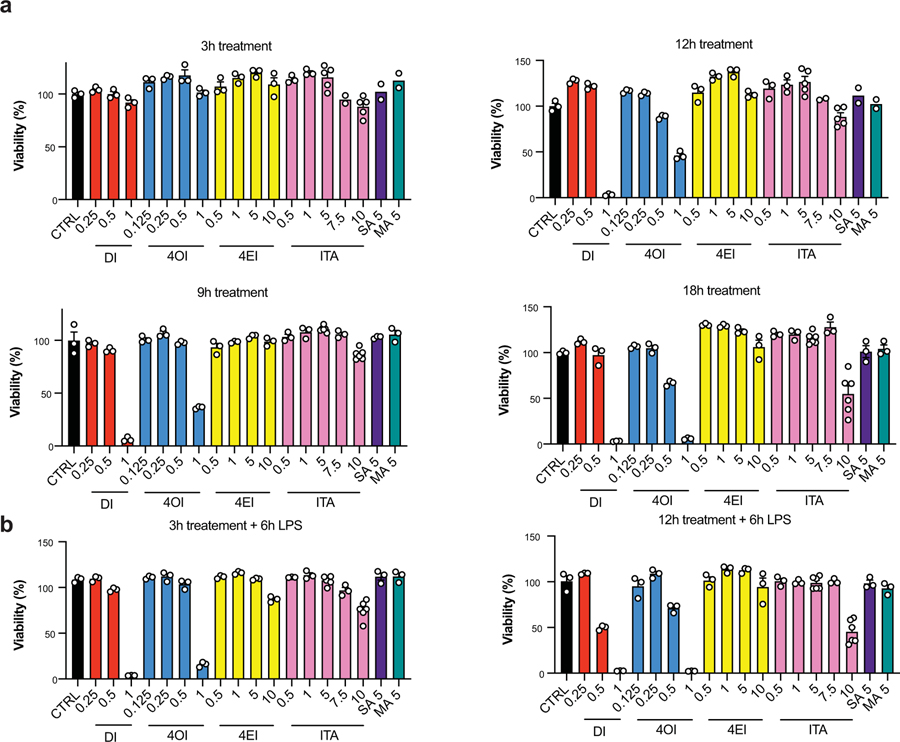
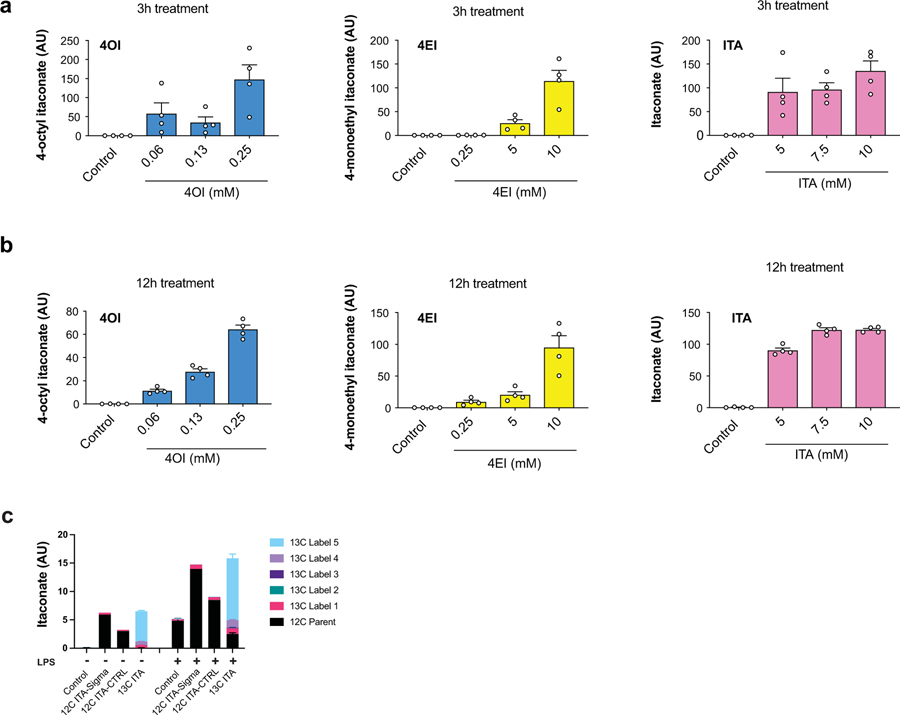
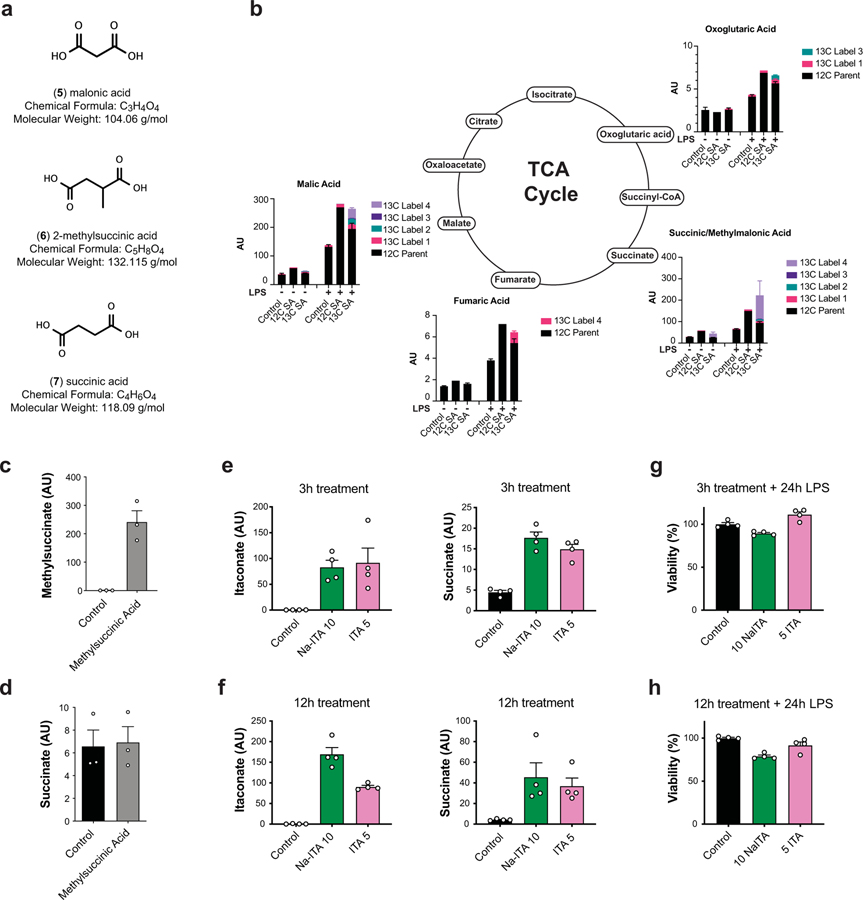
We selected treatment concentrations for each of the compounds, based on viability data: 7.5 mM for itaconate, 0.25 mM for DI, 0.25 mM for 4OI, and 10 mM 4EI (Fig. 1a; Extended Data 1). These concentrations were subsequently used for metabolic and immunological characterization. In order to evaluate the cellular uptake of itaconate and its ester derivatives, we treated primary bone marrow-derived macrophages (BMDMs) with each compound and used LCMS analysis to measure intracellular levels. Indeed, following both 3 hour and 12 hour treatment, we detected significant intracellular levels of itaconate, as well as intracellular 4OI and 4EI (Fig. 1b, Extended Data 2). While intracellular detection of DI is not amenable to the electrospray ionization LCMS method used in these experiments, we previously showed that macrophages take up DI from the media6. Interestingly, no significant time-dependent uptake was observed between the 3 hour and 12 hour measurements, suggesting that 3 hour incubation times are sufficient for these compounds to accumulate inside the cells.
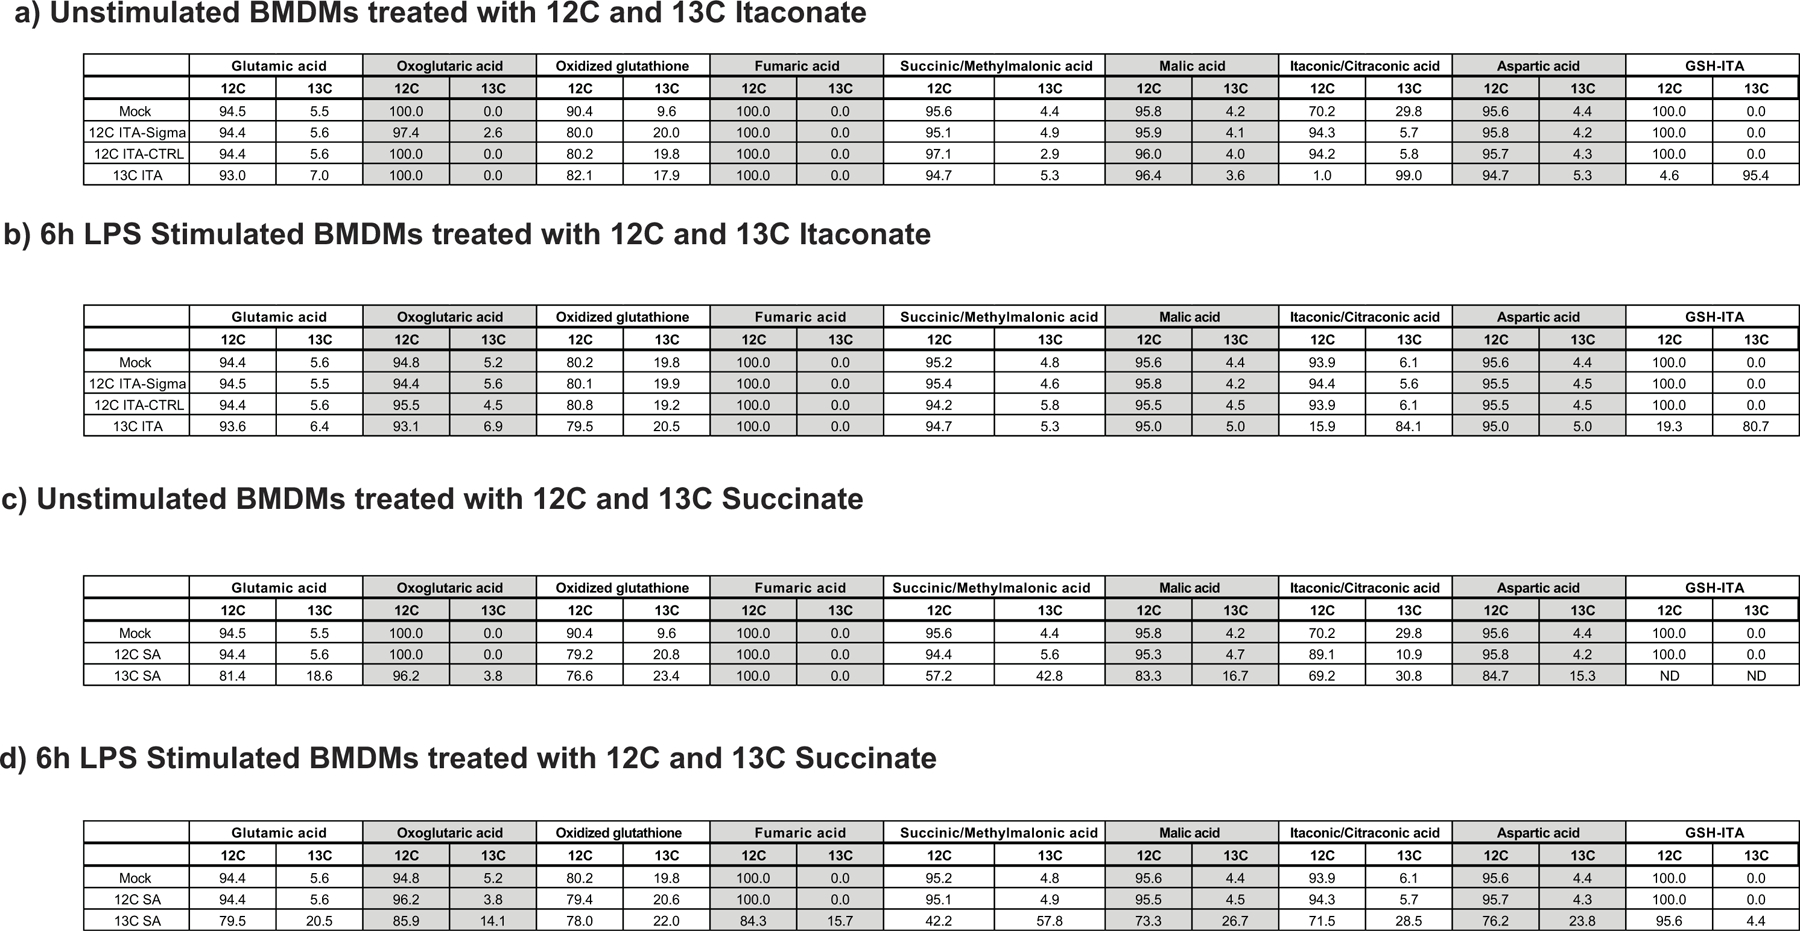
To further validate the uptake of itaconic acid by the cell, we used 13C-labeled itaconate and performed metabolic tracing in both resting wild type macrophages and those stimulated with LPS for 6 hours, i.e. before cells are saturated with endogenous itaconate. Using this strategy, we confirmed that 13C-labeled itaconate accumulates inside the cells (Extended Data 2) and is metabolized to an itaconate-glutathione conjugate (GSH-ITA, Extended Data 3). Importantly, however, we observed no other evidence of itaconate metabolism, particularly into central carbon metabolites (Extended Data 3). Although we did not measure itaconyl-CoA, which requires a dedicated mass spectrometry method, itaconyl-CoA based detoxification would ultimately lead to central metabolism compounds such as pyruvate that then enter central carbon metabolic routes. Thus, even if itaconyl-CoA is being formed, in macrophages it is not metabolized and reutilized in a measurable amount even though it is possible in other cell types13. Altogether, our data confirm and expand upon observations from the Metallo5 and Mootha11 laboratories, and show that the physiological, non-esterified form of itaconate can accumulate intracellularly in primary murine macrophages.
Next, we asked whether itaconate cell permeability reflects general macrophage permeability of the structurally similar dicarboxylic acids malonic and 2-methylsuccinic acid (also known as pyrotartaric acid). Indeed, both malonic and 2-methylsuccinic acid also accumulated in macrophages upon exogenous treatment (Fig. 1c, Extended Data 4). Malonate is a known inhibitor of SDH, and has been used in its non-derivatized form in non-immunological contexts14–16. Indeed, we observe intracellular succinate accumulation after treatment with malonate but not 2-methylsuccinate (Fig. 1d, Extended Data Fig. 4). Furthermore, using the 13C-labeled succinate we find that it can also be taken up by macrophages and actively incorporated into TCA cycle metabolites (Extended Data 3, 4). Importantly, acidity did not play a role in itaconate membrane permeability since treatment with either the itaconic acid form or conjugate base form (neutralized sodium itaconate) also gave rise to intracellular itaconate and succinate accumulation inside of the cells (Extended Data 4).
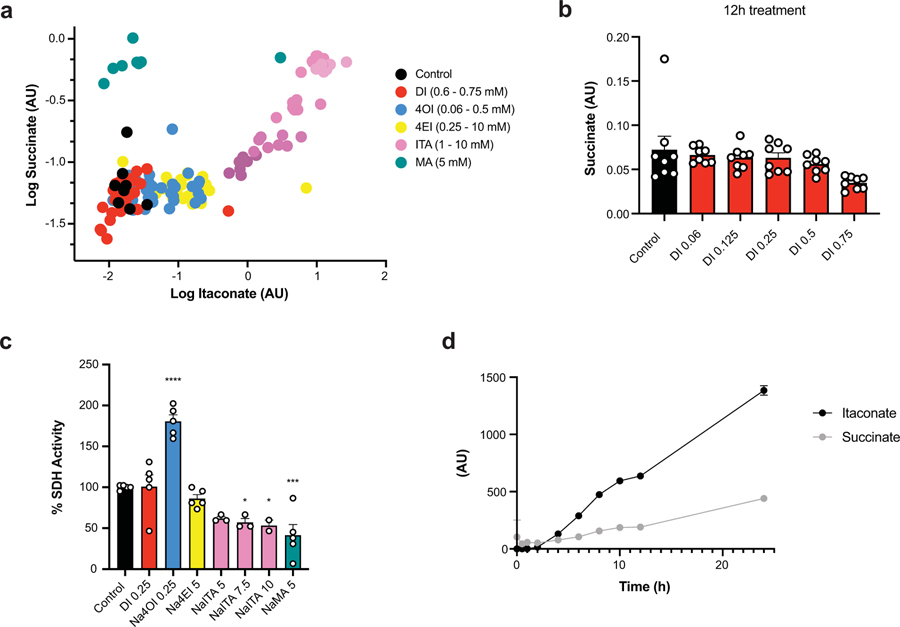
We next compared the ability of various itaconate derivatives to yield intracellular itaconate. Notably, neither 3 hour nor 12 hour treatment with DI or 4OI led to accumulation of itaconate in unstimulated, resting BMDMs (Fig. 1e). These observations for DI and 4OI are consistent with previously published work on permeability and conversion. Indeed, ElAzzouny et al.9 demonstrated that DI is not actively converted to intracellular itaconate in resting macrophages, and Mills et al7 showed that 4OI treatment of resting macrophages does not lead to accumulation of de-esterified itaconate (see Extended Figure 3e in 7). Since itaconate has been shown to inhibit SDH4,17, we analyzed succinate levels after treatment with the panel of compounds and found that only itaconate treatment resulted in increased intracellular succinate accumulation (Fig. 1f), consistent with the inability of ester compounds to produce intracellular itaconate4,9. While we previously observed that treatment with DI can modestly increase succinate levels in unstimulated BMDMs4, extensive metabolic profiling over a wider range of concentrations did not show substantial increase of succinate after addition of DI (Extended Data 5). Consistently, in an in vitro assay of SDH activity, we found that itaconate and malonate inhibit SDH, but none of the derivatives inhibits SDH directly (Extended Data 5).
Pro-inflammatory activation of macrophages can significantly alter their transporters, regulatory activity, and/or metabolic wiring. Thus, it is conceivable that substrate-processing enzymes such as esterases are upregulated in activated cells that could mediate itaconate production from itaconate derivatives in contrast to non-stimulated conditions. For instance, Mills et al7 observed a modest increase (~20%) in intracellular itaconate when activated macrophages are treated with 4OI concentrations over 125 μM. However, these studies were carried out in Irg1-competent (wild type) macrophages, which makes it impossible to unambiguously ascribe the increase in intracellular itaconate to either (1) the regulatory impact of 4OI on endogenous production of itaconate (e.g. through IRG1 activity); (2) its direct itaconate producing potential due to de-esterification of the derivatives; or (3) inhibition of itaconate export/excretion pathways. Here, we report the metabolic profiling in LPS-activated Irg1-deificient macrophages, where itaconate can only arise from direct de-esterification of the derivatives (Fig. 1g, h). Similar to resting macrophages, we observed that none of the ester derivatives yielded a significant amount of intracellular itaconate, while non-derivatized itaconate accumulated in both unstimulated and activated macrophages, reaching intracellular levels comparable to the endogenous production in activated wild-type macrophages (Fig. 1g). Importantly, 5 mM treatment with exogenous itaconate, but not with other compounds, was sufficient to recapitulate the succinate accumulation in activated Irg1−/− macrophages, further providing evidence for a direct effect of itaconate on succinate changes (Fig. 1h). Altogether, our data demonstrate that, among the compounds examined in this study, treatment with exogenous itaconate is the most physiologically relevant compound to study effects of Irg1-produced itaconate; it efficiently and acutely (~3 hours) accumulates in primary cells and mimics the known effects of natural itaconate on metabolic rewiring during macrophage activation.
Recent work has demonstrated that the electrophilic stress response might be an important aspect regulating the immunological impact of itaconate accumulation6. Indeed, comparing wild type and Irg1-deficient macrophages, Bambouskova et al6 showed that production of endogenous itaconate in activated macrophages contributes to NRF2 and ATF3 activation, hallmarks of the electrophilic and integrated stress responses. This was also true for DI treated macrophages, and DI was an even more potent inducer of these pathways6. Consistently, Mills et al7 demonstrated that another itaconate derivative, 4OI, also triggers NRF2 driven responses through direct interactions with KEAP1 (see Fig. 2 in Mills et al7). Yet, the relative magnitude of electrophilicity of the natural, non-esterified itaconate has not been explored.
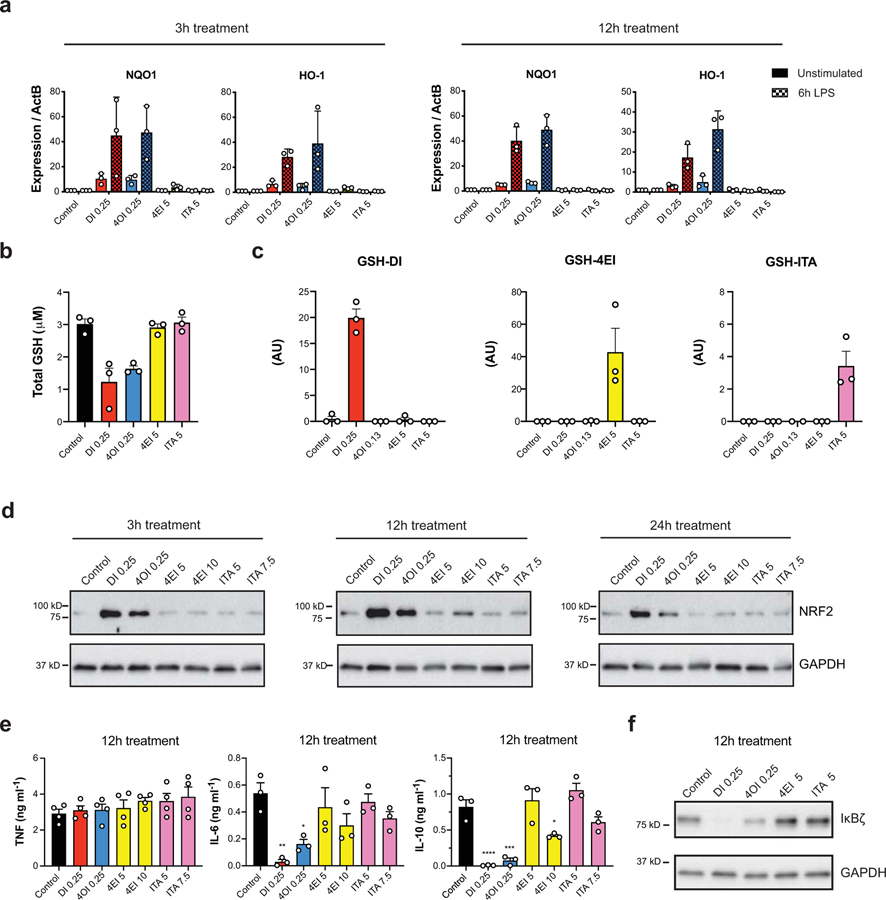
Figure 2: DI and 4OI induce strong electrophilic stress signatures in WT BMDMs.
a, mRNA expression in WT BMDMs pre-treated by the indicated compounds for 3h (left) or 12h (right) followed by either static incubation for 6h (unstimulated) or 6h LPS (n = 3 cultures). b, Total intracellular GSH levels after 3h treatment with the indicated compounds (n = 3 independent experiments). c, Intracellular levels of GSH-DI (red), GSH-4EI (yellow), and GSH-ITA (pink) after 3h treatment with the indicated compounds (n = 3 cultures). AU = arbitrary units based on mass spectrometry peak area, and is not directly comparable between experiments. GSH-4OI was not amenable to detection by this method. d, Western blots for NRF2 from WT BMDM cell lysates after 3h (left), 12h (middle), or 24h (right) treatment with the indicated compounds. Westerns representative of 3 independent experiments. e, Cytokine levels in WT BMDMs pre-treated with the indicated compounds for 12h followed by 4h LPS stimulation (for TNF n = 4 independent experiments, for IL-6 and IL-10 n = 3 independent experiments). * P < 0.05, ** P < 0.01, *** P < 0.001, **** P < 0.0001, P values calculated using one way ANOVA. Exact P values listed in Supplementary Information in Source Data files. f, Western blot of IκBζ expression in WT BMDMs pre-treated with the indicated compounds for 12h followed by 1h LPS stimulation. Westerns representative of 3 independent experiments. Treatment concentrations for all experiments listed in mM. All bar plots representative of mean ± s.e.m.
Accordingly, we set out to compare the extent of electrophilicity-induced stress for the panel of compounds in resting and LPS-activated macrophages (at 6 hours post-stimulation). We find that DI and 4OI strongly induce expression of NRF2-driven electrophilic stress markers - Nqo1 and Hmox1 - while itaconate and 4EI do not induce significant expression of these genes in either resting or activated wild type macrophages (Fig. 2a). This observation is in accord with data from Bambouskova et al for DI6 and also Mills et al7 for 4OI, who observe direct KEAP1 alkylation by intracellular 4OI, rather than with unmodified itaconate, even though they later attribute KEAP1 induction to itaconate itself. Consistent with the increase of NRF2 targets by 4OI and DI, we observed GSH depletion after treatment with these compounds - an effect not observed with 4EI and itaconate (Fig. 2b). Interestingly, we were able to detect the direct conjugate GSH-ITA (as previously observed6) and GSH-4EI upon treating macrophages with these compounds as previously reported with DI6 (Fig. 2c, detection of GSH-4OI was not compatible with the analytical methods used). We validated that GSH-ITA was formed directly from itaconate by treating cells with 13C-labeled itaconic acid and observing a corresponding mass shift in the GSH conjugate (Extended Data 3). These data indicate that the α,β-unsaturated moiety of endogenous itaconate is indeed mildly electrophilic under physiological conditions but does not seem to be reactive enough to induce a KEAP1-NRF2 mediated stress response in the absence of an additional inflammatory context.
Consistent with the transcriptional data on induction of NRF2 targets, we observed that DI and 4OI significantly stabilize NRF2 protein in resting macrophages, while treatment with 4EI and exogenous itaconate does not (Fig. 2d). Thus, our data show that without additional inflammatory/oxidative context, such as prolonged LPS stimulation (16 – 24 hours)6, itaconate itself does not yield significant induction of the NRF2 protein. Altogether, our data indicate that DI and 4OI are strongly electrophilic compounds, while itaconate and 4EI have a relatively lower degree of electrophilicity and highlight an important mechanistic divergence between these compounds. This divergence is particularly important as work by Mills et al7 attributes immunoregulatory effects observed with 4OI to endogenous itaconate, which we show to be very distinct electrophilically.
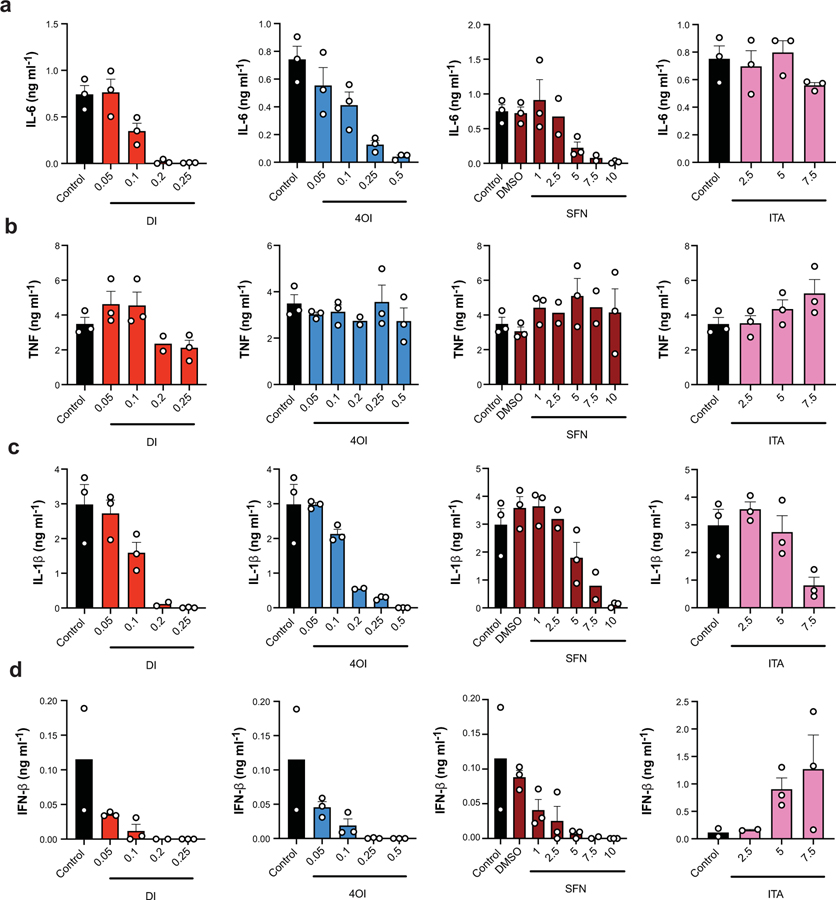
Thus, we set out to consider the immunological impact of exogenous itaconate and its various derivatives. Previous work reported that 12 hour treatment with DI selectively shuts down IκBζ-driven secondary transcriptional responses to inflammatory stimuli in BMDMs through an ATF3-dependent mechanism6. With 12 hour pretreatment, we observed that both DI and 4OI significantly inhibited production of IL-6 and IL-10 but not TNF (Fig. 2e), and this strongly correlated with the inhibitory effect of both compounds on IκBζ protein at 1 hour post LPS stimulation (Fig. 2f). For both DI and 4OI this effect was independent of NRF2 induction, as in NRF2-deficient macrophages DI and 4OI suppressed IκBζ equally well as in wild type macrophages (Extended Data 6). These observations directly associate the ability to inhibit IκBζ protein induction with the electrophilic strength of the compound used during 12 hour treatment, since 4EI and non-esterified itaconate did not inhibit production of IL-6 or IκBζ protein, and only modestly reduced IL-10 (Fig. 2e, f). Indeed, Bambouskova et al6 previously demonstrated that 4EI or endogenous itaconate, in contrast to DI, can inhibit IκBζ induction only when their electrophilic impact is boosted by addition of the GSH biosynthesis inhibitor buthionine sulfoximine.
Next, we considered impact of these compounds on inflammasome activation. Endogenous itaconate has been implicated as a negative regulator of this pathway since Irg1-deficient macrophages secrete increased amounts of mature IL-1β4. Treatment with itaconate derivatives inhibits pro-IL-1β accumulation (Signal 1) in the case of DI4 and 4OI7. Therefore, we aimed to test how the panel of compounds affects both pro-IL-1β production upon LPS priming (Signal 1) and IL-1β release following the classical inflammasome stimuli ATP (Signal 2). We compared pro-IL-1β levels in LPS stimulated cells pre-treated with the compounds for either 3 or 12 hours (Fig. 3a, b). DI reduced the full-length pro-IL-1β at both 3 and 12 hours pre-treatment, while 4OI reduced pro-IL-1β to a lesser extent and only at 12 hours pre-treatment. 4EI and itaconate had little to no effect on pro-IL-1β. However, when we looked at the mature IL-1β production by cells activated with LPS followed by ATP, all treatments resulted in inhibition of IL-1β secretion (Fig. 3c). This reduction in IL-1β secretion was not affected by treatment with malonate, or by direct treatment with succinate, indicating that this immunomodulatory effect does not depend on SDH inhibition by itaconate (Fig. 3d). Furthermore, the effects of both natural and derivatized itaconate on pro-IL-1β production and mature IL-1β secretion occurred in an NRF2-independent manner, contrary to the claims made regarding itaconate’s effect when using 4OI as its proxy7(Fig. 3e, f).
Figure 3: Itaconate inhibits IL-1β secretion in WT BMDMs at the level of signal 2.
a, Westerns blots of pro-IL-1β expression in WT BMDMs pre-treated with the indicated compounds for 3h (top) or 12h (bottom) followed by 4h LPS stimulation. Westerns representative of 3 independent experiments. b, Western blot quantifications (n = 3 independent experiments). c, d, Secreted mature IL-1β levels in WT BMDMs pre-treated with the indicated compounds for 3h (top) or 12h (bottom) followed by 4h LPS stimulation (for (c) n = 4 independent experiments, except for 7.5 mM ITA n = 3 independent experiments, for (d) n = 3 independent experiments). MA = malonic acid, SA = succinic acid. e, Western blots of pro-IL-1β expression in Nrf2−/− BMDMs pre-treated with the indicated compounds for 3h (top) or 12h (bottom) followed by 4h LPS stimulation. Westerns representative of 3 independent experiments. f, Secreted mature IL-1β levels in Nrf2−/− BMDMs pre-treated with the indicated compounds for 3h (top) or 12h (bottom) followed by 4h LPS stimulation (n = 3 independent experiments) * P < 0.05, ** P < 0.01, *** P < 0.001, P values calculated using one way ANOVA. Exact P values listed in Supplementary Information in Source Data files. Treatment concentrations for all experiments listed in mM. All bar plots representative of mean ± s.e.m.
It was previously shown that treatment of stimulated cells with DI and 4OI can limit IFN-β release after LPS stimulation,6,7. Thus, we tested the effects of the panel of itaconate and its derivatives on the type I interferon pathway. Strikingly, the immunological impact was very different when macrophages were pre-treated with natural itaconate for 3 or 12 hours prior to LPS stimulation: we found there was no effect after 3 hour pre-treatment, but IFN-β release was increased 7–9 fold after 12 hour pre-treatment with itaconate at both concentrations tested (Fig. 4a). In stark contrast, the electrophilic derivatives DI and 4OI reduced IFN-β release for both 3 and 12 hour pre-treatment timepoints, consistent with previous reports7 (Fig. 4b). This effect was SDH independent because treatment with malonate or succinate did not result in the same perturbation (Fig 4c). Next, we evaluated whether endogenous itaconate has a similar effect, and compared IFN-β release after 4 hours LPS in WT versus Irg1−/− BMDMs, and found a modest yet statistically significant reduction of IFN-β release in Irg1-deficient macrophages (Fig. 4d) (note that at 4 hours post LPS, itaconate is only beginning to be produced in the cells, see Extended Data 5). To further substantiate the effect on type I interferon signaling, we performed RNA-seq in WT and Irg1−/− BMDMs after 24 hours LPS stimulation and analyzed differentially expressed genes. Indeed, we find that Irg1−/− BMDMs show significantly impaired gene expression downstream of type I interferon signaling (Fig. 4e, f). Additionally, if we reconstitute Irg1−/− cells with unmodified itaconate, type I interferon signaling is restored (Fig. 4e). Note that previous transcriptional data published by our group analyzed LPS + IFN-γ stimulation, which precluded identification of interferon signaling as an important itaconate-regulated pathway4. Overall, our data demonstrate that natural itaconate behaves distinctly differently from the electrophilic derivatives (both DI and OI) and serves as an immunoregulatory rather than purely immunosuppressive metabolite.
Figure 4: Itaconate boosts type I interferon signaling.
a, b, IFN-β levels in WT BMDMs pre-treated with the indicated compounds for 3h or 12h followed by 4h LPS stimulation (n = 3 independent experiments for 3h treatment, n = 8 independent experiments for 12h treatment). ** P < 0.01, **** P < 0.0001, P values calculated using one way ANOVA. Exact P values listed in Supplementary Information in Source Data files. c, IFN-β levels in WT BMDMs pre-treated with the indicated compounds for 12h followed by 4h LPS stimulation (n = 3 independent experiments). MA = malonic acid, SA = succinic acid. d, IFN-β levels in WT or Irg1−/− BMDMs after 4h LPS (n = 4 independent experiments, P = 0.0335, P value calculated by paired two-tailed t test.) e, f, Transcriptional comparison (e) and selected genes (f) regulated by the presence of itaconate after 24h LPS stimulation in WT and Irg1−/− BMDMs or Irg1−/− BMDMs with the addition of 1 mM itaconate 4h after the addition of LPS (n = 3 replicates for each group; GSEA statistics on 12,000 genes after filtering.) Treatment concentrations for all experiments listed in mM. All bar plots representative of mean ± s.e.m.
Given the distinct effects of itaconate’s ester derivatives on IL-6, IL-10, IL-1β, and IFN-β, we asked whether this immunomodulatory property is general for all electrophilic compounds. To that end we evaluated the effect of sulforaphane (SFN), a compound with electrophilicity similar to DI and 4OI. Indeed, as titration curves show (Extended Data 7), all three electrophilic compounds – DI, 4OI and SFN –demonstrated a dose-dependent inhibition of IL-6, IL-1β, and IFN-β production without direct impact on TNF levels. Itaconate, on the other hand, exhibited a striking ability to inhibit mature IL-1β secretion without effect on either TNF or IL-6, and drastically increases IFN-β levels (Extended Data 7). These data indicate that itaconate, while being weakly electrophilic, exhibits a mechanistically distinct action on macrophage activation than more electrophilic compounds such sulforaphane, DI or 4OI.
In summary, we confirm that itaconate in its non-derivatized form can effectively accumulate in macrophages, and thus is sufficient for mechanistic studies. Furthermore, many of the ester derivatives do not lead to the anticipated intracellular itaconate accumulation under the conditions tested, which might result in incorrect interpretations of the data when these derivatives are employed to study endogenous itaconate. For instance, our results clearly demonstrate that no substantial de-esterification of DI, 4OI, or 4EI occurs in activated macrophages, and any changes in itaconate levels observed upon treatment of wild type macrophages are likely due to regulatory action of the derivatives themselves. The importance of using the optimal tool compound is further underscored by the fact that we find major differences in electrophilic and immunological properties between the natural form of itaconate and derivatives such as DI and 4OI: these derivatives are significantly more electrophilic as measured by a set of cell-based assays, fail to produce the considerable levels of intracellular itaconate in either resting or activated conditions, and lead to distinct immunologic impacts compared to treatment with exogenous itaconate. Two major observations emerge from our comprehensive analysis: (1) natural itaconate inhibits inflammasome activation at the level of signal 2, and (2) unmodified itaconate substantially boosts LPS-induced production of IFN-β, while DI and 4OI shut it down. This finding represents a significant shift in the field and underscores itaconate as an immunoregulatory as opposed to purely immunosuppressive metabolite.
Methods
Experimental animals
C57BL/6N WT from Charles River Laboratories. Irg1−/− mice were published previously4. Nrf2−/− mice (Cat. No. 017009) and control mice (Cat. No. 000664) were purchased from Jackson Laboratory. Mice were maintained at Washington University under specific pathogen-free conditions in accordance with Federal and University guidelines and protocols approved by the Animal Studies Committee of Washington University.
Preparation of 13C5-Itaconic Acid
The preparation of 13C5-itaconic acid and 12C-CTRL itaconic acid was performed as described in Bambouskova et al.6 using Escherichia coli cells kindly donated by the Klamt lab.18
Bone marrow-derived macrophages (BMDMs) and mouse cell cultures
BMDMs were prepared from 6 to 16-week-old mice as described2 and seeded at concentration 106 cells/mL in tissue-culture plates of various formats in RMPI-1640 medium supplemented with 10% FBS, 2 mM L-glutamine, and 100 U/mL penicillin-streptomycin and mouse recombinant M-CSF (20 ng/mL, Peprotech). Cells were treated with various concentrations of itaconate (12C-ITA-Sigma; Sigma Cat #129204), dimethyl itaconate (DI; Sigma Cat #592498), 4-octyl itaconate (4OI; Aris Pharmaceuticals Inc. in PA), 4-monoethyl itaconate (4EI; Aris Pharmaceuticals Inc. in PA) (see Supplementary Figure 1 for NMR trace synthesized 4O1 and 4EI), 13C5-itaconate (McGill), 12C-CTRL itaconate (12C-ITA-Sigma; McGill), 13C4-Succinate (Sigma Cat #491985), malonate (Sigma Cat # M1296), 2-methylsuccinate (Sigma Cat #M81209), succinate (Sigma Cat #59512), or D,L-Sulforaphane (SFN; Calbiochem Cat #574215) for the indicated times and activated as shown with LPS (100 ng/mL; Sigma, E. coli 0111:B4). Compounds were prepared as 250 mM stock solutions (except for 4OI which was prepared as a 5 mM stock) in water or PBS and diluted directly into the culture media. Of note, we found that all four compounds were soluble in media and, thus, in order to maintain consistency within the panel of compounds, solutions were prepared directly in cell media in order to avoid solvent effects, although some previous reports used DMSO7. Treatment compounds were present in the media throughout LPS activation. Sodium itaconate was prepared by adding 1:20 10 M NaOH (Sigma Cat #72068) to 250 mM stock solution of itaconic acid.
BV-2 Cell Culture
The BV-2 microglial cell line was a gift from Dr. Stephanie Karst. BV-2 cells were maintained in DMEM medium supplemented with 10% FBS, 2 mM L-glutamine, 1 mM sodium pyruvate and 100 U ml−1 penicillin-streptomycin.
Western Blotting
Cells were lysed in RIPA Lysis Buffer System (Santa Cruz) and heat-denatured at 95 °C for 5 min in reducing sample buffer (BioRad). Proteins were separated on 4%–20% polyacrylamide gradient gels (BioRad) and transferred onto PVDF membranes. Non-specific binding was blocked with 5% skim milk, and membranes were probed with primary antibodies specific to NRF2 (Cell Signaling #12721), pro-IL-1β (Cell Signaling, mouse specific #D3HIZ), IκBζ (Cell Signaling, mouse specific, #93726), or GAPDH (sc-25778), followed by incubation with anti-rabbit-HRP (1:10,000; sc-2030) or anti-mouse-HRP (1:10,000; sc-2031) from Santa Cruz and Clarity western ECL substrate (BioRad). Westerns were imaged using a ChemiDoc™ MP Imaging System (BioRad). Western quantifications were performed using Image J version 1.52k19.
Cell Viability Assay
Cell viability was measured using the CellTiter-GloⓇ Luminescent Cell Viability Assay (Promega) according to the manufacturer’s recommendations.
Metabolite profiling – LCMS
Bone marrow-derived macrophages were seeded in 96-well plates at 105 cell per well for all analyses. After treatment, media was removed from the wells and the cells were washed 3 x with PBS (37 °C) and immediately placed on dry ice. The frozen samples were kept on dry ice or stored at −80°C until extraction. Cell extracts were prepared by adding 200 µL of 80/20 Methanol/ H2O solution at −20 °C with either 100 ng/mL 13C5 itaconate or fully labeled 13C yeast extract (Cambridge Isotopes) as the internal standard (the heavy standards were omitted for isotope labeling studies). After rigorous mixing, 180 μL of the supernatant was collected after centrifugation (4000 rpm for 10 min at 4 °C) and transferred to another 96-well plate and the solvent was evaporated under reduced pressure (Genevac). Two different high-resolution accurate mass (HRAM) liquid-chromatography-mass spectrometry (LCMS) methods were used in this work. For method 1, dried extracts were reconstituted in 50 μL of LCMS grade water and LC separation was achieved by reverse-phase ion-pairing chromatography. The UHPLC system consisted of a Vanquish (Thermo Fisher Scientific, San Jose, USA) pumping system, coupled to an autosampler and degasser. Chromatographic separation was performed using a Synergy Hydro-RP column (100 mm×2 mm, 2.5 µm particle size, Phenomenex, Torrance, CA). The elution gradient was carried out with a binary solvent system as described previously20. For method 2, samples were resuspended in 50 μL of 98:2 Water:MeOH, 0.1% FA, and chromatographic separation was performed using Gemini column (5 μm, C18, 110 Å, 50X4.6 mm, Phenomenex, Torrance, CA). The aqueous mobile phase was 0.1% FA in water and the organic mobile phase was 0.1% FA in MeOH. Initial flow rate was 0.6ml/min of 98% aqueous and 2% organic, at 6.5min 2% aqueous and 98% organic, at 7.6 min organic was reduced to 2% and 98% aqueous for the remaining run time (total run time of 13 minutes). For both methods, HRAM data was acquired using a QExactive™ Orbitrap mass spectrometer (Thermo Fisher Scientific), which was equipped with a heated electrospray ionization source (HESI-II), operated in negative electrospray mode. Instrument control and acquisition was carried out by Xcalibur 2.2 software (Thermo Fisher Scientific). All data analysis was conducted using MAVEN software21.
GSH measurement
Total GSH concentration in cells was determined by a GSH/GSSH Ratio Detection Assay Kit (Abcam) according to manufacturer protocol. Briefly, 106 BMDMs were lysed in 100 μL of 0.5% NP-40 in PBS, pH 6. Samples were deproteinized using trichloroacetic acid and neutralized by addition of 1M NaHCO3 to achieve pH 4 – 6. Collected extracts were directly used for GSH measurement.
SDH Activity Assays
SDH activity was measured using the Complex II Enzyme Activity Microplate Assay Kit (Abcam, ab109908). Briefly, cell lysates were prepared from 10 × 106 BV-2 cells. Lysates were added to the kit plate, which is coated with an anti-Complex II monoclonal antibody, which purifies the enzyme from a complex. After washing, a lipid mixture is added to each well. Just prior to adding the activity solution, neutralized sodium itaconate, sodium malonate, or itaconate derivatives were added to specific wells. The absorbance was measured at 600 nm for 1 hour. The reduction of ubiquinone and subsequent reduction of DCPIP in the activity solution was measured as a decrease in absorbance. SDH activity is measured as the rate of decrease in the absorbance minus the background.
Cytokine detection
Cytokines in cell supernatants were analyzed using DuoSet® ELISA kits (R&D Systems) according to manufacturer protocol.
RNA isolation and reverse transcription-quantitative PCR (RT-qPCR)
RNA from cultured cells was isolated using the Dynabeads mRNA DIRECT Kit (Invitrogen). Isolated RNA was reverse transcribed using a Superscript III reverse transcriptase (Agilent) according to the manufacturer’s protocol. qPCRs were performed in 384-well plates using a SYBR green I master mix (Ambion/Invitrogen) using a LightCycler® 384 (Roche Diagnostics). All assays were performed at least in duplicate, and reaction mixtures in 10 μL volumes were processed under the following cycling conditions: initial 3-min denaturation at 95 °C, followed by 50 cycles at 95 °C for 10 s, 60 °C for 20 s, and 72 °C for 20 s. A melting-curve analysis was carried out from 72 °C to 97 °C with 0.2 °C increments; threshold cycle (CT) values for each sample were determined by automated threshold analysis. Expression levels of all mRNAs were normalized to reference gene Actb. Primer pairs used are listed in Supplementary Table 1.
RNA Sequencing Analysis
mRNA was extracted with oligodT beads (Invitrogen), and libraries were prepared and quantified as described previously22. Sequences for each sample were aligned to the mm10 using the STAR aligner. All RNA-seq experiments were performed in n = 3 independent cultures. Raw and processed data were deposited in the Gene Expression Omnibus with accession number (GSE145950). Pre-ranked gene set enrichment analysis (GSEA) was performed using the GSEA web service (https://www.gsea-msigdb.org/gsea/index.jsp)23,24. Heat maps were generated using the Phantasus online service (https://artyomovlab.wustl.edu/phantasus/).
Statistical Analysis
Statistical analyses were performed in MS Excel or GraphPad Prism 8 software. Data were expressed as mean ± s.e.m. and P values were calculated using one-way ANOVA for multiple comparison of variables. Dunnett’s multiple comparisons test was used. A confidence interval of 95% was used for all statistical tests. Sample sizes were determined based on the experiment type and the standard practice in the field.
Data availability
The raw and processed RNA-seq data have been deposited in the Gene Expression Omnibus with accession number (GSE145950). Source data for the graphical representations found in all figures are provided. All other data that support the findings of this study are available from the corresponding author upon request.
Extended Data
Supplementary Material
Acknowledgements
This work was supported by R01-AI125618 grant to M.N.A.
Footnotes
Competing interests statement
The authors declare that they have no competing interests.
References
- 1.Everts B et al. Commitment to glycolysis sustains survival of NO-producing inflammatory dendritic cells. Blood (2012). 10.1182/blood-2012-03-419747 [DOI] [PMC free article] [PubMed]
- 2.Jha AK et al. Network integration of parallel metabolic and transcriptional data reveals metabolic modules that regulate macrophage polarization. Immunity (2015). 10.1016/j.immuni.2015.02.005 [DOI] [PubMed]
- 3.Michelucci A et al. Immune-responsive gene 1 protein links metabolism to immunity by catalyzing itaconic acid production. Proc. Natl. Acad. Sci. U. S. A (2013). 10.1073/pnas.1218599110 [DOI] [PMC free article] [PubMed]
- 4.Lampropoulou V et al. Itaconate Links Inhibition of Succinate Dehydrogenase with Macrophage Metabolic Remodeling and Regulation of Inflammation. Cell Metab (2016). 10.1016/j.cmet.2016.06.004 [DOI] [PMC free article] [PubMed]
- 5.Cordes T et al. Immunoresponsive gene 1 and itaconate inhibit succinate dehydrogenase to modulate intracellular succinate levels. J. Biol. Chem (2016). 10.1074/jbc.M115.685792 [DOI] [PMC free article] [PubMed]
- 6.Bambouskova M et al. Electrophilic properties of itaconate and derivatives regulate the IκBζ-ATF3 inflammatory axis. Nature (2018). 10.1038/s41586-018-0052-z [DOI] [PMC free article] [PubMed]
- 7.Mills EL et al. Itaconate is an anti-inflammatory metabolite that activates Nrf2 via alkylation of KEAP1. Nature (2018). 10.1038/nature25986 [DOI] [PMC free article] [PubMed]
- 8.MacKenzie ED et al. Cell-Permeating -Ketoglutarate Derivatives Alleviate Pseudohypoxia in Succinate Dehydrogenase-Deficient Cells. Mol. Cell. Biol (2007). 10.1128/mcb.01927-06 [DOI] [PMC free article] [PubMed]
- 9.ElAzzouny M et al. Dimethyl itaconate is not metabolized into itaconate intracellularly. J. Biol. Chem (2017). 10.1074/jbc.C117.775270 [DOI] [PMC free article] [PubMed]
- 10.Daniels BP et al. The Nucleotide Sensor ZBP1 and Kinase RIPK3 Induce the Enzyme IRG1 to Promote an Antiviral Metabolic State in Neurons. Immunity (2019). 10.1016/j.immuni.2018.11.017 [DOI] [PMC free article] [PubMed]
- 11.Shen H et al. The Human Knockout Gene CLYBL Connects Itaconate to Vitamin B12. Cell (2017). 10.1016/j.cell.2017.09.051 [DOI] [PMC free article] [PubMed]
- 12.O’Neill LAJ & Artyomov MN Itaconate: the poster child of metabolic reprogramming in macrophage function. Nature Reviews Immunology (2019). 10.1038/s41577-019-0128-5 [DOI] [PubMed]
- 13.Adler J, Wang S-F & Lardy HA The metabolism of itaconic acid by liver mitochondria. J. Biol. Chem 229, 865–879 (1957). [PubMed] [Google Scholar]
- 14.Valls-Lacalle L et al. Succinate dehydrogenase inhibition with malonate during reperfusion reduces infarct size by preventing mitochondrial permeability transition. Cardiovasc. Res (2016). 10.1093/cvr/cvv279 [DOI] [PubMed]
- 15.Valls-Lacalle L et al. Selective Inhibition of Succinate Dehydrogenase in Reperfused Myocardium with Intracoronary Malonate Reduces Infarct Size. Sci. Rep (2018). 10.1038/s41598-018-20866-4 [DOI] [PMC free article] [PubMed]
- 16.Valls-Lacalle L et al. Author Correction: Selective Inhibition of Succinate Dehydrogenase in Reperfused Myocardium with Intracoronary Malonate Reduces Infarct Size (Scientific Reports, (2018), 8, 1, (2442), 10.1038/s41598-018-20866-4). Scientific Reports (2019). 10.1038/s41598-019-42591-2 [DOI] [PMC free article] [PubMed]
- 17.Ackermann WW & Potter VR Enzyme Inhibition in Relation to Chemotherapy. Proc. Soc. Exp. Biol. Med (1949). 10.3181/00379727-72-17313 [DOI] [PubMed]
- 18.Harder BJ, Bettenbrock K & Klamt S Model-based metabolic engineering enables high yield itaconic acid production by Escherichia coli. Metab. Eng 38, 29–37 (2016). [DOI] [PubMed] [Google Scholar]
- 19.Schneider CA, Rasband WS & Eliceiri KW NIH Image to ImageJ: 25 years of image analysis. Nat. Methods 9, 671–675 (2012). [DOI] [PMC free article] [PubMed] [Google Scholar]
- 20.Lu W et al. Metabolomic Analysis via Reversed-Phase Ion-Pairing Liquid Chromatography Coupled to a Stand Alone Orbitrap Mass Spectrometer. Anal. Chem 82, 3212–3221 (2010). [DOI] [PMC free article] [PubMed] [Google Scholar]
- 21.Melamud E, Vastag L & Rabinowitz JD Metabolomic Analysis and Visualization Engine for LC−MS Data. Anal. Chem 82, 9818–9826 (2010). [DOI] [PMC free article] [PubMed] [Google Scholar]
- 22.Vincent EE et al. Mitochondrial Phosphoenolpyruvate Carboxykinase Regulates Metabolic Adaptation and Enables Glucose-Independent Tumor Growth. Mol. Cell 60, 195–207 (2015). [DOI] [PubMed] [Google Scholar]
- 23.Subramanian A et al. Gene set enrichment analysis: A knowledge-based approach for interpreting genome-wide expression profiles. Proc. Natl. Acad. Sci. U. S. A 102, 15545–15550 (2005). [DOI] [PMC free article] [PubMed] [Google Scholar]
- 24.Daly MJ et al. PGC-1α-responsive genes involved in oxidative phosphorylation are coordinately downregulated in human diabetes. Nat. Genet 34, 267–273 (2003). [DOI] [PubMed] [Google Scholar]
Associated Data
This section collects any data citations, data availability statements, or supplementary materials included in this article.
Supplementary Materials
Data Availability Statement
The raw and processed RNA-seq data have been deposited in the Gene Expression Omnibus with accession number (GSE145950). Source data for the graphical representations found in all figures are provided. All other data that support the findings of this study are available from the corresponding author upon request.


