

Abstract
Aims/Introduction
To develop a non‐invasive risk score to identify Saudis having prediabetes or undiagnosed type 2 diabetes.
Methods
Adult Saudis without diabetes were recruited randomly using a stratified two‐stage cluster sampling method. Demographic, dietary, lifestyle variables, personal and family medical history were collected using a questionnaire. Blood pressure and anthropometric measurements were taken. Body mass index was calculated. The 1‐h oral glucose tolerance test was carried out. Glycated hemoglobin, fasting and 1‐h plasma glucose were measured, and obtained values were used to define prediabetes and type 2 diabetes (dysglycemia). Logistic regression models were used for assessing the association between various factors and dysglycemia, and Hosmer–Lemeshow summary statistics were used to assess the goodness‐of‐fit.
Results
A total of 791 men and 612 women were included, of whom 69 were found to have diabetes, and 259 had prediabetes. The prevalence of dysglycemia was 23%, increasing with age, reaching 71% in adults aged ≥65 years. In univariate analysis age, body mass index, waist circumference, use of antihypertensive medication, history of hyperglycemia, low physical activity, short sleep and family history of diabetes were statistically significant. The final model for the Saudi Diabetes Risk Score constituted sex, age, waist circumference, history of hyperglycemia and family history of diabetes, with the score ranging from 0 to 15. Its fit based on assessment using the receiver operating characteristic curve was good, with an area under the curve of 0.76 (95% confidence interval 0.73–0.79). The proposed cut‐point for dysglycemia is 5 or 6, with sensitivity and specificity being approximately 0.7.
Conclusion
The Saudi Diabetes Risk Score is a simple tool that can effectively distinguish Saudis at high risk of dysglycemia.
Keywords: Diabetes risk score, Dysglycemia, Saudi population
We aimed to develop a non‐ invasive risk score to identify Saudi individuals with prediabetes or undiagnosed type 2 diabetes. Adult Saudis without diabetes were recruited randomly from the Saudi population. Various blood tests were used to define prediabetes and type 2 diabetes (dysglycemia). The final model for the Saudi Diabetes Risk Score constituted sex, age, waist circumference, history of hyperglycemia and family history of diabetes, with the score ranging from 0 to 15, and the cut‐point for dysglycemia being 5 or 6.

Introduction
The rising prevalence of type 2 diabetes globally, and its subsequent socioeconomic burden imposes a challenge to governments of all countries1. Prediabetes precedes the development of type 2 diabetes by several years2, 3, 4. In most cases, prediabetes remains undiagnosed, and hence untreated, allowing further deterioration in metabolic regulation, and worsening of vascular complications2, 3, 4, leading to an increased risk of progressing to diabetes, and developing cardiovascular disease3, 5. Fortunately, type 2 diabetes is preventable, and might be even reversed, as proven by various studies6, 7, 8, 9, 10, 11, 12. Efforts to prevent type 2 diabetes need to start as early as possible, and address various susceptibility factors, many of which might be population specific. Hence, identifying people at high risk for type 2 diabetes early will be an important component to prevent new cases, and reduce costs8, 9, 12. Some available risk‐assessment models for diabetes require specific laboratory tests after diagnostic assessment13, 14, 15, hence they are not practical tools for the assessment of risk in large population screening16. However, screening tools, such as non‐laboratory risk scores, which only require information a participant can self‐complete, offer an efficient method in identifying individuals with asymptomatic type 2 diabetes and prediabetes. Parameters included in such non‐laboratory risk scores have been those that are known risk factors for type 2 diabetes. The usually included predictor variables have been: age, indicators of obesity, physical inactivity, indicators of diet, family history of type 2 diabetes, hypertension and history of disturbances of glucose metabolism. Also, other factors, such as sleep disturbances, smoking history, sitting time and so on might be considered as non‐laboratory parameters for a diabetes risk score.16, 17, 18, 19, 20, 21
One of the first risk scores to be developed was the Finnish Diabetes Risk Score (FINDRISC)16, which has been used in the Finnish primary healthcare system to identify high‐risk individuals who might benefit from interventions, or who would merit further investigation using the oral glucose tolerance test (OGTT)10, 17. Various risk score models based on the FINDRISC were validated and developed further, and used in other countries18, 19, 20. However, modifications were required to improve specificity and sensitivity as a result of the genetics and lifestyle characteristics of each population18, 19, 20, 21.
Saudi Arabia has one of the highest diabetes prevalence globally22. Efforts to combat this epidemic have not been successful so far, considering the noted rise over the years23, 24, 25, 26. In view of this, identifying individuals with asymptomatic type 2 diabetes and prediabetes (i.e., dysglycemia) in the Saudi population is becoming of utmost importance, especially as there is a long asymptomatic period before type 2 diabetes can be detected3, 7, and as many newly diagnosed patients already show evidence of microvascular complications7, 27. Targeted screening for dysglycemia with a screening questionnaire as a first step has been shown to be successful in detecting dysglycemia and allowing early intervention10, 17, 18, 19, 20, 21. Attempts to construct a Saudi diabetes risk score proposed previously28, 29, 30 included various limitations preventing their wide adoption.
Therefore, we aimed to develop a valid and easy to administer tool, so that the selection of variables and their relative weights to be included in the Saudi Diabetes Risk Score (SADRISC) are best suited to identify Saudi individuals who have undiagnosed type 2 diabetes or prediabetes. Furthermore, because of the variation in the differences in genetics and lifestyle characteristics between the Finnish and the Saudi people, and the expected effect on the used risk score, we aimed to compare the performance of the developed model (i.e., sensitivity and specificity) with the FINDRISC predictive model16.
Methods
Study design
A cross‐sectional design was used to recruit adult Saudis free of known diabetes from public healthcare centers (PHCCs), using a stratified two‐stage cluster sampling method between July 2016 and February 201731. During the first stage, three PHCCs from each of the five geographical sectors in Jeddah were selected randomly. In the second stage, suitable individuals (adults aged ≥20 years not previously diagnosed with diabetes) were included using systematic sampling, until reaching target sample size, which was calculated based on a previous study in Jeddah26. Individuals with previously diagnosed diabetes, cancer, renal or liver disease, cardiovascular disease, gastrointestinal diseases requiring a special diet, physical or mental disabilities and pregnant women were excluded.
A total sample size of 1500 (750 men and 750 women) was targeted, with 300 individuals in each 10‐year age stratum (20–29, 30–39, 40–49, 50–59, ≥60 years). Sample size was calculated for each center to reflect population density.
Ethical approval was obtained from the Committee on Ethics of Human Research at Faculty of Medicine, King Abdulaziz University, and Committee on Research Ethics at Ministry of Health, Kingdom of Saudi Arabia.
Data collection
A questionnaire in Arabic was designed to collect information covering demographic (age, sex, etc.), dietary (intake of fruit, vegetable, red meat, bread and cereals, hot and cold beverages) and lifestyle variables (physical activity, sleep duration, sitting hours and smoking habits), as well as medical history, including, present medication, previous dysglycemia, dyslipidemia and family history of chronic diseases. Collected information was chosen based on previous factors found to be associated with dysglycemia in other populations5, 6, 7, 8, 9, 10, 11, 12, 16, 19, 20, 21. Medical students were trained to carry out interviews and perform other required tasks.
After recruitment, participants signed a consent form, and were instructed to fast overnight for 8–14 h. At the second visit, a fasting blood sample was taken, for determination of fasting plasma glucose (FPG) and glycated hemoglobin (HbA1c), followed by ingestion of 50‐g glucose solution (CASCO NERL Diagnostics, East Providence, RI, USA), then another sample was drawn 1 h later for estimation of glucose (1‐h OGTT)32, 33. For glucose, sodium‐citrate tubes were used, and blood samples were immediately placed on ice and transported to King Abdulaziz University, where plasma was separated and frozen at −80°C. For HbA1c, ethylenediaminetetraacetic acid tubes were used and stored at 4°C for later analysis at the end of each working week. While waiting, data collectors took anthropometric measurements, and blood pressure (BP) using standardized equipment and techniques. Height was measured bare footed to the nearest 0.5 cm using a stationary stadiometer. Weight was measured to the nearest 0.5kg while wearing light street clothing using a portable calibrated scale (Omron BF511; OMRON Healthcare, Kyoto, Japan). These measurements were used to calculate body mass index (BMI). Waist circumference (WC) was measured at the midway between the lowest rib and iliac crest to the nearest 0.5 cm. Using WC to indicate abdominal adiposity, the first cut‐off value for increased risk was defined as >94 cm for men and >80 cm for women, and the second cut‐off value as >102 cm for men and >88 cm for women34, 35. BP was measured using an electronic sphygmomanometer (KBM Mercurial Desk type SM‐300; Kawamoto Corporation, Osaka, Japan). Two BP readings were taken after the person has been seated for 10 min within an interval of 1 min, and the average of the two readings was calculated. If a difference >5 mmHg between these two measures was found, a third measurement was taken and the average of the two closest values was calculated. Hypertension was defined as systolic BP ≥140 mmHg and/or diastolic BP ≥90 mmHg, or current use of antihypertensive medication36.
Biochemical assays
Whole blood and plasma samples were regularly sent to an accredited clinical chemistry laboratory at the National Guard Hospital in Jeddah. HbA1c was measured with high‐pressure liquid chromatography using automated HbA1c analyzer G8 (TOSOH Corporation, Yamaguchi, Japan). Plasma glucose was measured by spectrophotometric methods using an Architect c8000 auto‐analyzer (Abbott, Abbott Park, IL, USA).
Definitions of diabetes and prediabetes
Prediabetes was defined as HbA1c 5.7–6.4% (39–46 mmol/mol), FPG 6.1–6.9 mmol/L (impaired fasting glucose) or 1‐h plasma glucose (1‐hPG) 8.6−11.0 mmol/L (impaired glucose tolerance). Participants with HbA1c ≥6.5%, FPG ≥7 mmol/L or 1‐h OGTT ≥11.1 mmol/L were considered to have diabetes33, 37, 38, 39. People with either prediabetes or diabetes were considered to have dysglycemia.
Statistical analysis
Data were analyzed using IBM SPSS statistics version 20.0 for Windows (IBM Corporation, Armonk, NY, USA). Descriptive statistics, frequencies, mean and standard deviation were used to describe the baseline characteristics of the study population. Multicollinearity diagnostics were carried out to check for correlations between independent variables. BMI and WC showed a correlation >0.6, and thus exceeded the threshold of indicating multicollinearity. In the final risk score model, only WC was included. Unadjusted and adjusted logistic regression models were used for assessing the association between sociodemographic risk factors and lifestyle habits and outcome variables: prediabetes, type 2 diabetes and dysglycemia. Hosmer–Lemeshow summary statistics were used to assess the goodness‐of‐fit of the model. The level of statistical significance was set to 0.05.
First, univariate logistic regression analysis was carried out to determine which variables were significantly associated with dysglycemia. Second, these variables were included in multivariate models to develop the final model of the SADRISC. After methodology for the development of the FINDRISC, logistic regression was used to compute β‐coefficients for known risk factors for type 2 diabetes. Coefficients (β) of the model were used to assign a score value for each variable, and the composite diabetes risk score was calculated as the sum of those scores. The total dysglycemia risk score value was defined using the full model, from the β‐coefficient, as follows: for β = 0.01–0.49, the score was 1; for β = 0.50–0.9, the score was 2; for β = 0.9–1.2 the score was 3; for β = 1.2–1.6, the score was 4; and for β >1.6, the score was 5. The lowest category (reference) of each variable was given a score of 0. Total dysglycemia risk score was calculated as the sum of the individual scores.
The receiver operating characteristic curve was developed, and sensitivity, specificity, and positive and negative predictive values were calculated for the SADRISC for several cut‐off points. The SADRISC was also tested against the FINDRISC model.
Results
A total of 1,477 adults were recruited; however, except for WC, all other data were available for 1,403 people. WC measurements were available for 1,376 participants. In most of the excluded cases, laboratory samples were missing for various reasons (hemolysis, missing labels or broken tubes). The mean age was 32 ± 11.5 years; 32 ± 10.7 for men and 34 ± 12.4 for women, ranging from 20 to 81 years. The characteristics of the studied population are presented in Table 1.
Table 1.
Descriptive demographic, lifestyle and anthropometric characteristics of the Saudi Arabian Diabetes Risk Score study participants
| Variable |
Total (n = 1,403) n (%) |
Men (n = 791) n (%) |
Women (n = 612) n (%) |
|---|---|---|---|
| Age group (years) | |||
| <35 | 926 (66) | 566 (72) | 360 (59) |
| 35–44 | 261 (19) | 134 (17) | 127 (21) |
| 45–54 | 135 (10) | 53 (7) | 82 (13) |
| 55–64 | 60 (4) | 25 (3) | 35 (6) |
| >64 | 21 (1) | 13 (2) | 8 (1) |
| Body mass index (kg/m2) | |||
| <25 | 495 (35) | 269 (34) | 226 (37) |
| 25–<30 | 493 (35) | 293 (37) | 200 (33) |
| ≥30 | 415 (30) | 229 (29) | 186 (30) |
| Waist circumference (cm) | |||
| Normal (<94 cm men, <80 cm women) | 523 (38) | 332 (43) | 191 (32) |
| Abdominal obesity level 1 (men >94–102, women >80–88) | 330 (24) | 213 (27) | 117 (20) |
| Abdominal obesity level 2 (men >102, women >88) | 523 (38) | 237 (30) | 286 (48) |
| Ethnic origin | |||
| Arabian tribes | 1070 (76) | 632 (80) | 438 (72) |
| African tribes | 72 (5) | 29 (4) | 43 (7) |
| Mediterranean countries | 67 (5) | 27 (3) | 40 (7) |
| Indian continent | 95 (7) | 62 (8) | 33 (5) |
| Central Asia | 20 (1) | 9 (1) | 11 (2) |
| South East Asia | 38 (3) | 17 (2) | 21 (3) |
| Mixed | 41 (3) | 15 (2) | 26 (4) |
| Physical activity (30 min/day–5 days/week) | |||
| No | 790 (56) | 435 (55) | 355 (58) |
| Yes | 613 (44) | 356 (45) | 257 (42) |
| Sleep duration (h) | |||
| ≤6 | 553 (40) | 339 (43) | 214 (35) |
| >6–8 | 720 (51) | 408 (52) | 312 (51) |
| >8 | 130 (9) | 44 (5) | 86 (14) |
| Sitting hours/day | |||
| <4 | 263 (18.7) | 106 (13.4) | 157 (25.7) |
| 4–5 | 426 (30.6) | 239 (30.2) | 187 (30.6) |
| 6–8 | 438 (31.2) | 278 (35.1) | 160 (26.1) |
| >8 | 276 (19.7) | 168 (21.2) | 108 (17.6) |
| Smoking habits | |||
| Non‐smokers | 956 (68.1) | 447 (56.6) | 509 (83.2) |
| Current smokers | 303 (21.6) | 261 (33) | 42 (6.9) |
| Passive smokers | 98 (7) | 39 (4.9) | 59 (9.6) |
| Previous smokers | 46 (3.3) | 44 (5.6) | 2 (0.3) |
| Daily fruit or vegetable intake (at least one portion) | |||
| No | 511 (36) | 315 (40) | 196 (32) |
| Yes | 892 (64) | 476 (60) | 416 (68) |
In laboratory assessments, 69 people were found to have diabetes (49 men and 20 women), and 259 had prediabetes (146 men, and 113 women). Figure 1 shows the proportion of people identified with dysglycaemia through each of the three used measures of glycemia. A total of 60% of participants were identified by 1‐hPG (32% with 1‐hPG alone), 59% by HbA1c (31% with HbA1c alone), 19% using FPG (6% with FPG alone) and just 28 participants (9%) of the entire sample with dysglycemia had elevated values of all three measures of glycemia simultaneously.
Figure 1.

Venn diagram for the detection of dysglycemia in the Saudi glycemia screening participants. The cut‐point for fasting plasma glucose (FPG) was 6.1 mmol/L, 1‐h post‐challenge plasma glucose (1‐hPG) 8.6 mmol/L and glycated hemoglobin (HbA1c) 5.7%/39 mmol/mol.
Clinical and biochemical characteristics of participants by sex are presented in Table 2. The prevalence of dysglycemia increased with age (Table 3). Numerically, men showed a higher prevalence than women, but it reached statistical significance only in the age group 35–44 years. People with dysglycaemia were older, more obese and less physically active (Table 4).
Table 2.
Clinical and biochemical characteristics in the Saudi Arabian Diabetes Risk Score participants
| Variable |
Total (n = 1,403) |
Men (n = 791) |
Women (n = 612) |
|---|---|---|---|
| FPG, mmol/L (mean ± SD) | 4.4 ± 1.4 | 4.4 ± 1.6 | 4.4 ± 1.0 |
| 1‐h, PG mmol/L (mean ± SD) | 6.6 ± 2.6 | 6.6 ± 2.9 | 6.6 ± 2.2 |
| HbA1c, % (mean ± SD) | 5.2 ± 1.0 | 5.3 ± 0.7 | 5.3 ± 0.6 |
| Mmol/mol (mean ± SD) | 34.6 ± 7.0 | 34.7 ± 7.4 | 34.5 ± 6.5 |
| SBP(mean ± SD) | 118 ± 15 | 122 ± 14 | 113 ± 16 |
| People with high values (n) | 97 (6.9%) | 62 (7.8%) | 35 (5.7%) |
| DBP (mean ± SD) | 73 ± 12 | 75 ± 11 | 71 ± 12 |
| People with high values (n) | 141 (10.0%) | 88 (11.1%) | 53 (8.7%) |
| People with hypertension (n) | 222 (15.8%) | 129 (16.3%) | 93 (15.2%) |
| Use of blood pressure lowering medication (%) | 4 | 3 | 6 |
| Past history of hyperglycemia (in a medical checkup, during an illness or pregnancy) | 8% | 14% | |
| Family history of diabetes mellitus (%) | |||
| Yes: grandparent, uncle, aunt or cousin | 11 | 11 | 12 |
| Yes: Biological father, mother or sibling | 52 | 49 | 56 |
| Score based on FINDRISC (mean ± SD) | 9 ± 5 | 8 ± 4 | 9 ± 5 |
FINDRISC, Finnish Diabetes Risk Score.
Table 3.
Prevalence of dysglycemia according to sex and age in the Saudi glycemia
| All | Men | Women | P‐value | ||||
|---|---|---|---|---|---|---|---|
| % | n | % | n | % | n | ||
| Age group | |||||||
| <35 years (n = 926) | 14 | 128 | 15 | 87 | 11 | 41 | 0.097 |
| 35–44 years (n = 261) | 36 | 93 | 43 | 57 | 28 | 36 | 0.020 |
| 45–54 years (n = 135) | 44 | 60 | 49 | 26 | 42 | 34 | 0.478 |
| 55–64 years (n = 60) | 53 | 32 | 60 | 15 | 49 | 17 | 0.439 |
| ≥65 years (n = 21) | 71 | 15 | 77 | 10 | 63 | 5 | 0.631 |
| All (total n = 1,403, men n = 791, women n = 612) | 23 | 328 | 25 | 195 | 22 | 133 | 0.204 |
Table 4.
Comparison of measures of glycemic parameters, demographic, anthropometric and lifestyle characteristics between dysglycemic and normoglycemic individuals
| Normoglycemia (n = 1,075) | Dysglycemia (n = 328) | P‐value | |
|---|---|---|---|
| Fasting plasma glucose, mmol/L (mean ± SD) | 4.1 ± 0.9 | 5.3 ± 2.1 | <0.001 |
| 1‐h plasma glucose, mmol/L (mean ± SD) | 5.8 ± 1.6 | 9.2 ± 3.4 | <0.001 |
| HbA1c, % (mean ± SD) | 4.98 ± 0.9 | 5.8 ± 1.1 | <0.001 |
| Age, years (mean ± SD) | 30.2 ± 9.9 | 39.8 ± 13 | <0.001 |
| Sex | |||
| Male, n = 791 (n) | 596 (55.4%) | 195 (59.5%) | 0.204 |
| Female, n = 612 (n) | 479 (44.6%) | 133 (40.5%) | |
| BMI kg/m2 (n) | |||
| <25 | 435 (40.5%) | 60 (18.3%) | <0.001 |
| 25–<30 | 380 (35.3%) | 113 (34.5%) | |
| ≥30 | 260 (24.2%) | 155 (47.3%) | |
| Waist circumference, cm (n)* | |||
| Normal (men <94 cm, women <80 cm ) | 468 (44.4%) | 55 (17.1%) | <0.001 |
| Abdominal obesity level 1 (men >94–102 cm, women >80–88 cm) | 244 (23.1%) | 86 (26.7%) | |
| Abdominal obesity level 2 (men >102 cm, women >88 cm) | 342 (32.4%) | 181 (56.2%) | |
| Ethnic origin (n) | |||
| Arabian tribes | 830 (77.2%) | 240 (73.2%) | 0.031 |
| African tribes | 52 (4.8%) | 20 (6.1%) | |
| Mediterranean countries | 48 (4.5%) | 19 (5.8%) | |
| Indian continent | 62 (5.8%) | 33 (10.1%) | |
| Central Asia | 19 (1.8%) | 1 (0.3%) | |
| South East Asia | 30 (2.8%) | 8 (2.4%) | |
| Mixed | 34 (3.2) | 7 (2.1%) | |
| Smoking status (n) | |||
| Non‐smokers | 734 (68.3%) | 222 (67.7%) | 0.100 |
| Current smokers | 227 (21.1%) | 76 (23.2%) | |
| Passive smokers | 83 (7.7%) | 15 (4.6) | |
| Previous smokers | 31 (2.9%) | 15 (4.6%) | |
| Physical activity, 30 min/day–5 days/week (n) | |||
| No | 584 (54.3%) | 206 (62.8%) | 0.004 |
| Yes | 491 (45.7%) | 122 (37.2%) | |
| Sleep duration, h (n) | |||
| <5 | 77 (7.2%) | 39 (11.9%) | 0.057 |
| 5–6 | 331 (30.8%) | 106 (32.3%) | |
| >6–7 | 333 (31%) | 94 (28.7%) | |
| >7–8 | 234 (21.8%) | 59 (18%) | |
| >8 | 100 (9.3%) | 30 (9.1%) | |
| Sitting hours/day (n) | |||
| <4 | 192 (17.8%) | 71 (21.6%) | 0.412 |
| 4–5 | 326 (30.3%) | 100 (30.5%) | |
| 6–8 | 344 (32.0%) | 94 (28.7%) | |
| >8 | 213 (19.8%) | 63 (19.2%) | |
| Daily fruit or vegetable intake (at least one portion) (n) | |||
| No | 392 (36.5%) | 119 (36.3%) | 0.951 |
| Yes | 683 (63.5%) | 209 (63.7%) | |
The significant values are highlighted in bold. *n, total number of subjects in all subgroups; n, number of subjects in subgroup; n = 1,376.
Table 5 shows the results from univariate analysis of the predictive ability of the eight variables included in the FINDRISC, with sex and hours of sleep also included. Age, BMI, WC, use of antihypertensive medication, history of hyperglycemia, family history of diabetes, low physical activity and short sleep were all statistically significant, whereas diet (regular consumption of fruit and vegetables) was not.
Table 5.
Unadjusted and adjusted odds ratios (95% confidence intervals) for predictors of dysglycemia in the Saudi glycemia screening participants
| Unadjusted | Adjusted | |||
|---|---|---|---|---|
| OR | 95% CI | OR | 95% CI | |
| Sex | ||||
| Men | Ref | Ref | ||
| Women | 0.85 | 0.66–1.09 | 0.51 | 0.37–0.70 |
| Age group | ||||
| <35 years | Ref | Ref | ||
| 35–44 years | 3.45 | 2.52–4.73 | 2.92 | 2.07–4.11 |
| 45–54 years | 4.99 | 3.39–7.35 | 4.04 | 2.60–6.27 |
| 55–64 years | 7.13 | 4.15–12.23 | 5.22 | 2.86–9.53 |
| >64 years | 15.59 | 5.94–40.91 | 8.58 | 3.02–24.38 |
| Body mass index | ||||
| <25 kg/m2 | Ref | Ref | ||
| 25–30 kg/m2 | 2.16 | 1.53–3.04 | 1.21 | 0.79–1.84 |
| >30 kg/m2 | 4.31 | 3.08–6.03 | 1.81 | 1.08–3.05 |
| Waist cirumference FINDRISC | ||||
| <94 cm (men)/<80 cm (women) | Ref | Ref | ||
| 94–102 cm (men)/80–88 cm (women) | 2.99 | 2.07–4.35 | 2.29 | 1.48–3.53 |
| >102 cm (men)/>88 cm (women) | 4.50 | 3.23–6.28 | 1.80 | 1.07–3.03 |
| 30 min daily physical activity | ||||
| Yes | Ref | Ref | ||
| No | 1.42 | 1.10–1.83 | 1.27 | 0.95–1.69 |
| Daily fruit or vegetable intake | ||||
| No | Ref | Ref | ||
| Yes | 1.01 | 0.78–1.303 | 0.98 | 0.73–1.32 |
| Hours of sleep daily | ||||
| <6 h | 1.32 | 1.02–1.71 | 1.20 | 0.89–1.60 |
| 6–8 h | Ref | Ref | ||
| >8 h | 1.11 | 0.71–1.74 | 1.49 | 0.88–2.51 |
| Use of blood pressure lowering medication | ||||
| No | Ref | Ref | ||
| Yes | 5.02 | 2.96–8.52 | 1.62 | 0.87–3.00 |
| Past history of hyperglycemia (in a medical checkup, during an illness or pregnancy) | ||||
| No | Ref | Ref | ||
| Yes | 2.28 | 1.52–3.44 | 1.56 | 0.96–2.53 |
| Family history of diabetes mellitus | ||||
| No | Ref | Ref | ||
| Yes: grandparent, uncle, aunt or cousin | 0.53 | 0.31–0.91 | 1.01 | 0.56–1.82 |
| Yes: Biological father, mother or sibling | 1.75 | 1.33–2.29 | 1.80 | 1.33–2.45 |
CI, confidence interval; FINDRISC, Finnish Diabetes Risk Score; Ref, reference.
The final model for the SADRISC comprised five variables: sex, age, WC, history of hyperglycemia and family history of diabetes (Table 6). Because of multicollinearity with WC, BMI was not included in the model. We carried out sensitivity analysis using BMI instead of WC, and the results were almost similar (data not shown). Score values range from 0 to 15. The SADRISC model fit based on the assessment using the receiver operating characteristic curve was reasonably good, with the area under the curve of 0.76 (95% confidence interval 0.73–0.79), being better than that for the FINDRISC (Figure 2).
Table 6.
Final model for the beta‐coefficients and adjusted odds ratios (95% confidence intervals) of the predictors of dysglycemia included in the Saudi Arabian Diabetes Risk Score with the score weights
| Beta coefficient | Adjusted | Score | ||
|---|---|---|---|---|
| OR | 95% CI | |||
| Sex | ||||
| Women | Ref | 0 | ||
| Men | 0.71 | 2.03 | 1.50–2.74 | 2 |
| Age group | ||||
| <35 years | Ref | 0 | ||
| 35–44 years | 1.06 | 2.87 | 2.05–4.03 | 3 |
| 45–54 years | 1.40 | 4.05 | 2.64–6.21 | 4 |
| 55–64 years | 1.77 | 5.84 | 3.29–10.38 | 5 |
| >64 years | 2.37 | 10.74 | 3.95–29.21 | 6 |
| Waist circumference FINDRISC | ||||
| <94 cm (men)/<80 cm (women) | Ref | 0 | ||
| 94–102 cm (men)/80–88 cm (women) | 0.94 | 2.57 | 1.74–3.80 | 3 |
| >102 cm (men)/>88 cm (women) | 1.05 | 2.85 | 1.97–4.12 | 3 |
| Past history of hyperglycemia (in a medical checkup, during an illness or pregnancy) | ||||
| No | Ref | 0 | ||
| Yes | 0.48 | 1.62 | 1.01–2.60 | 2 |
| Family history of diabetes mellitus | ||||
| No | Ref | 0 | ||
| Yes: grandparent, uncle, aunt or cousin | 0.01 | 1.01 | 0.56–1.80 | 0 |
| Yes: Biological father, mother or sibling | 0.59 | 1.81 | 1.34–2.44 | 2 |
| Total maximum points | 15 | |||
CI, confidence interval; FINDRISC, Finnish Diabetes Risk Score; Ref, reference.
Figure 2.
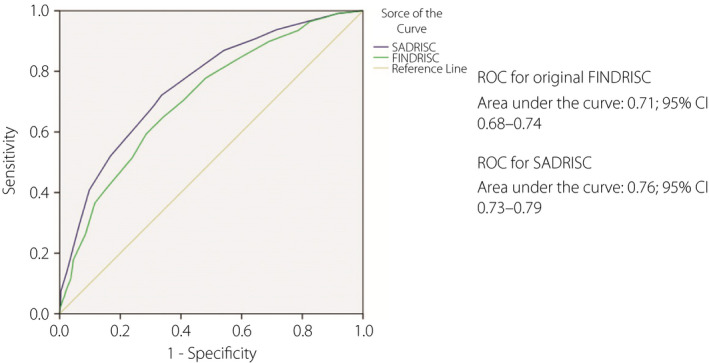
Receiver operating characteristic (ROC) curves for the prevalence of dysglycemia for the Saudi Arabian Diabetes Risk Score (SADRISC) and the original Finnish Diabetes Risk Score (FINDRISC) in the Saudi glycemia screening participants.
Using different cut‐points, the variation in sensitivity and specificity is shown in Table 7. It seems that the most practical cut‐point to be used is 5 or 6, with sensitivity and specificity being approximately 0.7, and they would label 43% and 39% of the population to be at high risk, respectively. With 5 points, everyone aged ≥55 years and with 6 points everyone aged ≥65 years were considered to be at high risk of dysglycaemia (Table 3).
Table 7.
Characteristics of the Saudi Arabian Diabetes Risk Score using different cut‐off values for abnormal glucose tolerance
| SADRISC (0–15 points) | Sensitivity | Specificity | Positive predictive value | Negative predictive value | Percentage of study sample |
|---|---|---|---|---|---|
| Cut‐off value> 4 points | 0.87 | 0.45 | 0.33 | 0.92 | 62 |
| Cut‐off value> 5 points | 0.72 | 0.66 | 0.39 | 0.89 | 43 |
| Cut‐off value> 6 points | 0.69 | 0.69 | 0.40 | 0.88 | 39 |
| Cut‐off value> 7 points | 0.53 | 0.83 | 0.49 | 0.85 | 25 |
SADRISC, Saudi Arabian Diabetes Risk Score.
Discussion
In order to help combat the rise in type 2 diabetes prevalence in Saudi Arabia, we aimed to develop a non‐invasive tool that is best suited to identify Saudi individuals with a high risk of undiagnosed type 2 diabetes or prediabetes. The present results showed that the FINDRISC was operating reasonably well in our population. However, the predictive validity of the developed SADRISC model was confirmed to be better with the area under the curve of 0.76 compared with 0.71 for the FINDRISC.
Three previous attempts to develop type 2 diabetes risk scores that included participants from Saudi Arabia have been carried out28, 29, 30. However, each of them had serious limitations preventing their use in practice. The first of these28 included people from United Arab Emirates and Algeria in addition to Saudis, and was part of a screening program for the detection of diabetes in the three countries. Screening and recruitment of participants was carried out in central locations in cities. Thus, there was a strong selection bias, which would include a high percentage of people suspecting that they might have type 2 diabetes. Furthermore, assessment was based on a self‐administered questionnaire, with a high percentage of participants having ≤9 years of schooling, introducing difficulties in completing the questionnaire accurately. Furthermore, the diagnosis of diabetes and impaired glycemia was based on the measurement of HbA1c alone, which is known to be insensitive for detecting type 2 diabetes40, and not an appropriate method for the studied population with a well‐documented high prevalence of hemoglobinopathies. Additional limitations were lack of standardization of equipment used for measurements, and variability as a result of inadequate standardization of measurement techniques.
The second study29 included only a small sample of Saudis from Riyadh (81 men and 20 women). In addition, only fasting blood glucose was used to diagnose dysglycemia, which would exclude those with impaired glucose tolerance requiring an OGTT to be detected, and which constituted the majority of people with dysglycemia among people free of known diabetes, as also shown in the present study. Furthermore, no explanation was given in the study of how anthropometric measurements were carried out. The third and most recent30 included participants from different regions of Saudi Arabia. The main limitation was a lack of standardization of data collection, survey measurement techniques and laboratory measurements. Indeed, no information was given on how glucose was measured, implying that it had been carried out at multiple laboratories, which is likely to introduce errors as a result of pre‐analytic and laboratory variability. In addition, almost half of the participants were excluded from final statistical analyses for various reasons. The AUC for screen‐detected type 2 diabetes and dysglycemia were only a modest 0.69 and 0.67, respectively. Therefore, keeping in mind the limitations of these previous studies, we aimed to carry out the present study in a standardized manner.
By choosing the city of Jeddah, we hoped to ensure that most socioeconomic sectors and ethnicities living in Saudi Arabia were covered, due to its inhabitants forming a good representative sample of the different ethnicities formulating the actual Saudi population26. In addition, the present sample was collected from PHCCs randomly selected from the five geographical sectors in Jeddah, to further ensure a good representation of the overall population having Saudi nationality. The present results reflect the multiethnic nature of Saudis, with the majority descending from Arabian tribes. Ethnic distribution in the present study was not significantly different to that in our previous survey carried out in the same city26, with persons descending from Arabian tribes constituting 78% of the total compared with 80% in present study.
Unlike several other similar diabetes risk score validation studies, we applied the most comprehensive definition for dysglycemia outcome, where a combination of HbA1c and OGTT with both FPG and post‐challenge glucose were all included. Recently, several people have started to advocate the use of 1‐hPG for the identification of prediabetes and dysglycemia32, 40. In a published petition, 1‐hPG of 8.6 mmol/L be was proposed as a cut‐point for diagnosing impaired glucose tolerance, based on a number of large population‐based studies41. One advantage of 1‐h OGTT compared with 2‐h OGTT is that it requires less time, whereas both can identify abnormalities in glucose excursions after a glucose load. Both measures had similar abilities to predict type 2 diabetes in Native Americans, and the authors concluded that 1‐hPG is an alternative method of identifying individuals with an elevated risk of type 2 diabetes 42. In a comparative study of different amounts of glucose loads in individuals without diabetes, a 50‐g and 75‐g load produced similar 1‐hPG levels43. Therefore, we decided to use a 50‐g glucose load, and 8.6 mmol/L as the cut‐point to define dysglycemia in the present study; 1‐hPG identified 60% of all participants with dysglycemia. This is the first time that the 1‐hPG value has been used instead of the 2‐hPG value to develop a diabetes risk score.
In keeping with several other studies44, 45, 46, we showed that without using an OGTT, a large proportion of people with dysglycemia would remain undetected.
To ensure reliability and standardization of data collection, medical students, well trained for the survey methodology, performed data collection and carried out measurements by standardized instruments, recording all medications and supplements, resulting in a high‐quality data collection. Furthermore, collected blood samples were sent regularly to an internationally accredited central laboratory for analysis to avoid interlaboratory variability.
The plan was to recruit 300 individuals in each 10‐year age stratum, but finding sufficient numbers of individuals without diabetes aged ≥35 years was a challenge. We extended the recruitment period for another 3 months, with only little further success. This prompted us to use the age group <35 years as the reference group for risk assessment, when in the FINDRISC it is 45 years. Indeed, a similar approach was adopted in two of the previous studies28, 30.
An AUC of 1.0 would indicate perfect discrimination; that is, 100% accuracy. An average AUC of 0.77 was found among approximately 100 studies of models predicting all‐cause mortality47. In general, an AUC value of 0.70 indicated a good model, and 0.80 a very good model48. Thus, the 0.76 AUC of the SADRISC shows that it can effectively distinguish people at low dysglycemia risk from those with high risk. As SADRISC only includes five variables that are easy to define even by lay people, it offers a useful tool for the first step in screening for dysglycemia risk in Saudi Arabia.
For use of a prediction score, such as the SADRISC, it is necessary to consider a cut‐off value to be used for further action; that is, glycemia testing and preventive management. People at high risk should be informed, so that they can take appropriate actions. Laboratory testing for glycemia requires visits to a healthcare facility. Therefore, the selection of a cut‐off point is a trade‐off between the level of risk of the disease and available resources for the needs of people at high risk. A lower cut‐off score value would increase sensitivity (identify more people who potentially might develop the disease), but would also increase the number of false positives (people who might not develop the disease in the near future or ever) being referred for follow‐up diagnostic testing. It seems that the most practical cut‐point to be used for the SADRISC is 5 or 6 points, which would label 43% and 39% of the population as high risk, respectively, with the sensitivity and specificity being approximately 0.70. With 5 points as the cut‐point, everyone aged ≥55 years, and with 6 points, everyone aged ≥65 years were considered to be at high risk. This makes sense, as more than half of people aged ≥55 years had dysglycemia. Although a risk score might not be required for Saudi people aged ≥55 years to determine if they require glycemia testing, a risk score is important to identify their level of risk. This should then determine their priority for interventions giving priority to those people with the highest risk score.
The comparison of the discrimination ability between the FINDRISC and SADRISC showed that it is important to validate the risk score in the population where it is going to be applied. Although the FINDRISC performed relatively well also in the Saudi population, it was inferior to the SADRISC, which was based on local data. The reasons for this difference can only be speculated. They might include the effects of ethnicity/genetic factors, but also lifestyle factors. It is well‐known that obesity and sedentary lifestyle in Saudi Arabia are more common than those in Finland. These factors also are likely reasons for the higher prevalence of dysglycemia at a younger age compared with Finland. In the present sample, Saudi people aged 35–44 years had a threefold increased risk of dysglycemia compared with those aged <35 years.
Even though care was taken to avoid the pitfalls noted in earlier studies, a few limitations to the present study appeared during implementation due to reasons beyond our control. First, the targeted number of older age groups could not be reached, and just 21 people aged >64 years, and 60 people aged 55–64 years were included. The selection criteria used led to the exclusion of most of the likely candidates, as they were already diagnosed with diabetes or one of the other conditions in the exclusion criteria. We extended the data collection period, but did not reach our original target sample size. Compared with some other studies, our sample size was not very large, and only large effects could be detected. Nevertheless, the performance of SADRISC assessed by AUC was good. Also, we did not have the opportunity to recruit a validation cohort to confirm the results from the model development sample. Such a validation will be carried out in the future in other parts of Saudi Arabia, and we also plan to apply the SADRISC model in other population cohorts existing in other Gulf countries. However, the results obtained are considered quite acceptable from a public health point of view. Unfortunately, as seen in other similar studies, detailed assessment of physical activity and diet was not possible, as they require much more detailed and elaborated data that cannot be collected in primary care when screening for dysglycemia risk is carried out. Therefore, these important risk factors for type 2 diabetes were not included in the final SADRISC model.
Data from 74 people were excluded due to incompleteness, with the main reasons being not attending the second visit for OGTT, hemolysis of blood samples or missing labels on sample tubes. Thus, exclusion was quite random, and not selectively occurring, hence it should not jeopardize the validity of the results.
The present study had many points of strength. First, the methods used for data collection were well standardized, and data collectors were all well trained. Second, the selection of PHCCs and participants were randomized to avoid bias, and the collected sample reflected the multiethnic nature of the city population, which was very similar to earlier published data26. Furthermore, a combination of HbA1c and OGTT was used to detect dysglycemia, which is the most comprehensive way of defining the condition, ensuring the detection of all possible cases. Furthermore, the accuracy of the laboratory results was assured by carrying out all measurements in one accredited laboratory.
In conclusion, we have managed to complete our intended task of developing a valid and easy to administer tool, which is the first step in screening for dysglycemia risk. The AUC of 0.76 of the SADRISC shows that it can effectively distinguish people at high dysglycemia risk. Efforts will be made to introduce it to health professionals and the public in Saudi Arabia through various methods, by coordinating with the Ministry of Health. Thus, we hope that the SADRISC will contribute to the implemention of a national type 2 diabetes prevention strategy aiming at reversing the increasing trend in the prevalence of type 2 diabetes in Saudi Arabia.
Disclosure
The authors declare no conflict of interest.
Acknowledgments
This work was supported by King Abdulaziz University, grant number (2‐140‐1434‐HiCi).
J Diabetes Investig 2020; 11: 844–855
References
- 1. Global report on diabetes . World Health Organization. 2016. Available from: http://www.who.int/iris/handle/10665/204871. Accessed April 28, 2019.
- 2. Harris MI, Klein R, Welborn TA, et al Onset of NIDDM occurs at least 4–7 yr before clinical diagnosis. Diabetes Care 1992; 15: 815–819. [DOI] [PubMed] [Google Scholar]
- 3. Brannick B, Dagogo‐Jack S. Prediabetes and cardiovascular disease: pathophysiology and interventions for prevention and risk reduction. Endocrinol Metab Clin 2018; 47: 33–50. [DOI] [PMC free article] [PubMed] [Google Scholar]
- 4. Stino AM, Smith AG. Peripheral neuropathy in prediabetes and the metabolic syndrome. J Diabetes investig 2017; 8: 646–655. [DOI] [PMC free article] [PubMed] [Google Scholar]
- 5. Hypertension in Diabetes Study (HDS): I . Prevalence of hypertension in newly presenting type 2 diabetic patients and the association with risk factors for cardiovascular and diabetic complications. J Hypertens 1993; 11: 309–317. [DOI] [PubMed] [Google Scholar]
- 6. Eriksson KF, Lindgärde F. Prevention of Type 2 (non‐insulin‐dependent) diabetes mellitus by diet and physical exercise The 6‐year Malmö feasibility study. Diabetologia 1991; 34: 891–898. [DOI] [PubMed] [Google Scholar]
- 7. Knowler WC, Barrett‐Connor E, Fowler SE, et al Reduction in the incidence of type 2 diabetes with lifestyle intervention or metformin. N Engl J Med 2002; 346: 393–403. [DOI] [PMC free article] [PubMed] [Google Scholar]
- 8. Pan X‐R, Li G‐W, Hu Y‐H, et al Effects of diet and exercise in preventing NIDDM in people with impaired glucose tolerance: the Da Qing IGT and diabetes study. Diabetes Care 1997; 20: 537–544. [DOI] [PubMed] [Google Scholar]
- 9. Ramachandran A, Snehalatha C, Mary S, et al The Indian Diabetes Prevention Programme shows that lifestyle modification and metformin prevent type 2 diabetes in Asian Indian subjects with impaired glucose tolerance (IDPP‐1). Diabetologia 2006; 49: 289–297. [DOI] [PubMed] [Google Scholar]
- 10. Saaristo T, Moilanen L, Korpi‐Hyövälti E, et al Lifestyle intervention for prevention of type 2 diabetes in primary health care. One‐year follow‐up of the finnish national diabetes prevention program (FIN‐D2D). Diabetes Care 2010; 33: 2146–2151. [DOI] [PMC free article] [PubMed] [Google Scholar]
- 11. Saito T, Watanabe M, Nishida J, et al Lifestyle modification and prevention of type 2 diabetes in overweight Japanese with impaired fasting glucose levels: a randomized controlled trial. Arch Intern Med 2011; 171: 1352–1360. [DOI] [PubMed] [Google Scholar]
- 12. Tuomilehto J, Lindström J, Eriksson JG, et al Prevention of type 2 diabetes mellitus by changes in lifestyle among subjects with impaired glucose tolerance. N Engl J Med 2001; 344: 1343–1350. [DOI] [PubMed] [Google Scholar]
- 13. Abdul‐Ghani MA, Abdul‐Ghani T, Ali N, et al One‐hour plasma glucose concentration and the metabolic syndrome identify subjects at high risk for future type 2 diabetes. Diabetes Care 2008; 31: 1650–1655. [DOI] [PMC free article] [PubMed] [Google Scholar]
- 14. Kolberg JA, Jørgensen T, Gerwien RW, et al Development of a type 2 diabetes risk model from a panel of serum biomarkers from the Inter99 Cohort. Diabetes Care 2009; 32: 1207–1212. [DOI] [PMC free article] [PubMed] [Google Scholar]
- 15. Salomaa V, Havulinna A, Saarela O, et al Thirty‐one novel biomarkers as predictors for clinically incident diabetes. PLoS ONE 2010; 5: e10100. [DOI] [PMC free article] [PubMed] [Google Scholar]
- 16. Lindstrom J, Tuomilehto J. The diabetes risk score: a practical tool to predict type 2 diabetes risk. Diabetes Care 2003; 26: 725–731. [DOI] [PubMed] [Google Scholar]
- 17. Saaristo T, Peltonen M, Keinänen‐Kiukaanniemi S, et al National type 2 diabetes prevention programme in Finland: FIN‐D2D. Int J Circumpolar Health 2007; 66: 101–112. [DOI] [PubMed] [Google Scholar]
- 18. Franciosi M, De Berardis G, Rossi MCE, et al Use of the diabetes risk score for opportunistic screening of undiagnosed diabetes and impaired glucose tolerance: the IGLOO (Impaired Glucose Tolerance and Long‐Term Outcomes Observational) study. Diabetes Care 2005; 28: 1187–1194. [DOI] [PubMed] [Google Scholar]
- 19. Kaczorowski J, Robinson C, Nerenberg K. Development of the CANRISK questionnaire to screen for prediabetes and undiagnosed type 2 diabetes. Can J Diabetes 2009; 33: 381–385. [Google Scholar]
- 20. Makrilakis K, Liatis S, Grammatikou S, et al Validation of the Finnish diabetes risk score (FINDRISC) questionnaire for screening for undiagnosed type 2 diabetes, dysglycaemia and the metabolic syndrome in Greece. Diabetes & Metabolism. 2011; 37: 144–151. [DOI] [PubMed] [Google Scholar]
- 21. Al‐Lawati JA, Tuomilehto J. Diabetes risk score in Oman: A tool to identify prevalent type 2 diabetes among Arabs of the Middle East. Diabetes Res Clin Pract 2007; 77: 438–444. [DOI] [PubMed] [Google Scholar]
- 22. Federation ID. IDF Diabetes Atlas, 8th edn. International Diabetes Federation, Brussels, Belgium, 2017. [Google Scholar]
- 23. Al‐Nozha MM, Al‐Maatouq MA, Al‐Mazrou YY, et al Diabetes mellitus in Saudi Arabia. Saudi Med J 2004; 25: 1603–1610. [PubMed] [Google Scholar]
- 24. Elhadd TA, Al‐Amoudi AA, Alzahrani AS. Epidemiology, clinical and complications profile of diabetes in Saudi Arabia: a review. Ann Saudi Med 2007; 27: 241–250. [DOI] [PMC free article] [PubMed] [Google Scholar]
- 25. WHO STEPwise Approach to NCD Surveillance. Country‐Specific Standard Report. Saudi Arabia 2005. NCD Risk Factors Standard Report, Saudi Arabia 2004. 2005.
- 26. Bahijri SM, Jambi HA, Al Raddadi RM, et al The prevalence of diabetes and prediabetes in the adult population of Jeddah, Saudi Arabia–A Community‐Based Survey. PLoS ONE 2016; 11: e0152559. [DOI] [PMC free article] [PubMed] [Google Scholar]
- 27. Ali A, Iqbal F, Taj A, et al Prevalence of microvascular complications in newly diagnosed patients with type 2 diabetes. Pak J Med Sci 2013; 29: 899. [DOI] [PMC free article] [PubMed] [Google Scholar]
- 28. Handlos LN, Witte DR, Almdal TP, et al Risk scores for diabetes and impaired glycaemia in the Middle East and North Africa. Diabetic Med 2013; 30: 443–451. [DOI] [PubMed] [Google Scholar]
- 29. Alghwiri A, Alghadir A, Awad H. The Arab Risk (ARABRISK): Translation and Validation. Biomed Res 2014; 25: 271–275. [Google Scholar]
- 30. Memish ZA, Chang JL, Saeedi MY, et al Screening for type 2 diabetes and dysglycemia in Saudi Arabia: development and validation of risk scores. Diabetes Technol Therapeut 2015; 17: 693–700. [DOI] [PubMed] [Google Scholar]
- 31. Sedgwick P. Stratified cluster sampling. BMJ 2013; 347: f7016. [Google Scholar]
- 32. Phillips L, Ziemer D, Kolm P, et al Glucose challenge test screening for prediabetes and undiagnosed diabetes. Diabetologia 2009; 52: 1798–1807. [DOI] [PubMed] [Google Scholar]
- 33. Pareek M, Bhatt DL, Nielsen ML, et al Enhanced predictive capability of a 1‐hour oral glucose tolerance test: a prospective population‐based cohort study. Diabetes Care 2018; 41: 171–177. [DOI] [PubMed] [Google Scholar]
- 34. Zhu S, Wang Z, Heshka S, et al Waist circumference and obesity‐associated risk factors among whites in the third National Health and Nutrition Examination Survey: clinical action thresholds. Am J Clin Nutr 2002; 76: 743. [DOI] [PubMed] [Google Scholar]
- 35. Karter A, D'Agostino R Jr, Mayer‐Davis E, et al Abdominal obesity predicts declining insulin sensitivity in non‐obese normoglycaemics: the Insulin Resistance Atherosclerosis Study (IRAS). Diabetes Obes Metab 2005; 7: 230–238. [DOI] [PubMed] [Google Scholar]
- 36. Chobanian AV, Bakris GL, Black HR, et al Seventh report of the joint national committee on prevention, detection, evaluation, and treatment of high blood pressure. Hypertension 2003; 42: 1206–1252. [DOI] [PubMed] [Google Scholar]
- 37. Definition and diagnosis of diabetes mellitus and intermediate hyperglycaemia: report of a WHO/IDF consultation. 2006.
- 38. Association AD. Diagnosis and classification of diabetes mellitus. Diabetes Care 2014; 37(Suppl 1): S81–S90. [DOI] [PubMed] [Google Scholar]
- 39. Bansal N. Prediabetes diagnosis and treatment: A review. World J Diabetes 2015; 6: 296–303. [DOI] [PMC free article] [PubMed] [Google Scholar]
- 40. Bonora E, Tuomilehto J. The pros and cons of diagnosing diabetes with A1C. Diabetes Care 2011; 34(Suppl 2): S184–S190. [DOI] [PMC free article] [PubMed] [Google Scholar]
- 41. Bergman M, Manco M, Sesti G, et al Petition to replace current OGTT criteria for diagnosing prediabetes with the 1‐hour post‐load plasma glucose≥ 155 mg/dl (8.6 mmol/L). Diabetes Res Clin Pract 2018; 146: 18–33. [DOI] [PubMed] [Google Scholar]
- 42. Paddock E, Hohenadel MG, Piaggi P, et al One‐hour and two‐hour postload plasma glucose concentrations are comparable predictors of type 2 diabetes mellitus in Southwestern Native Americans. Diabetologia 2017; 60: 1704–1711. [DOI] [PMC free article] [PubMed] [Google Scholar]
- 43. Castro A, Scott JP, Grettie DP, et al Plasma insulin and glucose responses of healthy subjects to varying glucose loads during three‐hour oral glucose tolerance tests. Diabetes 1970; 19: 842–851. [DOI] [PubMed] [Google Scholar]
- 44. Group DS . Age‐ and sex‐specific prevalences of diabetes and impaired glucose regulation in 13 European cohorts. Diabetes Care 2003; 26: 61–69. [DOI] [PubMed] [Google Scholar]
- 45. Group DS . Age‐ and sex‐specific prevalence of diabetes and impaired glucose regulation in 11 Asian cohorts. Diabetes Care 2003; 26: 1770–1780. [DOI] [PubMed] [Google Scholar]
- 46. Cowie CC, Rust KF, Byrd‐Holt DD, et al Prevalence of diabetes and high risk for diabetes using A1C criteria in the U.S. Population in 1988‐2006. Diabetes Care 2010; 33: 562–568. [DOI] [PMC free article] [PubMed] [Google Scholar]
- 47. Siontis GCM, Tzoulaki I, Ioannidis JPA. Predicting death: an empirical evaluation of predictive tools for mortality. JAMA Intern Med 2011; 171(19): 1721–1726. [DOI] [PubMed] [Google Scholar]
- 48. Hosmer D, Lemeshow S. Applied logistic Regression, 2nd edn. Wiley, New York, 2000. [Google Scholar]