

Abstract
Aims/Introduction
The aim of the present study was to analyze the strength of association between fasting plasma glucose (FPG), 2‐h postprandial glucose (2h PPG), hemoglobin A1c (HbA1c), disposition index (DI) and nine anthropometrics measures, to explore the best indicator for hyperglycemia.
Materials and Methods
Analyses were based on the cross‐sectional data of 3,572 adults from the Pinggu Metabolic Disease Study. Anthropometrics were measured, visceral fat area (VFA) and subcutaneous fat area were calculated using an abdominal computed tomography scan. Linear regression was used to analyze the association between FPG, 2h PPG, HbA1c, DI and nine anthropometrics measures (height, weight, waist circumference [WC], body mass index and waist‐to‐hip ratio [WHR], waist‐to‐height ratio, VFA, subcutaneous fat area, and visceral‐to‐subcutaneous ratio). Logistic regression was further carried out to understand the association between per standard increase and risk for hyperglycemia.
Results
Higher VFA and subcutaneous fat area were associated with higher FPG, 2h PPG, HbA1c and DI after adjusting for other covariates. The strongest association observed after adjustment was WC for FPG, with one standard deviation greater WC being associated with 1.70 increased odds; WHR for 2h PPG, with one standard deviation greater WHR being associated with 1.83 increased odds. The strength of the association between VFA and FPG, 2h PPG, HbA1c, and DI was less than WHR and WC, but slightly stronger than body mass index. Stratified analyses showed that VFA performs better as an anthropometrics indicator in predicting hyperglycemic risk in women than men.
Conclusions
WHR and WC remain the best indicators for hyperglycemic risk among ahealthy Chinese population.
Keywords: Body mass index, Diabetes, Visceral fat
We compared a larger list of anthropometrics and body composition measures in terms of the association with hyperglycemic risk. An important conclusion from the study is that visceral and subcutaneous abdominal fat area performs no better than waist circumference and waist‐to‐hip ratio as indicators of high risk factors for hyperglycemia among a healthy Chinese population.
Introduction
Abdominal obesity is an important risk factor for metabolic disorder, including diabetes1, 2. Higher abdominal obesity, most commonly shown as waist circumference (WC) or the waist‐to‐hip ratio (WHR), has been proved to be associated with the risk for developing type 2 diabetes3. Evidence also shows that WC and WHR are better discriminative indicators for diabetes than body mass index BMI in Iranian4 and Ghanaian populations5. Additionally, in cohort studies, WC proved to be a better predictor for developing diabetes than BMI in China6 and the USA7.
Visceral fat is a more accurate and direct indicator for abdominal obesity. Usually measured using computed tomography (CT), visceral abdominal fat area (VFA) reflects the absolute amount of fat in peritoneal and retroperitoneal locations in two dimensions, which are considered more dangerous than subcutaneous fat as a result of visceral adipocytes releasing cytokines that contribute to inflammation and a series of reactions8. Empirical research has suggested that visceral fat is associated with an increased risk for cardiovascular disease9, selected cancer (such as colorectal cancer)10, 11, 12, chronic kidney disease13 and so on. There is also an established association between VFA and type 2 diabetes8, 14, 15; intra‐abdominal fat area is associated with a higher risk of diabetes independent of BMI, total body fat and subcutaneous fat, according to a study of Japanese American individuals15. Visceral and intramuscular fat are associated with metabolic abnormalities, including higher fasting insulin, among normal‐weight older Americans16.
However, little attention has been given to the comparison of absolute measures of visceral and subcutaneous fat and other anthropometrics measures, in terms of showing the risk for developing diabetes and prediabetes. Most research is limited to establishing the association between such absolute measures with diabetes, adjusting for the effect of BMI. Considering that central adiposity is understood as a better indicator for diabetes, understanding whether absolute measures of abdominal adiposity perform better than its proxy (e.g. WC) has important public health implications.
The present study aimed to analyze the strength of association between fasting plasma glucose (FPG), 2‐h postprandial glucose (2h PPG), hemoglobin A1c (HbA1c), glucose disposition index (DI), and nine anthropometrics and body composition measures (height, weight, WC, BMI, WHR, waist‐to‐height ratio [WHtR], VFA, subcutaneous abdominal fat area [SFA] and visceral‐to‐subcutaneous fat ratio) to explore the best indicator for hyperglycemic risk.
Methods
Study design and population
The present study is based on a stratified two‐stage cluster random sampling survey, the Pinggu Metabolic Disease Study, that recruited participants aged 25–74 years from 25 villages out of five towns and seven residents’ committees out of one street in Pinggu district located in Beijing, China, from March 2012 to May 2013. Details including study enrollment and procedure about the Pinggu Metabolic Disease Study can be found elsewhere17. A total of 5,004 individuals were invited to participate in the study, and 3,350 initially participated. In the second round of the survey, all 5,004 participants were re‐invited to participate and, additionally, 1,579 residents were invited between September 2013 to July 2014 to be included. A total of 4,002 individuals aged 26–76 years were enrolled in the second‐round survey, which is the study population of this analysis.
In the current analysis, we excluded participants with self‐reported diabetes (n = 405), and participants with missing values for anthropometrics and body composition measures, and key demographic measures (n = 28). Eventually, a total of 3,572 participants were included for analyses. Ethical approval was obtained from Peking University Health Science Center and University of Michigan. All participants provided written informed consent before enrollment.
Measures and variables
A standardized paper questionnaire was administered to all participants by trained staff. The questionnaire included basic sociodemographic information, health condition and disease history, family history, and behavioral patterns, including dietary intake, smoking, alcohol, physical activity, and so on. Standard measurement for physical anthropometrics measures was also carried out for all participants.
All participants also underwent an unenhanced abdominal CT scan using a 64‐slice multidetector scanner (LightSpeed VCT, General Electric Healthcare, Milwaukee, WI, USA). The CT scan acquired continuous 5‐mm thick slices (120 kVp, 120–150 mA) from the lung base to the pubic symphysis in the supine position. Single‐slice CT images were acquired at the level of the L4–L5 intervertebral disc space, and at the midpoint between the inguinal crease and the patella for subsequent analysis.
Additionally, laboratory assessment was carried out. After ≥150 g of carbohydrate intake daily for at least 3 days, blood samples were drawn in the morning after a 10–12 h fast from participants without a history of diabetes. Those without known diabetes underwent a 75‐g 2‐h oral glucose tolerance test. FPG and 2h PPG were measured using an automated clinical chemistry analyzer (UnicelDxC 800; Beckman Coulter, Miami, FL, USA). HbA1c was measured by cation‐exchange high pressure liquid chromatography method (Adams A1c HA‐8160; Arkray, Kyoto, Japan), which aligned with the Diabetes Control and Complications Trial standards.
The independent variables in the present study were nine anthropometrics and body composition measures: (i) height and (ii) weight were measured with participants standing without shoes and light clothing; (iii) WC was measured at the middle‐point level between the lower rib margin and iliac crest; (iv) BMI was calculated as weight divided by height squared (kg/m2); (v) WHR was calculated as the ratio of WC‐to‐hip circumference, the latter of which was measured at the maximum circumference around the buttocks; (vi) WHtR was calculated as the ratio of WC‐to‐height; (vii) VFA and (viii) SFA were derived through analyzing the CT images using ImageJ version 1.34e software packages (NIH, Bethesda, MD, USA). The cross‐sectional areas (mm2) of adipose tissue were calculated using standard Hounsfield unit ranges (adipose tissue −190 to −30) and then converted to centimeters squared, as recommended by previous research18. We calculated the total abdominal fat area through delineating the surface and calculated the VFA through drawing a line within the muscle wall surrounding the abdominal cavity. SFA was calculated as the difference between total fat area and VFA, as suggested by a previous study19; (ix) visceral‐to‐subcutaneous fat ratio was calculated as VFA‐to‐SFA.
Each independent variable was also classified into several categories for analyses: height into seven groups (threshold 160, 164, 168, 172, 176 and 180 cm for men; 148, 152, 156, 160, 164 and 168 cm for women); weight into eight groups (threshold 55, 60, 65, 70, 75, 80 and 85 kg for men; 50, 55, 60, 65, 70, 75 and 80 kg for women); WC into eight groups (threshold 75, 80, 85, 90, 95, 100 and 105 cm for men; 70, 75, 80, 85, 90, 95 and 10 cm for women); BMI into seven groups (threshold 20, 22, 24, 26, 28 and 30 kg/m2); WHR into seven groups (threshold 0.82, 0.85, 0.88, 0.91, 0.94 and 0.97 for men; 0.79, 0.82, 0.85, 0.88, 0.91 and 0.94 for women); WHtR into seven groups (threshold 0.45, 0.48, 0.51, 054, 0.57 and 0.60); VFA into eight groups (threshold 60, 80, 100, 120, 140, 160 and 180 cm2); SFA into eight groups (threshold 100, 160, 220, 280, 340, 400 and 460 cm2); and visceral to subcutaneous ratio (VSR) into eight groups (threshold 0.30, 0.35, 0.40, 0.45, 0.50, 0.55 and 0.60).
The outcome variables of the present study were four glycemic indices, including FPG, 2h PPG, HbA1c and DI. FPG, 2h PPG and HbA1c were directly measured through the above‐mentioned blood test, and DI was estimated as the ratio of homeostatic model assessment for β‐cell function to homeostatic model assessment for insulin resistance; that is, 450 / [(FPG– 3.5) × FPG]20. We also defined the threshold for hyperglycemic risks as FPG ≥5.6 mmol/L, 2h PPG ≥7.8 mmol/L, HbA1c ≥5.7%21 and DI below sex‐specific 25 percentiles.
In the present study, the covariates used for analyses included sex, age, household income in the past year in yuan (<5,000, 5,000–9,999, 10,000–24,999, 25,000–49,999, 50,000–74,999, 75,000–99,999, >100,000 and other), smoking status (dichotomies: current regular and current occasional; never and former), alcohol consumption (dichotomies: current regular and current occasional; never and former), family diabetes history (dichotomies: yes; no) and total physical activity level (high, moderate, low, calculated based on metabolic equivalent minutes per week, threshold 600 and 3,000).
Statistical analysis
Descriptive statistics were used to analyze the sociodemographic, anthropometrics and body composition measures, separately for men and women. The mean and standard deviation (SD) were presented for continuous variables, and absolute number and percentage were presented for categorical variables.
Linear regression was carried out to analyze the association between anthropometrics and body composition measures with four glycemic indices (FPG, 2h PPG, HbA1c and DI). Adjusted means for these four indices were presented stratified by sex and anthropometrics subgroups, after adjusting for age, household income level, smoking status, alcohol consumption, diabetes family history and physical activity.
To analyze the association of per standard increase with higher prediabetes or diabetes risk, each anthropometrics and body composition measure was divided by its SD and entered the regression as a continuous variable. Individuals with prediabetes and diabetes risk were defined as FPG ≥5.6 mmol/L, 2h PPG ≥7.8 mmol/L, HbA1c ≥5.7 % and DI below the 25th percentile (of the sex‐specific range). The odds ratio (OR) of hyperglycemia was regressed on levels of each anthropometric and body composition measure as a continuous variable, and adjusting for other sociodemographic and behavioral covariates. All analyses were completed using Stata version 13 (StataCorp, College Station, TX, USA) and SAS version 9.4 (SAS Institute, Cary, NC, USA).
Results
Basic sociodemographic, anthropometric and body composition characteristics stratified by sex are shown in Table 1. A total of 3,572 participants were included in analysis, and 1,733 (48.5%) were men. The mean age for men and women were 53.90 ± 12.07 and 54.10 ± 11.55 years, respectively. Most women were non‐smokers (99.0%) and non‐drinkers (88.7%), whereas more than half of the men were regular smokers (60.6%) and former drinkers (77.6%). Men and women showed a similar pattern of physical activity (3428.56 ± 2900.31 MET h/month for men, and 3798.96 ± 2529.84 MET h/month for women). More women had a family member with diabetes (21.32%) than men (16.91%). In comparison with women, men were taller (168.73 cm vs 156.78 cm), had higher weight (74.16 kg vs 63.83 kg), slightly higher BMI (26.00 kg/m2 vs 25.97 kg/m2), higher WC (88.84 cm vs 83.69 cm), higher WHR (0.90 vs 0.85) and similar WHtR (0.53 vs 0.53). Men had a higher VFA (133.75 cm2 vs 112.27 cm2), but lower SFA (290.78 cm2 vs 321.58 cm2). As for glycemic indices, men had a higher FPG (5.86 mmol/L vs 5.58 mmol/L), slightly lower 2h PPG (7.32 mmol/L vs 7.43 mmol/L), similar HbA1c (5.62 % vs 5.63 %) and lower DI (37.76 vs 44.74).
Table 1.
Basic sociodemographic, anthropometric, body composition and glycemic characteristics of 3,572 participants by sex
| Men (n = 1,733) | Women (n = 1,839) | |
|---|---|---|
| Age, years (N, %) | ||
| 30–40 | 279, 16.1% | 246, 13.4% |
| 40–50 | 411, 23.7% | 464, 25.2% |
| 50–60 | 500, 28.9% | 572, 31.1% |
| >60 | 543, 31.3% | 557, 30.3% |
| Tobacco use (N, %) | ||
| Non‐smoker | 341, 19.7% | 1,821, 99.0% |
| Former occasional smoker | 48, 2.8% | 1, 0.1% |
| Former regular smoker | 209, 12.1% | 0 |
| Occasional smoker | 85, 4.9% | 6, 0.3% |
| Regular smoker | 1,050, 60.6% | 11, 0.6% |
| Alcohol use (N, %) | ||
| Non‐drinker | 285, 16.4% | 1,631, 88.7% |
| Former occasional drinker | 692, 39.9% | 27, 1.5% |
| Former regular drinker | 653, 37.7% | 177, 9.6% |
| Occasional drinker | 32, 1.8% | 1, 0.1% |
| Regular drinker | 71, 4.1% | 3, 0.2% |
| Family income per year (N, %) | ||
| <5000 yuan | 27, 1.6% | 40, 2.2% |
| 5,000–9,999 yuan | 54, 3.1% | 47, 2.6% |
| 10,000–25,000 yuan | 196, 11.3% | 302, 16.4% |
| 25,000–50,000 yuan | 529, 30.5% | 603, 32.8% |
| 50,000–75,000 yuan | 406, 23.4% | 423, 23.0% |
| 75,000–100,000 yuan | 247, 14.3% | 215, 11.7% |
| >100,000 yuan | 242, 14.0% | 159, 8.6% |
| Other | 32, 1.8% | 50, 2.7% |
| Physical activity, MET‐min/week (mean ± SD) | 3,428.56 ± 2900.31 | 3,798.96 ± 2529.84 |
| Family diabetes history (N, %) | ||
| Yes | 293, 16.91% | 392, 21.32% |
| Anthropometrics and body composition measures (mean ± SD) | ||
| Height (cm) | 168.73 ± 6.11 | 156.78 ± 5.51 |
| Weight (kg) | 74.16 ± 12.17 | 63.83 ± 10.06 |
| BMI (kg/m2) | 26.00 ± 3.74 | 25.97 ± 3.89 |
| Waist circumference (cm) | 88.84 ± 10.25 | 83.69 ± 10.56 |
| Waist‐to‐hip ratio | 0.90 ± 0.07 | 0.85 ± 0.07 |
| Waist‐to‐height ratio | 0.53 ± 0.06 | 0.53 ± 0.07 |
| Visceral abdominal fat area (cm2) | 133.75 ± 62.03 | 112.27 ± 49.56 |
| Subcutaneous abdominal fat area (cm2) | 290.78 ± 121.86 | 321.58 ± 108.09 |
| Visceral‐to‐subcutaneous fat ratio | 0.46 ± 0.09 | 0.35 ± 0.09 |
| Glycemic indices (mean ± SD) | ||
| Fasting plasma glucose (mmol/L) | 5.86 ± 0.88 | 5.58 ± 0.74 |
| 2‐h postprandial glucose (mmol/L) | 7.32 ± 2.69 | 7.43 ± 2.37 |
| Hemoglobin A1c (%) | 5.62 ± 0.62 | 5.63 ± 0.47 |
| Glucose disposition index | 37.76 ± 15.37 | 44.74 ± 18.50 |
BMI, body mass index; MET, metabolic equivalents; SD, standard deviation.
Figure 1 shows the sex‐specific means for FPG, 2h PPG, HbA1c and DI. The means of the aforementioned indices were further adjusted for age, household income, smoking status, alcohol consumption, family diabetes history and physical activity (as MET h/month). For WC, BMI, WHR, VFA and SFA, all five measures showed a positive linear trend for FPG, 2h PPG and HbA1c, and a negative linear trend for DI. On average, men had a significantly higher FPG and 2h PPG, slightly higher HbA1c level, and significantly lower DI level. The slope for WC and BMI appeared higher than VFA, as the change in the glycemic indices plateaued with an increase in VFA after 160 cm2. Tables S1–S4 in the supplementary material showed additional analysis stratified by sex and age group.
Figure 1.

Sex‐specific adjusted means (95% confidence interval) for (a) fasting plasma glucose (FPG), (b) 2‐h postprandial glucose (2h PPG), (c) hemoglobin A1c (HbA1c) and (d) disposition index (DI) by different anthropometrics and body composition measures. FPG and 2h PPG are values in mmol/L, HbA1c is value in percentage. Means were adjusted for age, household income level, smoking status, alcohol consumption, diabetes family history and physical activity.
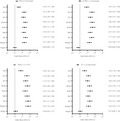
Figure 2 highlights the odds ratio of developing prediabetes or diabetes (FPG ≥5.6 mmol/L, 2h PPG ≥7.8 mmol/L, HbA1c ≥5.7 % and DI below the 25th percentile) associated with a one‐SD increase in each anthropometric and body composition measure, adjusting for other sociodemographic and behavioral covariates. WC appeared to be the strongest anthropometrics indicator for FPG ≥5.6 mmol/L, with a one‐SD increase in WC associated with an OR of 1.70 (95% confidence interval [CI] 1.57–1.84), whereas BMI, VFA and SFA were each associated with an OR of 1.59, 1.61 and 1.56, respectively. WHR was the strongest anthropometrics indicator for 2h PPG ≥7.8 mmol/L, with a one‐SD increase in WHR associated with an OR of 1.83 (95% CI 1.68–2.00), and WHtR (OR, 1.80, 95% CI 1.66–1.96) and VFA (OR 1.80, 95% CI 1.65–1.94) were the next strongest indicators, all slightly better than BMI (OR 1.67, 95% CI 1.55–1.81). For risk of HbA1c ≥5.7%, WC and weight were two better indicators, and VFA had a similar point estimate with BMI, each associated with an OR of 1.80 and 1.79. Finally, for lower DI (below the 25th percentile), WHR appeared to be a better indicator, with a one‐SD increase associated with an OR of 1.67 (95% CI 1.53–1.83). Across three abdominal fat measures, VFA was a slightly better indicator than SFA, and both outperformed VSR, among all four hyperglycemic indices. Additional analysis stratified by sex (Table S5) showed that VFA performs better in women as an anthropometrics indicator for FPG (OR 1.68 [95% CI 1.49–1.89] vs OR 1.46 [95% CI 1.31–1.63]), 2h PPG (OR 2.06 (95% CI 1.81–2.24) vs OR 1.58 [95% CI 1.41–1.77]), HbA1c (OR 1.92, [95% CI 1.69–2.18] vs OR 1.60 [95% CI 1.42–1.79]) and DI (OR 1.59 [95% CI 1.41–1.80) vs 1.43 [95% CI 1.27–1.61]). VFA performed slightly better than WHR in 2h PPG and WC in HbA1c in women, although not significantly better.
Figure 2.

Odds ratio and 95% confidence interval of hyperglycemic risk associated with per one standard deviation of each anthropometric and body composition measure. (a) fasting plasma glucose (FPG), 2‐h postprandial glucose (2h PPG), (c) hemoglobin A1c (HbA1c) and (d) disposition index (DI). Hyperglycemic risk was defined as FPG ≥5.6 mmol/L, 2h PPG ≥7.8 mmol/L, HbA1c ≥5.7% and DI below the sex‐specific 25th percentiles. Odds ratios were adjusted for age, sex, household income level, smoking status, alcohol consumption, diabetes family history and physical activity.
Discussion
The present study is the one of the few studies on visceral abdominal fat and diabetes in an Asian population, and the first among a natural Chinese population. Using cross‐sectional data of >3,500 of the Chinese population, we analyzed the strength of the association between nine anthropometrics and body composition measures with hyperglycemic risk. Although the increase in VFA and VSR was associated with higher levell of glucose indices, VFA performed no better than WC and WHR in terms of per standard increase associated with hyperglycemic risk, and VSR was significantly poorer than WC and WHR. Stratified analyses showed that VFA performs better as an anthropometrics indicator in predicting hyperglycemic risk in women than men.
The present results showed that different adipose measures, including WC, WHR, BMI and VFA, did not have significantly differentiated strength to predict the risk of prediabetes or diabetes, which was different to some previous studies of non‐Chinese populations. In previous studies of anthropometrics and diabetes, central adiposity was considered a major presentation and risk factor for type 2 diabetes22, 23. Measured through umbilicus CT or L4‐L5 abdominal CT, VFA proved to be better at predicting a metabolic disorder24, such as type 2 diabetes and prediabetes15, 16, 25, including in Asian populations26. For example, Jung et al. 8 used dual‐energy X‐ray absorptiometry to measure visceral fat mass, and predict diabetes and prediabetes by visceral fat mass and other anthropometric obesity indicators. They found that visceral fat mass can be an indicator of hyperglycemia and has the highest area under the curve of prediction 8. The reasons for these inconsistency are uncertain, but might include the diverse methods for adipose measurements (different Hounsfield unit range for adipose tissue, different location for CT scan and analysis), and also that the present study has a larger population size. Furthermore, the current study population; that is, a Chinese population, is less obese than the other studies27, as also suggested by the absolute value of VFA. In the present analysis, the mean VFA was 122.69 cm2 (SD 56.97 cm2), where most studies of non‐Asian individuals have shown a mean VFA higher than this. Also, some of those study focus on more elderly populations that are more likely to experience metabolic disorder. It is likely that VFA does not serve as a good indicator among the normal‐weighted population, but could be among obese and older populations. Also, the present analysis showed that a sex difference existed in the association between each anthropometric and body composition measure; VFA is more sensitive as an anthropometrics indicator in predicting hyperglycemic risk in women than in men.
The present study also found that the visceral‐to‐subcutaneous fat ratio is not a good indicator for hyperglycemic risk among the Chinese population. This is similar to a previous study that included VSR in its analysis. In a study of obese women, VSR showed a strong correlation with hyperglycemic risk in obese individuals, and the strength of the correlation diminished in leaner individuals; that is, those with a VSR <0.928. This is consistent with the present analysis, where the highest VSR was 0.86, and 95% of study population had a VSR <0.58.
Although the present study based on a normal Chinese population provides new insights to the topic, it is not without limitation. To start with, the current analysis is based on the baseline data of the Pinggu Metabolic Disease Study cohort, and the cross‐sectional analysis does not allow for casual inference to provide more robust evidence. Second, we could only measure the area of a specific slice of CT scans rather than the total volume or mass of abdominal adipose tissue. Nevertheless, we still believe using the L4–L5 disc level fat area, as suggested and carried out by previous studies, is a good proxy for visceral abdominal fat area.
In conclusion, the current analyses focus on the strength of association between different anthropometrics and body composition measures with glycemic indices in a normal Chinese population. The present study showed that visceral abdominal fat area performs no better than WC and WHR as an indicator of a high risk factor for hyperglycemia among a healthy Chinese population. Additional research is required to study other central obesity‐related anthropometrics measures, and their association with diabetes.
The present study has strong public health implications. Among a healthy population, the need for measuring abdominal fat through CT scan or other diagnostics to predict diabetes is not urgent, where the more convenient measures, including WC and WHR, could show hyperglycemic risk well.
Disclosure
The authors declare no conflict of interest.
Supporting information
Table S1 | The association between different anthropometric and body composition measures and fasting plasma glucose by sex and age group.
Table S2 | The association between different anthropometric and body composition measures and 2‐h postprandial glucose by sex and age group.
Table S3 | The association between different anthropometric and body composition measures and hemoglobin A1c by sex and age group.
Table S4 | The association between different anthropometric and body composition measures and disposition index by sex and age group.
Table S5 | Odds ratio and 95% confidence interval of hyperglycemic risk associated with per one sex‐specific standard deviation of each anthropometric and body composition measure by sex.
Acknowledgment
This work is supported by the grants 2016YFC1304901, 2016YFC1305600 and 2016YFC1305603 from the Major Chronic Non‐communicable Disease Prevention and Control Research, National Key R&D Program of China.
J Diabetes Investig 2020; 11: 888–895
References
- 1. Després J‐P, Lemieux I. Abdominal obesity and metabolic syndrome. Nature 2006; 444: 881–887. [DOI] [PubMed] [Google Scholar]
- 2. Shuster A, Patlas M, Pinthus JH, et al The clinical importance of visceral adiposity: a critical review of methods for visceral adipose tissue analysis. Br J Radiol 2012; 85: 1–10. [DOI] [PMC free article] [PubMed] [Google Scholar]
- 3. Freemantle N, Holmes J, Hockey A, et al How strong is the association between abdominal obesity and the incidence of type 2 diabetes? Int J Clin Pract 2008; 62: 1391–1396. [DOI] [PMC free article] [PubMed] [Google Scholar]
- 4. Hajian‐Tilaki K, Heidari B. Is waist circumference a better predictor of diabetes than body mass index or waist‐to‐height ratio in Iranian adults? Int J Prev Med 2015;6:5 Available from: https://www.ncbi.nlm.nih.gov/pmc/articles/PMC4362276/. [DOI] [PMC free article] [PubMed] [Google Scholar]
- 5. Frank LK, Heraclides A, Danquah I, et al Measures of general and central obesity and risk of type 2 diabetes in a Ghanaian population. Trop Med Int Health 2013; 18: 141–151. [DOI] [PubMed] [Google Scholar]
- 6. Bragg F, Tang K, Guo Y, et al Associations of General and Central Adiposity With Incident Diabetes in Chinese Men and Women. Diabetes Care 2018; 41: 494–502. [DOI] [PMC free article] [PubMed] [Google Scholar]
- 7. Wang Y, Rimm EB, Stampfer MJ, et al Comparison of abdominal adiposity and overall obesity in predicting risk of type 2 diabetes among men. Am J Clin Nutr. 2005; 81: 555–563. [DOI] [PubMed] [Google Scholar]
- 8. Jung SH, Ha KH, Kim DJ. Visceral fat mass has stronger associations with diabetes and prediabetes than other anthropometric obesity indicators among korean adults. Yonsei Med J 2016; 57: 674–680. [DOI] [PMC free article] [PubMed] [Google Scholar]
- 9. Chiba Y, Saitoh S, Takagi S, et al Relationship between visceral fat and cardiovascular disease risk factors: the Tanno and Sobetsu study. Hypertens Res Off J Jpn Soc Hypertens 2007; 30: 229–236. [DOI] [PubMed] [Google Scholar]
- 10. Donohoe CL, Doyle SL, Reynolds JV. Visceral adiposity, insulin resistance and cancer risk. Diabetol Metab Syndr 2011; 3: 12. [DOI] [PMC free article] [PubMed] [Google Scholar]
- 11. Doyle SL, Donohoe CL, Lysaght J, et al Visceral obesity, metabolic syndrome, insulin resistance and cancer. Proc Nutr Soc 2012; 71: 181–189. [DOI] [PubMed] [Google Scholar]
- 12. Schapira DV, Clark RA, Wolff PA, et al Visceral obesity and breast cancer risk. Cancer 1994; 74: 632–639. [DOI] [PubMed] [Google Scholar]
- 13. Dong Y, Wang Z, Chen Z, et al Comparison of visceral, body fat indices and anthropometric measures in relation to chronic kidney disease among Chinese adults from a large scale cross‐sectional study. BMC Nephrol. 2018;19. Available from: https://bmcnephrol.biomedcentral.com/articles/10.1186/s12882‐018‐0837‐1. [DOI] [PMC free article] [PubMed] [Google Scholar]
- 14. Björntorp P, Rosmond R. Visceral obesity and diabetes. Drugs 1999; 58: 13–18. [DOI] [PubMed] [Google Scholar]
- 15. Boyko EJ, Fujimoto WY, Leonetti DL, et al Visceral adiposity and risk of type 2 diabetes: a prospective study among Japanese Americans. Diabetes Care 2000; 23: 465–471. [DOI] [PubMed] [Google Scholar]
- 16. Goodpaster BH, Krishnaswami S, Resnick H, et al Association between regional adipose tissue distribution and both type 2 diabetes and impaired glucose tolerance in elderly men and women. Diabetes Care 2003; 26: 372–379. [DOI] [PubMed] [Google Scholar]
- 17. Hu P, Li Y, Zhou X, et al Association between physical activity and abnormal glucose metabolism‐A population‐based cross‐sectional study in China. J Diabetes Complications 2018; 32: 746–752. [DOI] [PubMed] [Google Scholar]
- 18. Kvist H, Chowdhury B, Grangård U, et al Total and visceral adipose‐tissue volumes derived from measurements with computed tomography in adult men and women: predictive equations. Am J Clin Nutr 1988; 48: 1351–1361. [DOI] [PubMed] [Google Scholar]
- 19. Lemieux S, Lesage M, Bergeron J, et al Comparison of two techniques for measurement of visceral adipose tissue cross‐sectional areas by computed tomography. Am J Hum Biol Off J Hum Biol Counc 1999; 11: 61–68. [DOI] [PubMed] [Google Scholar]
- 20. Cobelli C, Toffolo GM, Man CD, et al Assessment of β‐cell function in humans, simultaneously with insulin sensitivity and hepatic extraction, from intravenous and oral glucose tests. Am J Physiol‐Endocrinol Metab 2007; 293: E1–E15. [DOI] [PubMed] [Google Scholar]
- 21. Association AD. Diagnosis and classification of diabetes mellitus. Diabetes Care 2010; 33(Supplement 1): S62–S69. [DOI] [PMC free article] [PubMed] [Google Scholar]
- 22. Kohrt WM, Kirwan JP, Staten MA, et al Insulin resistance in aging is related to abdominal obesity. Diabetes 1993; 42: 273–281. [PubMed] [Google Scholar]
- 23. Scheen AJ, Van Gaal LF. Combating the dual burden: therapeutic targeting of common pathways in obesity and type 2 diabetes. Lancet Diabetes Endocrinol 2014; 2: 911–922. [DOI] [PubMed] [Google Scholar]
- 24. Garaulet M, Pérez‐Llamas F, Baraza JC, et al Body fat distribution in pre‐and post‐menopausal women: metabolic and anthropometric variables. J Nutr Health Aging 2002; 6: 123–126. [PubMed] [Google Scholar]
- 25. Brochu M, Starling RD, Tchernof A, et al Visceral adipose tissue is an independent correlate of glucose disposal in older obese postmenopausal women. J Clin Endocrinol Metab 2000; 85: 2378–2384. [DOI] [PubMed] [Google Scholar]
- 26. Hoyer D, Boyko EJ, McNeely MJ, et al Subcutaneous thigh fat area is unrelated to risk of type 2 diabetes in a prospective study of Japanese Americans. Diabetologia 2011; 54: 2795. [DOI] [PMC free article] [PubMed] [Google Scholar]
- 27. WHO Expert Consultation . Appropriate body‐mass index for Asian populations and its implications for policy and intervention strategies. Lancet Lond Engl 2004; 363: 157–163. [DOI] [PubMed] [Google Scholar]
- 28. Zamboni M, Armellini F, Milani MP, et al Evaluation of regional body fat distribution: comparison between W/H ratio and computed tomography in obese women. J Intern Med 1992; 232: 341–347. [DOI] [PubMed] [Google Scholar]
Associated Data
This section collects any data citations, data availability statements, or supplementary materials included in this article.
Supplementary Materials
Table S1 | The association between different anthropometric and body composition measures and fasting plasma glucose by sex and age group.
Table S2 | The association between different anthropometric and body composition measures and 2‐h postprandial glucose by sex and age group.
Table S3 | The association between different anthropometric and body composition measures and hemoglobin A1c by sex and age group.
Table S4 | The association between different anthropometric and body composition measures and disposition index by sex and age group.
Table S5 | Odds ratio and 95% confidence interval of hyperglycemic risk associated with per one sex‐specific standard deviation of each anthropometric and body composition measure by sex.