Abstract
Aims/Introduction
Mean platelet volume (MPV) is a widely used biological marker of platelet function and activity. Increased MPV is associated with accelerated thrombopoiesis and an elevated risk of cardiovascular disease. However, it is not known whether higher MPV is related to the pathogenesis of type 2 diabetes and diabetic macrovascular complications in Japanese patients. Therefore, we analyzed MPV and its correlation with atherosclerosis in Japanese patients with type 2 diabetes and those who had prediabetes.
Materials and Methods
We divided the patients into three groups: normoglycemic patients (n = 56), prediabetes patients (n = 44) and type 2 diabetes patients group, (n = 115). We measured platelet parameters and evaluated arterial stiffness in the three groups.
Results
Significantly higher MPV was found in the type 2 diabetes mellitus and prediabetes patients compared with normoglycemic patients. MPV was significantly correlated with fasting blood glucose and glycated hemoglobin levels. Multiple linear regression analysis showed that MPV was positively correlated with HbA1c, even after adjustment for confounding factors. In the evaluation of arterial stiffness by measuring the cardio‐ankle vascular index and maximum intima‐media thickness, MPV showed a positive correlation with these parameters.
Conclusions
These findings suggest that MPV was significantly increased in the early stage of type 2 diabetes. We showed positive correlations between MPV and HbA1c levels, and between MPV and arterial stiffness in Japanese patients with type 2 diabetes.
Keywords: Arterial stiffness, Mean platelet volume, Type 2 diabetes
In Japanese patients with type 2 diabetes, mean platelet volume was significantly increased. Increased mean platelet volume led to progression of atherosclerosis. It was suggested that mean platelet volume was positively associated with the pathogenesis of type 2 diabetes mellitus in Japanese patients.
Introduction
Platelets have central roles in hemostasis and thrombosis1. When platelets are activated by vascular injury, they secrete various substances essential for mediating coagulation, thrombosis, inflammation and atherosclerosis2. Therefore, evaluation of platelet hyperactivity is important. However, the optimal method for platelet testing is complicated and requires specialized equipment, making direct measurement of platelet activity impractical in routine practice. Generally, large platelets show greater metabolic and enzymatic activity than small platelets3, 4. Mean platelet volume (MPV) is widely used as a biological marker of platelet function and activity5. MPV can be measured easily and cheaply by using an automated blood cell counter, which is routinely available in most hospitals. Increased MPV has been linked to the development of myocardial infarction6 and atherosclerosis7, as well as to increased risk of cardiovascular disease7, 8.
The risk of cardiovascular disease is high in patients with an underlying disease, such as hypertension, dyslipidemia and type 2 diabetes mellitus. Type 2 diabetes mellitus is a metabolic disorder and a critical factor in cardiovascular disease onset. Its pathogenesis is characterized mainly by insulin resistance and pancreatic β‐cell failure. Microvascular complications (retinopathy, nephropathy and neuropathy) and macrovascular complications (ischemic heart disease, peripheral vascular disease and cerebrovascular disease) are features of type 2 diabetes mellitus associated with hyperglycemia. Higher MPV is observed in patients with metabolic disorders, such as obesity9 and type 2 diabetes mellitus10, 11, 12; however, these studies only reported increased MPV in patients with type 2 diabetes mellitus, and it is still unclear whether higher MPV is present in the early stage of type 2 diabetes mellitus. To our knowledge, no studies have examined whether increased MPV is associated with progression of atherosclerosis in patients with type 2 diabetes mellitus.
In the present study, we hypothesized that MPV is associated with metabolic disorder in the early stage of type 2 diabetes mellitus in Japanese patients, and that increased MPV results in the progression of diabetic macrovascular complications.
Methods
Participants
The required number of patients in each group was determined statistically by R software (R Foundation for Statistical Computing, Vienna, Austria), and at least 41 patients were required in each group to carry out the analysis. On the basis of this calculation, we analyzed the data of 215 patients (normoglycemic patients [Control group], n = 56; prediabetes patients [Pre‐DM group], n = 44; and type 2 diabetes mellitus group, n = 115) from 2014 to 2015. They were classified into three groups based on criteria outlined by the American Diabetes Association13: Control (fasting blood glucose levels <110 mg/dL), Pre‐DM (fasting blood glucose levels 100–125 mg/dL and glycated hemoglobin [HbA1c] 5.7–6.4%) and type 2 diabetes mellitus (fasting blood glucose levels >126 mg/dL and HbA1c ≥ 6.5%). We could not divide the Pre‐DM group into impaired fasting glucose and impaired glucose tolerance groups, because an oral glucose tolerance test was not carried out. Patients with type 1 diabetes or an abnormal platelet count (<100 or >450 × 109 platelets/L) were excluded.
Ethics approval
The protocol for this research project was approved by a suitably constituted ethics committee of the institution and it conformed to the provisions of the Declaration of Helsinki. The institutional review board of Nara Prefecture General Medical Center, Approval No. 398.
Measurement of platelet parameters
Venous blood was sampled using K3‐ethylenediaminetetraacetic acid tubes. The samples were tested within 1 h of collection to ensure variations due to sample aging were minimized. We measured platelet count and MPV using an ADVIA® 2120i Hematology System (Siemens, Munich, Germany), which uses two‐angle laser flow cytometry with sodium dodecyl sulfate treatment for isovolumetric sphering measurement of erythrocytes and platelets. As a result, platelets and other blood cells can be discriminated accurately.
Biochemical measurements
Biochemical analyses of fasting blood glucose levels, C‐reactive protein, triglycerides, and high‐ and low‐density lipoprotein cholesterol were determined by standard methods. HbA1c was analyzed using high‐performance liquid chromatography (HLC723‐G9; Tosoh Bioscience, Tokyo, Japan). The clinical laboratory of Nara Prefecture General Medical Center carried out all laboratory measurements.
Assessment of arterial stiffness
The cardio‐ankle vascular index (CAVI) is a measure of the arterial stiffness of the arterial tree between the origin of the aorta and the ankle. This assessment is independent of blood pressure during measurement. CAVI assessment was carried out using a VaSera VS‐1500A system (Fukuda Denshi, Tokyo, Japan)14.
Ultrasonography of carotid intima‐media thickness
B‐mode ultrasonographic imaging of the carotid artery was performed using an ultrasound imaging system (LOGIQ S8; GE Healthcare Japan, Tokyo, Japan)15. Maximum intima‐media thickness (IMT) was used because it has been reported to be more useful than mean IMT for evaluating the progression of carotid artery disease16, 17, 18, 19.
Statistical analysis
One‐way analysis of variance (anova) was used for comparisons among the three groups. If anova showed a significant difference, we used the Tukey–Kramer test for multiple comparisons to identify which group differed. Student’s t‐test was used for comparisons between two groups. Pearson’s correlation model was used to calculate correlations between MPV and several parameters (fasting blood glucose levels, HbA1c levels, CAVI and maximum IMT). To examine the relationships between MPV and diabetic parameters after adjustment for clinical characteristics (age, sex, body mass index, blood pressure, smoking status and type of antidiabetic medication), multiple linear regression analysis was carried out. Data are presented as the mean ± standard deviation. P < 0.05 was considered to show statistical significance.
Results
Platelet size is positively correlated with glucose intolerance
Table 1 summarizes patients’ characteristics, whereas Table 2 shows the types of antidiabetic medication taken in the type 2 diabetes mellitus group. The clinical conditions of the Control group are shown in Table 3. No significant difference was evident between all groups for age, body mass index, C‐reactive protein, low‐ and high‐density lipoprotein cholesterol or diastolic blood pressure. The only significant differences observed in the type 2 diabetes mellitus group compared with the Control group were significantly increased triglycerides and systolic blood pressure.
Table 1.
Clinical characteristics of the patients
| Variable | Control (n = 56) | Pre‐DM (n = 44) | Type 2 diabetes mellitus (n = 115) |
|---|---|---|---|
| Male/female (n) | 31/25 | 34/10 | 70/45 |
| Age (years) | 70.3 ± 1.5 | 71.9 ± 0.8 | 71.9 ± 1.5 |
| BMI (kg/m2) | 22.4 ± 0.4 | 23.2 ± 0.5 | 23.8 ± 0.4 |
| Duration of DM (years) | 0 | 0 | 10.3 ± 0.6 |
| Smoking (yes/no) | 6/50 | 12/32 | 41/74 |
| FBG (mg/dL) | 96 ± 2.3 | 108.1 ± 2.3** | 172.6 ± 6.6* |
| HbA1c (%) | 5.63 ± 0.1 | 6.1 ± 0.1** | 7.9 ± 0.2* |
| CRP (mg/dL) | 0.17 ± 0.1 | 0.19 ± 0.1 | 0.1 8 ± 0.1 |
| Triglycerides (mg/dL) | 125.4 ± 11.7 | 130 ± 10.0 | 130.6 ± 9.0 |
| LDL (mg/dL) | 105.8 ± 5.0 | 105.1 ± 6.3 | 106.6 ± 2.71 |
| HDL (mg/dL) | 49.7 ± 2.3 | 48.2 ± 2.6 | 49.2 ± 1.2 |
| SBP (mmHg) | 130.6 ± 1.9 | 131.8 ± 2.2 | 139.3 ± 1.8* |
| DBP (mmHg) | 81.4 ± 1.2 | 82.2 ± 1.2 | 81.3 ± 1.2 |
Total n = 215. Data are presented as the mean ± standard deviation and percentage (%) for the normoglycemic patients (Control group), prediabetes patients (Pre‐DM group) and type 2 diabetes mellitus groups. P‐values were calculated using analysis of variance and the Tukey–Kramer test for multiple comparisons. *P < 0.05, Control versus type 2 diabetes mellitus; **P < 0.05, Control versus Pre‐DM. BMI, body mass index; CRP, C‐reactive protein; DBP, diastolic blood pressure; FBG, fasting blood glucose; HbA1c, glycated hemoglobin; HDL, high‐density lipoprotein; LDL, low‐density lipoprotein; SBP, systolic blood pressure.
Table 2.
Type of antidiabetic medication taken by patients in the type 2 diabetes mellitus group
| Antidiabetic medication | n (%) |
|---|---|
| Sulfonylurea | 24 (26.1) |
| Glinide | 2 (2.1) |
| Metformin | 17 (18.5) |
| Alpha‐glucosidase inhibitor | 19 (20.7) |
| Thiazolidinedione | 6 (6.5) |
| DPP‐4 inhibitor | 54 (58.7) |
| GLP‐1 receptor agonist | 1 (1.1) |
| SGLT‐2 inhibitor | 2 (2.1) |
| Insulin | 32 (34.8) |
DPP‐4; dipeptidyl peptidase; GLP‐1; glucagon like peptide‐1; SGLT‐2; sodium–glucose cotransporter 2.
Table 3.
Clinical conditions of the normoglycemic patients
| Clinical condition | n (%) |
|---|---|
| Hypertension | 14 (25.0) |
| Angina | 11 (19.6) |
| Dyslipidemia | 8 (14.3) |
| Chronic kidney disease | 6 (10.7) |
| Arrhythmia | 3 (5.3) |
| Hyperuricemia | 3 (5.3) |
| Rheumatoid arthritis | 2 (3.6) |
| Thyroid dysfunction | 2 (3.6) |
| Gastritis | 2 (3.6) |
| Neurological disorders | 2 (3.6) |
| Iron deficiency anemia | 2 (3.6) |
| Systemic lupus erythematosus | 1 (1.8) |
There was a significant increase in MPV in the type 2 diabetes mellitus and Pre‐DM groups compared with the Control group (Figure 1a). No significant difference was seen in platelet counts among the three groups (Figure 1b). MPV was positively correlated with fasting blood glucose and HbA1c levels (Figure 1c,d). To examine whether MPV was affected by the type of antidiabetic medication, we carried out multiple linear regression analysis. However, there was no positive relationship between MPV and the type of antidiabetic medication in the type 2 diabetes mellitus group after adjusting for medication type (Table 4).
Figure 1.
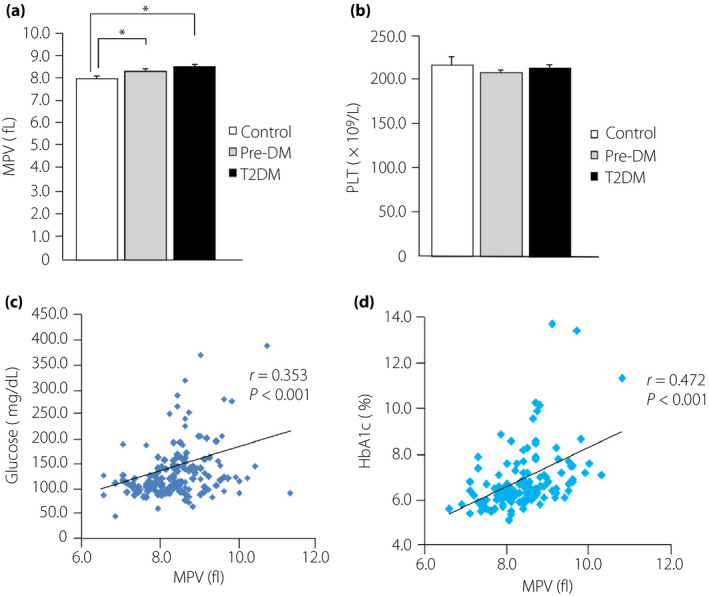
Mean platelet volume (MPV) levels in the three groups, and the correlation between MPV and fasting blood glucose and glycated hemoglobin (HbA1c) levels. (a) MPV levels and (b) platelet counts (PLT) for the normoglycemic patients (Control group), prediabetes patients (Pre‐DM group) and type 2 diabetes patients group (T2DM). (c) Correlation between MPV and fasting blood glucose levels. (d) Correlation between MPV and HbA1c levels. *P < 0.05.
Table 4.
Correlation with mean platelet volume and type of antidiabetic medication according to multiple linear regression analysis
| Characteristic | Regression coefficient β | SE | 95% CI | P‐value | |
|---|---|---|---|---|---|
| Lower | Upper | ||||
| Sulfonylurea | 0.000 | 0.177 | −0.355 | 0.351 | 0.998 |
| Glinide | −0.438 | 0.498 | −1.429 | 0.553 | 0.377 |
| Metformin | 0.013 | 0.206 | −0.397 | 0.423 | 0.933 |
| Alpha‐glucosidase inhibitor | 0.232 | 0.190 | −0.147 | 0.612 | 0.226 |
| Thiazolidinedione | 0.438 | 0.301 | −0.182 | 1.048 | 0.165 |
| DPP‐4 inhibitor | −0.321 | 0.177 | −0.673 | 0.029 | 0.072 |
| GLP‐1 receptor agonist | −0.471 | 0.717 | −1.898 | 0.957 | 0.514 |
| SGLT‐2 inhibitor | 0.081 | 0.502 | −0.917 | 1.079 | 0.871 |
| Insulin | −0.121 | 0.192 | −0.505 | 0.262 | 0.530 |
CI, confidence interval; DPP‐4, dipeptidyl peptidase; GLP‐1, glucagon‐like peptide‐1; SE, standard error; SGLT‐2, sodium–glucose cotransporter 2.
In addition to MPV, the ADVIA 2120i Hematology System can measure another marker of platelet size, namely, the large platelet (LPLT) morphology flag. When ≥10% of platelets in the blood are >20 fL, the LPLT flag becomes positive. In LPLT‐positive patients, fasting blood glucose and HbA1c levels were significantly increased compared with LPLT‐negative patients (Figure 2a,b). Furthermore, we carried out multiple linear regression analysis to determine the independent relationships between MPV and HbA1c among the confounding factors. MPV was positively correlated with HbA1c and blood pressure, even after adjustment for the confounding factors (Table 5).
Figure 2.
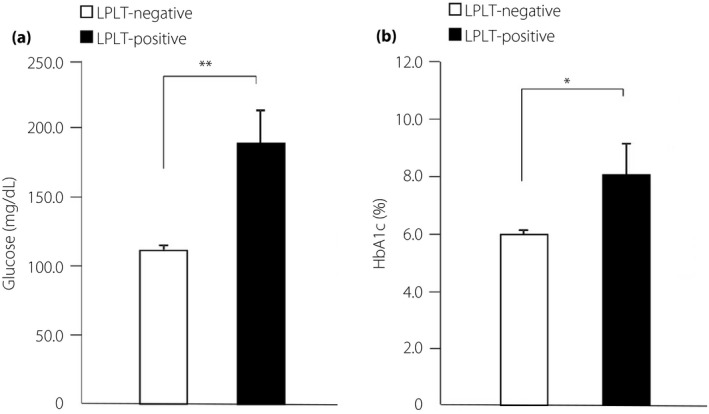
Measurement of fasting blood glucose and glycated hemoglobin (HbA1c) levels in the large platelet (LPLT)‐negative and LPLT‐positive groups. (a) Fasting blood glucose levels and (b) HbA1c levels for the LPLT‐negative and LPLT‐positive groups. LPLT‐negative, <10% large platelets in the blood; LPLT‐positive, ≥10% large platelets in the blood. *P < 0.05, **P < 0.01.
Table 5.
Correlation between mean platelet volume and clinical characteristics according to multiple linear regression analysis
| Characteristic | Regression coefficient β | SE | 95% CI | P‐value | |
|---|---|---|---|---|---|
| Lower | Upper | ||||
| Age (years) | 0.009 | 0.006 | −0.001 | 0.020 | 0.089 |
| Sex | 0.179 | 0.119 | −0.055 | 0.414 | 0.132 |
| BMI (kg/m2) | 0.006 | 0.014 | −0.023 | 0.034 | 0.692 |
| SBP (mmHg) | 0.007 | 0.003 | 0.001 | 0.014 | 0.003* |
| DBP (mmHg) | −0.015 | 0.001 | −0.028 | −0.003 | 0.016* |
| Smoking status | 0.023 | 0.125 | −0.223 | 0.271 | 0.851 |
| Fasting blood glucose (mg/dL) | 0.001 | 0.001 | −0.001 | 0.003 | 0.265 |
| HbA1c (%) | 0.106 | 0.041 | 0.027 | 0.187 | 0.001** |
P < 0.05; **P < 0.01. BMI, body mass index; CI, confidence interval; DBP, diastolic blood pressure; HbA1c, glycated hemoglobin; SBP, systolic blood pressure; SE, standard error.
Next, we examined the possibility that MPV could change according to variations in glucose levels. We defined an improvement of hyperglycemia when fasting blood glucose levels were decreased by <160 mg/dL or HbA1c levels were decreased by >0.5% in 1 year, regardless of the type of treatment used. Then, 38 patients in the type 2 diabetes mellitus group were observed to have achieved an improvement of fasting blood glucose (Figure 3a) and HbA1c (Figure 3b) levels after treatment for 1 year. We found that MPV after treatment was significantly reduced compared with that before treatment (Figure 3c).
Figure 3.
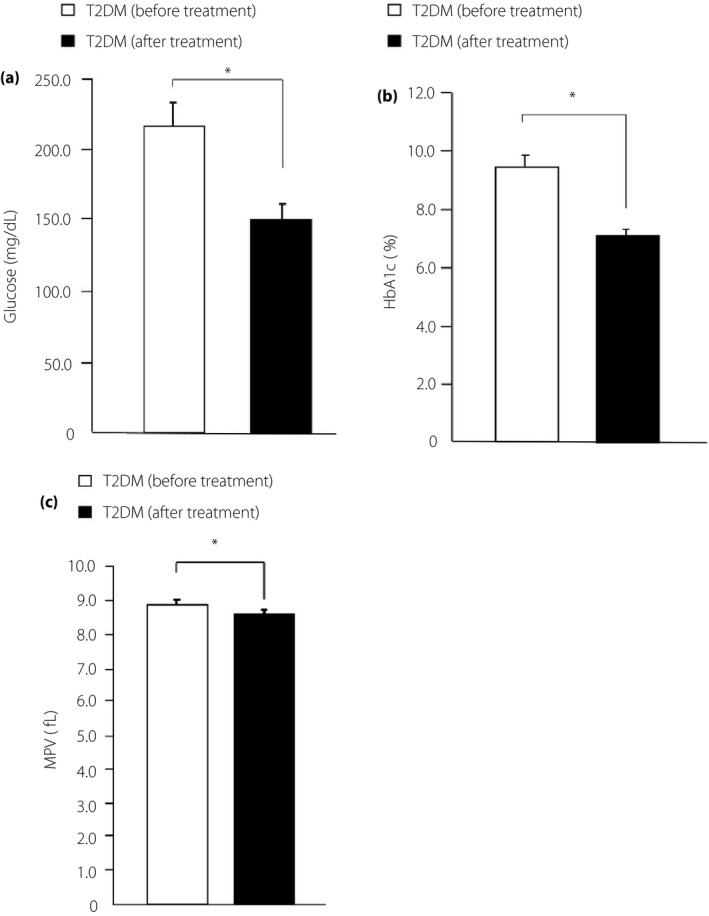
Clinical characteristic changes and mean platelet volume (MPV) in the type 2 diabetes (T2DM) patients group before and after treatment. (a) Fasting blood glucose levels, (b) glycated hemoglobin (HbA1c) levels and (c) MPV for the type 2 diabetes mellitus before treatment group and after treatment group. *P < 0.05.
Progression of atherosclerosis in patients with type 2 diabetes is positively correlated with increased MPV
To evaluate how MPV is related to arterial stiffness, we measured CAVI and maximum IMT, which are widely used markers of arterial stiffness. A significant increase in CAVI and maximum IMT was found in the type 2 diabetes mellitus group compared with the Control group (Figure 4a,b). Furthermore, there was a significant increase in CAVI in the Pre‐DM group compared with the Control group (Figure 4a). Atherosclerosis has been found in the early stage of type 2 diabetes mellitus20, 21. Indeed, we found that MPV and CAVI were positively correlated (Figure 4c). However, the relationship between increased MPV and atherosclerotic condition in the type 2 diabetes mellitus group was not completely clear. We included type 2 diabetes mellitus patients with mild atherosclerosis (8.0 < CAVI < 9.0) in the group of patients without atherosclerosis14 and analyzed MPV in these patients. MPV was observed to be significantly increased in the type 2 diabetes mellitus group without atherosclerosis compared with the Control group (Figure 4d).
Figure 4.
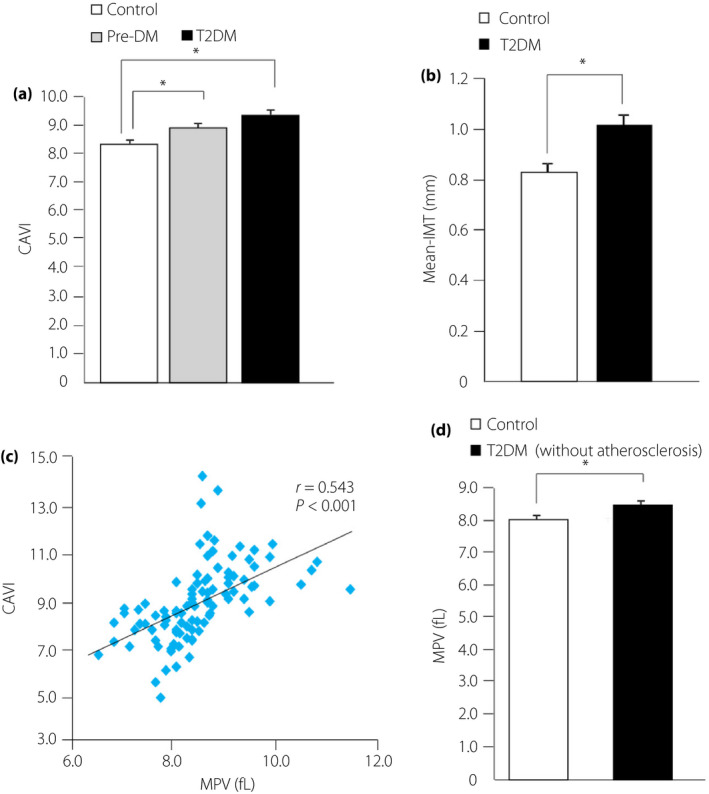
Assessment of arterial stiffness in the three groups and examination of the effect of atherosclerosis on mean platelet volume (MPV). (a) Cardio‐ankle vascular index (CAVI) levels in normoglycemic patients (Control group), prediabetes patients (Pre‐DM group) and type 2 diabetes patients group. (b) Maximum intima‐media thickness (IMT) for the Control and type 2 diabetes mellitus groups. (c) Correlation between MPV and CAVI levels. (d) Comparison of MPV between the Control group and type 2 diabetes mellitus patients without atherosclerosis. *P < 0.05.
Discussion
Our findings showed that increased MPV and diabetic conditions are positively correlated in Japanese patients with type 2 diabetes mellitus. Furthermore, we observed a significant increase in MPV in the early stage of type 2 diabetes mellitus according to the findings in the Pre‐DM group. In this study, we examined the association between platelet size and hyperglycemia by analyzing LPLT, which showed that platelet size might be influenced by chronic hyperglycemia, because LPLT was positively associated with HbA1c levels. Multiple linear regression analysis showed that there was no positive relationship between MPV and the type of antidiabetic medication used in the type 2 diabetes mellitus group after making adjustments for medication type. Furthermore, we found that MPV could be changed by improving hyperglycemia in Japanese patients with type 2 diabetes mellitus. A significant decrease in MPV due to the improvement of hyperglycemia by 6 months of metformin treatment has been shown in patients with type 2 diabetes mellitus22. These results suggested that platelet size was influenced in the early stage of type 2 diabetes mellitus, and baseline treatment did not have a positive association with MPV. The chronic change in blood glucose levels might be associated with MPV. Factors reported to affect MPV include the length of time from venous blood sampling to testing5, seasonal changes23 and hypertension24. However, we tested all blood samples within 1 h from sampling and observed no seasonal differences in the recruited patients. Therefore, these factors did not affect the present results. In the type 2 diabetes mellitus group, we observed significant elevation in only systolic blood pressure compared with the Control group. In addition, multiple linear regression analysis showed that MPV was positively correlated with HbA1c levels and blood pressure after adjustment for confounding factors. From these results, we could not completely discount the influence of blood pressure, but at the very least, blood pressure did not affect MPV and arterial stiffness in the Pre‐DM group. Nevertheless, the mechanism by which MPV was increased in patients with type 2 diabetes mellitus remains unclear. Platelet size is determined during megakaryopoiesis, and there is a positive association between platelet morphology and levels of thrombopoietin and interleukin‐6, which regulate megakaryocyte ploidy25, 26. Hyperglycemia increases the production of thrombopoietin by neutrophils in the liver through the receptor for advanced glycation end‐products27. Interleukin‐6 is well known for linking inflammation and insulin resistance in type 2 diabetes mellitus patients28, 29. Thrombopoietin and interleukin‐6 production might be regulated by diabetic conditions, such as hyperglycemia and hyperinsulinemia, which leads to increased platelet size. Gieger et al. carried out a meta‐analysis of genome‐wide association studies for platelet indices, and identified an association between some single‐nucleotide polymorphisms and MPV30. In fact, the present study included some patients with low MPV. These genetic variants might contribute to other mechanisms that regulate MPV independently of diabetic conditions. Another study identified four genetic variants associated with MPV and arterial stiffness31, and one of them corresponded with the results of Gieger et al. Further research focusing on these molecules or genes is required.
We examined MPV as a biomarker for predicting macrovascular complications in Japanese patients with type 2 diabetes mellitus. In patients with coronary artery disease, MPV is reported to be a potentially useful prognostic biomarker32. The population‐based Gutenberg Health Study showed a strong association between MPV and arterial stiffness. Furthermore, higher MPV was considered a potential marker of platelet activation and increased stiffness of the arterial vessel wall31. The present results showed a positive association between higher MPV and progression of atherosclerosis in the type 2 diabetes mellitus and Pre‐DM groups. In addition, we showed the possibility that progression of atherosclerosis in type 2 diabetes mellitus was due to increased MPV. In light of this possible relationship, we suggest that measuring MPV might be important in terms of evaluating atherosclerosis and cardiovascular outcomes in Japanese patients with type 2 diabetes mellitus.
This study had several limitations. First, due to its retrospective nature, we could not examine how increased MPV is related to future clinical events. Second, we were unable to divide the Pre‐DM group into impaired fasting glucose and impaired glucose tolerance groups, because we did not have oral glucose tolerance test data. Third, we could not analyze platelet activity or functions, because we did not have any suitable methods or specialized equipment. Thus, the correlation between platelet functions and MPV is still unclear.
In conclusion, these findings suggest that increased MPV is positively associated with HbA1c levels in Japanese type 2 diabetes mellitus patients, and is positively related to the progression of atherosclerosis. Measuring MPV could be a beneficial marker for determining diabetes‐induced macrovascular complications in patients with type 2 diabetes mellitus.
Disclosure
The authors declare no conflict of interest.
Acknowledgments
We thank Siemens Healthineers Japan (Tokyo, Japan) for providing technical information. This research received no specific grant from any funding agency in the public, commercial or not‐for‐profit sectors.
J Diabetes Investig 2020; 11: 938–945
References
- 1. Davi G, Patrono C. Platelet activation and atherothrombosis. N Engl J Med 2007; 357: 2482–2494. [DOI] [PubMed] [Google Scholar]
- 2. Coppinger JA, Cagney G, Toomey S, et al Characterization of the proteins released from activated platelets leads to localization of novel platelet proteins in human atherosclerotic lesions. Blood 2004; 103: 2096–2104. [DOI] [PubMed] [Google Scholar]
- 3. Karpatkin S. Heterogeneity of human platelets. II. Functional evidence suggestive of young and old platelets. J Clin Invest 1969; 48: 1083–1087. [DOI] [PMC free article] [PubMed] [Google Scholar]
- 4. Karpatkin S, Khan Q, Freedman M. Heterogeneity of platelet function. Correlation with platelet volume. Am J Med 1978; 64: 542–546. [DOI] [PubMed] [Google Scholar]
- 5. Bath PM, Butterworth RJ. Platelet size: measurement, physiology and vascular disease. Blood Coagul Fibrinolysis 1996; 7: 157–161. [PubMed] [Google Scholar]
- 6. Klovaite J, Benn M, Yazdanyar S, et al High platelet volume and increased risk of myocardial infarction: 39,531 participants from the general population. J Thromb Haemost 2011; 9: 49–56. [DOI] [PubMed] [Google Scholar]
- 7. Tavil Y, Sen N, Yazici HU, et al Mean platelet volume in patients with metabolic syndrome and its relationship with coronary artery disease. Thromb Res 2007; 120: 245–250. [DOI] [PubMed] [Google Scholar]
- 8. Chu SG, Becker RC, Berger PB, et al Mean platelet volume as a predictor of cardiovascular risk: a systematic review and meta‐analysis. J Thromb Haemost 2010; 8: 148–156. [DOI] [PMC free article] [PubMed] [Google Scholar]
- 9. Coban E, Ozdogan M, Yazicioglu G, et al The mean platelet volume in patients with obesity. Int J Clin Pract 2005; 59: 981–982. [DOI] [PubMed] [Google Scholar]
- 10. Papanas N, Symeonidis G, Maltezos E, et al Mean platelet volume in patients with type 2 diabetes mellitus. Platelets 2004; 15: 475–478. [DOI] [PubMed] [Google Scholar]
- 11. Hekimsoy Z, Payzin B, Ornek T, et al Mean platelet volume in Type 2 diabetic patients. J Diabetes Complications 2004; 18: 173–176. [DOI] [PubMed] [Google Scholar]
- 12. Kakouros N, Rade JJ, Kourliouros A, et al Platelet function in patients with diabetes mellitus: from a theoretical to a practical perspective. Int J Endocrinol 2011; 2011: 742719. [DOI] [PMC free article] [PubMed] [Google Scholar]
- 13. American Diabetes Association . Standards of medical care in diabetes‐2018. Diabetes Care 2018; 41(Suppl 1): S13–S27. [DOI] [PubMed] [Google Scholar]
- 14. Shirai K, Utino J, Otsuka K, et al A novel blood pressure‐independent arterial wall stiffness parameter; cardio‐ankle vascular index (CAVI). J Atheroscler Thromb 2006; 13: 101–107. [DOI] [PubMed] [Google Scholar]
- 15. Nezu T, Hosomi N, Aoki S, et al Carotid intima‐media thickness for atherosclerosis. J Atheroscler Thromb 2016; 23: 18–31. [DOI] [PubMed] [Google Scholar]
- 16. Irie Y, Katakami N, Kaneto H, et al Maximum carotid intima‐media thickness improves the prediction ability of coronary artery stenosis in type 2 diabetic patients without history of coronary artery disease. Atherosclerosis 2012; 221: 438–444. [DOI] [PubMed] [Google Scholar]
- 17. den Ruijter Peters SA, Groenewegen KA, et al Common carotid intima‐media thickness does not add to Framingham risk score in individuals with diabetes mellitus: the USE‐IMT initiative. Diabetologia 2013; 56: 1494–1502. [DOI] [PMC free article] [PubMed] [Google Scholar]
- 18. Bots ML, Groenewegen KA, Anderson TJ, et al Common carotid intima‐media thickness measurements do not improve cardiovascular risk prediction in individuals with elevated blood pressure: the USE‐IMT collaboration. Hypertension 2014; 63: 1173–1181. [DOI] [PMC free article] [PubMed] [Google Scholar]
- 19. Fujihara K, Suzuki H, Sato A, et al Comparison of the Framingham risk score, UK Prospective Diabetes Study (UKPDS) Risk Engine, Japanese Atherosclerosis Longitudinal Study‐Existing Cohorts Combine (JALS‐ECC) and maximum carotid intima‐media thickness for predicting coronary artery stenosis in patients with asymptomatic type 2 diabetes. J Atheroscler Thromb 2014; 21: 799–815. [DOI] [PubMed] [Google Scholar]
- 20. DeFronzo RA, Abdul‐Ghani M. Assessment and treatment of cardiovascular risk in prediabetes: impaired glucose tolerance and impaired fasting glucose. Am J Cardiol 2011; 108(3 Suppl): 3B–24B. [DOI] [PubMed] [Google Scholar]
- 21. Lee M, Saver JL, Hong K‐S, et al Effect of pre‐diabetes on future risk of stroke: meta‐analysis. BMJ 2012; 344: e3564. [DOI] [PMC free article] [PubMed] [Google Scholar]
- 22. Dolasik I, Sener SY, Celebı K, et al The effect metformin on mean platelet volume in diabetic patients. Platelets 2013; 24: 118–121. [DOI] [PubMed] [Google Scholar]
- 23. Peng L, Yang J, Lu X. Effects of biological variations on platelet count in healthy subjects in China. Thromb Haemost 2004; 91: 367–372. [DOI] [PubMed] [Google Scholar]
- 24. Nadar S, Blann AD, Lip GY. Platelet morphology and blood indices of platelet activation in essential hypertension: effects of amlodipine‐based antihypertensive therapy. Ann Med 2004; 36: 552–557. [DOI] [PubMed] [Google Scholar]
- 25. Brown AS, Hong Y, de Belder A, et al Megakaryocyte ploidy and platelet changes in human diabetes and atherosclerosis. Arterioscler Thromb Vasc Biol 1997; 17: 802–807. [DOI] [PubMed] [Google Scholar]
- 26. Martin JF, Trowbridge EA, Salmon G, et al The biological significance of platelet volume: its relationship to bleeding time, platelet thromboxane B2 production and megakaryocyte nuclear DNA concentration. Thromb Res 1983; 32: 443–460. [DOI] [PubMed] [Google Scholar]
- 27. Lee RH, Bergmeier W. Sugar makes neutrophils RAGE: linking diabetes‐associated hyperglycemia to thrombocytosis and platelet reactivity. J Clin Invest 2017; 127: 2040–2043. [DOI] [PMC free article] [PubMed] [Google Scholar]
- 28. Ueki K, Kondo T, Tseng YH, et al Central role of suppressors of cytokine signaling proteins in hepatic steatosis, insulin resistance, and the metabolic syndrome in the mouse. Proc Natl Acad Sci USA 2004; 101: 10422–10427. [DOI] [PMC free article] [PubMed] [Google Scholar]
- 29. Wallenius V, Wallenius K, Ahrén B, et al Interleukin‐6‐dificient mice develop mature‐onset obesity. Nat Med 2002; 8: 75–79. [DOI] [PubMed] [Google Scholar]
- 30. Gieger C, Radhakrishnan A, Cvejic A, et al New gene functions in megakaryopoiesis and platelet formation. Nature 2012; 480: 201–208. [DOI] [PMC free article] [PubMed] [Google Scholar]
- 31. Panova NM, Arnold N, Hermanns MI, et al Mean platelet volume and arterial stiffness‐clinical relationship and common genetic variability. Sci Rep 2017; 7: 40229. [DOI] [PMC free article] [PubMed] [Google Scholar]
- 32. Sansanayudh N, Numthavaj P, Muntham D, et al Prognositc effect of mean platelet volume in patients with coronary artery disease. A systematic review and meta‐analysis. Thromb Haemost 2015; 114: 1299–1309. [DOI] [PubMed] [Google Scholar]


