

Abstract
Introduction
Severe acute respiratory syndrome coronavirus 2 (SARS-CoV-2) is a highly contagious disease, and its first outbreak was reported in Wuhan, China. A coronavirus disease (COVID-19) causes severe respiratory distress (ARDS). Due to the primary involvement of the respiratory system, chest CT is strongly recommended in suspected COVID-19 cases, for both initial evaluation and follow-up.
Objective
The aim of this review was to systematically analyze the existing literature on CT imaging features of patients with COVID-19 pneumonia.
Methods
A systematic search was conducted on PubMed, Embase, Cochrane Library, Open Access Journals (OAJ), and Google Scholar databases until April 15, 2020. All articles with a report of CT findings in COVID-19 patients published in English from the onset of COVID-19 outbreak to April 20, 2020, were included in the study.
Result
From a total of 5041 COVID-19-infected patients, about 98% (4940/5041) had abnormalities in chest CT, while about 2% have normal chest CT findings. Among COVID-19 patients with abnormal chest CT findings, 80% (3952/4940) had bilateral lung involvement. Ground-glass opacity (GGO) and mixed GGO with consolidation were observed in 2482 (65%) and 768 (18%) patients, respectively. Consolidations were detected in 1259 (22%) patients with COVID-19 pneumonia. CT images also showed interlobular septal thickening in about 691 (27%) patients.
Conclusion
Frequent involvement of bilateral lung infections, ground-glass opacities, consolidation, crazy paving pattern, air bronchogram signs, and intralobular septal thickening were common CT imaging features of patients with COVID-19 pneumonia.
1. Introduction
Severe acute respiratory syndrome coronavirus 2 (SARS-CoV-2) is a highly contagious disease, and its first outbreak was reported in Wuhan, China [1]. On January 30, 2020, the World Health Organization (WHO) declared it a pandemic disease [2]. Currently, the disease has been reported in more than 212 countries worldwide [3]. As of May 01, a total of 3,325,620 cases and 234,496 deaths due to COVID-19 were reported worldwide [4]. The most common diagnostic tool for coronavirus disease 2019 (COVID-19) infection is real-time polymerase chain reaction (RT-PCR), which is regarded as the reference standard [5, 6].
COVID-19 causes severe respiratory distress (ARDS). Due to the primary involvement of the respiratory system, chest computed tomography (CT) is strongly recommended in suspected COVID-19 cases, for both initial evaluation and follow-up [7]. Recent studies addressed the importance of chest CT examination in COVID-19 patients with false-negative RT-PCR results [8] and reported the CT sensitivity as 98% [9]. Additionally, CT examinations also have great significance in monitoring disease progression and evaluating therapeutic efficacy.
The SARS-CoV-2 has four major structural proteins: the spike surface glycoprotein, small envelope protein, matrix protein, and nucleocapsid protein [10]. The spike protein binds to host receptors via the receptor-binding domains (RBDs) of angiotensin-converting enzyme-2 (ACE2) [11]. The ACE2 protein has been identified in various human organs, including the respiratory system, GI tract, lymph nodes, thymus, bone marrow, spleen, liver, kidney, and brain. SARS-CoV-2 was reported to utilize angiotensin-converting enzyme-2 (ACE2) as the cell receptor in humans [12], firstly causing pulmonary interstitial damage and subsequently with parenchymal changes. Reportedly, chest CT images could manifest different imaging features or patterns in COVID-19 patients with different time course and disease severity [13, 14].
Studies suggest that routine chest CT is a useful tool in the early diagnosis of COVID-19 infection, especially in settings of limited availability of reverse-transcriptase polymerase chain reaction (RT-PCR [15]. Imaging is critical in assessing severity and disease progression in COVID-19 infection. Radiologists should be aware of the features and patterns of imaging manifestations of the novel COVID-19 infection. A variety of imaging features have been described in similar coronavirus-associated syndromes. Due to an alarming spread of COVID-19 outbreak throughout the world, a comprehensive understanding of the importance of evaluating chest CT imaging findings is essential for effective patient management and treatment. Individual literature published is required to be summarized. Thus, a comprehensive systematic review has to be performed. Therefore, this study systematically reviewed CT imaging features of patients with COVID-19 pneumonia.
2. Methods
2.1. Search Strategy
A systematic search was conducted on PubMed, Embase, Cochrane Library, Open Access Journals (OAJ), and Google Scholar databases until April 15, 2020. Keywords used to search eligible studies were “severe acute respiratory syndrome 2,” “SARS CoV 2,” “2019-nCoV,” “COVID-19,” “computed tomography,” “CT,” and “radiology.” All identified keywords and mesh terms were combined using the “OR” operator and “AND” operator for searching literatures. We simultaneously searched the reference lists of all recovered articles for potentially eligible studies.
2.2. Eligibility Criteria
All articles with a report of CT findings in COVID-19 patients published in English from the onset of COVID-19 outbreak to April 20, 2020, were included in the study. Case studies and case series reported on chest CT imaging findings of patients with COVID-19 were included with caution. Studies pertaining to other coronavirus-related illnesses were excluded.
2.3. Assessment of Study Quality
Studies selected for inclusion were assessed for methodological quality by two teams of independent reviewers using the standard critical appraisal instruments of the Joanna Briggs Institute Meta-Analysis of Statistics Assessment for the Review Instrument (JBI-MAStARI) [16]. Disagreements were resolved by consensus.
2.4. Data Extraction and Synthesis
Data were extracted by two teams of the investigators using a standardized data extraction form. In addition, eligible case studies and case series studies were extracted carefully. Then the extracted data were merged for systematic analysis. The main outcomes extracted from each study were study design, country, patient demographics, and chest CT findings. Additional findings extracted were the patient's clinical characteristics. Disagreements were discussed with other reviewers and subsequently resolved via consensus.
2.5. Data Analysis and Data Synthesis
Systematic reviews and meta-analyses were carried out using R software version 3.6.1 with user-contributed commands for meta-analyses: metaprop, metan, metainf, metabias, and metareg. The effect sizes and SEs of the studies were pooled using a random-effects model to calculate the pooled estimates of CT findings among COVID-19 patients. A meta-analysis was also planned to assess the association of various imaging findings with demographic data.
2.6. Risk of Bias and Sensitivity Analysis
Evidence for statistical heterogeneity of the results was assessed using the Cochrane Q x2 test and I2 statistic. A significance level of P < 0.10 and I2 >50% was interpreted as evidence of heterogeneity [17]. A potential source of heterogeneity was investigated by subgroup analysis and meta-regression analysis [18]. Where statistical pooling was not possible, the findings were presented in a narrative form including tables and figures to aid in data presentation where appropriate.
Sensitivity analyses were conducted to weigh up the relative influence of each individual study on the pooled effect size using a user-written function, metainf. The presence of publication bias was assessed informally by visual inspection of funnel plots [19].
3. Result
3.1. Study Selection
Following the initial search, 241 studies were identified from the electronic databases (Figure 1). After the removal of 67 duplicates, 17 noneligible studies, and six studies with unclear population, 78 studies were retrieved for full-text review. Of this, 18 studies were of poor quality that did not meet the eligibility criteria. Following methodological quality assessment, 60 articles were included in the meta-analysis. In the included studies, a total of 5041 patients with COVID-19 were assessed for CT imaging features. All papers were published in English.
Figure 1.
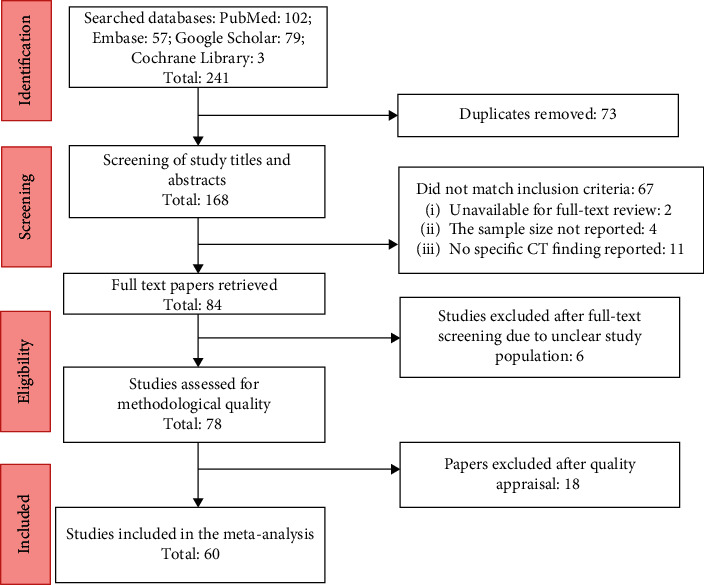
Flow chart of the search and study inclusion.
3.2. Study Characteristics
In this review, 60 papers were eligible and a total of 5041 patients had CT imaging findings [8, 12–14, 19–72]. From a total of 5401 participants, about half of them were male 2710 (50.2%), while 2693 (49.8%) were female. The mean age of the participants was 49 years with a standard deviation of 11.6 years.
3.2.1. Clinical Features of Patients with COVID-19
From a total of 60 included studies, only 48 studies had reported the clinical features of COVID-19 infected patients. According to the report of 48 studies, the main clinical features of COVID-19 infected patients were fever and dry cough, which accounted for 80% (2954/3800) and 56.2% (2137/3800), respectively, while about 2.3% (86/3800) patients with COVID-19 infection are asymptomatic. The total white blood cell count was decreased in about 24% (410) of patients with COVID-19, while about 2% [43] had increased white blood cells. Decreased lymphocyte count was detected in about 442 (43%) patients with COVID-19, and only 1% had increased lymphocyte count. Markers like C-reactive protein were found to be increased in about 87% (458) patients, while only 13% (254) had normal C-reactive protein (Table 1).
Table 1.
Review of clinical features of patients with COVID-19.
| Clinical features | Number of studies | Number of patients (%) |
|---|---|---|
| Sign and symptoms | ||
| Fever | 48 | 2954 (80%) |
| Dry cough | 48 | 2137 (56.2%) |
| Respiratory distress | 29 | 462 (15%) |
| Pharyngeal pain | 48 | 381 (13%) |
| Fatigue | 32 | 481 (27%) |
| Total WBC count | ||
| Normal | 22 | 1195 (68%) |
| Decreased | 22 | 410 (24%) |
| Increased | 22 | 45 (2%) |
| Lymphocyte count | ||
| Normal | 22 | 566 (56%) |
| Decreased | 22 | 442 (43%) |
| Increased | 22 | 2 (1%) |
| C-reactive protein | ||
| Normal | 15 | 254 (13%) |
| Decreased | 15 | 0 (0%) |
| Increased | 15 | 458 (87%) |
3.2.2. Chest CT Imaging Features of COVID-19-Infected Patients
We performed meta-analyses of primary outcome data and secondary outcomes with available data. From a total of 5041 COVID-19-infected patients, about 98% (4940/5041) had abnormalities in chest CT, while about 2% had normal chest CT findings (Figure 2). Among COVID-19 patients with abnormal chest CT findings, 80% (3952/4940) had bilateral lung involvement. About 20% (641/3206) patients had exclusively unilateral lung involvement. When a single lobe was involved, the right lung was most often affected (62%) and 38% of them had only left lung involvement. In the right lung, the lower lobe was frequently involved (74% (784)), while the middle lobe was less frequent (38% (326)). In the left lung, the upper lobe was frequently involved (74% (731)).
Figure 2.
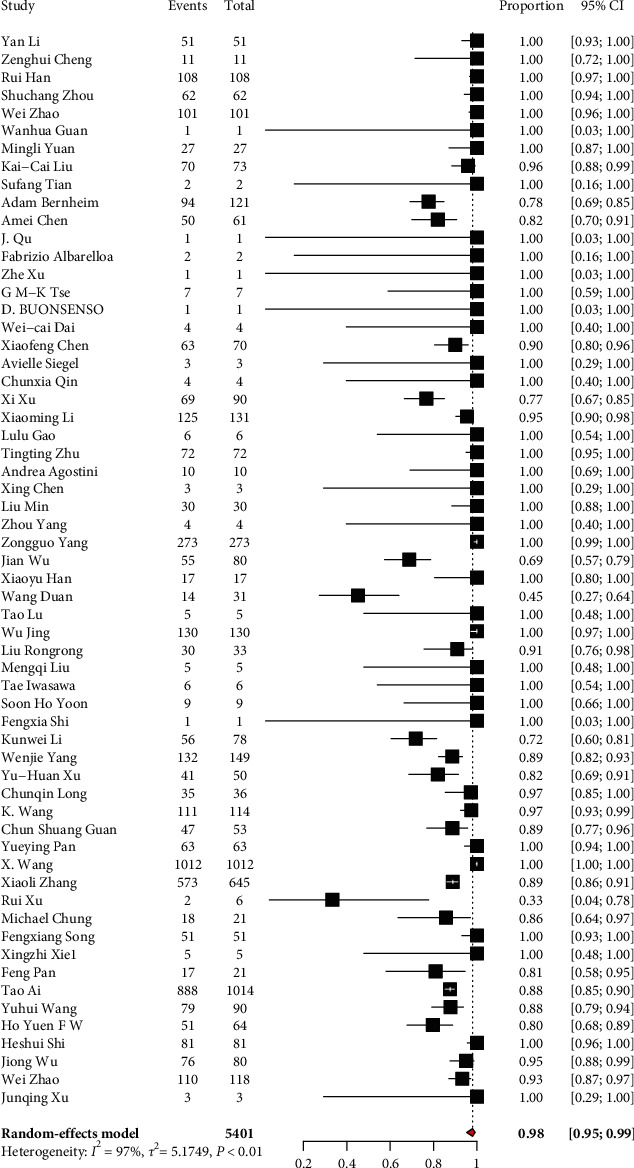
Magnitude of abnormal chest CT finding of patients with COVID-19.
Regarding the patterns of lung lesions in patients with COVID-19, ground-glass opacity (GGO) and mixed GGO with consolidations were observed in 2482 (65%) and 768 (18%) patients, respectively. Consolidation, which is defined as denser opacities and blurred margins of pulmonary blood vessels and bronchial tubes, was detected in 1259 (22%) patients with COVID-19 pneumonia. CT images also showed interlobular septal thickening in about 691 (27%) patients. CT showed that 11 (21.6%) patients had discrete pulmonary nodules. Crazy paving patterns of lesions were observed in 575 (12%) patients. Five hundred thirty-one (18%) patients had an air bronchogram sign. Pleural effusion and lymphadenopathy were observed in 94 (1.6%) and 21 (0.7%) patients with COVID-19 pneumonia, respectively. Pulmonary nodules were reported in 262 (9%) patients (Table 2).
Table 2.
CT imaging features of patients with COVID-19.
| CT findings | Number of studies | Number of patients (%) |
|---|---|---|
| Patterns of the lesion | ||
| Ground-glass opacity with consolidation | 60 | 768 (18%) |
| Ground-glass opacity | 60 | 2482 (65%) |
| Consolidation | 60 | 1259 (22%) |
| Crazy paving pattern | 24 | 575 (12%) |
| Reversed halo sign | 24 | 146 (1%) |
| Other signs in the lesion | ||
| Interlobular septal thickening | 23 | 691 (27%) |
| Air bronchogram sign | 23 | 531 (18%) |
| Distribution | ||
| Bilateral | 48 | 3952 (80%) |
| Unilateral | 48 | 641 (20%) |
| Right lung | 8 | 48 (62%) |
| Left lung | 8 | 29 (38%) |
| Number of lobes involved | ||
| One lobe | 13 | 278 (14%) |
| Two lobes | 13 | 299 (11%) |
| Three lobes | 13 | 250 (13%) |
| Four lobes | 13 | 212 (15%) |
| Five lobes | 14 | 384 (34%) |
| More than one lobe | 14 | 1145 (76%) |
| Lobe of lesion distribution | ||
| Left upper lobe | 14 | 731 (74%) |
| Left lower lobe | 20 | 504 (46%) |
| Right upper lobe | 19 | 455 (40%) |
| Right middle lobe | 15 | 326 (38%) |
| Right lower lobe | 17 | 784 (74%) |
| Other findings | ||
| Pleural effusion | 60 | 94 (1.6%) |
| Lymphadenopathy | 60 | 21 (0.7%) |
| Pulmonary nodules | 22 | 262 (9%) |
3.3. Additional Analysis
We also gathered data to demonstrate if there is a difference in the CT findings related to infection time course. In the included studies, the mean time between initial chest CT and follow-up was about 6.5 days (range, 0–21 days). According to the report of 9 included studies, 43% (95 CI: 26%–61%) patients have improved follow-up chest CT findings, while 30% (95 CI: 18%–46%) have advanced chest CT findings [40, 43, 44, 50, 52, 57, 64–66]. Our findings demonstrated pure ground-glass opacity in early disease, followed by the development of crazy paving, and finally increasing consolidation latter in the disease course. GGO density increased and transformed into consolidation; consolidation edges were flat or contracted; and fibrous cord shadow appeared. GGO with consolidation was higher in the advanced stage than in the early stage of the disease (OR 3.2, 95% CI: 2.2–4.7, P=0.013). A crazy paving pattern and a reverse halo sign were all rare in the early sign, but were present in the late stage of the disease. In terms of distribution of disease, bilateral involvements were prominent in the later stage than in the early stage (P < 0.001). According to the report of two included studies, pure GGO was the common imaging feature of mild and moderate stages of the disease course, while consolidation and GGO with consolidation increased by 64% and 79% in the critical stage of the disease, respectively [57, 58].
3.4. Heterogeneity and Risk of Bias
Subgroup analysis was conducted to justify the cause of heterogeneity. Subgroup analysis of the included studies showed that the possible cause of heterogeneity was sample size (P value < 0.01). Funnel plots did not suggest a publication bias for the majority of the parameters. We demonstrated no publication bias (P value = 0.1947).
4. Discussion
4.1. Summary of Evidence
In this review, we have demonstrated that the main signs and symptoms of hospital admission of patients with COVID-19 pneumonia were fever, dry cough, fatigue, pharyngeal pain, and respiratory distress. About 24% of the patients had reduced total leukocyte count and 43% had reduced lymphocyte count. Although the laboratory findings are not specific for viral pneumonia, leukopenia and lymphocytopenia may be helpful to distinguish COVID-19 from common bacterial infections. The majority of the patients had increased C-reactive protein.
In this study, common CT imaging features in patients with COVID-19 pneumonia included bilateral involvement, ground-glass opacities, consolidation, crazy paving pattern, air bronchogram signs, and intralobular septal thickening. At a later stage of the disease, mixed GGO with consolidation was the more frequent finding. Pulmonary consolidation was mainly found in the severe and progressive late stages of the disease, which can coexist with ground-glass and fibrotic changes. The pathological basis of these changes could be due to inflammatory cell infiltration and interstitial thickening, cell exudation, and hyaline membrane formation.
In the present study, the increased frequency of GGO, consolidation, bilateral disease, intralobular septal thickening, a crazy paving pattern of the lesion, and appearance of reverse halo sign lesions over more than one lobe of the lung could represent the pathophysiology of the disease process as it organizes and it could also probably explain chest CT hallmark of COVID-19 infection. CT imaging findings can be correlated with the severity of the disease and disease progression after efforts of treatment.
The majority of the patients (76%) had multilobar involvement, and lesions were more frequent in the right lung. Pleural effusion, lymphadenopathy, and pulmonary nodules were less common imaging findings in these patients. About 2% of the patients had normal initial CT findings. When a single lobe was involved, the right lung was most often affected and more than half of the patients with COVID-19 had multiple lobe infections. In the right lung, the lower lobe is frequently involved while the middle lobe was less frequent. In the left lung, the upper lobe was frequently involved. This might indicate the virus tends to disseminate all over all lobes of both lungs as the disease progress. Chest CT imaging features may avoid repeated laboratory testing and may be helpful in a resource-limited country.
According to the present study, chest CT imaging showed similar characteristics in the majority of patients, including predominantly bilateral and multilobe involvement. The pattern of ground-glass and consolidative pulmonary opacities, often with a bilateral lung distribution, is somewhat similar to that described in earlier coronavirus outbreaks such as SARS and MERS, which was known to cause ground-glass opacities that may coalesce into dense consolidative lesions [73, 74].
According to the report of 9 included studies, 43% (95 CI: 26%–61%) patients have improved follow-up chest CT findings, while 30% (95 CI: 18%–46%) have advanced chest CT findings. Our findings demonstrated pure ground-glass opacity in early disease, followed by the development of crazy paving and finally increasing consolidation latter in the disease course. According to the report of two included studies, pure GGO was the common imaging feature of mild and moderate stages of the disease course, while consolidation and GGO with consolidation increased by 64% and 79% in the critical stage of the disease, respectively.
4.2. Limitation
This systematic review and meta-analysis came up with CT imaging features of patients with COVID-19; we acknowledge a few limitations of the present systematic review and meta-analysis, which may affect the results. First of all, two relevant studies which were identified through our literature search were excluded due to unavailability for full-text review. The other limitation of the present study was that it was limited to articles published in English.
5. Conclusions
The present study showed that common CT imaging features of COVID-19 pneumonia included frequent involvement of bilateral lung infections, ground-glass opacities, consolidation, crazy paving pattern, air bronchogram signs, and intralobular septal thickening. Bilateral involvement was common while single lobe involvement was rare. This sign of CT imaging might be an important tool for diagnosis and monitoring disease progression in patients with COVID-19 infection.
Abbreviations
- ACE2:
Angiotensin-converting enzyme-2
- ARDS:
Acute respiratory distress
- CT:
Computed tomography imaging
- COVID-19:
Coronavirus disease 2019
- GGO:
Ground-glass opacity
- 2019-nCoV:
Novel coronavirus
- SAR CoV 2:
Severe acute respiratory syndrome coronavirus 2.
Conflicts of Interest
The authors declare that they have no conflicts of interest.
Authors' Contributions
E. A, K. D, A. A, E.G, and F. B designed the study, extracted, critically reviewed, and analyzed the data, and wrote the first draft of the manuscript and approved the manuscript.
References
- 1.Zhu N, Zhang D., Wang W. A novel coronavirus from patients with pneumonia in China, 2019. New England Journal of Medicine. 2020;382(8):727–733. doi: 10.1056/nejmoa2001017. [DOI] [PMC free article] [PubMed] [Google Scholar]
- 2.World Health Organization. Coronavirus Disease 2019 (COVID-19) Situation Report–39. Geneva, Switzerland: World Health Organization; 2020. https://www.who.int/docs/default-source/coronaviruse/situation-reports/20200228-sitrep-39-covid-19.pdf?sfvrsn=5bbf3e7d_2. [Google Scholar]
- 3.Wang W., Tang J., Wei F. Updated understanding of the outbreak of 2019 novel coronavirus (2019nCoV) in Wuhan, China. Journal of Medical Virology. 2020;92(4):441–447. doi: 10.1002/jmv.25689. [DOI] [PMC free article] [PubMed] [Google Scholar]
- 4.World Health Organization. Update on the Situation Regarding the New Coronavirus. Geneva, Switzerland: World Health Organization; 2020. [Google Scholar]
- 5.McIntosh K. Coronavirus Disease 2019 (COVID-19): Epidemiology, Virology, Clinical Features, Diagnosis, and Prevention. Riverwoods, IL, USA: Practice changing updates; 2020. [Google Scholar]
- 6.World Health Organization. Laboratory Testing for Coronavirus Disease 2019 (COVID-19) in Suspected Human Cases. Geneva, Switzerland: World Health Organization; 2020. [Google Scholar]
- 7.Jin Y. H., Cai L., Cheng Z. S. A rapid advice guideline for the diagnosis and treatment of 2019 novel coronavirus (2019-nCoV) infected pneumonia (standard version) Military Medical Research. 2020;7(4) doi: 10.1186/s40779-020-0233-6. [DOI] [PMC free article] [PubMed] [Google Scholar]
- 8.Xie X., Zhong Z., Zhao W., et al. Chest CT for typical 2019-nCoV pneumonia: relationship to negative RT-PCR testing. Radiology. 2020:p. 200343. doi: 10.1148/radiol.2020200343. In press, 2020. [DOI] [PMC free article] [PubMed] [Google Scholar]
- 9.Fang Y., Zhang H., Xie J. Sensitivity of chest CT for COVID-19: comparison to RT-PCR. Radiology. 2020 doi: 10.1148/radiol.2020200432. , In press, 2020. [DOI] [PMC free article] [PubMed] [Google Scholar]
- 10.Wu A., Peng Y., Huang B., et al. Genome composition and divergence of the novel coronavirus (2019-nCoV) originating in China. Cell Host & Microbe. 2020;27(3):325–328. doi: 10.1016/j.chom.2020.02.001. [DOI] [PMC free article] [PubMed] [Google Scholar]
- 11.Lan J., Ge J., Yu J., et al. Crystal structure of the 2019-nCoV spike receptor-binding domain bound with the ACE2 receptor. bioRxiv. 2020 doi: 10.1101/2020.02.19.956235. , In press, 2020. [DOI] [Google Scholar]
- 12.Xu X., Chen P., Wang J., et al. Evolution of the novel coronavirus from the ongoing Wuhan outbreak and modeling of its spike protein for risk of human transmission. Science China Life Sciences. 2020;63(3):457–460. doi: 10.1007/s11427-020-1637-5. [DOI] [PMC free article] [PubMed] [Google Scholar]
- 13.Shi H., Han X., Jiang N., et al. Radiological findings from 81 patients with COVID-19 pneumonia in Wuhan, China: a descriptive study. The Lancet Infectious Diseases. 2020;20(4):425–434. doi: 10.1016/s1473-3099(20)30086-4. [DOI] [PMC free article] [PubMed] [Google Scholar]
- 14.Pan F., Ye T., Sun P., et al. Time course of lung changes on chest CT during recovery from 2019 novel coronavirus (COVID-19) pneumonia. Radiology. 2020;295(3):715–721. doi: 10.1148/radiol.2020200370. [DOI] [PMC free article] [PubMed] [Google Scholar]
- 15.Corman V. M., Landt O., Kaiser M., et al. Detection of 2019 novel coronavirus (2019-nCoV) by real-time RT-PCR. Euro Surveillance. 2020;25(3) doi: 10.2807/1560-7917.es.2020.25.3.2000045. [DOI] [PMC free article] [PubMed] [Google Scholar]
- 16.Armstrong R., Waters E., Jackson N., et al. Guidelines for Systematic Reviews of Health Promotion and Public Health Interventions: Version 2. Melbourne, Australia: Melbourne University Australia; 2007. [Google Scholar]
- 17.Thompson S. G., Sharp S. J. Explaining heterogeneity in meta-analysis: a comparison of methods. Statistics in Medicine. 1999;18(20):2693–2708. doi: 10.1002/(sici)1097-0258(19991030)18:20<2693::aid-sim235>3.0.co;2-v. [DOI] [PubMed] [Google Scholar]
- 18.Cochran W. G. The comparison of percentages in matched samples. Biometrika. 1950;37(3-4):256–266. doi: 10.1093/biomet/37.3-4.256. [DOI] [PubMed] [Google Scholar]
- 19.Egger M., Smith G. D., Schneider M., Minder C. Bias in meta-analysis detected by a simple, graphical test. British Medical Journal. 1997;315(7109):629–634. doi: 10.1136/bmj.315.7109.629. [DOI] [PMC free article] [PubMed] [Google Scholar]
- 20.Bernheim A., Mei X., Huang M., et al. Chest CT findings in coronavirus disease-19 (COVID-19): relationship to duration of infection. Radiology. 2020;295(3):p. 200463. doi: 10.1148/radiol.2020200463. [DOI] [PMC free article] [PubMed] [Google Scholar]
- 21.Ai T., Yang Z., Hou H., et al. Correlation of Chest CT and RT-PCR testing in coronavirus disease 2019 (COVID-19) in China: a report of 1014 cases. Radiology. 2020;20:p. 200642. doi: 10.1148/radiol.2020200642. [DOI] [PMC free article] [PubMed] [Google Scholar]
- 22.Chen A., Huang J., Liao Y., et al. Differences in clinical and imaging presentation of pediatric patients with COVID-19 in comparison with adults. Cadiology: Cardiothoracic Imaging. 2020;2(2) doi: 10.1148/ryct.2020200117.e200117 [DOI] [PMC free article] [PubMed] [Google Scholar]
- 23.Agostini A., Floridi C., Borgheresi A., et al. Proposal of a low-dose, long-pitch, dual-source chest CT protocol on third-generation dual-source CT using a tin filter for spectral shaping at 100 kVp for coronavirus disease 2019 (COVID-19) patients: a feasibility study. La Radiologia Medica. 2020;125(4):365–373. doi: 10.1007/s11547-020-01179-x. [DOI] [PMC free article] [PubMed] [Google Scholar]
- 24.Siegel A., Chang P. J., Jarou Z. J., et al. Lung base findings of coronavirus disease (COVID-19) on abdominal CT in patients with predominant gastrointestinal symptoms. American Journal of Roentgenology. 2020;215:1–3. doi: 10.2214/ajr.20.23232. [DOI] [PubMed] [Google Scholar]
- 25.Cheng1 Z., Lu Y., Cao Q., et al. Clinical features and chest CT manifestations of coronavirus disease 2019 (COVID-19) in a single-center study in Shanghai, China. American Journal of Roentgenology. 2020;215(1):121–126. doi: 10.2214/ajr.20.22959. [DOI] [PubMed] [Google Scholar]
- 26.Guan C. S., Lv Z. B., Yan S., et al. Imaging features of coronavirus disease 2019 (COVID-19): evaluation on thin-section CT. Academic Radiology. 2020;27(5):609–613. doi: 10.1016/j.acra.2020.03.002. [DOI] [PMC free article] [PubMed] [Google Scholar]
- 27.Longb C., Xuc H., Shend Q., et al. Diagnosis of the coronavirus disease (COVID-19): rRT-PCR or CT? European Journal of Radiology. 2020;126:p. 108961. doi: 10.1016/j.ejrad.2020.108961. [DOI] [PMC free article] [PubMed] [Google Scholar]
- 28.Qin C., Liu F., Yen T.-C., Lan X. 18F-FDG PET/CT findings of COVID-19: a series of four highly suspected cases. European Journal of Nuclear Medicine and Molecular Imaging. 2020;47(5):1281–1286. doi: 10.1007/s00259-020-04734-w. [DOI] [PMC free article] [PubMed] [Google Scholar]
- 29.Buonsenso D., Piano A., Raffaelli F., Bonadia N, de Gaetano Donati K., Franceschi F. Point-of-Care Lung Ultrasound findings in novel coronavirus disease-19 pnemoniae: a case report and potential applications during COVID-19 outbreak. European Review for Medical and Pharmacological Sciences. 2020;24(5):2776–2780. doi: 10.26355/eurrev_202003_20549. [DOI] [PubMed] [Google Scholar]
- 30.Albarelloa F., Pianuraa E., Stefanoa F. D., et al. 2019-novel coronavirus severe adult respiratory distress syndrome in two cases in Italy: an uncommon radiological presentation. International Journal of Infectious Diseases. 2020;93:192–197. doi: 10.1016/j.ijid.2020.02.043. [DOI] [PMC free article] [PubMed] [Google Scholar]
- 31.Shi F., Yu Q., Huang W., Tan C. 2019 novel coronavirus (COVID-19) pneumonia with hemoptysis as the initial symptom: CT and clinical features. Korean Journal of Radiology. 2020;21(5):537–540. doi: 10.3348/kjr.2020.0181. [DOI] [PMC free article] [PubMed] [Google Scholar]
- 32.Song F., Shi N., Shan F., et al. Emerging 2019 novel coronavirus (2019-nCoV) pneumonia. Radiology. 2020;295(1):210–217. doi: 10.1148/radiol.2020200274. [DOI] [PMC free article] [PubMed] [Google Scholar]
- 33.Gao L., Zhang J. Pulmonary high-resolution computed tomography (HRCT) findings of patients with early-stage coronavirus disease 2019 (COVID-19) in Hangzhou, China. Medical Science Monitor. 2020;26 doi: 10.12659/msm.923885.e923885 [DOI] [PMC free article] [PubMed] [Google Scholar]
- 34.Wong H. Y. F., Lam H. Y. S., Ho-Tung Fong A., et al. Frequency and distribution of chest radiographic findings in COVID-19 positive patients. Radiology. 2020:p. 201160. doi: 10.1148/radiol.2020201160. In press, 2020. [DOI] [PMC free article] [PubMed] [Google Scholar]
- 35.Qu J., Yang R., Song L., Kamel I. R. Atypical lung feature on chest CT in a lung adenocarcinoma cancer patient infected with COVID-19. Annals of Oncology. 2020;31(6):825–826. doi: 10.1016/j.annonc.2020.03.001. [DOI] [PMC free article] [PubMed] [Google Scholar]
- 36.Wu J., Liu J., Zhao X., et al. Clinical characteristics of imported cases of COVID-19 in Jiangsu province: a multicenter descriptive study. Infectious Diseases Society of America. 2020;20 doi: 10.1093/cid/ciaa199. [DOI] [PMC free article] [PubMed] [Google Scholar]
- 37.Wu J., Wu X., Zeng W., et al. Chest CT findings in patients with coronavirus disease 2019 and its relationship with clinical features. Investigative Radiology. 2020;55(5) doi: 10.1097/rli.0000000000000670. [DOI] [PMC free article] [PubMed] [Google Scholar]
- 38.Xu J., Wu R., Huang H., et al. Computed tomographic imaging of 3 patients with coronavirus disease 2019 pneumonia with negative virus real-time reverse-transcription polymerase chain reaction test. Clinical Infectious Diseases. 2020;20 doi: 10.1093/cid/ciaa207. [DOI] [PMC free article] [PubMed] [Google Scholar]
- 39.Wang K., Kang S., Tian R., Zhang X., Zhang X., Wang Y. Imaging manifestations and diagnostic value of chest CT of coronavirus disease 2019 (COVID-19) in the Xiaogan area. Clinical Radiology. 2020;75(5):341–347. doi: 10.1016/j.crad.2020.03.004. [DOI] [PMC free article] [PubMed] [Google Scholar]
- 40.Liu K.-C., Xu P., Lv W.-F., Yao J.-L., Gu J.-F., Wei W. CT manifestations of coronavirus disease-2019: a retrospective analysis of 73 cases by disease severity. European Journal of Radiology. 2020;126:p. 108941. doi: 10.1016/j.ejrad.2020.108941. [DOI] [PMC free article] [PubMed] [Google Scholar]
- 41.Li K., Fang Y., Li W., et al. CT image visual quantitative evaluation and clinical classification of coronavirus disease (COVID-19) European Radiology. 2020;30 doi: 10.1007/s00330-020-06817-6. [DOI] [PMC free article] [PubMed] [Google Scholar]
- 42.Liu M., He P., Liu H., et al. Analysis of clinical characteristics of 30 new coronavirus pneumonia in medical staff. Chinese Journal of Tuberculosis and Respiratory Diseases. 2020;43(3):209–214. doi: 10.3760/cma.j.issn.1001-0939.2020.03.014. [DOI] [PubMed] [Google Scholar]
- 43.Liu M., Song Z., Xiao K. High-resolution computed tomography manifestations of 5 pediatric patients with 2019 novel coronavirus. Journal of Computer Assisted Tomography. 2020;44(3):311–313. doi: 10.1097/rct.0000000000001023. [DOI] [PMC free article] [PubMed] [Google Scholar]
- 44.Chung M., Bernheim A., Mei X., et al. CT imaging features of 2019 novel coronavirus (2019-nCoV) Radiology. 2020;295(1):202–207. doi: 10.1148/radiol.2020200230. [DOI] [PMC free article] [PubMed] [Google Scholar]
- 45.Yuan M., Wen Y., Tao Z., Tan W., Hu Y. Association of radiologic findings with mortality of patients infected with 2019 novel coronavirus in Wuhan, China. PLoS One. 2020;15(3) doi: 10.1371/journal.pone.0230548.e0230548 [DOI] [PMC free article] [PubMed] [Google Scholar]
- 46.Rongrong L., Yi Z., Minyu W., et al. CT imaging analysis of lungs in 33 patients with new coronavirus infection. Chinese Medical Journal. 2020;100(13) [Google Scholar]
- 47.Rui H., Lu H., Hong J., Dong J., Peng H., Zhang D. Early clinical and CT manifestations of coronavirus disease 2019 (COVID-19) pneumonia. American Journal of Roentgenology. 2020 doi: 10.2214/ajr.20.22961. In press. [DOI] [PubMed] [Google Scholar]
- 48.Zhou S., Wang Y., Zhu T., Xia L. CT features of coronavirus disease 2019 (COVID-19) pneumonia in 62 patients in Wuhan, China. American Journal of Roentgenology. 2020;214:1287–1294. doi: 10.2214/ajr.20.22975. [DOI] [PubMed] [Google Scholar]
- 49.Yoon S. H., Lee K. H., Kim J. Y., et al. Chest radiographic and CT findings of the 2019 novel coronavirus disease (COVID-19): analysis of nine patients treated in Korea. Korean Journal of Radiology. 2020;21(4):494–500. doi: 10.3348/kjr.2020.0132. [DOI] [PMC free article] [PubMed] [Google Scholar]
- 50.Tian S., Hu W., Niu L., Liu H., Xu H., Xiao S.-Y. Pulmonary pathology of early-phase 2019 novel coronavirus (COVID-19) pneumonia in two patients with lung cancer. Journal of Thoracic Oncology. 2020;15(5):700–704. doi: 10.1016/j.jtho.2020.02.010. [DOI] [PMC free article] [PubMed] [Google Scholar]
- 51.Tae I., Sato M., Yamaya T., et al. Ultra high resolution computed tomography can demonstrate alveolar collapse in novel coronavirus (COVID-19) pneumonia. Japanese Journal of Radiology. 2020;38(5):394–398. doi: 10.1007/s11604-020-00956-y. [DOI] [PMC free article] [PubMed] [Google Scholar]
- 52.Lu T., Pu H. Computed tomography manifestations of 5 cases of the novel coronavirus disease 2019 (COVID-19) pneumonia from patients outside Wuhan. Journal of Thoracic Imaging. 2020;35(3):90–93. doi: 10.1097/rti.0000000000000508. [DOI] [PMC free article] [PubMed] [Google Scholar]
- 53.Zhu T., Wang Y., Zhou S., Zhang N., Xia L. A comparative study of chest computed tomography features in young and older adults with corona virus disease (COVID-19) Journal of Thoracic Imaging. 2020;35(4):97–101. doi: 10.1097/rti.0000000000000513. [DOI] [PMC free article] [PubMed] [Google Scholar]
- 54.Wang D., Ju X., Xie F., et al. Clinical analysis of 31 cases of 2019 new coronavirus infection in children from six provinces (autonomous regions) in Northern China. Chinese Journal of Pediatrics. 2020;58 doi: 10.3760/cma.j.cn112140-20200225-00138. [DOI] [PubMed] [Google Scholar]
- 55.Guan W., Liu J., Yu C. CT findings of coronavirus disease (COVID-19) severe pneumonia. American Journal of Roentgenology. 2020;214(5):85–86. doi: 10.2214/ajr.20.23035. [DOI] [PubMed] [Google Scholar]
- 56.Xia W., Shao J., Guo Y., Peng X., Li Z., Hu D. Clinical and CT features in pediatric patients with COVID-19 infection: different points from adults. Pediatric Pulmonology. 2020;55(5):1169–1174. doi: 10.1002/ppul.24718. [DOI] [PMC free article] [PubMed] [Google Scholar]
- 57.Zhao W., Zheng Z., Xie X., Yu Q., Liu J. Relation between chest CT findings and clinical conditions of coronavirus disease (COVID-19) pneumonia: a multicenter study. American Journal of Roentgenology. 2020;214(5):1072–1077. doi: 10.2214/ajr.20.22976. [DOI] [PubMed] [Google Scholar]
- 58.Dai W.-C., Zhang H.-W., Yu J., et al. CT imaging and differential diagnosis of COVID-19. Canadian Association of Radiologists’ Journal. 2020;71(2):195–200. doi: 10.1177/0846537120913033. [DOI] [PMC free article] [PubMed] [Google Scholar]
- 59.Yang W., Cao Q., Qin L., et al. Clinical characteristics and imaging manifestations of the 2019 novel coronavirus disease (COVID-19): a multi-center study in Wenzhou city, Zhejiang, China. Journal of Infection. 2020;80(4):388–393. doi: 10.1016/j.jinf.2020.02.016. [DOI] [PMC free article] [PubMed] [Google Scholar]
- 60.Wu J., Cailian F., Xian X., et al. CT distribution characteristics and signs of 130 cases of novel coronavirus pneumonia. Chinese Journal of Tuberculosis and Respiratory Diseases. 2020;43 doi: 10.3760/cma.j.cn112147-20200217-00106. [DOI] [PubMed] [Google Scholar]
- 61.Wang X., Fang Y. J., Zhu Y, et al. Clinical characteristics of non-critically ill patients with novel coronavirus infection (COVID-19) in a Fangcang Hospital. Clinical Microbiology and Infection. 2020 doi: 10.1016/j.cmi.2020.03.032. In press. [DOI] [PMC free article] [PubMed] [Google Scholar]
- 62.Chen X., Tang Y., Mo Y., et al. A diagnostic model for coronavirus disease 2019 (COVID-19) based on radiological semantic and clinical features: a multi-center study. European Radiology. 2020 doi: 10.1007/s00330-020-06829-2. In press. [DOI] [PMC free article] [PubMed] [Google Scholar]
- 63.Zhang X., Cai H., Hu J., et al. Epidemiological, clinical characteristics of cases of SARS-CoV-2 infection with abnormal imaging findings. International Journal of Infectious Diseases. 2020;94:81–87. doi: 10.1016/j.ijid.2020.03.040. [DOI] [PMC free article] [PubMed] [Google Scholar]
- 64.Li X., Zeng W., Li X., et al. CT imaging changes of corona virus disease 2019(COVID-19): a multi-center study in Southwest China. Journal of Translational Medicine. 2020;18(1):p. 154. doi: 10.1186/s12967-020-02324-w. [DOI] [PMC free article] [PubMed] [Google Scholar]
- 65.Han X., Cao Y., Jiang N., et al. Novel coronavirus pneumonia (COVID-19) progression course in 17 discharged patients: comparison of clinical and thin-Section CT features during recovery. Infectious Diseases Society of America. 2020 doi: 10.1093/cid/ciaa271. In press. [DOI] [PMC free article] [PubMed] [Google Scholar]
- 66.Chen X., Liu S., Zhang C., et al. Dynamic chest CT evaluation in three cases of 2019 novel coronavirus pneumonia. Archives of Iranian Medicine. 2020;23(4):277–280. doi: 10.34172/aim.2020.11. [DOI] [PubMed] [Google Scholar]
- 67.Li Y., Xia L. Coronavirus disease 2019 (COVID-19): role of chest CT in diagnosis and management. American Journal of Roentgenology. 2020;214(6):1280–1286. doi: 10.2214/ajr.20.22954. [DOI] [PubMed] [Google Scholar]
- 68.Pan Y., Guan H., Zhou S., et al. Initial CT findings and temporal changes in patients with the novel coronavirus pneumonia (2019-nCoV): a study of 63 patients in Wuhan, China. European Radiology. 2020;30(6):3306–3309. doi: 10.1007/s00330-020-06731-x. [DOI] [PMC free article] [PubMed] [Google Scholar]
- 69.Xu Y.-H., Dong J.-H., An W.-M., et al. Clinical and computed tomographic imaging features of novel coronavirus pneumonia caused by SARS-CoV-2. Journal of Infection. 2020;80(4):394–400. doi: 10.1016/j.jinf.2020.02.017. [DOI] [PMC free article] [PubMed] [Google Scholar]
- 70.Wang Y., Dong C., Hu Y., et al. Temporal changes of CT findings in 90 patients with COVID-19 pneumonia: a longitudinal study. Radiology. 2020:p. 200843. doi: 10.1148/radiol.2020200843. , 2020, In press. [DOI] [PMC free article] [PubMed] [Google Scholar]
- 71.Zhou Y., Yang L., Han M., et al. Case report on early diagnosis of COVID-19. Disaster Medicine and Public Health Preparedness. 2020:1–4. doi: 10.1017/dmp.2020.66. , 2020, In press. [DOI] [PMC free article] [PubMed] [Google Scholar]
- 72.Yang Z., Jia S, Zhang H., et al. Predictors for imaging progression on chest CT from coronavirus disease 2019 (COVID-19) patients. Aging. 2020;12(7) doi: 10.18632/aging.102999. [DOI] [PMC free article] [PubMed] [Google Scholar]
- 73.Ding Y., Wang H., Shen H., et al. The clinical pathology of severe acute respiratory syndrome (SARS): a report from China. The Journal of Pathology. 2003;200(3):282–289. doi: 10.1002/path.1440. [DOI] [PMC free article] [PubMed] [Google Scholar]
- 74.Ng D. L., Al Hosani F., Keating M. K., et al. Clinicopathologic, immunohistochemical, and ultrastructural findings of a fatal case of middle east respiratory syndrome coronavirus infection in the United Arab Emirates, April 2014. The American Journal of Pathology. 2016;186(3):652–658. doi: 10.1016/j.ajpath.2015.10.024. [DOI] [PMC free article] [PubMed] [Google Scholar]