

Abstract
Introduction:
Evidence suggests individuals with a history of adverse childhood experiences have higher odds of developing kidney disease versus individuals with no adverse childhood experiences. However, no study has examined the influence of coexisting adverse childhood experiences and kidney disease on mortality risk. This study uses a longitudinal survey of adults to examine the influence of coexisting adverse childhood experiences and decreased renal function on all-cause mortality in a sample of U.S. adults.
Methods:
A total of 1,205 adults participating in the Midlife Development in the United States series between 1995 and 2014 were used for this analysis, performed in 2019. Six types of adverse childhood experiences were available in the data set, which were combined to create a dichotomous variable with any adverse experience counted as “yes.” Decreased renal function was defined as estimated glomerular filtration rate <60 mL/minute/1.73 m2. Main outcome was all-cause mortality. Cox proportional hazards models were performed to examine four combinations of adverse childhood experiences and decreased renal function associated with overall survival (neither, adverse childhood experiences only, decreased renal function only, or both) controlling for covariables.
Results:
In fully adjusted models, adverse childhood experiences and decreased renal function were associated with increased all-cause mortality relative to neither (hazard ratio=2.85, 95% CI=1.30, 6.25). Decreased renal function only and adverse childhood experiences only were not significantly associated with all-cause mortality (hazard ratio=1.14, 95% CI=0.64, 2.04 and HR=1.55, 95% CI=0.44, 5.41, respectively). When using decreased renal function as the reference group, coexisting adverse childhood experiences and decreased renal function was associated with 64% increased risk of all-cause mortality, though this relationship was not statistically significant.
Conclusions:
Coexistence of adverse childhood experiences and decreased renal function is associated with higher all-cause mortality compared with individuals with neither adverse childhood experiences nor decreased renal function and may be associated with higher all-cause mortality compared with decreased renal function alone. Future research is needed to better understand this potential association.
INTRODUCTION
Chronic kidney disease (CKD), defined as abnormal kidney function present for more than 3 months, affects 37 million U.S. adults.1,2 CKD, one of the leading causes of death in the U.S. and worldwide, is commonly caused by diabetes and hypertension.2,3 Management of CKD is complex and challenging as it is often focused on managing concordant comorbid diseases such as diabetes and hypertension to prevent complications, progression of disease, and mortality. Though risk factors for CKD include diabetes, hypertension, and heart disease, there is increasing evidence supporting the role of social determinants of health on CKD risk and outcomes.4,5
Social determinants of health are “conditions in which people are born, grow, live, work and age,” which include socioeconomic factors, psychosocial factors, neighborhood and built environment, political, economic and cultural factors.6,7 Social determinants of health exert an influence on adult health through both distal and proximal factors and are particularly salient for understanding chronic disease burden from a lifecourse perspective.8 Evidence suggests that social determinants of health have a unique interplay with biological factors that may predispose individuals to have worse health outcomes,9,10 including diabetes outcomes,11 hypertension,12 and kidney disease.4,5 For example, adverse childhood experiences (ACEs) are social determinants of health that have been shown to confer risk for adult morbidity and early mortality.7,13,14–19 The relationship between ACEs and mortality is thought to be related to exposure to adverse events during a sensitive developmental period lending to a toxic stress response.13,20 This ensuing toxic stress response is central to chronic disease development21,22 and psychological distress such as self-harm23 and health risk behaviors,14 ultimately increasing risk for early mortality.24
As they occur prior to age 18 years and can be direct (sexual, physical, or verbal abuse and neglect) or indirect (household dysfunction such as substance abuse, incarcerated relative, mental illness, mother treated violently, and household challenges such as family instability and financial strain), ACEs are considered distal influences on adult health.20,25 ACEs, though occurring during childhood, can have detrimental effects on adult health.13,14,16,21 The literature is well established on the association between ACEs and a number of the leading causes of death in the U.S., namely diabetes, hypertension, chronic respiratory disorders, stroke, kidney disease, and heart disease.13,14,16,21 In addition to being associated with the leading causes of death, recent evidence shows that individuals who have a history of ACEs and are living with a chronic disease in adulthood, such as diabetes, may have a greater mortality risk compared with individuals who do not experience ACEs and do not have a chronic disease.19 For example, a recent study examining the effect of cooccurring ACEs and diabetes on mortality found that during a 20-year follow-up period, individuals reporting a history of ACEs, who also had a diagnosis of diabetes, had a twofold increased risk of early mortality compared with individuals who did not have a history of ACEs and had diabetes.19 As diabetes is one of the leading causes of CKD, understanding whether ACEs confer similar mortality risk among individuals with CKD is greatly needed.
Overall, the relationship between ACEs and CKD is a widely understudied area.15 Although evidence suggests that prevalence, as well as risk of kidney disease are higher among those who experience ACEs,13,26 no study has examined the influence of coexisting ACEs and CKD on mortality risk in individuals with kidney disease.15 Therefore, the aim of this study is to examine the influence of coexisting ACEs and decreased renal function (DRF) on all-cause mortality in a nationally representative sample. The first hypothesis is that the coexistence of ACEs and DRF is associated with increased risk of all-cause mortality compared with individuals with neither condition after adjusting for relevant confounders. In addition, the secondary hypothesis is that the coexistence of ACEs and DRF is associated with an increased risk of mortality compared with individuals with only DRF.
METHODS
Study Population
Data from the national survey of Midlife Development in the United States (MIDUS) was used for this study.27 The collective aim of MIDUS is to investigate the role of behavioral, psychological, and social factors in age-related variations in health and well-being in a national sample of U.S. adults. Based on the success of MIDUS 1 (1995–1996), the National Institute on Aging awarded a grant to the Institute on Aging at the University of Wisconsin-Madison in 2002–2006 to carry out a longitudinal follow-up of MIDUS 1 respondents. The objectives of this research were to repeat the comprehensive assessments obtained in all of the original content areas, plus launch new areas of biological and neurological assessment. The study was extended for a third round of funding (2011–2016), with the objective of expanding the MIDUS sample. All three waves of the longitudinal MIDUS study were used for this study as different variables were collected in each wave. Only those with serum creatinine data collected during Wave 2 comprehensive biomarker assessment project were included in the cohort as determination of whether an individual had decreased estimated glomerular filtration rate (eGFR). ACE variables were collected in Waves 1 and 2, and mortality was collected in Wave 3. The data analysis took place in 2019 and the data are publicly available through the Inter-university Consortium for Political and Social Research. Fifty participants without complete ACE information were excluded. The final cohort for this study was 1,205 (Appendix Figure 1).
Measures
The ACEs Study Questionnaire21 was used to identify measures of adverse events experienced during childhood. The MIDUS study collected information on a number of possible ACEs included in the Felitti et al.21 definition of ACEs, as well as additional questions available in MIDUS to examine family instability and financial strain found in the extant literature using MIDUS to examine ACEs.28–30 Therefore, a combined set of ACEs categories was created, which included: emotional abuse, physical abuse, sexual abuse, substance abuse by parents during childhood, family instability, and financial strain. Self-reported questions used to create individual ACEs categories are shown in Table 1. Each type of ACE was then dichotomized to indicate exposure. A final dichotomized ACEs variable was created to indicate “yes” if an individual responded positively to any of the six categories, and “no” if they responded negatively to all six categories.
Table 1.
Adverse Childhood Experiences Measures
| ACEs category | Values | Definition |
|---|---|---|
| Emotional abuse | 26.6% | Wave 1/AA Childhood family background questions: your childhood how often did your mother, father, brothers, sisters, or anyone else insulted you or swore at you; sulked or refused to talk to you; stomped out of the room; did or said something to spite you; threatened to hit you; smashed or kicked something in anger. |
| Wave 2 Biomarker project CTQ: family called me names; thought parents wished I had never been born; felt family member hated me; family said hurtful or insulting things to me; believe I was emotionally abused | ||
| Physical abuse | 22.2% | Wave 1/AA Childhood family background questions: during your childhood how often did your mother, father, brothers, sisters, or anyone else pushed, grabbed, or shoved you; slapped you; threw something at you; kicked, hit, or hit you with a fist; hit or tried to hit you with something; beat you up |
| Wave 2 Biomarker project CTQ: family hit hard, I had to see doctor; family hit hard, left with bruises or marks; punished with belt or hard object; believe I was physically abused; hit so hard, people noticed | ||
| Wave 2/AA SAQ: Ever physically assaulted before age 18 | ||
| Sexual abuse | 17.8% | Wave 2 Biomarker project CTQ: Someone tried to touch me sexually; Other threaten harm if no sexual acts; Other tried to force do/watch sexual; Someone molested me; Believe I was sexually abused |
| Wave 2/AA SAQ: Ever sexually assaulted before age of 18 | ||
| Parental substance abuse | 26.1% | Wave 1/AA Childhood background questions: What was the main reason father/mother was not working for pay during most of your childhood years? – Alcohol or drug abuse |
| Wave 2 Biomarker project CTQ: My parents were too drunk or high to take care of me | ||
| Wave 2/AA Phone interview: Lived with alcoholic during childhood | ||
| Wave 2/AA SAQ: Ever parent drank caused problems; Ever parent drugs caused problems | ||
| Family instability | 26.5% | Wave 1/AA Childhood background questions: Why didn’t live with biological parents, the reason “separated/divorced, death of a parent, adopted or other? |
| Wave 1/AA Childhood background questions: Who was the male head of your household for most of your childhood? With answer no male in household | ||
| Wave 2/AA SAQ: Did you live with both of your biological parents up till you were 18? | ||
| Financial strain | 35.8% | Wave 1/AA Childhood background questions: Receipt of welfare; less than a high school education for father (or mother if no male head) |
| Wave 1/AA Childhood family background questions: was your family better off or worse off financially than the average family was at that time, report of being somewhat or a lot ‘worse off’ than other families. |
AA, Milwaukee African American Sample; SAQ, Self-Administered Questionnaire; CTQ, Childhood Trauma Questionnaire; ACEs, adverse childhood experiences.
In this study, DRF was defined as estimated eGFR <60 mL/minute/1.73 m2 and was calculated using the CKD Epidemiology Collaboration,31 the recommended formulae per the Kidney Disease Improving Global Outcomes guidelines. Serum creatinine was used to calculate eGFR, a one-time collection in the biomarker project. The biomarker project did not collect urine albumin, as such urine albumin to creatinine ratio was not calculated.
Demographic variables included sex, age (dichotomized as 35–59 years and 60–86 years based on the mean age), and race (dichotomized as white and ethnic minority). Comorbidity was based on self-reported medical conditions collected during the Biomarker project. Participants were asked the following questions: Have you ever had any of the following conditions/illness? and If yes, was it diagnosed by a physician? To conserve power in the model, comorbidities could not be added individually. Instead, comorbidity burden was investigated based on a count of six self-reported clinically relevant comorbidities in the data set: hypertension, diabetes, cardiovascular disease, cancer, cholesterol problems, and depression. Based on the importance of specific comorbidities, high blood pressure and diabetes, these conditions were included as individual comorbidities in the fully adjusted model.
Mortality status was based on data collected at the time of Wave 3. The mortality status was collected from three general source categories: (1) tracing conducted by University of Wisconsin Survey Center before, during, and after fielding; (2) formal National Death Index searches; and (3) longitudinal sample maintenance.32 As the data set did not include cause of death, the outcome of interest for this study was all-cause mortality. All participants were followed from the date biomarker data was collected until death or end of follow-up date (May 2015, the latest death date available in the mortality data). Mortality data included known month and year of death; the middle of the month (15th) was used as the day to construct the date. The average follow-up time was 8.3 (SD=1.6) years.
Statistical Analysis
The primary independent variable was based on ACEs and DRF definitions to define four sample population groups: (1) no ACEs no DRF, (2) ACEs only, (3) DRF only, (4) ACEs and DRF. Baseline information was compared among these four groups using chi-square tests for categorical and ANOVAs for continuous variables.
A univariate Cox proportional hazard model was first developed to examine whether the four combinations based on ACEs and DRF coexistence was associated with overall survival. Unadjusted survival curves were then plotted from the univariate cox model with no ACEs/no DRF as the reference category. Secondly, multivariable Cox proportional hazard models were constructed by first adjusting for demographic variables including age, sex, and race; then by adjusting for demographic variables and comorbidities. Finally, unadjusted and adjusted Cox proportional hazard models were run with DRF as the reference category.
Risk-adjusted survival curves were plotted from the fitted Cox model using the corrected group prognosis method. In the corrected group prognosis method, survival curves were first calculated for each of the unique combinations of covariates using the fitted Cox model,33 the average survival was then calculated with weights proportional to the number of individuals at each covariate level.
Results were considered significant for p<0.05. All analyses were performed with SAS, version 9.4.
RESULTS
The longitudinal sample included 1,205 adults, aged 35–86 years. Table 2 provides sample baseline demographics. The cohort’s median age was 57 (IQR, 49–65) years, of which 57% were female, and 79% white. Overall, 71% reported having ACEs and approximately 7% had DRF. The mean eGFR of the cohort was 87.6 mL/minute/1.73 m2. Twenty-seven percent of this cohort who reported no history of ACEs did not have DRF (“no ACEs no DRF”), 66% of the cohort reported only having a history of ACEs (“ACEs only”), 2% of the cohort had DRF without a history of ACEs (“DRF only”), and 5% of the cohort who reported a history of ACEs also had DRF (“ACEs and DRF”).
Table 2.
MIDUS Biomarker Cohort Description
| Variables | All (n=1,205) | No ACEs No DRF (n=327) | ACEs only (n=799) | DRF only (n=22) | ACEs and DRF (n=57) |
|---|---|---|---|---|---|
| Sex | |||||
| Male | 43.2 | 48.6 | 41.2 | 50.0 | 38.6 |
| Female | 56.8 | 51.4 | 58.8 | 50.0 | 61.4 |
| Age, years | |||||
| 35–59 | 57.6 | 60.9 | 60.6 | 4.5 | 17.5 |
| 60–86 | 42.4 | 39.1 | 39.4 | 95.5 | 82.5 |
| Race | |||||
| White | 79.3 | 90.8 | 75.2 | 77.3 | 73.2 |
| Minority | 20.6 | 9.2 | 24.8 | 22.7 | 26.8 |
| Comorbidities, % (95% CI) | |||||
| Hypertension | 36.6 (33.9, 39.3) | 27.6 (22.8, 32.5) | 37.2 (33.9, 40.6) | 63.6 (43.5, 83.7) | 69.6 (57.6, 81.7) |
| Diabetes | 12.1 (10.3, 14.0) | 9.8 (6.6, 13.0) | 12.1 (9.9, 14.1) | 28.6 (9.2, 47.9) | 19.3 (9.1, 29.5) |
| Cardiovascular disease | 24.5 (22.1, 26.9) | 22.6 (18.1, 27.2) | 23.2 (20.2, 26.1) | 40.9 (20.4, 61.5) | 47.4 (34.4, 60.3) |
| Cancer | 13.9 (11.9, 15.8) | 11.6 (8.1, 15.1) | 13.7 (11.3, 16.0) | 27.2 (8.7, 45.9) | 24.6 (13.4, 35.7) |
| Cholesterol problems | 42.8 (39.9, 45.6) | 36.3 (31.1, 41.5) | 43.9 (40.4, 47.3) | 59.1 (38.5, 79.6) | 58.2 (45.1, 71.2) |
| Depression | 19.8 (17.5, 22.0) | 12.6 (9.0, 16.2) | 22.4 (19.5, 25.3) | 4.6 (0.0, 13.2) | 29.8 (17.9, 41.7) |
| Comorbidity burden | |||||
| Mean ± SD (min–max) | 1±1 (0–6) | 1±1 (0–5) | 2±1 (0–6) | 2±1 (0–5) | 2±1 (0–6) |
| 0–1 | 55.1 | 66.4 | 53.4 | 36.4 | 21.1 |
| 2+ | 44.9 | 33.6 | 46.6 | 63.6 | 78.9 |
| Mean eGFR in ml/min/1.73m2 (SD) | 87.6 (18.2) | 88.5 (14.1) | 91.1 (15.6) | 51.5 (8.4) | 47.5 (12.3) |
| Decreased renal function (eGFR <60) | 6.6 | ||||
| Reported adverse childhood experiences (ACEs) | 71.0 | ||||
| ACEs and DRF category | |||||
| No ACEs no DRF | 27.1 | – | – | – | – |
| ACEs only | 66.3 | – | – | – | – |
| DRF only | 1.8 | – | – | – | – |
| ACEs and DRF | 4.7 | – | – | – | – |
Notes: All values are percentage except when specified.
eGFR, estimated glomerular filtration rate calculated by CKD EPI equation; DRF, decreased renal function; MIDUS, Midlife Development in the United States.
Table 3 provides information on univariate and multivariable Cox proportional hazard models. In the unadjusted model, compared with individuals who did not have a history of ACEs and also did not have DRF, those individuals who only had a history of ACEs (hazard ratio [HR]=1.10, 95% CI=0.63, 1.92) and those who only had DRF (HR=2.86, 95% CI=0.84, 9.78) were not significantly different in mortality. However, individuals who had a history of ACEs and also had DRF, had a fourfold higher mortality risk (unadjusted HR=4.69, 95% CI=2.24, 9.83) compared with individuals who did not have a history of ACEs and did not have DRF. In fully adjusted models, individuals with coexisting ACEs and DRF maintained a twofold increase in mortality risk (HR= 2.85, 95% CI=1.30, 6.25). Those who only had DRF and those who only had a history of ACEs did not have a significantly associated all-cause mortality risk (HR=1.14, 95% CI=0.64–2.04 and HR=1.55, 95% CI=0.44, 5.41, respectively). When using DRF as the reference group, those with coexisting ACE and DRF had a 64% increased risk of all-cause mortality, though this relationship was not statistically significant (HR=1.64, 95% CI=0.46, 5.80). This increased risk of mortality remained after adjustment but was not significant (HR=1.72, 95% CI=0.48, 6.11). Figure 1 shows the adjusted survival curves by using the corrected group prognosis method for the four groups over time.
Table 3.
Cox Proportional Hazard Models for All-Cause Mortality Based on Adverse Childhood Experiences and Decreased Renal Function Status
| Variable | Unadjusted HR (95% CI) | Adjusted for demographics HR (95% CI) | Fully adjusted HR (95% CI) |
|---|---|---|---|
| ACEs and DRF category | |||
| No ACEs no DRF | ref | ref | ref |
| ACEs only | 1.10 (0.63, 1.92) | 1.08 (0.61, 1.90) | 1.14 (0.64, 2.04) |
| DRF only | 2.86 (0.84, 9.78) | 1.46 (0.42, 5.06) | 1.55 (0.44, 5.41) |
| ACEs and DRF | 4.69 (2.24, 9.83) | 2.78 (1.30, 5.94) | 2.85 (1.30, 6.25) |
| Sex | |||
| Male | ref | ref | ref |
| Female | 0.75 (0.48, 1.18) | 0.74 (0.47, 1.17) | 0.78 (0.49, 1.23) |
| Age group, years | |||
| 35–59 | ref | ref | ref |
| 60–86 | 5.59 (3.18, 9.82) | 4.99 (2.79, 8.93) | 4.45 (2.45, 8.07) |
| Race | |||
| White | ref | ref | ref |
| Minority | 0.96 (0.54, 1.73) | 1.18 (0.65, 2.14) | 1.00 (0.54, 1.85) |
| Hypertension | |||
| No | ref | ref | |
| Yes | 2.11 (1.34, 3.31) | 1.16 (0.71, 1.90) | |
| Diabetes | |||
| No | ref | ref | |
| Yes | 2.44 (1.45, 4.09) | 1.89 (1.10, 3.27) |
Notes: Boldface indicates statistical significance (p<0.05).
HR, hazard ratio; DRF, decreased renal function; ACEs, adverse childhood experiences.
Figure 1.
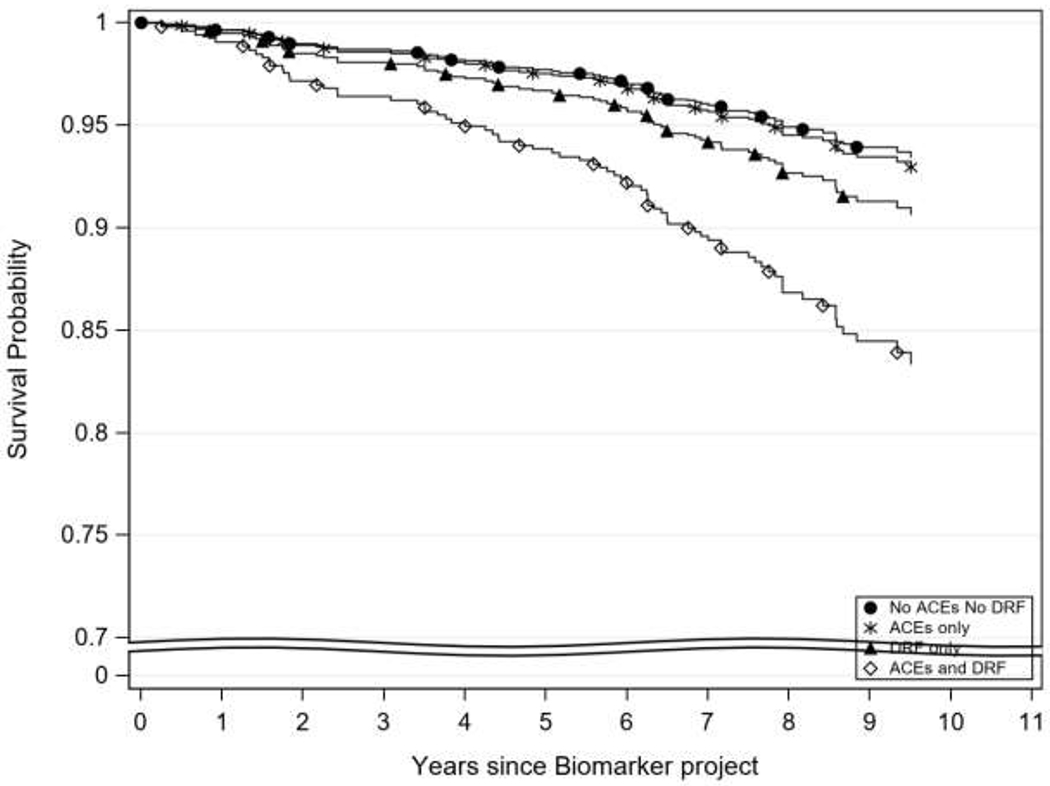
Adjusted overall survival curves based on ACEs and DRF status.
Notes: Adjusted survival curves using the Corrected Group Prognosis method. Adjusted by age, sex, and race.
DRF, decreased renal function; ACEs, adverse childhood experiences.
DISCUSSION
This study found, consistent with the study hypothesis, that after adjusting for demographics and comorbidities, individuals with coexisting ACEs and DRF had a twofold increased risk for all-cause mortality compared with those with neither. Contrary to the second hypothesis, having coexisting ACEs and DRF was not associated with higher mortality compared to those having DRF alone.
The current findings suggest that individuals with coexisting ACEs and DRF have significantly higher mortality risk compared with individuals with neither ACEs nor DRF. The Kaplan–Meier curve suggests that individuals with coexisting ACEs and DRF may have a more severe drop in survival in comparison to other groups; however, given the preliminary nature of this analysis, additional investigation into this relationship is warranted. Although existing evidence supports the exacerbating role that ACEs may have on the health status of individuals living with a chronic illness and its association with early mortality, these results serve as preliminary findings highlighting the influence of ACEs on mortality specifically among individuals with kidney disease.19 Though the mechanisms driving the observed higher mortality rate in individuals with coexisting ACEs and DRF remains unclear, evidence suggests that the prolonged stress response resulting from experiencing ACEs may underlie many biological processes leading to what has been referred to as “clustered metabolic risk” and increasing risk for early mortality.34,35 Coexisting ACEs and DRF may serve to compound existing health vulnerabilities leading to early mortality; however, more fully powered studies with additional measures are needed to tease out this association and the underlying mechanisms. In addition, evidence suggests that increased risk of early mortality may relate to factors during the embryonic and fetal phase of life.36,37 The impact of these factors on birth weight and disease susceptibility of an individual during their entire life is a phenomenon known as “fetal Programming.”36,37 Fetal programming has been shown through a number of epidemiologic studies to have an influence on chronic disease incidence and mortality.36,37 This relationship is another possible mechanism to explain the results of this study.
Interestingly, this study did not find a significant association between early mortality among those who had a history of ACEs only or DRF only. This contrasts with the existing evidence which shows an association between ACEs and early mortality.24,38,39 Specifically, individuals with a high number of ACEs have been shown to be at risk for premature death.17 In a study of more than 17,000 adults, cumulative exposure to ACEs was associated with a likelihood of dying 20 years early compared with individuals with no ACEs.17 Additionally, the relationship between ACEs and premature mortality has been found independent of adult mediating factors such as education, social class, BMI, smoking status, and alcohol consumption, where exposure to two or more ACEs was associated with 57%–80% increased risk of death.34 The lack of association seen in the present study may relate to the small sample size in the DRF group and large proportion of individuals who reported ACEs in this particular sample, which limits variability, or the broad definition of ACEs, which could lead to very different individuals categorized together. These findings should be interpreted within the context of prior work on ACEs and suggest future work in this area is needed.
These study findings have implications for clinical care. Clinically, although ACEs may not be the primary concern of a nephrologist faced with the complex management of concordant comorbid diseases such as diabetes and hypertension,40 the findings of this study underscore the significance of early recognition of ACEs history in individuals with DRF during healthcare delivery. Early recognition and screening for ACEs has the potential to mitigate its negative impact on an individual’s lifecourse health and health outcomes.41 There is growing evidence to support that social determinants of health such as ACEs impact physical and mental health, increase utilization of health care, and as such increase healthcare cost.13,14,21,33,42 Furthermore, the existing literature on ACEs has shown that the presence of ACEs confer risk for poor health behaviors in adulthood as well as morbidity and chronic diseases such as diabetes and hypertension.43 Consequently, this could increase the risk for kidney disease, the potential for complications, and or progression of disease.43 Taken together, for healthcare providers, specifically primary care physicians and nephrologists, an ACE-informed practice may be an important consideration when using patient history and contextual factors of patients’ environments to inform management options.15 Additionally, as providers are often uncomfortable screening for conditions without a plan for treatment, it is recommended that ACE screening is accompanied with referral pathways and provision of evidence-based treatment resources.41
Limitations
Despite the novelty of this study, it is not without limitations. First, the study population was middle age adults so prevalence estimates for DRF may be lower than national estimates which are based on a population level that includes elderly adults known to have the highest prevalence of disease. Second, based on the variables available in the data set, CKD could not be defined, and decreased renal function may not be the same population. Third, though a large proportion of the sample had ACEs, the group with “DRF only” was small so estimates may not be stable. Fourth, 8 years may not be enough time to capture mortality in this study population as DRF could be suggestive of acute kidney injury or future CKD. Fifth, because of the small overall sample and the small sample of individuals in the DRF only group, several covariates could not be included in the models. Sixth, the data set does not have information on parental risk factors, which could potentially affect mortality risk in individuals with DRF. Finally, this data set does not include information on CKD awareness which is an important factor for disease outcomes. Future studies should investigate a larger population-based sample controlling for additional cofounding factors, following participants for a longer period of time, investigating specific types of ACEs, and collecting information on awareness of and treatment for disease. Studies should also collect multiple serum creatinine collection over time to allow investigation of CKD and change in eGFR within a CKD population.
CONCLUSIONS
This longitudinal study of U.S. adults found that coexistence of ACEs and DRF was associated with higher all-cause mortality compared with individuals with neither ACEs nor DRF. These results serve as preliminary findings to understanding the influence of ACEs on health status among individuals with DRF. Future work is needed that focuses on the mechanistic factors driving this relationship as well as the influence of specific ACEs among this population.
Supplementary Material
ACKNOWLEDGMENTS
This manuscript represents the views of the authors and not those of NIH or Advancing Healthier Wisconsin.
Effort for this study was partially supported by the Advancing Healthier Wisconsin/Clinical and Translational Science Award program at the Medical College of Wisconsin (UL1TR001436 and KL2TR001438, KL2 award to Ozieh), the National Institute of Diabetes and Digestive Kidney Disease (K24DK093699, R01DK118038, R01DK120861, Principal Investigator: Egede), the National Institute for Minority Health and Health Disparities (R01MD013826, Principal Investigator: Egede/Walker) and the American Diabetes Association (1-19-JDF-075, Principal Investigator: Walker).
All authors were involved in the study design, data acquisition, analyzation, interpretation, drafting, and critical revision of this manuscript content. The final manuscript was approved by all the authors.
Footnotes
Publisher's Disclaimer: This is a PDF file of an unedited manuscript that has been accepted for publication. As a service to our customers we are providing this early version of the manuscript. The manuscript will undergo copyediting, typesetting, and review of the resulting proof before it is published in its final form. Please note that during the production process errors may be discovered which could affect the content, and all legal disclaimers that apply to the journal pertain.
The authors do not have any financial or non-financial disclosures relevant to this article.
REFERENCES
- 1.Kidney Disease: Improving Global Outcomes (KDIGO) CKD Work Group. KDIGO 2012 Clinical Practice Guideline for the Evaluation and Management of Chronic Kidney Disease. Kidney Int Suppl. 2013;3(1):1–150. 10.1038/kisup.2012.74. [DOI] [Google Scholar]
- 2.CDC. Chronic Kidney Disease in the United States, 2019. Atlanta, GA: HHS, CDC; 2019. [Google Scholar]
- 3.Murphy SL, Xu JQ, Kochanek KD, et al. Mortality in the United States, 2017. NCHS Data Brief. 2018;(328):1–8 [PubMed] [Google Scholar]
- 4.Norton JM, Moxey-Mims MM, Eggers PW, et al. Social determinants of racial disparities in CKD. J Am Soc Nephrol. 2016;27(9):2576–2595. 10.1681/asn.2016010027. [DOI] [PMC free article] [PubMed] [Google Scholar]
- 5.Hall YN. Social determinants of health: addressing unmet needs in nephrology. Am J Kidney Dis. 2018;72(4):582–591. 10.1053/j.ajkd.2017.12.016. [DOI] [PubMed] [Google Scholar]
- 6.WHO. About social determinants of health. www.who.int/social_determinants/sdh_definition/en/ Accessed April 3, 2019.
- 7.Office of Disease Prevention and Health Promotion, CDC. Social determinants of health. www.healthypeople.gov/2020/topics-objectives/topic/social-determinants-of-health Accessed April 3, 2019.
- 8.Lynch J, Smith GD. A life course approach to chronic disease epidemiology. Annu Rev Public Health. 2005;26:1–35. 10.1146/annurev.publhealth.26.021304.144505. [DOI] [PubMed] [Google Scholar]
- 9.Halfon N and Hochstein M. Life course health development: an integrated framework for developing health, policy, and research. Milbank Q. 2002;80(3):433–479. 10.1111/1468-0009.00019. [DOI] [PMC free article] [PubMed] [Google Scholar]
- 10.Hertzman C Population health and human experiences In: Keating DP, Hertzman C, eds. Developmental health and wealth of nations: Social, biological and educational dynamics. New York, NY: Guilford Press, 1999. [Google Scholar]
- 11.Campbell JA, Farmer GC, Nguyen-Rodriguez S, et al. Relationship between individual categories of adverse childhood experience and diabetes in adulthood in a sample of US adults: does it differ by gender? J Diabetes Complications. 2018;32(2):139–143. 10.1016/j.jdiacomp.2017.11.005. [DOI] [PMC free article] [PubMed] [Google Scholar]
- 12.Su S, Wang X, Pollock JS, et al. Adverse childhood experiences and blood pressure trajectories from childhood to young adulthood: the Georgia Stress and Heart Study. Circulation. 2015;131(19):1674–1681. 10.1161/circulationaha.114.013104. [DOI] [PMC free article] [PubMed] [Google Scholar]
- 13.Austin A Association of adverse childhood experiences with life course health and development. N C Med J. 2018;79(2):99–103. 10.18043/ncm.79.2.99. [DOI] [PubMed] [Google Scholar]
- 14.Campbell JA, Walker RJ, Egede LE. Associations between adverse childhood experiences, high-risk behaviors, and morbidity in adulthood. Am J Prev Med. 2016;50(3):344–352. 10.1016/j.amepre.2015.07.022. [DOI] [PMC free article] [PubMed] [Google Scholar]
- 15.Hughes K, Bellis MA, Hardcastle KA, et al. The effect of multiple adverse childhood experiences on health: a systematic review and meta-analysis. Lancet Public Health. 2017;2(8):e356–e366. 10.1016/s2468-2667(17)30118-4. [DOI] [PubMed] [Google Scholar]
- 16.Bellis MA, Hughes K, Leckenby N, et al. Measuring mortality and the burden of adult disease associated with adverse childhood experiences in England: a national survey. J Public Health (Oxf). 2015;37(3):445–454. 10.1093/pubmed/fdu065. [DOI] [PMC free article] [PubMed] [Google Scholar]
- 17.Brown DW, Anda RF, Tiemeier H, et al. Adverse childhood experiences and the risk of premature mortality. Am J Prev Med. 2009;37(5):389–396. 10.1016/j.amepre.2009.06.021. [DOI] [PubMed] [Google Scholar]
- 18.Anda RF, Felitti VJ, Bremner JD, et al. The enduring effects of abuse and related adverse experiences in childhood. Eur Arch Psychiatry Clin Neurosci. 2006;256(3):174–186. 10.1007/s00406-005-0624-4. [DOI] [PMC free article] [PubMed] [Google Scholar]
- 19.Campbell JA, Mosley-Johnson E, Garacci E, et al. The co-occurrence of diabetes and adverse childhood experiences and its impact on mortality in US adults. J Affect Disord. 2019;249:20–25. 10.1016/j.jad.2019.02.016. [DOI] [PMC free article] [PubMed] [Google Scholar]
- 20.Boullier M, Blair M. Adverse childhood experiences. Paediatr Child Health (Oxford). 2018;28(3):132–137. 10.1016/j.paed.2017.12.008. [DOI] [Google Scholar]
- 21.Gilbert LK, Breiding MJ, Merrick MT, et al. Childhood adversity and adult chronic disease: an update from ten states and the District of Columbia, 2010. Am J Prev Med. 2015;48(3):345–349. 10.1016/j.amepre.2014.09.006. [DOI] [PubMed] [Google Scholar]
- 22.Campbell JA, Farmer GC, Nguyen-Rodriguez S, et al. Using path analysis to examine the relationship between sexual abuse in childhood and diabetes in adulthood in a sample of US adults. Prev Med. 2018;108:1–7. 10.1016/j.ypmed.2017.12.013. [DOI] [PMC free article] [PubMed] [Google Scholar]
- 23.Bellis MA, Hughes K, Leckenby N, et al. Adverse childhood experiences and associations with health-harming behaviours in young adults: surveys in eight eastern European countries. Bull World Health Organ. 2014;92(9):641–655. 10.2471/blt.13.129247. [DOI] [PMC free article] [PubMed] [Google Scholar]
- 24.Aberg YM, Kondo N, Hagg S, et al. Relative deprivation and mortality—a longitudinal study in a Swedish population of 4.7 million, 1990 2006. BMC Public Health. 2012;12:664 10.1186/1471-2458-12-664. [DOI] [PMC free article] [PubMed] [Google Scholar]
- 25.Felitti VJ, Anda RF, Nordenberg D, et al. Relationship of childhood abuse and household dysfunction to many of the leading causes of death in adults: the Adverse Childhood Experiences (ACE) Study. Am J Prev Med. 1998;14(4):245–258. 10.1016/s0749-3797(98)00017-8. [DOI] [PubMed] [Google Scholar]
- 26.Austin AE, Herrick HWB. The effect of adverse childhood experiences on adult health: 2012 North Carolina Behavioral Risk Factor Surveillance System Survey. SCHS Studies. 2014;167 https://schs.dph.ncdhhs.gov/schs/pdf/SCHS_Study_167_FIN_20140505.pdf Accessed April 10, 2020. [Google Scholar]
- 27.University of Wisconsin Madison, Institute on Aging. Midlife in the United States: A National Longitudinal Study of Health & Well-Being; http://midus.wisc.edu/scopeofstudy.php Accessed March 4, 2019. [Google Scholar]
- 28.Ferraro KF, Schafer MH, Wilkinson LR. Childhood disadvantage and health problems in middle and later life: early imprints on physical health? Am Sociol Rev. 2016;81(1):107–133. 10.1177/0003122415619617. [DOI] [PMC free article] [PubMed] [Google Scholar]
- 29.Turiano NA, Silva NM, McDonald C, Hill PL. Retrospective reports of childhood misfortune are associated with positive and negative affect in adulthood: exploring the moderating role of control beliefs. Int J Aging Hum Dev. 2017;84(3):276–293. 10.1177/0091415016688480. [DOI] [PubMed] [Google Scholar]
- 30.Schafer MH, Ferraro KF, Mustillo SA. Children of misfortune: early adversity and cumulative inequality in perceived life trajectories. AJS. 2011;116(4):1053–1091. 10.1086/655760. [DOI] [PMC free article] [PubMed] [Google Scholar]
- 31.Michels WM, Grootendorst DC, Verduijn M, et al. Performance of the Cockcroft-Gault, MDRD, and new CKD-EPI formulas in relation to GFR, age, and body size. Clin J Am Soc Nephrol. 2010;5(6):1003–1009. 10.2215/cjn.06870909. [DOI] [PMC free article] [PubMed] [Google Scholar]
- 32.Midlife in the United States (MIDUS 3), 2013–2014, Mortality Data Codebook. 10.3886/ICPSR36346.v7. [DOI]
- 33.Liu L, Forman S, Barton B. Fitting Cox Model Using PROC PHREG and Beyond in SAS. http://support.sas.com/resources/papers/proceedings09/236-2009.pdf Accessed April 10, 2020. [Google Scholar]
- 34.Kelly-Irving M, Lepage B, Dedieu D, et al. Adverse childhood experiences and premature all-cause mortality. Eur J Epidemiol. 2013;28(9):721–734. 10.1007/s10654-013-9832-9. [DOI] [PMC free article] [PubMed] [Google Scholar]
- 35.Danese A, Moffitt TE, Harrington H, et al. Adverse childhood experiences and adult risk factors for age-related disease: depression, inflammation, and clustering of metabolic risk markers. Arch Pediatr Adolesc Med 2009;163(12):1135–1143. 10.1001/archpediatrics.2009.214. [DOI] [PMC free article] [PubMed] [Google Scholar]
- 36.Kwon EJ, Kim YJ. What is fetal programming?: A lifetime health is under the control of in utero health. Obstet Gynecol Sci. 2017;60(6):506–519. 10.5468/ogs.2017.60.6.506. [DOI] [PMC free article] [PubMed] [Google Scholar]
- 37.Reichetzeder C, Putra SE, Li J, Hocher B. Developmental origins of disease-crisis precipitates change. Cell Physiol Biochem. 2016;39(3):919–938. 10.1159/000447801. [DOI] [PubMed] [Google Scholar]
- 38.McCartney D, Scarborough P, Webster P, et al. Trends in social inequalities for premature coronary heart disease mortality in Great Britain, 1994 2008: a time trend ecological study. BMJ Open. 2012;2:e000737 10.1136/bmjopen-2011-000737. [DOI] [PMC free article] [PubMed] [Google Scholar]
- 39.Melchior M, Berkman LF, Kawachi I, et al. Lifelong socioeconomic trajectory and premature mortality (35 65 years) in France: findings from the GAZEL Cohort Study. J Epidemiol Community Health. 2006;60(11):937–944. 10.1136/jech.2005.042440. [DOI] [PMC free article] [PubMed] [Google Scholar]
- 40.Fraser SD, Taal MW. Multimorbidity in people with chronic kidney disease: implications for outcomes and treatment. Curr Opin Nephrol Hypertens. 2016;25(6):465–472. 10.1097/mnh.0000000000000270. [DOI] [PubMed] [Google Scholar]
- 41.American Heart Association. Screening for Adverse Childhood Experiences (ACEs) and Referral Pathways. Position Statement of the American Heart Association; www.heart.org/-/media/files/about-us/policy-research/policy-positions/social-determinants-of-health/aces--screening-and-referralpathways.pdf?la=en&hash=6CDCD7CCD68604390A79DF081E100CF31DAADD20 Accessed March 3, 2020. [Google Scholar]
- 42.Anda RF, Brown DW, Felitti VJ, et al. Adverse childhood experiences and prescription drug use in a cohort study of adult HMO patients. BMC Public Health. 2008;8:198 10.1186/1471-2458-8-198. [DOI] [PMC free article] [PubMed] [Google Scholar]
- 43.May CR, Eton DT, Boehmer K, et al. Rethinking the patient: using Burden of Treatment Theory to understand the changing dynamics of illness. BMC Health Serv Res. 2014;14:281 10.1186/1472-6963-14-281. [DOI] [PMC free article] [PubMed] [Google Scholar]
Associated Data
This section collects any data citations, data availability statements, or supplementary materials included in this article.