Abstract
Cancer is a genetic disease comprising multiple subtypes that have distinct molecular characteristics and clinical features. Cancer subtyping helps in improving personalized treatment and making decision, as different cancer subtypes respond differently to the treatment. The increasing availability of cancer related genomic data provides the opportunity to identify molecular subtypes. Several unsupervised machine learning techniques have been applied on molecular data of the tumor samples to identify cancer subtypes that are genetically and clinically distinct. However, most clustering methods often fail to efficiently cluster patients due to the challenges imposed by high-throughput genomic data and its non-linearity. In this paper, we propose a pathway-based deep clustering method (PACL) for molecular subtyping of cancer, which incorporates gene expression and biological pathway database to group patients into cancer subtypes. The main contribution of our model is to discover high-level representations of biological data by learning complex hierarchical and nonlinear effects of pathways. We compared the performance of our model with a number of benchmark clustering methods that recently have been proposed in cancer subtypes. We assessed the hypothesis that clusters (subtypes) may be associated to different survivals by logrank tests. PACL showed the lowest p-value of the logrank test against the benchmark methods. It demonstrates the patient groups clustered by PACL may correspond to subtypes which are significantly associated with distinct survival distributions. Moreover, PACL provides a solution to comprehensively identify subtypes and interpret the model in the biological pathway level. The open-source software of PACL in PyTorch is publicly available at https://github.com/tmallava/PACL.
Keywords: Cancer subtyping, Clustering, Pathway-based analysis, Ovarian cancer, TCGA
1. Introduction
Cancer is a complex disease characterized by uncontrolled, uncoordinated, and undesirable growth of abnormal malignant cells. There are several types of cancers, and each cancer has multiple distinct subtypes that result in different responses to therapy. Although cancer subtypes progress in a single parent cell, they have distinct genetic identity, gene expression pattern, gene regulatory or protein signaling network. Hence, identifying subtypes based on molecular characteristics improves the understanding of cancer biology and enhances both diagnosis and prognosis, which consequently helps cancer patients to have personalized therapy [4]. For instance, breast cancer is typically classified into four primary molecular subtypes based on Human Epidermal growth factor Receptor 2 (HER2), hormone receptors, and tumor grade. The subtypes have distinct prognosis and respond differently to hormone therapy.
Furthermore, each subtype has multiple nested subtypes. Head and Neck Squamous Cell Carcinoma (HNSCC) has two subtypes: Human Papillomavirus (HPV)-positive and HPV-negative [28]. HPV-positive patients often show higher survival rate and better response to treatment than HPV-negative patients. Recent reports have shown that some HPV-positive patients also may have poor outcomes, which implies nested subtypes that involve different biological processes in HPV-positive patients [36]. Similarly, HER2 positive subtype of breast cancer responds to chemotherapy effectively, whereas HER2 negative subtype shows better outcome with hormonal therapy [35].
Identification of molecular cancer subtypes has been leveraged by advanced high-throughput microarray techniques and the availability of large biological databases. A number of machine learning techniques have been widely used for identifying unknown cancer subtypes. For instance, two subtypes of Diffuse Large B-Cell Lymphoma (DLBCL) were detected by hierarchical clustering on gene expression data. The two subtypes are related to the two stages of B-cell differentiation and activation [1]. Six subtypes of Triple-Negative Breast Cancer (TNBC) were detected by K-means clustering using gene expression data and the robustness of these subtypes was analyzed by consensus clustering [20]. An enhanced deterministic K-means clustering was proposed for cancer subtyping and successfully identified subtypes in various cancers like leukemia, lung cancer, etc [26]. Five subtypes of colorectal cancer (CRC) and four subtypes of lung cancer were identified by Enhanced Maximum Block Improvement (eMBI) algorithm based on matrix factorization [7]. In eMBI algorithm, 20% of the total genes with largest variance were selected and initialized by K-means clustering. Then weights were assigned to genes based on their connections in the network and consensus clustering was used for the final clusters.
Pathway-based clustering methods have been developed by incorporating biological pathway databases. Pathway-based analysis plays an important role in understanding collective biological functions of genes and their impact on the phenotypic changes of the patients [33]. Pathifier discovered several pathways which are significantly associated with patients’ survivals in glioblastoma and colorectal cancer [12]. The method inferred pathway deregulation scores from gene expression data and then performed clustering. R-PathCluster identified two subtypes of glioblastoma and several pathways associated with the cancer progression [23]. In the study, pathway scores were generated from gene expression and subtypes were identified by clustering the pathway scores.
However, the relationships between genomic data and patients’ survivals are highly non-linear in cancer. The t-SNE plot [31] illustrates the nonlinear association between gene expression data and survivals of Glioblastoma Multiforme (GBM) patients in Fig. 1. Therefore, conventional clustering methods based on similarity (or distance) between data often fail to cluster. Moreover, it was reported that even binary classification for survival prediction (short- vs. long-term survival prediction) produces a low Area Under the Curve (AUC) of around 0.65 in a balanced dataset [21] due to the high nonlinearity. It may be caused by multiple intermediate complex biological processes between genomic data and survivals.
Fig. 1.
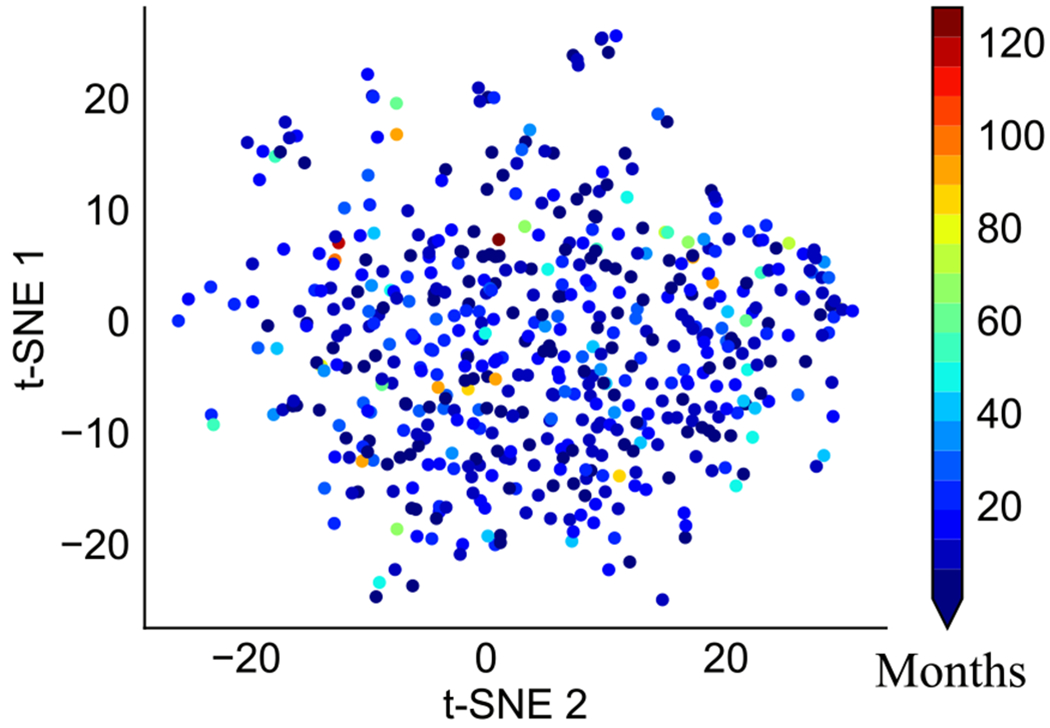
Nonlinear association between gene expression data and survivals in GBM. Red color shows longer survival, whereas blue indicates shorter. (For interpretation of the references to colour in this figure legend, the reader is referred to the web version of this article.)
In this paper, we propose a novel PAthway-based deep CLustering (PACL) method. PACL constructs a biologically interpretable stacked Restricted Boltzmann Machine (RBM) model by integrating pathway databases and identifies multiple cancer subtypes by capturing nonlinear and hierarchical effects of genomic data to the patients’ survivals. Furthermore, the proposed model can interpret the model in a pathway level.
The rest of this paper is structured as follows. In Section 2, we present our proposed method PACL to address a cancer subtype identification problem. Then, we demonstrate our experimental settings and results of PACL comparing with benchmark methods in Section 3. Finally, we discuss about pathway-based model interpretation of PACL with GBM data in Section 4.
2. Methods
In this section, we elaborate on our proposed method, Pathway-based Deep Clustering model (PACL) for identifying unknown cancer subtypes from high-dimensional genomic data. First, we briefly introduce Restricted Boltzmann Machine (RBM) and Deep Belief Network (DBN), on which our proposed method is based. Then, we describe the architecture of the proposed model and how it incorporates pathway databases for robust analysis.
2.1. Restricted Boltzmann Machine and deep belief network
Restricted Boltzmann Machine (RBM) is an energy-based stochastic model with a visible layer and a hidden layer. The visible units correspond to input data, whereas the hidden units learn non-linear transformation of the input data in a lower dimensional space. The two layers are connected with symmetrical weights, but there are no intraconnections between nodes in the same layer. Hence, the hidden units, which are conditionally independent on the visible units, represent posterior distributions of the variables over the inputs. A joint configuration (v, h) of the visible nodes v and hidden nodes h is represented by the following energy function:
| (1) |
where v = (v1, v2⋯vL) is a set of nodes in the visible layer and h = (h1, h2⋯hK) is a set of nodes in the hidden layer. L and K are the numbers of nodes in the input layer and the hidden layer, respectively. θ = {c, b, W} are model parameters; and are biases in the visible and the hidden layers, respectively; is a weight matrix that defines symmetric connections between the layers. The conditional probability of a visible node given the hidden layer is obtained by:
| (2) |
The posterior probability of the input data (v) on the j-th node in the hidden layer is obtained by:
| (3) |
where a(·) refers to an activation function (e.g., sigmoid function). RBM reconstructs the nodes of the visible layer and estimates the hidden layer, so that the high-level representations in the hidden layer preserve the information of the visible layer.
Deep Belief Network (DBN) is stacked RBMs that can provide multilayered high-level representation. Hinton et al proposed a greedy layer-by-layer training algorithm that builds an RBM block for each paired layers [16]. DBN learns deep data representation of the input data. The last hidden layer can capture multilayered high-level features of the input data.
2.2. Pathway-based Deep Clustering (PACL)
PACL is a multilayered deep belief network that identifies molecular subtypes of cancer by not only incorporating high-dimensional transcriptional data but also prior biological knowledge of pathway for robust analysis and biological interpretation. The framework of our model consists of a gene layer, a pathway layer, two hidden layers, and a cluster layer (see Fig. 2). PACL takes gene expression data (e.g., DNA microarray or RNA-seq) to the gene layer (as an input layer). Pathway expression is inferred from gene expression data by incorporating prior knowledge from pathway databases. The pathway layer represents quantitative activities or changes of biological pathways. Then, the hidden layers describe nonlinear hierarchical relationships among biological pathways, whereas a cluster layer shows clusters of cancer subtypes.
Fig. 2.
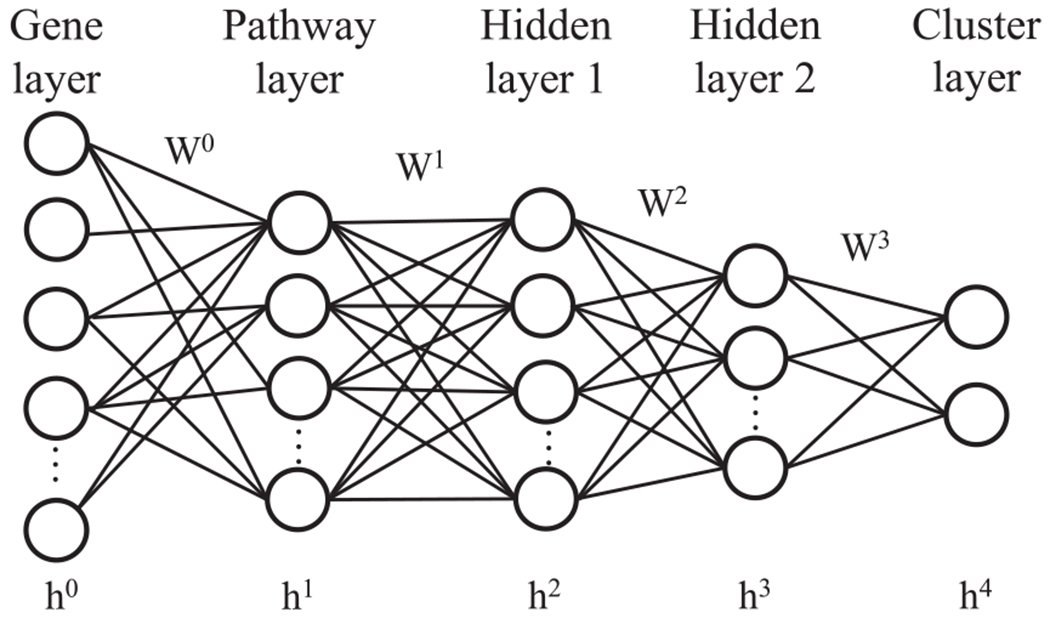
The architecture of PACL.
2.2.1. Gene layer
The gene layer, an input layer in DBN, represents biological genes with gene expression of a patient. Each node in the gene layer corresponds to a gene, so the number of nodes depends on the number of genes in the dataset. In our model, we considered only genes that belong to at least a biological pathway for pathway-based analysis. The gene layer is normalized between zero and one.
2.2.2. Pathway layer
The pathway layer infers expression of gene sets of biological pathways. Each node in the pathway layer corresponds to an individual biological pathway, which shows molecular activities that lead to a certain product or a change in a cell. Pathway databases (e.g., Reactome and KEGG) contain the experimental and biological knowledge of associations between genes and pathways. A biological pathway includes a set of genes, and each gene can be associated with multiple pathways.
The connections between the gene layer and the pathway layer are interpreted as biological relationships between the genes and pathways, and the connections are determined by given prior biological knowledge of pathway databases in PACL. The incorporation of biological pathway databases makes it possible to interpret the model as a pathway-based analysis.
In order to initialize the connections between the gene layer and the pathway layer, a binary biadjacency matrix A is considered from pathway databases. The biadjacency matrix is defined as , where P is the number of pathways in the pathway layer and L is the number of genes in the gene layer. A = {aij|1 ⩽ i ⩽ P, 1 ⩽ j ⩽ L} is set to one if gene j belongs to pathway i, otherwise zero. The biadjacency matrix is used to model the sparsity between the input and the pathway layers.
2.2.3. Hidden layer
The two hidden layers describe nonlinear and hierarchical associations of pathways to a cluster. The hidden layer nodes show active or inactive states of the associated multiple pathways. The hidden layer does not explicitly represent biological processes, but it may capture the group effects of multiple pathways.
2.2.4. Cluster layer
The cluster layer encodes a posterior probability that a high-level representation of given data belongs to a cluster. Most clustering algorithms assign a single cluster label to a sample, whereas our stochastic model provides a probability of a sample to each cluster. Given data are clustered with the maximum posterior probability. The number of nodes in the cluster layer corresponds to the number of clusters.
2.3. Training
Since gene expression data are High Dimensional, Low Sample Size (HDLSS) data, we tackle the overfitting problem by L-2 and dropout regularization. L-2 regularization is added to the objective function to penalize the model parameters:
| (4) |
where λ is a regularization parameter to control weight values.
Moreover, our model trains with small sub-networks instead of the whole network by dropout regularization of high dropout rate. It reduces the computational challenge of HDLSS and further improves the mode performance. Since our model is based on DBN, it trains in the greedy layer by layer manner (Fig. 3). First, the gene layer and the pathway layer form a two layered RBM. The sparse connections between the gene layer and the pathway layer are imposed by the mask matrix A, which determines active and inactive connections between them (Fig. 3a). The weights in the active connections and bias are initialized with random normal values, whereas the weights in the inactive connections are set to zero. The sub-networks are trained by contrastive divergence. The training with the small networks is illustrated by the solid lines and nodes in Fig. 3b. The training is repeated to the following layers (Fig. 3b and c). After training the two layered network between the gene and pathway layers, PACL trains the following fully connected layers of the pathway layer, the hidden layers, and the cluster layer in the same manner.
Fig. 3.
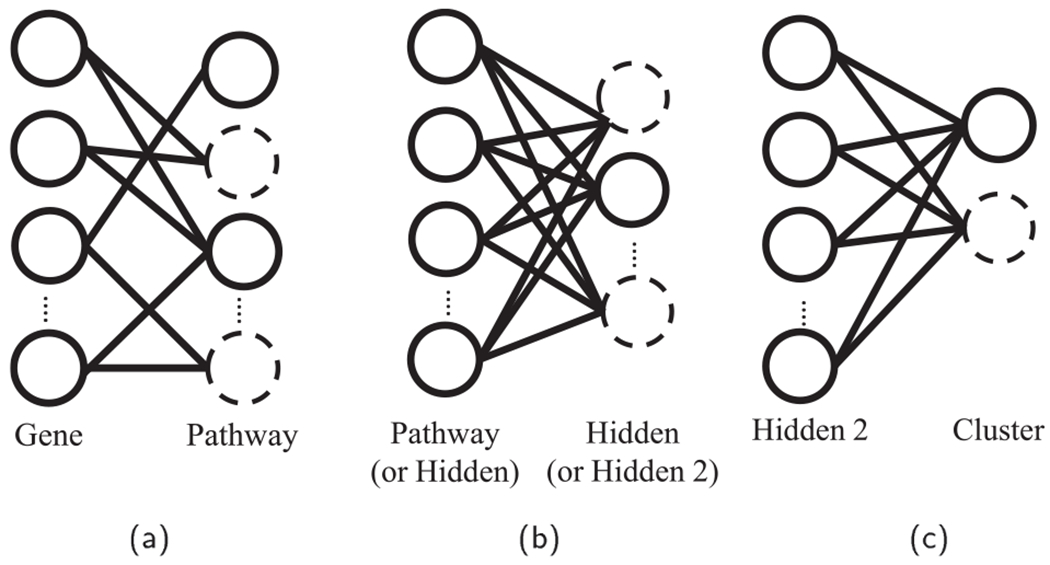
Layer-by-layer training with small sub-networks. (a) Sparse connections between the gene layer and the pathway layer given by biological pathway databases, (b) training with small sub-networks in the pathway layer and the hidden layer, and (c) training between the hidden layer 2 and the cluster layer.
Dropout regularization is introduced in all layers by randomly eliminating nodes with a high dropout ratio (ϕ) while training the model [29]. During dropout, the conditional distributions of the input and the hidden nodes are:
| (5) |
| (6) |
where d = {0, 1} is a binary mask vector with the given dropout ratio. If an element of the binary vector is one, the corresponding hidden node is retained, otherwise dropped from the model.
3. Experimental results
We conducted experiments to evaluate PACL with high-dimensional gene expression data of patients in Glioblastoma Multiforme (GBM) and ovarian cancer. GBM is the most aggressive brain tumor with higher inter- and intra-tumor heterogeneity [13]. The median survival time of GBM patients after initial diagnosis is approximately 12–14 months [14]. Despite significant advances in understanding of disease progression and molecular pathogenesis, prognosis of GBM remains poor.
Ovarian cancer is the most frequent gynecologic cancer and is the fifth leading deaths cancer to women [18]. The chance of five-year survival rate is just around 30–40%. Ovarian cancer is highly asymptomatic during early stages and shows non-specific symptoms in advanced stages. Therefore, ovarian cancer is difficult to be diagnosed early and shows poor prognosis rate [6].
3.1. Datasets
We assessed the effectiveness of PACL by comparing with a number of clustering methods that most cancer subtype studies have used. For the experiments, we used microarray gene expression data of GBM and ovarian cancer downloaded from The Cancer Genome Atlas (TCGA).2 GBM dataset consists of 523 samples of 12,042 genes, while ovarian cancer dataset includes 532 samples of 12,043 genes (see Table 1). We considered the four pathway databases: Kyoto Encyclopedia of Genes and Genomes (KEGG), Reactome, Pathway Interaction Database (PID), and BioCarta for pathway-based analysis. The pathway databases were obtained from Molecular Signatures Database (MSigDB).3 Small pathways which include less than 15 genes were excluded to avoid substantial redundancy with large pathways, and also genes that have no association with pathways were not considered for the experiments. After the preprocessing, each cancer dataset has 998 pathways of 6,073 genes. The experiments were repeated ten times with randomly selecting 80% of the samples for reproducibility and robustness. For each experiment, data was normalized to a mean of zero and a standard deviation of one.
Table 1.
Summary of experiment datasets.
| Dataset | Genes | Patients |
|---|---|---|
| GBM | 12,042 | 523 |
| Ovarian | 12,043 | 532 |
3.2. Experimental settings
We compared the performance of our model with the benchmark methods including K-Means (KM) [20], Density K-Means + + (DKM + +) [26], Hierarchical Clustering (HC) [1], Spectral Clustering (SC) [8], Consensus Clustering (CC) [24], and Consensus Non-negative Matrix Factorization (CNMF) [5]. The architecture of PACL consisted of 6073 nodes in the gene layer, 998 nodes in the pathway layer, and 500 and 200 nodes in the two hidden layers, where a sigmoid function was considered as an activation for all layers. Note that each node in the gene layer corresponds to a gene, so the number of nodes in the gene layer varies with respect to the number of genes in the dataset. The cluster layer nodes ranged from two to four to find the optimal number of cancer subtypes. For the optimal model of PACL, we empirically determined hyper-parameters from multiple experiments. In particular, learning rate was set as 0.0005, 0.05, 0.05, and 0.0005 for each layer, respectively; L-2 regularization parameter (λ) was set as 1e–4; dropouts were applied with a drop probability of 0.7 for all layers.
For K-means and hierarchical clustering, default settings such as Euclidean and Ward’s minimum variance linkage were used, respectively. Consensus clustering was trained with Pearson distance function, whereas spectral clustering was with Gaussian kernel of Euclidean distance.
3.3. Experimental results
First of all, we determined the optimal number of clusters (i.e., the number of subtypes). Silhouette scores were computed with various cluster numbers (two to four clusters). A silhouette score ranges from negative one to positive one, where a high score indicates better clustering performance. For all benchmark clustering methods of K-means, DKM + +, HC, SC, CNMF, and CC, the original gene expression data of clusters were used to compute the silhouette score, whereas the last hidden layer node values were considered for PACL that produces high-level representations of the original data.
The silhouette scores on each clustering method with GBM are depicted in Fig. 4 and listed in Table 2. Most clustering methods produced the highest silhouette scores with two clusters, which may show that two major subtypes exist in GBM. It is worth noting that the higher silhouette score of PACL than other methods shows that the pathway-based high-level representation of the data describes the nonlinear effects of the data (see Table 2). The silhouette scores are to determine the optimal number of clusters, rather than comparing the performance of the benchmark methods. The average cluster sizes in PACL were 274.5 and 144.5 with two clusters (see Table 3).
Fig. 4.
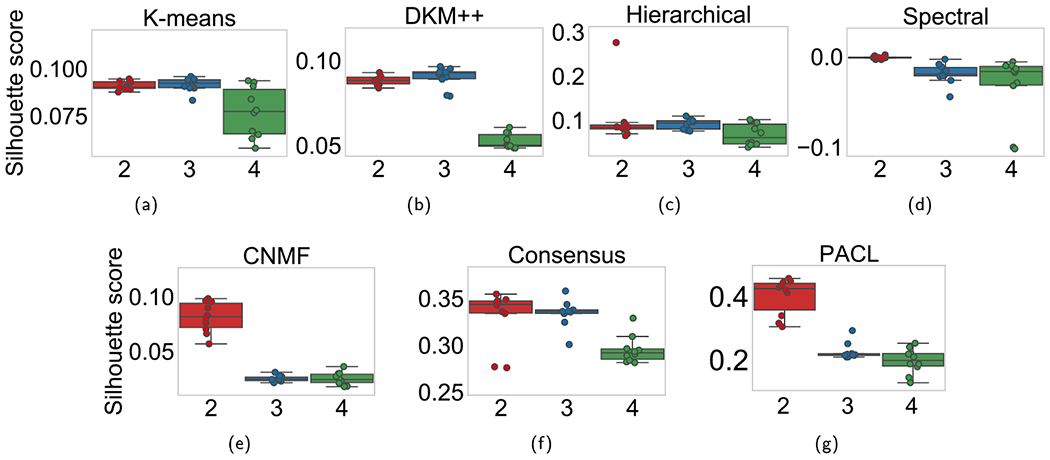
Silhouette scores with two to four clusters with GBM dataset. The x-axis shows the number of clusters.
Table 2.
Silhouette scores with two to four clusters with GBM data.
| Model | Two clusters | Three clusters | Four clusters |
|---|---|---|---|
| K-means | 0.091 ± 0.002 | 0.092 ± 0.004 | 0.077 ± 0.013 |
| DKM + + | 0.088 ± 0.003 | 0.090 ± 0.006 | 0.053 ± 0.004 |
| HC | 0.102 ± 0.059 | 0.092 ± 0.011 | 0.068 ± 0.024 |
| SC | −0.001 ± 0.002 | −0.019 ± 0.011 | −0.03 ± 0.035 |
| CNMF | 0.081 ± 0.013 | 0.03 ± 0.003 | 0.025 ± 0.005 |
| CC | 0.331 ± 0.028 | 0.335 ± 0.014 | 0.30 ± 0.014 |
| PACL | 0.400 ± 0.005 | 0.209 ± 0.062 | 0.197 ± 0.038 |
Table 3.
Average cluster sizes in GBM.
| Model | Two clusters | Three clusters | Four clusters |
|---|---|---|---|
| K-means | [236.5, 182.5] | [233.1, 136.8, 39.1] | [232.1,124.2,37.1,25.6] |
| DKM+ + | [270.4, 148.6] | [241.6, 131.4, 46] | [153.3,129.8,98.1,37.8] |
| HC | [300.6, 118.4] | [272.5, 115.7, 30.8] | [226.8,107.6,60.8,23.8] |
| SC | [258, 161] | [208.7,128.9,81.4] | [199.5,104.4,70,45.1] |
| CNMF | [260.5, 158.5] | [194,149.3,75.7] | [144.6,117.3,90,67.1] |
| CC | [413.7, 6.1] | [410.6,7,1.4] | [394.7,18.2,4.8,1.3] |
| PACL | [274.5, 144.5] | [230.7,150.9,37.4] | [224.9,154.4,30.1,15.3] |
Then, we assessed the hypothesis that clusters (subtypes) may be associated to different survivals by logrank tests. Logrank tests were performed with survival times and survival events of clusters (see Fig. 5). For more than two clusters, the lowest p-values were considered among the pairwise logrank tests. PACL showed the lowest p-values on average with two clusters among the benchmark methods in Fig. 5. It demonstrates the patient groups clustered by PACL may correspond to subtypes in GBM, which are significantly associated with distinct survival distributions. Interestingly, DKM + + showed lower p-values than PACL in three clusters. However, DKM + + produced the highest silhouette score in two clusters. In contrast, PACL’s silhouette score appears to be associated with p-values of logrank tests. Note that the clustering methods identified subtypes only using gene expression data; no survival data were introduced for clustering.
Fig. 5.

−log10(p-value) comparison of models with GBM dataset. Each column shows performance with up to four clusters.
We also performed the analyses on ovarian cancer data. The silhouette scores on each clustering methods with ovarian cancer are illustrated in Fig. 6 and listed in Table 4. Most clustering methods also produced the highest silhouette scores with two clusters in ovarian cancer. Although consensus clustering showed the highest silhouette scores, the clusters are extremely biased to one (see Table 5). The average cluster sizes in PACL were 265 and 161 with two clusters. Logrank tests were performed with the ovarian cancer data (see Fig. 7). PACL also showed the lowest p-values on average with two clusters among the benchmark methods in Fig. 7.
Fig. 6.
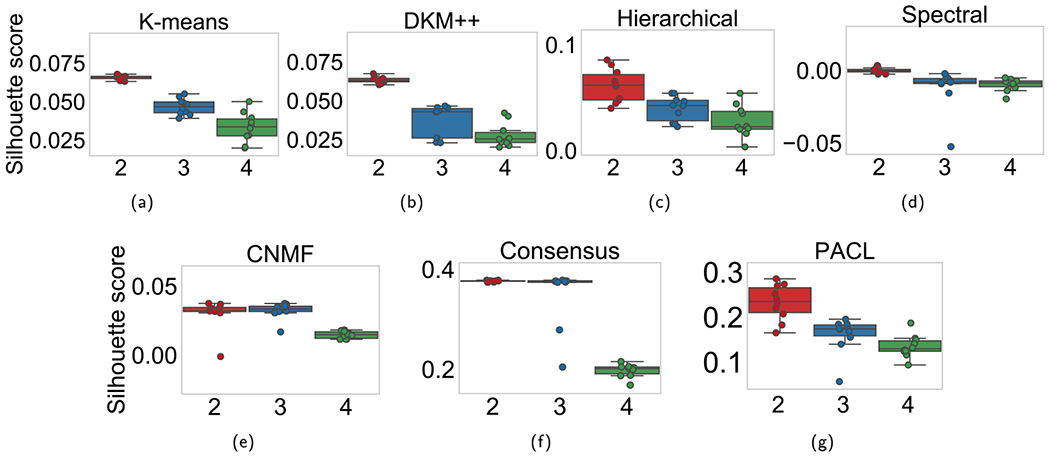
Silhouette scores with two to four clusters with ovarian cancer data. The x-axis shows the number of clusters.
Table 4.
Silhouette scores with two to four clusters with ovarian cancer data.
| Model | Two clusters | Three clusters | Four clusters |
|---|---|---|---|
| K-means | 0.066 ± 0.001 | 0.047 ± 0.004 | 0.034 ± 0.009 |
| DKM + + | 0.064 ± 0.002 | 0.037 ± 0.001 | 0.028 ± 0.007 |
| HC | 0.061 ± 0.015 | 0.04 ± 0.011 | 0.028 ± 0.014 |
| SC | 0.001 ± 0.002 | −0.012 ± 0.013 | −0.01 ± 0.004 |
| CNMF | 0.030 ± 0.011 | 0.032 ± 0.006 | 0.015 ± 0.002 |
| CC | 0.377 ± 0.001 | 0.35 ± 0.056 | 0.198 ± 0.012 |
| PACL | 0.233 ± 0.038 | 0.16 ± 0.038 | 0.135 ± 0.023 |
Table 5.
Average cluster sizes in ovarian cancer.
| Model | Two clusters | Three clusters | Four clusters |
|---|---|---|---|
| K-means | [274.9, 151.7] | [196.5,127.8,101.7] | [151.5,119.9,95.1,67.5] |
| DKM + + | [269.2, 156.8] | [182.6,131.1,112.3] | [143,112,94.9,76.1] |
| HC | [304.9, 121.1] | [216.8,128.3,80.9] | [170.5,113.2,75.3,49.8] |
| SC | [244.4, 181.6] | [198.3,134.2,93.5] | [173.8,115.3,80.6,56.3] |
| CNMF | [225.7, 200.3] | [174.3,144,107.7] | [137.4,108.9,97,82.7] |
| CC | [421.5, 3.8] | [424,1,1] | [423,1,1,1] |
| PACL | [265, 161] | [190.5,152.9,82.4] | [150.9,105.4,30.1,15.3] |
Fig. 7.

−log10(p-value) comparison of models with ovarian cancer dataset. Each column shows performance with up to four clusters.
4. Model interpretation
PACL is a biologically interpretable deep belief network that describes different biological mechanisms of cancer subtypes. Specifically, the nodes in the gene layer and the pathway layer correspond to biological genes and pathways, respectively. The node values in the layers indicate active or inactive status of the biological components, although a sign of the corresponding weight does not show the characteristics of activation or inhibition.
For the model interpretation of PACL, we clustered the entire GBM data into two groups using PACL. The survival distributions of the two subtypes are analyzed by Kaplan-Meier estimator in Fig. 8. The survival distributions over time in the two subtypes were shown significantly different, i.e., logrank test p-value = 0.0013. One cluster shows a long-term survival group (LTS), whereas another cluster indicates a shortterm survival group (STS). The average (and median) of the patients’ survival months of LTS and STS clusters were 18.42 (12.6) and 13.31 (11.9), respectively. In this paper, we discussed with the GBM data only.
Fig. 8.
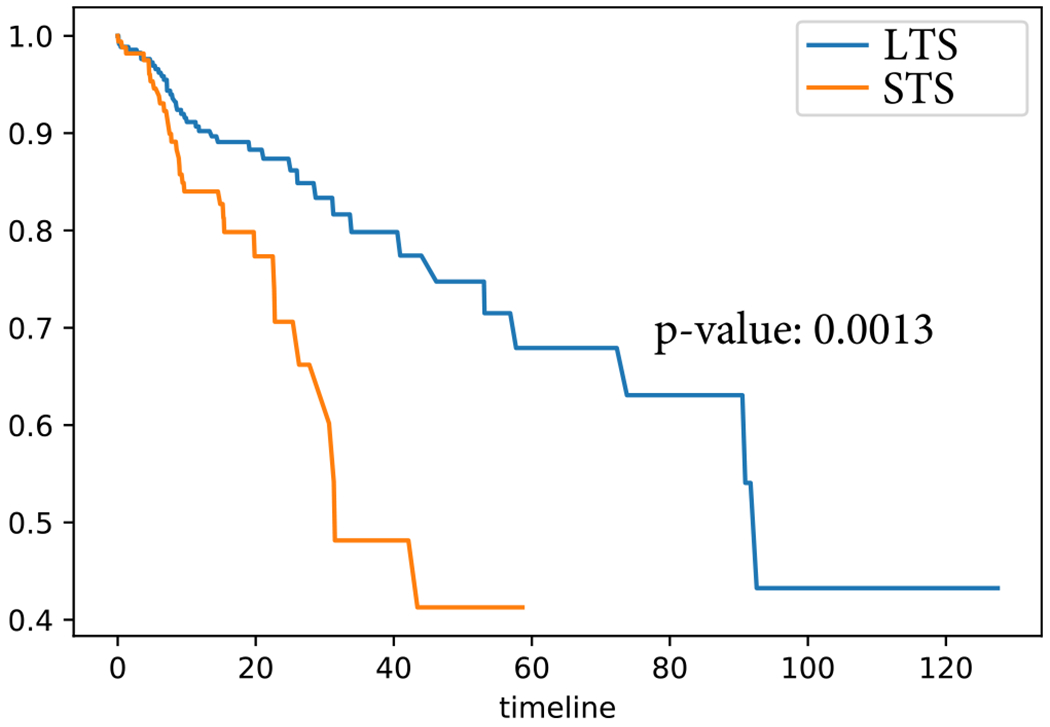
Kaplan-Meier survival curves of two subtypes in GBM.
The last hidden layer (hidden layer 2) and the pathway layer are visualized in Figs. 9 and 10. In Fig. 9a, the 200 nodes in the last hidden layer are sorted by p-values of t-test, which analyzes the differences of samples in two clusters. The lower p-value implies the more differential node values between the two clusters in the layers. Specifically, the high-ranked hidden nodes are shown as active in most patients of LTS cluster, whereas most patients of STS cluster show inactive nodes. The hidden nodes of the two clusters are visualized by the t-SNE plot. The nonlinear associations between PACL’s clusters and survival months are illustrated in Fig. 9b.
Fig. 9.
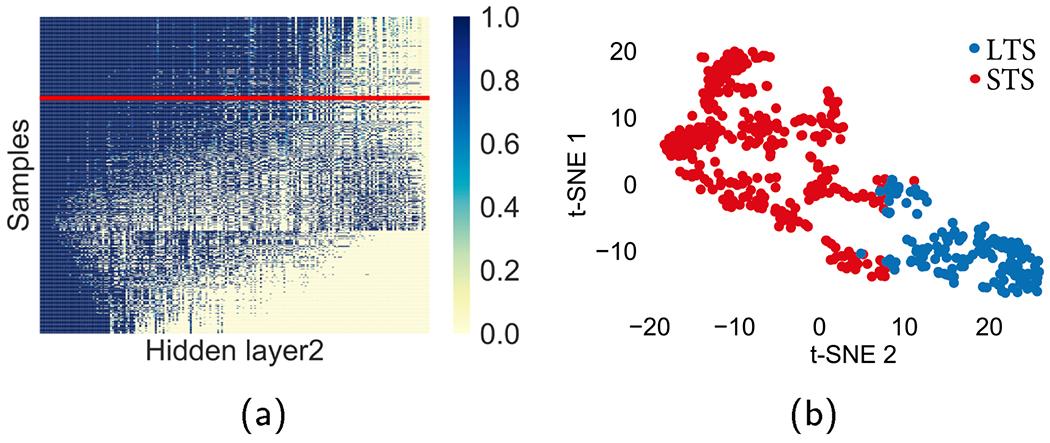
Visualization of the nodes in the last hidden layer. The line in red separates the samples of the two clusters. (For interpretation of the references to colour in this figure legend, the reader is referred to the web version of this article.)
Fig. 10.
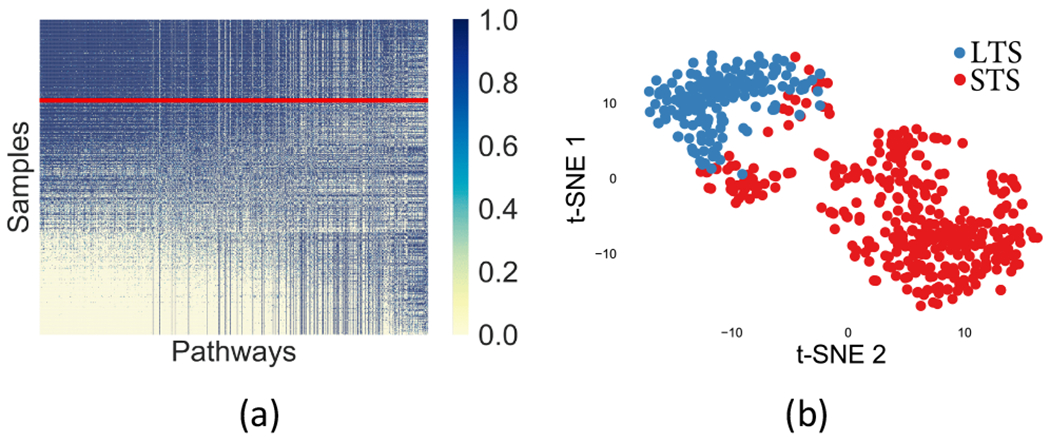
Visualization of the nodes in the pathway layer. The line in red separates the samples of the two clusters.
Similarly, the pathway nodes are also visualized in Fig. 10. The hidden nodes can be considered as prognostic factors, although the hidden nodes do not represent biological processes directly. On the other hand, the pathway nodes can explicitly describe the molecular status of corresponding biological pathways.
Top-ranked pathways by t-test between the two clusters are listed in Table 6. The ten top-ranked pathways include Anaplastic Lymphoma Kinase (ALK) pathway, Angiotensin II Receptor Type 1 (ATR1) pathway, P38 Alpha Beta downstream pathway, aquaporin mediated transport pathway, triglyceride biosynthesis, agrin (AGR) pathway, calcium signaling pathway, regulation of water balance by aquaporins, Vasoactive Intestinal Peptide (VIP) pathway, and DAG and IP3 signaling pathway. Most of these pathways are referred as related pathways in GBM progression in biological literature.
Table 6.
Ten top-ranked pathways in GBM.
| Pathway name | Reference |
|---|---|
| ALK pathway | [17] |
| ATR1 pathway | [10,3] |
| P38 Alpha Beta downstream pathway | – |
| Aquaporin mediated transport pathway | [15,30] |
| Triglyceride biosynthesis | – |
| AGR pathway | [27,32] |
| Calcium signaling pathway | [19] |
| Regulation of water balance by Aquaporins | – |
| VIP pathway | [9] |
| DAG and IP3 signaling pathway | [25,2] |
In particular, ALK is a druggable tyrosine kinase receptor. Preclinical studies reported that ALK pathway is over-expressed in GBM tumorigenesis, so ALK is a potential therapeutic target in GBM [17]. The expression of ATR1 has been reported as being associated with poor prognosis in human astrocytomas in GBM [10,3]. Overexpression of aquaporin (AQP) signaling is associated with multiple types of cancer as a distinctive clinical prognostic factor. Among the six transmembrane aquaporin proteins, the roles of AQP1 and AQP4 in tumor cell migration, invasion and angiogenesis were reported [15]. GBM cells exhibit higher levels of AQP 1 protein comparing to normal brain, and up-regulation of AQP1 provides a therapeutic target [30]. Recent studies reported that AGR correlates with the expression of AQP4 protein [27]. Loss of agrin leads to destruction of blood brain barrier by AQP4 protein and contributes to the regulation, invasion and migration of glioma [32]. Calcium signaling pathway is associated with positive regulator of tumorigenesis in GBM. Thus, manipulating Ca2+ signaling may help in reprogramming the GBM cells, which would either be easier to cure or have no pathological effects [19]. VIP is a major regulatory factor in the central and peripheral nervous systems. Two human GBM cell lines were tested for the effect of both VIP and synthetic VIP antagonists, where it revealed that the VIP-receptor system negatively regulates cell migration [9]. DAG and IP3 pathway activates protein kinase C delta (PKC-delta) enzyme, which further activates epidermal growth factor receptor (EGFR) pathway [2]. A number of studies have supported the involvement of PKC-delta [11] and over expression of EGFR [34] in glioma cells. Thus, inhibition of the DAG and IP3 pathway may reduce the proliferation and survival of glioblastoma cells [25].
5. Conclusion
Identification of molecular subtypes allows one to understand heterogeneous genetic mechanisms of cancer subtypes, each of which may respond to chemotherapy and radiotherapy differently. A number of machine learning techniques have been developed in the last decade to systematically cluster patients into groups based on the genomic profiles. However, most of the conventional clustering methods are based on similarity (or distance) between high-dimensional gene expression data, although they are nonlinearly associated with patients’ survivals. Moreover, most of them lack pathway-based biological interpretation.
In the paper, we proposed a new pathway-based deep clustering method (PACL) that identifies molecular subtypes by incorporating biological pathway databases for pathway-based model interpretation. PACL also provides a biologically interpretable deep belief network that can explicitly describe active/inactive status of genes and pathways. PACL effectively clusters high-dimensional gene expression data, which are nonlinearly associated to patients’ survivals. PACL outperformed the benchmark clustering methods in experiments with GBM and ovarian cancer data. PACL discovered two subtypes in both GBM and ovarian cancer, which show significantly different survival distributions. Then, the optimal model of PACL was interpreted with GBM data, where node values represent active/inactive status of pathways in long/short-term survival groups. The top-ranked ten pathways were further investigated. Most of the pathways have been reported to be associated with GBM progression in biological literature.
Acknowledgments
This research was supported in part by the National Institutes of Health/National Cancer Institute Cancer Center Support Grant (Grant number P30 CA008748).
Footnotes
This paper is an expanded version of a paper entitled “PASCL: Pathway-based Sparse Deep Clustering for Identifying Unknown Cancer Subtypes”, presented at IEEE International Conference on Bioinformatics & Biomedicine (IEEE BIBM 2018), Madrid, Spain, Dec. 3-6 2018 [22].
References
- [1].Alizadeh A, et al. Distinct types of diffuse large B-cell lymphoma identified by gene expression profiling, Nature 403 (6769) (2000) 503–511. [DOI] [PubMed] [Google Scholar]
- [2].An Z, Aksoy O, Zheng T, Fan QW, Weiss WA, 2018. Epidermal growth factor receptor and EGFRvIII in glioblastoma: Signaling pathways and targeted therapies. [DOI] [PMC free article] [PubMed]
- [3].Azevedo H, Fujita A, Bando SY, Iamashita P, Moreira-Filho CA, Transcriptional network analysis reveals that ATI and AT2 Angiotensin II receptors are both involved in the regulation of genes essential for glioma progression, PLoS ONE (2014). [DOI] [PMC free article] [PubMed] [Google Scholar]
- [4].Barretina J, et al. Subtype-specific genomic alterations define new targets for soft-tissue sarcoma therapy, Nat. Genet (2010). [DOI] [PMC free article] [PubMed] [Google Scholar]
- [5].Brunet J-P, Tamayo P, Golub TR, Mesirov JP, Metagenes and molecular pattern discovery using matrix factorization, Proc. Nat. Acad. Sci 2004. [DOI] [PMC free article] [PubMed] [Google Scholar]
- [6].Cai SY, Yang T, Chen Y, Wang JW, Li L, Xu MJ, Gene expression profiling of ovarian carcinomas and prognostic analysis of outcome, J. Ovarian Res. (2015). [DOI] [PMC free article] [PubMed] [Google Scholar]
- [7].Chang Z, et al. eMBI: boosting gene expression-based clustering for cancer subtypes, Cancer Informatics 13 (2) (2014) 105–112. [DOI] [PMC free article] [PubMed] [Google Scholar]
- [8].Chin AJ, Mirzal A, Haron H, Spectral clustering on gene expression profile to identify cancer types or subtypes, Jurnal Teknologi. (2015). [Google Scholar]
- [9].Cochaud S, Chevrier L, Meunier AC, Brillet T, Chadeneau C, Muller JM, The vasoactive intestinal peptide-receptor system is involved in human glioblastoma cell migration, Neuropeptides (2010). [DOI] [PubMed] [Google Scholar]
- [10].Dinh DT, Frauman AG, Johnston CI, Fabiani ME, Angiotensin receptors: distribution, signalling and function, Clin. Sci (2003). [PubMed] [Google Scholar]
- [11].Do Carmo A, Balga-Silva J, Matias D, Lopes MC, 2013. PKC signaling in glioblastoma. [DOI] [PMC free article] [PubMed]
- [12].Drier Y, Sheffer M, Domany E, Pathway-based personalized analysis of cancer, Proc. Nat. Acad. Sci (2013). [DOI] [PMC free article] [PubMed] [Google Scholar]
- [13].Grossman SA, Batara JF, Current management of glioblastoma multiforme, Semin. Oncol 31 (5) (2004) 635–644. [DOI] [PubMed] [Google Scholar]
- [14].Hanif F, Muzaffar K, Perveen K, Malhi SM, Simjee SU, Glioblastoma multi-forme: a review of its epidemiology and pathogenesis through clinical presentation and treatment, Asian Pac. J. Cancer Prev. 18 (1) (2017) 3–9. [DOI] [PMC free article] [PubMed] [Google Scholar]
- [15].Hayashi Y, Edwards NA, Proescholdt MA, Oldfield EH, Merrill MJ, Regulation and function of Aquaporin-1 in Glioma Cells 1, Neoplasia (2007). [DOI] [PMC free article] [PubMed] [Google Scholar]
- [16].Hinton GE, Osindero S, Teh YW, A fast learning algorithm for deep belief nets, Neural Comput. 18 (7) (2006) 1527–1554. [DOI] [PubMed] [Google Scholar]
- [17].Kalamatianos T, Denekou D, Stranjalis G, Papadimitriou E, Anaplastic Lymphoma Kinase in GBM detection diagnostic methods and therapeutic actions. Recent patents on anti-cancer, Drug Discovery 13 (2018) 209–223. [DOI] [PubMed] [Google Scholar]
- [18].Koshiyama M, Matsumura N, Konishi I, Subtypes of ovarian cancer and ovarian cancer screening, Diagnostics (2017). [DOI] [PMC free article] [PubMed] [Google Scholar]
- [19].Leclerc C, et al. Calcium signaling orchestrates glioblastoma development: Facts and conjunctures, Biochimica et Biophysica Acta – Molecular Cell Research (2016). [DOI] [PubMed] [Google Scholar]
- [20].Lehmann BDB, et al. Identification of human triple-negative breast cancer subtypes and preclinical models for selection of targeted therapies, J. Clinical Investigation 121 (7) (2011) 2750–2767. [DOI] [PMC free article] [PubMed] [Google Scholar]
- [21].Lu J, Cowperthwaite MC, Burnett MG, Shpak M, Molecular predictors of long-term survival in glioblastoma multiforme patients, PLOS ONE 11 (4) (2016) e0154313. [DOI] [PMC free article] [PubMed] [Google Scholar]
- [22].Mallavarapu T, Hao J, Kim Y, Oh JH, Kang M, PASCL: Pathway-based Sparse Deep Clustering for Identifying Unknown Cancer Subtypes , 2018 IEEE International Conference on Bioinformatics and Biomedicine (BIBM), December 2018, pp. 470–475. [Google Scholar]
- [23].Mallavarapu T, Kim Y, Oh JH, Kang M, 2017. R-PathCluster: Identifying cancer subtype of glioblastoma multiforme using pathway-based restricted boltzmann machine. In: Proceedings - 2017 IEEE International Conference on Bioinformatics and Biomedicine, BIBM 2017. [Google Scholar]
- [24].Monti S, Tamayo P, Mesirov J, Golub T, Consensus clustering: a resampling-based method for class discovery and visualization of gene expression microarray data, Mach. Learn (2003). [Google Scholar]
- [25].Mound A, et al. Downregulation of type 3 inositol (1,4,5)-trisphosphate receptor decreases breast cancer cell migration through an oscillatory Ca 2+ signal, Oncotarget 8 (42) (2017) 72324–72341 URL: www.impactjournals.com/oncotarget%Awww.impactjournals.com/oncotarget/. [DOI] [PMC free article] [PubMed] [Google Scholar]
- [26].Nidheesh N, Abdul Nazeer KA, Ameer PM, An enhanced deterministic K-Means clustering algorithm for cancer subtype prediction from gene expression data, Comput. Biol. Med (2017). [DOI] [PubMed] [Google Scholar]
- [27].Ponnampalam SN, Kamaluddin NR, Zakaria Z, Matheneswaran V, Ganesan D, Haspani MS, Ryten M, Hardy JA, A blood-based gene expression and signaling pathway analysis to differentiate between high and low grade gliomas, Oncol. Rep (2017). [DOI] [PMC free article] [PubMed] [Google Scholar]
- [28].Psyrri A, Rampias T, Vermorken JB, The current and future impact of human papillomavirus on treatment of squamous cell carcinoma of the head and neck, Ann. Oncol 25 (11) (2014) 2101–2115. [DOI] [PubMed] [Google Scholar]
- [29].Srivastava N, Hinton G, Krizhevsky A, Sutskever I, Salakhutdinov R, Dropout: a simple way to prevent neural networks from overfitting, J. Mach. Learn. Res 15 (2014) 1929–1958. [Google Scholar]
- [30].Tomita Y, Dorward H, Yool AJ, Smith E, Townsend AR, Price TJ, Hardingham JE, 2017. Role of aquaporin 1 signalling in cancer development and progression. [DOI] [PMC free article] [PubMed]
- [31].Van Der Maaten LJP, Hinton GE, Visualizing high-dimensional data using t-SNE, J. Mach. Learn. Res (2008) 9. [Google Scholar]
- [32].Wang X, Lan Y-L, Zhang B, Ma X-C, Lou J-C, The potential roles of aquaporin 4 in malignant gliomas, Oncotarget (2017). [DOI] [PMC free article] [PubMed] [Google Scholar]
- [33].Wu MY, Dai DQ, Zhang XF, Zhu Y, Cancer subtype discovery and biomarker identification via a new robust network clustering algorithm, PLoS ONE (2013). [DOI] [PMC free article] [PubMed] [Google Scholar]
- [34].Xu H, Zong H, Ma C, Ming X, Shang M, Li K, He X, Du H, Cao L, Epidermal growth factor receptor in glioblastoma (Review), Oncol. Lett (2017). [DOI] [PMC free article] [PubMed] [Google Scholar]
- [35].Xu T, Le TD, Liu L, Wang R, Sun B, Li J, Identifying cancer subtypes from miRNA-TFmRNA regulatory networks and expression data, PLoS ONE (2016). [DOI] [PMC free article] [PubMed] [Google Scholar]
- [36].Zhang Z, et al. Molecular subtyping of serous ovarian cancer based on multi-omics data, Sci. Rep 6 (2016) 26001. [DOI] [PMC free article] [PubMed] [Google Scholar]


