
Fig. 1.
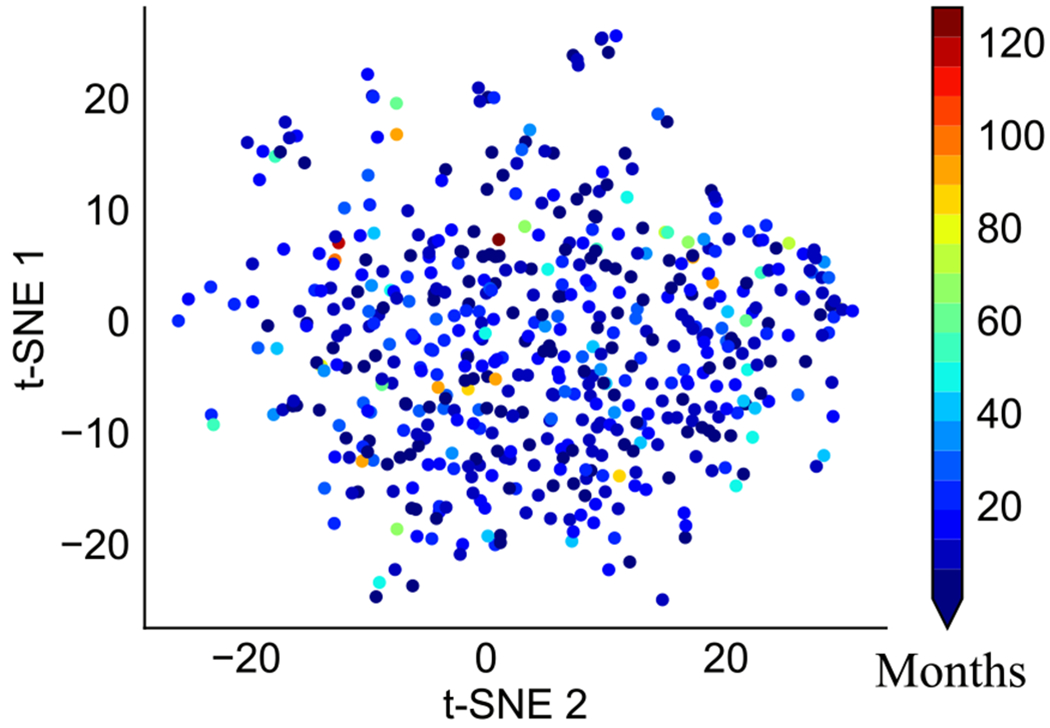
Nonlinear association between gene expression data and survivals in GBM. Red color shows longer survival, whereas blue indicates shorter. (For interpretation of the references to colour in this figure legend, the reader is referred to the web version of this article.)