

Abstract

In this study, the phase change paraffin and metal powder were mixed to form the composite phase change energy-storing material. This composite material was then injected into metal coil tubings at different coil spacings to form a composite phase change energy storage tubing system, which was then embedded in a wall. The thermal performance of the embedded phase change energy storage wall was investigated at various temperatures. The results showed that among the four types of aforementioned walls, the energy storage tubes at a spacing of 20 mm exhibited the smallest heat transfer and the largest surface heat storage coefficients. Therefore, this wall can block heat flow and temperature propagation effectively, and it exhibits excellent thermal insulating and heat storage performances and increased resistance to temperature fluctuations.
1. Introduction
The envelope structure of the building plays the main role of heat exchange between the building and the external environment. The heat loss of the building through the envelope structure accounts for about 70% of the heat loss of the entire system, of which the heat lost through the exterior walls and windows accounts for about 1/2 of the total heat loss.1 Apparently, improvement of the thermal performance of the envelope structure can achieve the purpose of isolating outdoor heat from entering the room in the summer and preventing the indoor heat from leaking out in the winter, so that the indoor temperature of the building can be as close as possible to the comfortable temperature, thereby reducing the heating and cooling loads. It is an effective means to improve the energy efficiency of the building and finally achieve the purpose of building energy saving. Traditional building envelopes generally have poor thermal performance. With the emphasis on building energy conservation, even though the application and research of energy-saving envelope structures have developed to some extent, there are still some issues that urgently need to be resolved, including the following: (1) there is a trade-off between the heat-insulating property and heat-shielding property of thermal insulation materials, (2) the safety of the use of the external insulation system is not guaranteed, and (3) the existence of the thermal bridge causes cracks in the wall. In summary, the traditional building envelope needs to improve the thermal insulating function of the structure, reduce energy loss, and improve thermal comfort.2 The existing novel energy-saving insulation materials have many deficiencies in the application process,3,4 including the following: (1) The extruded polystyrene board has high requirements for the surface of the base layer, and the surface needs further treatment during construction; it needs to be aged for a period of time after production; it has poor adhesion to mortar and can be easy to deform later. (2) Polyurethane rigid foam is greatly affected by the environment during the construction process: the formation and size of the foam are affected by temperature, and the temperature should not be lower than 5 °C. (3) Inorganic thermal insulation mortar has certain water absorption, high thermal conductivity, large capacity, and poor thermal insulation energy-saving effect. (4) Rock wool board has poor cohesive strength, high water absorption, and high construction technology requirements. (5) The production process of the foam glass plate is complicated, and the cost is high. Once expanded and deformed, cracks will form in the plate seam. (6) The price of integrated decorative boards is generally high. Therefore, the combination of phase change material with the building envelope can greatly improve the heat storage performance of the envelope structure, reduce building energy consumption, and achieve energy-saving effects.4 In addition, this combination can also solve the energy supply and demand mismatch in time and space, improve energy efficiency, and reduce equipment operating costs.5
Phase change materials (PCMs) possess very high heat storage capacity and are capable of maintaining a constant temperature during phase change, which makes them the most prominent candidates for solar energy storage systems, heating, and cooling systems. Ali6covered the comparison of two different configuration (square and circular) pin-fin heat sinks embedded with two different phase change materials (PCMs), namely, paraffin wax and neicosane, having different thermophysical properties that were carried out for the passive cooling of electronic devices. Li7 carried out the numerical study of a PCM-filled double glazing to determine the thermophysical properties of PCM for the application of thermal energy storage. Ye8 explored the performance of PCM-based thermal systems through experiment and simulation. The results indicated that excellent thermal control effects can be achieved when the phase change range of PCM brackets the temperature control set point and is consistent with the fluctuation range of the ambient temperature. Prieto9 presented an analysis of the thermal performance of paraffin used as phase change material (PCM) in heat exchangers within a functioning temperature range of 80 and 30 °C. The PCM heat exchangers tested under variable temperatures gave an extensive range for the durations of the phase change process and for the heat transfer rates. Wang10 worked on PCM-based heat sinks combined with copper fibers for the phase change heat transfer enhancement technology. All of the results show the enormous potential of enhancement in the thermal conduction of PCMs. Rehman11studied copper foam (with porosity 97% and pore density 35 pores/in.)-based heat sink without phase change material (PCM), and copper foam/PCM composite heat sinks are investigated to observe the behavior of the operational time of heat sinks with respect to the specific temperature for both charging and discharging. Zhang12 studied the melting behavior of paraffin within copper foam both numerically and experimentally. Conduction and convection are the dominating modes of heat transfer within PCM for solid and liquid, respectively. To realize the self-maintenance of energy, in addition to strengthening the heat preservation and insulation of the enclosure to reduce the energy consumption of the building, the introduction of PCMs into building materials can also help achieve the purpose of energy conservation. This is done by utilizing the endothermic and exothermic properties of the phase change material when the phase change occurs: the latent heat of phase change is stored when the ambient temperature of the phase change material or temperature of other materials in direct contact with the phase change material increases, and the heat is released when the ambient temperature of the phase change material or temperature of other materials in direct contact with the phase change material decreases, thereby reducing the indoor temperature difference change to a certain extent.
However, one single phase change material cannot meet the requirements of high-energy storage efficiency, high-energy storage density, and high-energy storage stability. As a result, the composite phase change material is formed by adding particles with high thermal conductivity to the organic phase change material.13 The composite phase change material has the advantages of good stability and high latent heat of organic materials while avoiding the disadvantage of low-heat absorption and release efficiency of single organic phase change material. Nanoparticles are also added to organic PCMs. Because the nanoparticles are smaller than ordinary particles, they can be distributed more evenly in organic PCMs. Therefore, when the composite phase change material composed of nanoparticles and organic phase change material melts, there will be no particle precipitation phenomenon, which is common among ordinary particles. The building envelope can be combined with the phase change material to construct a phase change heat storage structure with a strong energy storage performance. This structure allows the regulation of the room temperatures inside the building.14−18 A series of studies have been performed by scholars at home and abroad on the phase change energy storage building envelope. For example, Sushobhan,19 Wei,20 and other researchers have investigated the performances of different phase change materials. Specifically, they measured and compared the heat storage performance, phase change latent heat, and thermal conductivity of different types of composite phase change materials with different component ratios. Zhou21 analyzed the performance of building envelopes with the phase change material plates, which were installed at different locations on one of the walls of a building. They further investigated and optimized different parameters of the phase change material, including the phase change temperature, phase change latent heat, thermal conductivity, and surface heat transfer coefficient. Delcroix22 studied the transient characteristics of a phase change heat storage model using numerical simulations. He measured the heat storage time of different materials at the same working condition and developed a heat transfer model of the wall with the enthalpy method. His results showed that the melting process of the solid–liquid phase change material will often result in leakage issues. In addition, the content of the phase change material added in the building wall will also affect the leakage level of the phase change material from the wall. The studies by Akeiber,23 Wang,24 and Jayalath25 focused on the combination of phase change materials with the building envelope. These studies explored the heat transfer process across the phase change building envelope, the indoor temperature regulation performance, and the heat conduction behavior inside the phase change material. Quantitative formulas were developed in these studies to calculate the energy-saving rate of phase change materials. The calculated results based on these formulas showed that the application of composite phase change materials with an optimum phase change temperature in the building envelope can considerably reduce the energy consumption of the building. In addition, the thickness of the phase change material layer and the location at which such a material is integrated in the building envelope play key roles in the determination of the phase change heat storage performance. Zhu26 and Liu27 conducted optimization studies on the material selection and thickness of a double-layer phase change building wall using numerical simulations with a genetic algorithm. Based on their analyses, they obtained the energy-saving performances for different combinations of phase change temperatures and phase change material thicknesses. Tian28 developed energy storage wall plates that contained phase change materials at different contents. They found that the addition of phase change materials in the wall can regulate the temperatures at different nodes and thus allow efficient temperature regulation and improved energy transfer performances. As shown by these studies, the application of phase change materials in building envelopes can provide thermal insulation, temperature regulation, and thermal energy storage functions. However, the existing studies still suffer from the following deficiencies: (1) a low-heat storage capacity of the phase change energy storage material itself, (2) a limited selection of phase change materials, (3) a monotonous integration method with the matrix material, (4) poor compatibility with the building, and (5) a narrow application range. Furthermore, the number of studies on the optimum energy storage performance of the phase change material in combination with the matrix material is still limited. In view of the above limitations, the following solutions are studied: (1) The phase change paraffin and metal powder are mixed to form a composite phase change energy-storing material tube, which was filled into a metal coil with a different coil spacing to form a composite phase change energy-storing tube. (2) The composite phase change energy storage tube is embedded in the wall to form an embedded composite phase change energy storage wall. (3) The heat transfer process of the phase change wall under the alternating temperature conditions in summer is studied. Based on the phase change heat transfer theory, the change law of the characteristic parameters, such as the temperature, heat transfer coefficient, attenuation coefficient delay time, and surface heat storage coefficient of the phase change wall, is obtained. The optimal energy storage effect is obtained after the combination of the phase change material and matrix material.
In light of these issues, the composite phase change material in this study by mixing paraffin with metal powder was developed. This composite material was subsequently injected and filled a metal coil tubing to form a composite phase change energy storage tubing system. Finally, this tubing system was buried inside one of the building’s walls to provide it with the phase change energy storage functionality. The wall embedded with the composite phase change material was tested in a controlled environment at various temperatures. Specifically, the heat transfer process across the phase change wall was explored during the summer season at different temperature conditions. Based on the phase change heat transfer theories, the variation pattern of different characteristic parameters was investigated, including the temperature of the phase change wall, heat transfer coefficient, attenuation multiple, delay time, and the surface heat storage coefficient. Finally, the optimum energy storage performance with the combination of the phase change and the matrix materials was determined.
2. Phase Change Materials
The classification methods of phase change materials (PCMs) are different. According to different chemical compositions of the phase change materials, they could be divided into inorganic phase change materials and organic phase change materials; according to the phase change temperature range, it could be divided into low-temperature phase change materials, medium-temperature phase change materials, and high-temperature phase change materials; according to stored energy characteristics, they could be divided into phase change cold storage materials and phase change heat storage materials; and according to the phase change method, it could be divided into solid–solid phase change materials, solid–liquid phase change materials, solid–gas phase change materials, and liquid–gas phase change materials. However, the solid–gas phase change materials and the liquid–gas phase change materials have a large amount of gas generated during their phase change process, so that the volume of the phase change material changes greatly, and requirements for the packaging container are also higher. Therefore, the solid–liquid phase change materials and solid–solid phase change materials are widely used.29
PCMs differ in characteristics, compositions, and performance features. The selection of a suitable phase change material is the premise for practical engineering.30 In general, PCMs must meet the following requirements:
-
(1)
The phase change material should have a high-energy storage density. The larger the phase change latent heat, the more the energy-storing ability. PCM with good thermal retention and high storage density can be applied in buildings as an effective means of regulating indoor room temperature, which translates to an efficient energy-saving effect.
-
(2)
The phase change material should have a suitable phase change temperature. When PCMs are used in buildings, the phase change temperature must match the local climatic conditions.
-
(3)
The phase change process of the PCMs should be completely reversible and only related to temperature.
-
(4)
The phase change material should have strong thermal conductivity. The higher the thermal conductivity of PCM, the better the heat transfer performance. Higher thermal conductivity is desirable for efficiency in heat release.
-
(5)
Long-term chemical stability. The phase change material should not be easily segregated during the phase change process, to avoid causing changes in its chemical composition; PCMs should also be nontoxic, harmless, noncorrosive, and noncombustible.
-
(6)
The phase change material should have a large density. If both phases of the phase change material have large density, the cost of the container can be reduced.
-
(7)
The vapor pressure of the phase change material on operating the temperature should be low as possible to reduce the containment problems.
-
(8)
The phase change material should have a small change in volume during the phase change process.
-
(9)
The phase change material should have a relatively small degree of subcooling, as well as relatively fast crystallization speed and crystal formation speed.
In the actual selection process, it is very difficult to find a phase change material that fully meets the above conditions. Therefore, priority is given to the two main factors: phase change temperature and latent heat; other factors are subsequently considered, so as to find the appropriate phase change material.
Paraffin is a widely used organic PCM. Because paraffin has many advantages such as large latent heat of phase change, small volume change during phase change, and low price, paraffin is widely used. In addition to choosing a suitable phase transition temperature, the phase change process using paraffin must also consider the problem of heat storage and heat release rate. Due to low thermal conductivity, the heat storage and release rate of paraffin are quite low, which limit its practical applications, so it is necessary to increase the thermal conductivity of paraffin to enhance the heat transfer rate and the utilization coefficient of stored energy.31,32 To improve the thermal conductivity of paraffin, scholars from various countries have conducted some research, including adding high thermal conductivity particles, fibers, or high thermal conductivity porous media to paraffin.33 Highly thermally conductive particles or fibers include nanoparticles, expandable graphite, and carbon fibers. High thermal conductivity porous media include expanded graphite, carbon foam, and metal foam. Adding high thermal conductivity particles to paraffin could enhance the thermal sensitivity of paraffin. However, the density of traditional high thermal conductivity particles is different from that of paraffin; it is easy to settle in molten composite materials, so it is easy to cause the wear of heat exchange equipment in practical applications and bad consequences.34 In response to the above problems, nano-high thermal conductivity particles and paraffin were evenly mixed, and then a certain surfactant was added to form a nano-reinforced heat transfer paraffin phase change material. Nano-reinforced heat transfer paraffin phase change materials have three major advantages. First, the thermal conductivity of nano-high thermal conductivity particles is usually hundreds or even thousands of times that of paraffin, so mixing it with paraffin could significantly improve the thermal sensitivity of paraffin. Second, nanoparticles have a small size effect, and their behavior is close to liquid molecules. They perform random Brownian motion in molten paraffin, overcome gravity, and are not prone to sedimentation, so that the temperature distribution of paraffin composite phase change materials is more uniform and thermal conductivity is stable. At the same time, the continuous random movement of nanoparticles greatly improves the thermal conductivity of paraffin composite phase change materials. Third, the nano-reinforced heat transfer paraffin phase change material contains fewer nanoparticles, so the volume expansion rate of the composite material is still high, which could generate a large driving force and driving displacement.35 Qureshi36discussed some methods in which high thermal conductive nanoparticles, e.g., carbon fibers, carbon nanotubes, graphene nanoplatelets, silver, and aluminum nanoparticles, are added to enhance the thermal conductivity of PCMs. Nanoparticles possess high thermal conductivity as compared to phase change materials. The addition of nanoparticles in the base fluid increases their thermal conductivity, which results in the enhancement of heat transfer rate and utilization coefficient of stored energy.
It has been found that when the mass fraction of added copper nanoparticles is 1%, the thermal conductivity of the composite phase change material in liquid and solid conditions will be increased by 15 and 10%, respectively. When the mass fraction of copper nanoparticles is 2%, the thermal conductivity of the composite phase change material in liquid and solid conditions will be increased by 17.5 and 13.6%, respectively.37 The relationship between thermal conductivity and the mass fraction of copper nanoparticles is shown in Figure 1.
Figure 1.

Relationship between thermal conductivity and the mass fraction of copper nanoparticles.37
The continuous increase in the mass percentage of the metal powder will lead to a decrease in the stability of the system. An excess number of nanoparticles can inhibit the movement of the particles in paraffin, resulting in severe particle agglomeration. Because the Brownian force and van der Waals force of the agglomerates suspended in the fluid are not enough to resist the effect of gravity, settlements are formed, and consequently, the content of copper nanoparticles suspended in the fluid is less than the calculated content when weighing; that is, the content of the effective copper nanoparticles is reduced. In addition, the addition of copper nanoparticles has little effect on the phase change temperature of n-octadecane; while the latent heat of phase change decreases gradually with the increase of the mass fraction of copper nanoparticles, the decrease range is not large, imposing little effect on the heat storage capacity of n-octadecane; with the increase of the number of cycles, there are little variations in the phase change temperature and latent heat of the composite phase change material, and no obvious attenuation is found. The results show that the composite phase change material has good thermal cycle stability. In conclusion, the mass percentage of the metal powder used in this paper is 2%.
3. Test Accuracy
3.1. Accuracy of the Intelligent Environment Simulation System
The environmental temperature and wind speed in the test space were set by the intelligent indoor/outdoor environment simulation system based on the actual meteorological data collected from automatic weather stations. The test period was 72 h, and data were collected every 5 min, with a total of 864 times. To validate the accuracy of the intelligent environment simulation system, the simulated environmental data in the test space with the actual environmental data were compared. The differences are shown in Figure 2.
Figure 2.

Comparison between the actual environmental data and the data set acquired in the test space.
As shown in Figure 2, the average difference between the temperature of the test space and the set temperature is 0.24 °C, while the average difference between the wind speed in the test space and the set wind speed was 0.20 m/s. In terms of the environmental temperature, the data yielded differences in the ranges of 0.4–0.5, 0.3–0.4, 0.2–0.3, 0.1–0.2, and 0–0.1 °C, between the test space temperature and set temperature, which accounted for 19, 18, 20, 23, and 20%, of the total test data, respectively. In terms of the wind speed, the data yielded differences in the ranges of 0.4–0.5, 0.3–0.4, 0.2–0.3, 0.1–0.2, and 0–0.1 m/s between the test space wind speed and the set wind speed data, which accounted for 7, 17, 23, 30, and 23%, of the total test data, respectively. In summary, the error between the values provided by the intelligent simulation system for the indoor/outdoor environments and the actual meteorological data was less than 5%. In other words, the intelligent simulation system exhibited an excellent accuracy response.
3.2. Accuracy of the Test Results
During the heat transfer test of the wall, the major error originated from the error of the measurement device and tools themselves. The errors incurred during the test setup and construction were the contact error between the sensor and the test object, the reading error, and the data-processing error. To minimize the test error as much as possible, a series of approaches had been adopted to handle the systematic errors during the test. These included the calibration of the testing equipment and sensors, the application of vaseline between the heat flow sensor and the wall, and the execution of the experimental test by designated personnel to reduce operational errors. The environmental temperature, wind speed, and wall surface temperature were measured directly during the test. Given that the test was performed in the presence of unsteady conditions, one single data measurement was used as the test result. The error of the test system was primarily caused by the precision error of the temperature sensor, the size and installation position error of the sensor, and the reading error of the data acquisition instrument. For a single test, the result was absolutely random and was associated with a standard uncertainty. The uncertainty of the temperature measurement can be calculated by the uncertainty propagation equation
| 1 |
Herein,  is the precision
error of the sensor. The
temperature sensor had a precision of 0.3 °C, while the average
temperature of the internal surface of the wall was 26 °C. Therefore,
the maximum relative error was 1.2%. Additionally,
is the precision
error of the sensor. The
temperature sensor had a precision of 0.3 °C, while the average
temperature of the internal surface of the wall was 26 °C. Therefore,
the maximum relative error was 1.2%. Additionally,  represents
the size and installation position
error of the sensor. The sensor had a diameter of 6 mm, while the
thickness of the wall was 320 mm. Therefore, the maximum relative
error was 1.88%.
represents
the size and installation position
error of the sensor. The sensor had a diameter of 6 mm, while the
thickness of the wall was 320 mm. Therefore, the maximum relative
error was 1.88%.  is the reading
error of the data acquisition
instrument. The measurement precision of the data acquisition instrument
was 0.1 °C, while the average temperature of the internal surface
of the wall was 26 °C. Therefore, the maximum relative error
was 0.3%. During the test, the temperature at the internal surface
of the wall was minimal and smaller than any other temperature. Therefore,
the temperature measurement of the internal wall yielded the largest
uncertainty among all temperature measurements. Given that this largest
uncertainty was equal to 2.35%, which is less than 10%, the reliability
and accuracy requirement of the test design were satisfied.
is the reading
error of the data acquisition
instrument. The measurement precision of the data acquisition instrument
was 0.1 °C, while the average temperature of the internal surface
of the wall was 26 °C. Therefore, the maximum relative error
was 0.3%. During the test, the temperature at the internal surface
of the wall was minimal and smaller than any other temperature. Therefore,
the temperature measurement of the internal wall yielded the largest
uncertainty among all temperature measurements. Given that this largest
uncertainty was equal to 2.35%, which is less than 10%, the reliability
and accuracy requirement of the test design were satisfied.
4. Results and Discussion
The thermal insulation performance of the wall was primarily reflected by the capability of the wall of the building to block the thermal transport at high-ambient-temperature conditions in the summer season. This capability is often characterized by the internal surface temperature of the wall, the attenuation of the temperature wave, and the delay time.
4.1. Distribution Pattern of Temperature Difference between the Internal and External Surfaces of the Wall
To study the optimal energy storage effect of the composite phase change energy storage wall after the combination of the phase change material and matrix material, this paper compares the thermal performance parameters (phase change wall temperature, heat transfer coefficient, attenuation coefficient, delay time, surface heat storage coefficient) of different structures of the composite phase change energy storage material (different coil spacings). Theoretical analysis of the experimental data of the outer surface temperature, the inner surface temperature, and the inner/outer surface temperature at the same measuring point is conducted to finally obtain the optimal energy storage effect after the combination of the phase change material and the matrix material.
The thermal performance of the embedded composite phase change energy storage wall was tested for a total of 72 h. A total of 144 data points were collected at 0.5 h intervals. The tests were performed on the concrete wall, which did not contain any phase change material and on the walls embedded with phase change energy storage tubes at the spacings of 20, 40, and 60 mm. The temperatures at different test points on the internal and external surfaces of all four concrete walls were measured during the tests. The test results are shown in Figure 3.
Figure 3.

Surface temperatures of the wall at different measurement points.
The following features are revealed in Figure 2 in a single test cycle:
-
(1)
The internal surface temperature of the embedded phase change energy storage wall with a tube spacing of 20 mm is 0.42–1.49 °C higher than that of the embedded phase change energy storage wall with a tube spacing of 40 mm, 0.50–1.54 °C higher than that of the embedded phase change energy storage wall with a tube spacing of 60 mm, and 0.18–0.85 °C higher than that of the masonry wall that did not contain any phase change tubes. In the same single test cycle, the internal surface temperature of the embedded phase change energy storage wall with a tube spacing of 40 mm is 0.14–1.19 °C higher than that of the embedded phase change energy storage wall with a tube spacing of 60 mm and 0.33–1.11 °C higher than that of the masonry wall without any phase change tubes. Finally, the internal surface temperature of the embedded phase change energy storage wall with a tube spacing of 60 mm is 0.38–1.28 °C higher than that of the masonry wall without any phase change tubes.
-
(2)
The external surface temperature of the embedded phase change energy storage wall with a tube spacing of 20 mm is 0.12–1.24 °C higher than that of the embedded phase change energy storage wall with a tube spacing of 40 mm, 0.40–1.19 °C higher than that of the embedded phase change energy storage wall with a tube spacing of 60 mm, and 0.33–0.98 °C higher than that of the masonry wall that did not contain any phase change tubes. In the same single test cycle, the external surface temperature of the embedded phase change energy storage wall with a tube spacing of 40 mm is 0.43–1.19 °C higher than that of the embedded phase change energy storage wall with a tube spacing of 60 mm, and 0.40–1.26 °C higher than that of the masonry wall without any phase change tubes. Finally, the internal surface temperature of the embedded phase change energy storage wall with a tube spacing of 60 mm is 0.35–1.20 °C higher than that of the masonry wall that did not contain any phase change tubes.
4.2. Uncertainty of Measurement
A complete set of measurement results should give not only the measurement values but also their uncertainty. Uncertainty is used to characterize the reliability of the measurement result and reflect the dispersion, accuracy, and reliability of the measurement value. Due to different measurement methods and error sources, there are different types and evaluation methods of uncertainty.38 In the direct measurement method, the uncertainty of type A handles random errors by statistical methods, and the uncertainty of type B handles system errors by nonstatistical methods. Type A standard uncertainty is a component calculated by statistical methods in a series of repeated measurements, and its characteristic value is expressed by the standard deviation of the mean, that is
| 2 |
| 3 |
The uncertainties of the temperature measurement values at different measuring points on the inner and outer surfaces of the wall are shown in Tables 1 and 2.
Table 1. Uncertainties of the Temperature Measurement Values at Different Measuring Points on the Inner Surfaces of the Wall.
| distance
between the adjacent tubes of 20 mm |
distance
between the adjacent tubes of 40 mm |
distance
between the adjacent tubes of 60 mm |
without
tube |
|||||||||||||
|---|---|---|---|---|---|---|---|---|---|---|---|---|---|---|---|---|
| point 1 | point 2 | point 3 | point 4 | point 1 | point 2 | point 3 | point 4 | point 1 | point 2 | point 3 | point 4 | point 1 | point 2 | point 3 | point 4 | |
| N̅ | 28.53 | 28.91 | 28.94 | 28.52 | 28.97 | 28.92 | 28.65 | 28.89 | 29.21 | 28.34 | 28.30 | 28.76 | 29.01 | 28.45 | 29.41 | 29.09 |
| σ | 0.14 | 0.12 | 0.11 | 0.15 | 0.14 | 0.13 | 0.17 | 0.14 | 0.10 | 0.16 | 0.16 | 0.12 | 0.15 | 0.18 | 0.13 | 0.18 |
| UA | 0.012 | 0.010 | 0.010 | 0.012 | 0.012 | 0.011 | 0.014 | 0.012 | 0.008 | 0.014 | 0.013 | 0.010 | 0.012 | 0.015 | 0.011 | 0.015 |
Table 2. Uncertainties of the Temperature Measurement Values at Different Measuring Points on the Outer Surfaces of the Wall.
| distance
between the adjacent tubes of 20 mm |
distance
between the adjacent tubes of 40 mm |
distance
between the adjacent tubes of 60 mm |
without
tube |
|||||||||||||
|---|---|---|---|---|---|---|---|---|---|---|---|---|---|---|---|---|
| point 1 | point 2 | point 3 | point 4 | point 1 | point 2 | point 3 | point 4 | point 1 | point 2 | point 3 | point 4 | point 1 | point 2 | point 3 | point 4 | |
| N̅ | 28.22 | 28.17 | 28.75 | 29.23 | 28.40 | 28.24 | 28.68 | 28.32 | 28.75 | 29.02 | 29.05 | 28.68 | 28.29 | 28.63 | 28.34 | 28.26 |
| σ | 0.16 | 0.17 | 0.12 | 0.09 | 0.14 | 0.14 | 0.13 | 0.14 | 0.14 | 0.12 | 0.11 | 0.14 | 0.18 | 0.14 | 0.15 | 0.15 |
| UA | 0.013 | 0.014 | 0.010 | 0.008 | 0.012 | 0.012 | 0.011 | 0.012 | 0.012 | 0.010 | 0.009 | 0.011 | 0.015 | 0.011 | 0.013 | 0.013 |
According to the calculation results of the uncertainty of the measured surface temperature of the wall surface and the measured value of the external surface temperature, the minimum value of the class A standard uncertainty of the surface temperature of the wall body is 0.008, the maximum value is 0.015, and the average value is. The minimum value of the class A standard uncertainty of the external surface temperature of the wall is 0.008, the maximum value is 0.015, and the average value is 0.012.
The temperature difference between the internal and external surfaces of different walls can be obtained by subtracting the external surface temperature from the internal surface temperature at corresponding locations on the wall. The results are shown in Figure 4.
Figure 4.

Temperature differences between the internal and external surfaces at different test points on the wall.
As shown in Figure 4, the temperature differences between the internal and external surfaces at test points 1, 2, 3, and 4, are in the ranges of 1.74–5.00, 1.79–5.40, 1.62–4.70, and 1.58–3.70 °C, respectively, for the embedded phase change energy storage wall with a tube spacing of 20 mm; 1.60–5.20, 1.70–4.75, 1.74–5.50, and 1.67–4.10 °C, respectively, for the embedded phase change energy storage wall with a tube spacing of 40 mm; 1.53–4.70, 1.59–4.60, 1.57–4.30, and 1.66–3.85 °C, respectively, for the embedded phase change energy storage wall with a tube spacing of 60 mm; and 1.59–5.10, 1.77–5.40, 1.91–4.35, and 1.53–3.45 °C, respectively, for the masonry wall without any phase change energy storage tube.
The average heat transfer coefficient is the main parameter of the thermal performance of the embedded composite phase change energy storage wall, and the temperature differences are the necessary parameters in the calculation formulas of the average heat transfer coefficient (eqs 11–13). In addition, the four measurement points are arranged at different positions on the wall, and the heat transfer process of the wall at different measurement points is different too. Therefore, the test temperature values of different measurement points are different. It is necessary to analyze and compare the temperature differences between different measurement points.
4.3. Attenuation Multiple and Delay Time
Attenuation multiple and delay time are the two basic indicators that reflect the thermal insulating performance of the building wall. These two parameters affect the amplitude and the time of peak occurrence of the surface temperature wave. They are closely related to the thermal properties and structure of the material of the wall.39,40
Attenuation multiple refers to the ratio of the harmonic amplitude of the outdoor integrated temperature or outdoor air temperature to that of the inner surface temperature of the envelope structure.41 The larger the attenuation multiple, under the same outdoor integrated temperature or the harmonics of the outdoor air temperature, the smaller the influence of the air inside the envelope structure, the smaller the fluctuation of the inner air volume, and the more comfortable the indoor thermal environment. It is calculated based on
| 4 |
Delay time refers to the difference between the appearance time of the highest value (or the lowest value) of the temperature harmonics on the inner surface of the envelope structure and the appearance time of the highest value (or the lowest value) of the outdoor integrated temperature or the outside air temperature harmonics.31 The length of this time reflects the delay of the wall’s thermal response to the heat transferred from the outdoor to the indoor. The shorter the delay time, the easier it is for the heat from the wall to enter the room early, causing discomfort to the indoor thermal environment.
The calculation results of the attenuation multiple and delay time are listed in Table 3.
Table 3. Attenuation Coefficient and Delay Time Calculation Results of Different Structural Walls.
| wall structure | amplitude of the temperature wave at the surface of the wall (°C) | attenuation multiple | delay time (h) |
|---|---|---|---|
| embedded phase change energy storage wall with a tube spacing of 20 mm | 2.14 | 3.76 | 8.5 |
| embedded phase change energy storage wall with a tube spacing of 40 mm | 2.24 | 3.60 | 6.2 |
| embedded phase change energy storage wall with a tube spacing of 60 mm | 2.45 | 3.29 | 4.6 |
| masonry wall that did not contain any phase change energy storage tubes | 2.74 | 2.94 | 2.3 |
For the same testing conditions, the attenuation multiples of the embedded phase change energy storage wall with tube spacings of 20, 40, and 60 mm are 3.76, 3.60, and 3.29, respectively. The attenuation multiple of the masonry wall, which did not contain any phase change energy storage tubes, was 2.94. Comparison of these values showed that the attenuation multiples of the embedded phase change energy storage wall with the tube spacings of 20, 40, and 60 mm were 28.1, 22.5, and 12.0% higher than those of the masonry wall that did not contain any phase change energy storage tubes. In addition, the delay times of the embedded phase change energy storage wall with tube spacings of 20, 40, and 60 mm were approximately 8.5, 6.2, and 4.6 h, respectively. The delay time of the masonry wall, which did not contain any phase change energy storage tubes, was approximately 2.3 h. Comparison of these values showed that the delay time of the masonry wall, which did not contain any phase change energy storage tubes, was increased by 6.2, 3.9, and 2.3 h, after the embedding of the phase change energy storage tubes with tube spacings of 20, 40, and 60 mm, respectively.
4.4. Average Heat Transfer Coefficient
The heat transfer coefficient means the heat transferred by the unit area in unit time under the steady-state condition when the air on both sides of the envelope is the unit temperature difference. The heat transfer coefficient and heat transfer resistance are reciprocal.41
The process of heat transfer from the outdoor environment to indoor environment through the wall was divided into three stages:42
-
(1)
The mode of heat transfer from the outdoor environment to exterior wall surface was by air convection heat transfer and radiation heat transfer between objects.
-
(2)
The mode of heat transfer from the exterior wall surface to interior wall surface was heat conduction between solids.
-
(3)
The mode of heat transfer from the interior wall surface to indoor air was by air convection heat transfer and radiation heat transfer.
Generally, the wall was composed of multiple layers of materials, and the heat transfer process is shown in Figure 5.
Figure 5.
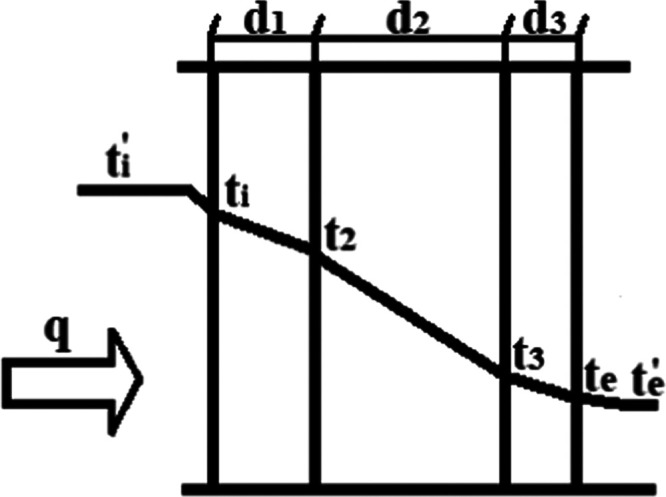
Heat transfer process of the wall.
In the heat transfer process of the wall, it is assumed that the temperature of the interior wall surface ti and the exterior wall surface te remains constant with the change of time. According to the heat transfer theory, the heat flow intensities q1, q2, and q3 through each layer could be, respectively, obtained from the following equations
| 5 |
| 6 |
| 7 |
Herein, λi is the thermal conductivity of each material layer [W/(m·K)], and di is the thickness of each material layer (mm).
Since the exterior and interior wall surfaces are in direct contact with the indoor and outdoor air, the heat flux intensity of the wall surface under the combined action of convective and radiation heat transfer could be calculated from the following equations
| 8 |
| 9 |
Herein, qi is the heat flux intensity of the interior wall surface (W/m2), αi is the heat transfer coefficient of the interior wall surface [W/(m2·K)], ti′ is the indoor air temperature (°C), ti is the temperature of the interior wall surface (°C), qe is the heat flux intensity of the exterior wall surface (W/m2), αe is the heat transfer coefficient of the exterior wall surface [W/(m2·K)], te′ is the outdoor air temperature (°C), and te is the temperature of the exterior wall surface (°C).
In one-dimensional stable heat transfer, q = qi = q1 = q2 = q3 = qe, and by arranging the above equation, we could get the following formula
| 10 |
Herein, q is the intensity of heat flow through the wall (W/m2).
 is the heat transfer resistance
of the
wall (m2·K/W). It represents the resistance of heat
from one side of the wall to the other.
is the heat transfer resistance
of the
wall (m2·K/W). It represents the resistance of heat
from one side of the wall to the other.
 is the heat transfer coefficient of the
wall [(W/(m2·K)]. It represents the heat transfer
per unit area of the wall in unit time at ti′ – te′ = 0 °C.
is the heat transfer coefficient of the
wall [(W/(m2·K)]. It represents the heat transfer
per unit area of the wall in unit time at ti′ – te′ = 0 °C.
In unsteady states, the average heat transfer coefficient should be calculated using the arithmetic mean of the heat fluxes measured at the internal and external surfaces of the wall. The average heat transfer coefficient of the wall can be calculated from the following equations
| 11 |
| 12 |
| 13 |
Herein, K′ is the average heat transfer coefficient [W/(m2·K)] calculated using the arithmetic mean of the heat fluxes, ti (°C) is the internal surface temperature of the wall, te (°C) is the external surface temperature of the wall, qi (W/m2) is the heat flux intensity of the interior wall surface, qe (W/m2) is the heat flux intensity of the exterior wall surface, and k is the time span.
The average heat transfer coefficients of different phase change walls were calculated based on the experimental test measurements. The results showed that the average heat transfer coefficients of the embedded phase change energy storage wall with tube spacings of 20, 40, and 60 mm were 0.48, 0.59, and 0.67 W/(m2·K), respectively. The average heat transfer coefficient of the masonry wall, which did not contain phase change energy storage tubes, was 0.87 W/(m2·K). Therefore, the embedded phase change energy storage wall with a tube spacing of 20 mm exhibited the smallest heat transfer coefficient among the four walls tested in our study. In other words, this wall has the capacity to block thermal flow and temperature propagation. These attributes are indicative of the excellent thermal insulating and heat storage performances.
4.5. Surface Heat Storage Coefficient of the Wall
The surface heat storage coefficient of the peripheral envelope structure refers to the ratio of the fluctuation amplitude of the surface heat flow of the material layer to the fluctuation amplitude of the surface temperature when the material layer or the envelope structure with limited thickness is subjected to harmonic heat. It measures the thermal response performance of the wall structure toward harmonic heat waves. The surface heat storage coefficient S of the wall is calculated as the ratio between the amplitude of the heat wave Aq and the amplitude of the temperature wave Aθ measured on the wall surface that absorbs the harmonic heat wave.43,44 The calculation of this coefficient is based on the below equation
| 14 |
Herein, Aq (°C) is the amplitude of the heat flow wave at the surface of the wall, and Aθ (°C) is the amplitude of the temperature wave at the surface of the wall. The amplitude of the heat flow wave at the surface of the wall means the differences between the maximum and minimum heat flows on the wall surface. The amplitude of the temperature wave at the surface of the wall means the differences between the maximum and minimum temperatures of the wall surface.31 Based on the simulated results, the amplitude of the heat flow wave on the simulated wall surface at a set periodic boundary condition was calculated. Furthermore, the surface heat storage coefficient of the wall was calculated based on eq 6. The calculated results are listed in Table 4.
Table 4. Surface Heat Storage Coefficient Calculation Results of Different Structural Walls.
| wall structure | the amplitude of the heat wave [W/(m2·K)] | the temperature wave (°C) | Surface heat storage coefficient [W/(m2·K)] |
|---|---|---|---|
| embedded phase change energy storage wall with a tube spacing of 20 mm | 3.40 | 4.05 | 0.86 |
| embedded phase change energy storage wall with a tube spacing of 40 mm | 3.50 | 4.05 | 0.74 |
| embedded phase change energy storage wall with a tube spacing of 60 mm | 2.60 | 4.05 | 0.69 |
| masonry wall that did not contain any phase change energy storage tubes | 2.80 | 4.05 | 0.64 |
Based on the calculated results, the surface heat storage coefficients of the embedded phase change energy storage wall with tube spacings of 20, 40, and 60 mm were 0.86, 0.74, and 0.69 W/(m2·K), respectively. The surface heat storage coefficient of the masonry wall, which did not contain any phase change heat storage tubes, was 0.64 W/(m2·K). Comparison of these values showed that embedding the phase change energy storage tubes at the spacings of 20, 40, and 60 mm within the wall yielded enhancements of the surface heat storage coefficient of the masonry wall of the order of 34.3, 15.6, and 7.8%, respectively, compared to the cases in which the wall did not contain any phase change heat storage tubes. These results indicate that the embedded phase change energy storage wall with a tube spacing of 20 mm yielded the largest surface heat storage coefficient and the highest resistance to temperature fluctuations.
4.6. Economic Benefit Evaluation
4.6.1. Output Benefit
To study the economic benefits of the composite phase change energy storage wall, the system recovery period of the composite phase change energy storage wall with a coil spacing of 20 mm is mainly considered because the cost of the composite phase change energy storage wall with a coil spacing of 20 mm is higher than that of the composite phase change energy storage wall with coil spacings of 40 mm and 60 mm and that of the aerated concrete block wall without a coil.
Combined with the wall heat transfer coefficient of different structures calculated above, the system recovery period is calculated for the construction of the composite phase change energy storage wall of the same size as the test building with 20 mm in the south direction and the aerated concrete block wall without a coil in the three other directions.
According to “Design Standard for Energy Efficiency of Residential Buildings in Hot Summer and Cold Winter Zone”45 and “Standard for Design of Heating, Ventilation and Air Conditioning for Civil Buildings”,46 the annual heat and cold loads of the buildings are calculated. The head and cold load calculation processes are as follows:
-
(1)Heat consumption of building QH
Of which, QH is the heat consumption of the building, W; QHT is the heat loss through heat transfer through the envelope, W; QINF is the air penetration heat dissipation, W; and QIH is the heat gained inside the building, and the value of the residential buildings is 3.80 W/m2.
15 -
①Heat loss through heat transfer through the envelope QHT
Of which, QHT is the heat loss through heat transfer through the envelope, W; tm is the average outdoor temperature during the period, and the value is 284.25 K; ti is the calculated indoor air temperature, and the value is 297 K; εi is the correction factor of the heat transfer coefficient of each envelope structure; Ki is the heat transfer coefficient of each envelope, W/(m2·K); and Fi is the area of each envelope, m2.
16 -
②Air penetration heat dissipation QINF
Of which, QINF is the air penetration heat dissipation, W; Cp is the specific heat capacity of air, and the value is 0.28 W·h/(kg·°C); ρ is the density of air, and the value of tm is 1.197 kg/m3; N is the ventilation time, and the value is 0.5 number/h; and V is the ventilation volume, and the value is 50.4 m3/number.
17
-
①
-
(2)Building cooling load CLWq, CLWm

18
Of which, CLWq is the hourly cooling load caused by heat transfer from the external walls, W; CLWm is the hourly cooling load due to roof heat transfer, W; CLwc is the hourly cooling load due to heat transfer from the outside windows, W; K is the heat transfer coefficient of the exterior wall, roof, or window, W/(m2·K); F is the heat transfer area of the exterior wall, roof, or window, m2; twlq is the calculated temperature of the hourly cooling load on the exterior wall, °C; twlm is the calculated temperature of the hourly cooling load on the roof, °C; and tn is the design temperature of the air-conditioned area in summer, °C.
19
According to “Standard for Design of Heating, Ventilation and Air Conditioning for Civil Buildings”,46 the average number of days for heating in hot summer and cold winter zones is 92 days; the average daily time is 8:00–24:00; the average number of days for cooling in this zone is 123 days, from 12:00 to 20:00 every day; the building heat load and building cold load obtained by formulas 9–eq 6 are then used to calculate the annual heating and cooling capacities of the building, where the coefficient of performance (COP) of the air conditioner takes the value of 3. According to the charging standard for the domestic electricity of 0.6 yuan/(kW·h), the results of output benefits are shown in Table 5.
Table 5. Output Benefits of the Buildings.
| composite phase change energy storage wall building with a 20 mm pipe spacing | aerated concrete block wall building without the coil | |
|---|---|---|
| cooling capacity, QH (W) | 248.3 | 524.4 |
| electricity consumption (kW·h) | 152.0 | 320.9 |
| electricity charge (yuan) | 91.2 | 192.5 |
| heat output, QH (W) | 343.17 | 386.4 |
| electricity consumption (kW·h) | 505.14 | 568.78 |
| electricity charge (yuan) | 303.08 | 341.27 |
The power consumption and electricity cost of the composite phase change energy storage wall building with a 20 mm pipe spacing are compared with those of the aerated concrete block wall building without the coil. The result indicates that the electricity cost of heating and cooling is 394.28 yuan for the former and 533.87 yuan for the latter; the output benefit of the composite phase change energy storage wall building with a 20 mm pipe spacing is 139 yuan.
4.6.2. Input Cost
The investment cost of the composite phase change energy storage wall with a 20 mm pipe spacing mainly includes 330 yuan for stainless steel with a 20 mm pipe spacing, 120 yuan for welding auxiliary materials, 60 yuan for welding auxiliary materials, 21.1 yuan for the cost of materials of 1.63 kg, and 20 yuan for the cost of the copper powder of 0.2 kg, adding up to a total of 551 yuan.
4.6.3. System Payback Period47
-
(1)Net present value (NPV)
Of which, i is the discount rate; CI is the cash inflow amount; CO is the cash outflow; and (CI-CO)t is the cash flow for year t.
20 If the net present value is greater than zero after calculation, the project is feasible.
-
(2)Benefit–cost ratio (B/C)
Of which, PVB is the present value of benefit and PVC is the present value of cost.
21 The project is feasible if the calculated cost–benefit ratio is greater than 1.
-
(3)Investment recovery period (T)
It is calculated that the investment recovery period of the composite phase change energy storage wall with a 20 mm pipe spacing is 5.23 years.
22
5. Conclusions
To study the optimal energy storage effect of the composite phase change energy storage wall after the combination of the phase change material and matrix material, this paper compares the thermal performance parameters (phase change wall temperature, heat transfer coefficient, attenuation coefficient, delay time, surface heat storage coefficient) of different structures of the composite phase change energy storage material (different coil spacings). Theoretical analysis of the experimental data of the outer surface temperature, the inner surface temperature, and the inner/outer surface temperature at the same measuring point is conducted to finally obtain the optimal energy storage effect after the combination of the phase change material and the matrix material, which solves the problems of the traditional phase change energy storage material to a certain extent, such as the low-heat storage capacity, the lack of types, the single combination mode with the matrix material, the poor matching performance, and the lack of a wide range of use. The following conclusions were drawn based on this study subject to the same testing conditions:
-
(1)
When tube spacings of 20, 40, and 60 mm were used, the differences between the internal and external surface temperatures of the embedded phase change energy storage wall were 3.28, 3.19, and 3.14 °C, respectively. In the cases at which there were no phase change energy storage tubes, the average temperature difference between the internal and external surfaces of the masonry wall was 2.98 °C.
-
(2)
The attenuation multiple of the masonry wall, which did not contain any phase change energy storage tubes, was improved by 28.1, 22.5, and 12.0%, after the phase change energy storage tubes were embedded at the tube spacings of 20, 40, and 60 mm, respectively.
-
(3)
The delay time of the masonry wall, which did not contain any phase change energy storage tubes, was increased by 6.2, 3.9, and 2.3 h, after the phase change energy storage tubes were embedded at the tube spacings of 20, 40, and 60 mm, respectively.
-
(4)
The embedded phase change energy storage wall at the tube spacing of 20 mm yielded the smallest heat transfer coefficient and the largest surface heat storage coefficient among all of the four walls. Therefore, this wall possessed the capability to block heat flow and temperature propagation, which represents excellent thermal insulating and heat storage performances, as well as increased resistance to temperature fluctuations.
-
(5)
It is calculated that the investment recovery period of the composite phase change energy storage wall with a 20 mm pipe spacing is 5.23 years.
6. Experimental Details
6.1. Composite Phase Change Material
In the experiment, the composite phase change material was composed of n-octadecane mixed with copper nanoparticles, of which the mass fraction of copper nanoparticles is 2%. The copper nanoparticles are spherical nanoparticles produced by Shanghai Huzheng Nano Technology Co., Ltd., and the particle size of the copper nanoparticles is 40 nm. The phase change material is n-octadecane produced by Sinopharm Chemical Reagent Co., Ltd. In the preparation of composite phase change materials, the chemical and physical dispersion methods were combined to reduce the time and energy required for dispersion of the copper nanoparticles, adjust the mobility of the copper nanoparticles, and prevent aggregation of the copper nanoparticles. The dispersant was Span-80 (chemically pure) produced by Xilong Scientific Co., Ltd. In addition, the weight of the dispersant is 5% of the weight of copper nanoparticles.
6.2. Test Space
The test space is made of poly(vinyl chloride) (PVC) hard plastic double-layer skin, and the insulation material filled with foamed polyurethane is used to build a temperature-controlled space of 5000 mm × 2305 mm × 1999 mm. A 1708 mm × 1999 mm embedded composite phase change energy storage wall is built in the middle, and a 500 mm × 1730 mm small door is installed to achieve space separation. The composite phase change material is filled into the composite phase change energy storage coil, which is welded by multiple horizontal stainless steel short pipes with the same spacing and stainless steel short pipes at both ends in a vertical direction. The cross-sectional area of the stainless steel short pipe is 10 mm × 20 mm, the length of the horizontal short pipe is 760 mm, the height of the short tube in the vertical direction is 800 mm, and the length of the composite phase change energy storage coil formed by short tube welding is 800 mm × 800 mm. Composite phase change energy storage coils of the same size and horizontal short tube spacings of 20, 40, and 60 mm are embedded in the matrix material of the composite phase change energy storage wall in four areas to form four different heat transfer areas. A polystyrene board with a thermal conductivity of 0.028 W/(m·K) is used to achieve separation so that the heat transfer processes between different regions are not affected by and independent of each other. The embedded composite phase change energy storage wall has a size of 1708 mm × 1999 mm, the base material is an aerated concrete block, and the block size is 600 mm × 300 mm × 150 mm. The embedded composite phase change energy storage wall and test space are shown in Figure 6.
Figure 6.

Schematic diagram of the test space.
6.3. Layout of the Test Points
To measure the heat transfer coefficient of the entire wall accurately, the heat flow meter and thermocouples must be installed at different locations on the embedded phase change energy storage wall. The test points 1#, 2#, 3#, and 4# were located at the horizontal gray gap, the T-shaped gray gap, the vertical gray gap, and the center of the aerated concrete block, respectively. Figure 7 shows the layout of the test points.
Figure 7.

Layout map of the temperature measurement points on the surface of the wall.
6.4. Test Equipment and Instruments
Judging whether the thermal performance of the building envelope meets the standard requirements could not only rely on theoretical analysis but also requires on-site inspection. Instead, the on-site test plays a more important role in the evaluation of thermal performance. In this study, the environmental temperature (°C), environmental wind speed (m/s), external wall surface temperature (°C), internal wall surface temperature (°C), temperature difference between the wall’s external and internal surfaces (°C), and the heat flux through the wall Q (W/m2) were measured, with the use of temperature, heat flux, wind speed sensors, and a high-resolution data logging device. The detailed parameters of instruments used to measure the thermal performance of the embedded composite phase change energy storage wall are listed in Table 6.
Table 6. Specific Parameters of the Test Instrument.
| test instrument parameter | model | parameter |
|---|---|---|
| detection instrument with high precision | R708 | acquisition of the temperature data of 48 channels and the heat flow data of 16 channels; accuracy: ±0.2% F.S. |
| wind speed sensor | YGC-FS | test range: 0–70 m/s; resolution: 0.1 m/s; accuracy: ±(0.3 ± 0.03 V) m/s |
| temperature sensor | YGC-QW | temperature range: −50–100 °C; resolution: 0.1 °C; accuracy: ±0.3 °C |
| heat flux sensor | MF-200 | test range: 0–2000 W/m2; resolution: 1 W/m2; accuracy: ±2% |
6.5. Setting of the Test Environment
When the heat transfer characteristics are tested across the phase change wall, a sufficient temperature difference must be maintained on the two ends of the wall to provide a temperature interaction environment. In our test, one side of the wall was set at a constant temperature, while the other side was set to have a varying temperature. This environmental setting can emulate the heat transfer process across the phase change wall at various ambient temperature conditions during the summer season.
6.5.1. Setting of Constant Temperatures
One side of the embedded composite phase change energy storage wall was used to emulate the indoor environment. The temperature in this region was controlled at a preset value with an accuracy of ±1 °C by a household air-conditioning unit with 1 hp rating. This ensured an increased accuracy regarding the thermal performance test of the wall. Specifically, the temperature of the room was set at a constant value of 26 °C by the air-conditioning unit and was representative of a typical room environment in the summer season.
6.5.2. Setting of Varying Temperatures
The other side of the embedded composite phase change energy storage wall was used to emulate the outdoor environment. The outdoor environment was established at different working conditions with the use of an intelligent simulation system for the indoor/outdoor environments. In this study, the advanced NA227 temperature control system was used to regulate the outdoor temperature precisely with an accuracy of 0.1 °C. A cyclic temperature change, which was representative of the summer season, was imposed on the outdoor environment with a period of 24 h. Considering the variation pattern of air temperature at the external surface of the wall and the feasibility of temperature control in our test, the air temperature at the external surface of the wall was simplified and corrected based on the loading temperature. The range of the temperature variation was set in the range of 20–40 °C to emulate the real changes of the outdoor air temperature.
Glossary
Abbreviations

precision error of the sensor

size and installation position error of the sensor

reading error of the data acquisition instrument
- K′
average heat transfer coefficient, W/(m2·K)
- ti
temperature of the interior wall surface, °C
- λi
thermal conductivity of each material layer, W/(m·K)
- di
thickness of each material layer, mm
- αi
heat transfer coefficient of the interior wall surface, W/(m2·K)
- ti′
indoor air temperature, °C
- αe
heat transfer coefficient of the exterior wall surface, W/(m2·K)
- te′
outdoor air temperature, °C
- q
intensity of heat flow through the wall, W/m2
- te
temperature of the exterior wall surface, °C
- qi
heat flux intensity of the interior wall surface, W/m2
- qe
heat flux intensity of the exterior wall surface, W/m2
- Aq
amplitude of heat flow wave at the surface of the wall, °C
- Aθ
amplitude of the temperature wave at the surface of the wall, °C
- QH
heat consumption of the building, W
- QHT
heat loss through heat transfer through the envelope, W
- QINF
air penetration heat dissipation, W
- QIH
heat gained inside the building
- QHT
heat loss through heat transfer through the envelope, W
- tm
average outdoor temperature during the period; the value is 284.25 K
- ti
calculated indoor air temperature; the value is 297 K
- εi
correction factor of the heat transfer coefficient of each envelope structure;
- ki
heat transfer coefficient of each envelope, W/(m2·K)
- Fi
area of each envelope, m2
- QINF
air penetration heat dissipation, W
- Cp
specific heat capacity of air; the value is 0.28 W·h/(kg·°C)
- ρ
density of air; the value of te is 1.197 kg/m3
- N
ventilation times; the value is 0.5 number/h
- V
ventilation volume; the value is 50.4 m3/number
- CLWq
hourly cooling load caused by heat transfer from external walls, W
- CLWm
hourly cooling load due to roof heat transfer, W
- CLwc
hourly cooling load due to heat transfer from the outside windows, W
- K
heat transfer coefficient of the exterior wall, roof, or window, W/(m2·K)
- twlq
calculated temperature of the hourly cooling load on the exterior wall, °C
- twlm
calculated temperature of the hourly cooling load on the roof, °C
- tn
design temperature of the air-conditioned area in summer, °C
- i
discount rate
- CI
cash inflow amount
- CO
cash outflow
- (CI-CO)t
cash flow for year t
- PVB
present value of benefit
- PVC
present value of cost
Author Contributions
Conceptualization, R.D. and L.S.; methodology, R.D.; writing-original draft, R.D.; writing-review and editing, F.Y. and B.L.; and formal analysis, F.Y. and B.L. All of the authors have read and approved the final manuscript.
This research was funded by the Natural Science Foundation Youth Fund Project of Zhejiang under Grant no. LQ19E080019, the Basic Industrial Science and Technology Project of Wenzhou under Grant no. G20190025, and the Basic Industrial Science and Technology Project of Wenzhou under Grant no. S20150010.
The authors declare no competing financial interest.
References
- Wang R. G.; Shen T. X.. Renewable Energy Utilization and Building Energy Efficiency, 1st ed.; Mechanical Industry Press: Beijing, 2005. [Google Scholar]
- Villasmil W.; Fischer L. J.; Worlitschek J. A review and evaluation of thermal insulation materials and methods for thermal energy storage systems. Renewable Sustainable Energy Rev. 2019, 103, 71–84. 10.1016/j.rser.2018.12.040. [DOI] [Google Scholar]
- Meng D.Preparation and Building Energy Conservation Application of Form-Stable Phase Change Material; Dalian University of Technology: Dalian, 2010. [Google Scholar]
- Xie W. P.; Wang N.; Zhu D. S. Review of heat transfer enhancement of the PCMs. Chem. Ind. Eng. Prog. 2008, 27, 190–195. [Google Scholar]
- Huang X.; Alva G.; Jia Y.; Fang G. Morphological characterization and applications of phase change materials in thermal energy storage: A review. Renewable Sustainable Energy Rev. 2017, 72, 128–145. 10.1016/j.rser.2017.01.048. [DOI] [Google Scholar]
- Ali H. M.; Arshad A.; Jabbal M.; Verdin P. G. Thermal management of electronics devices with PCMs filled pin-fin heat sinks: A comparison. Int. J. Heat Mass Transfer 2018, 117, 1199–1204. 10.1016/j.ijheatmasstransfer.2017.10.065. [DOI] [Google Scholar]
- Li D.; Li Z. W.; Zheng Y. M.; Liu C. Y.; Hussein A. K.; Liu X. Y. Thermal performance of a PCM-filled double-glazing unit with different thermophysical parameters of PCM. Sol. Energy 2016, 133, 207–220. 10.1016/j.solener.2016.03.039. [DOI] [Google Scholar]
- Ali H. M.; Ashraf M. J.; Giovannelli A.; Irfan M.; Irshad T. B.; Hamid H. M.; Hassan F.; Arshad A. Thermal management of electronics: An experimental analysis of triangular, rectangular and circular pin-fin heat sinks for various PCMs. Int. J. Heat Mass Transfer 2018, 123, 272–284. 10.1016/j.ijheatmasstransfer.2018.02.044. [DOI] [Google Scholar]
- Prieto M. M.; Suárez I.; González B. Analysis of the thermal performance of flat plate PCM heat exchangers for heating systems. Appl. Therm. Eng. 2017, 116, 11–23. 10.1016/j.applthermaleng.2017.01.065. [DOI] [Google Scholar]
- Wang H.; Wang F.; Li Z.; Tang Y.; Yu B.; Yuan W. Experimental investigation on the thermal performance of a heat sink filled with porous metal fiber sintered felt/paraffin composite phase change material. Appl. Energy 2016, 176, 221–232. 10.1016/j.apenergy.2016.05.050. [DOI] [Google Scholar]
- Rehman T.; Ali H. M.; Saieed A.; Pao W.; Ali M. Copper foam/PCMs based heat sinks: An experimental study for electronic cooling systems. Int. J. Heat Mass Transfer 2018, 127, 381–393. 10.1016/j.ijheatmasstransfer.2018.07.120. [DOI] [Google Scholar]
- Zhang P.; Meng Z. N.; Zhu H.; Wang Y. L.; Peng S. P. Melting heat transfer characteristics of a composite phase change material fabricated by paraffin and metal foam. Appl. Energy 2017, 185, 1971–1983. 10.1016/j.apenergy.2015.10.075. [DOI] [Google Scholar]
- Feng D.; Feng Y.; Qiu L.; et al. Review on nanoporous composite phase change materials: Fabrication, characterization, enhancement and molecular simulation. Renewable Sustainable Energy Rev. 2019, 109, 578–605. 10.1016/j.rser.2019.04.041. [DOI] [Google Scholar]
- Rathod M. K.; Banerjee J. Thermal stability of phase change materials used in latent heat energy storage systems: a review. Renewable Sustainable Energy Rev. 2013, 18, 246–258. 10.1016/j.rser.2012.10.022. [DOI] [Google Scholar]
- Long L. S.Towards Energy-Efficient Building Envelops: Performance Evaluation and Theoretical Discussions; Anhui University of Science and Technology: Hefei, 2017. [Google Scholar]
- National Bureau of Statistics [EB/OL]. http://data.stats,gov.cn/easyquery.htm.
- National Bureau of Statistics . China Energy Statistics Yearbook; China Statistics Press: Beijing, 2012. [Google Scholar]
- Interpretation of energy saving and emission reduction plan in 12th Five-Year [EB/OL]. http://www.gov.cn/zwgk/2012-08/21.content-2207867.html.
- Sushobhan B. R.; Kar S. P. Thermal modeling of melting of nano based phase change material for improvement of thermal energy storage. Energy Procedia 2017, 109, 385–392. 10.1016/j.egypro.2017.03.035. [DOI] [Google Scholar]
- Wei T.; Zheng B.; Liu J.; et al. Structures and thermal properties of fatty acid/expanded perlite composites as form-stable phase change materials. Energy Build. 2014, 68, 587–592. 10.1016/j.enbuild.2013.09.050. [DOI] [Google Scholar]
- Zhou D.; Shire G. S. F.; Tian Y. Parametric analysis of influencing factors in Phase Change Material Wallboard(PCMW). Appl. Energy 2014, 119, 33–42. 10.1016/j.apenergy.2013.12.059. [DOI] [Google Scholar]
- Delcroix B.; Kummert M.; Daoud A. Thermal behavior mapping of a phase change material between the heating and cooling enthalpy-temperature curves. Energy Procedia 2015, 78, 225–230. 10.1016/j.egypro.2015.11.612. [DOI] [Google Scholar]
- Akeiber H. J.; Hosseini S. E.; Hussen H. M.; et al. Thermal performance and economic evaluation of a newly developed phase change material for effective building encapsulation. Energy Convers. Manage. 2017, 150, 48–61. 10.1016/j.enconman.2017.07.043. [DOI] [Google Scholar]
- Wang X.; Yu H.; Li L.; Zhao M. Research on temperature dependent effective thermal conductivity of composite-phase change materials (PCMs) wall based on steady-state method in a thermal chamber. Energy Build. 2016, 126, 408–414. 10.1016/j.enbuild.2016.05.058. [DOI] [Google Scholar]
- Jayalath A.; Aye L.; Mendis P.; Ngo T. Effects of phase change material roof layers on thermal performance of a residential building in Melbourne and Sydney. Energy Build. 2016, 121, 152–158. 10.1016/j.enbuild.2016.04.007. [DOI] [Google Scholar]
- Zhu N.; Liu F.; Liu P.; et al. Energy saving potential of a novel phase change material wallboard in typical climate regions of China. Energy Build. 2016, 128, 360–369. 10.1016/j.enbuild.2016.06.093. [DOI] [Google Scholar]
- Liu P. P.; Zhu N.; Hu P. F. Study on energy saving effect of double layers shape-stabilized phase change material wallboard in air conditioning room. New Build. Mater. 2015, 42, 42–46. [Google Scholar]
- Tian G. H.Study on Heat Transfer Characteristics and Energy Consumption Influence of Phase Change Energy Storage Building Walls; China University of Mining and Technology: Beijing, 2018. [Google Scholar]
- Rathore P. K. S.; Shukla S. K. Potential of macroencapsulated PCM for thermal energy storage in buildings: A comprehensive review. Constr. Build. Mater. 2019, 225, 723–744. 10.1016/j.conbuildmat.2019.07.221. [DOI] [Google Scholar]
- Lin Y.; Jia Y.; Alva G.; Fang G. Review on thermal conductivity enhancement, thermal properties and applications of phase change materials in thermal energy storage. Renewable Sustainable Energy Rev. 2018, 82, 2730–2742. 10.1016/j.rser.2017.10.002. [DOI] [Google Scholar]
- Ma G. X.; Liu S.; Xie S. L.; Jing Y.; Zhang Q. Y.; Sun J. H.; Jia Y. Z. Binary eutectic mixtures of stearic acid-n-butyramide/noctanamide as phase change materials for low temperature solar heat storage. Appl. Therm. Eng. 2017, 111, 1052–1059. 10.1016/j.applthermaleng.2016.10.004. [DOI] [Google Scholar]
- Meng Z.; Zhang P. Experimental and numerical investigation of a tube-intank latent thermal energy storage unit using composite PCM. Appl. Energy 2017, 190, 524–539. 10.1016/j.apenergy.2016.12.163. [DOI] [Google Scholar]
- Research on Preparation and Performance of Paraffin/High Polymer/Metal Copper Form-Stable Thermal Energy Storage Materials; South China University of Technology, 2016. [Google Scholar]
- Preparation and Property Research of Nanocopper/Paraffin Phase Change Composites for Actuation; Zhejiang University of Technology, 2013. [Google Scholar]
- Xuan Y. M.; Li Q.. Energy Transfer Theory and Application of Nanofluids, 1st ed.; Science Press: Beijing, 2010; pp 50–100. [Google Scholar]
- Qureshi Z. A.; Ali H. M.; Khushnood S. Recent advances on thermal conductivity enhancement of phase change materials for energy storage system: A review. Int. J. Heat Mass Transfer 2018, 127, 838–856. 10.1016/j.ijheatmasstransfer.2018.08.049. [DOI] [Google Scholar]
- Li Q. L.; Wang Y.; Lu H. B. The experimental study on paraffin wax phase change heat transfer enhancement with copper nano-particles. Mater. Rev. 2013, 27, 128–149. [Google Scholar]
- Elvar T. M. D. Uncertainty in measurement and total error: tools for coping with diagnostic uncertainty. Clin. Lab. Med. 2017, 1, 15–34. 10.1016/j.cll.2016.09.002. [DOI] [PubMed] [Google Scholar]
- Wang L. Y.; Yu H. L. Research on the time prolongation and attenuation coefficient influenced by the wall heat preservation. J. Qingdao Technol. Univ. 2017, 38, 92–94. [Google Scholar]
- Huo Y. T.; Niu Z. R.; Xiong H. R.; Li Z. Numerical simulation of decrement factor and time lag of external insulation system based on orthogonal experiment. Concrete 2016, 7, 30–33. [Google Scholar]
- Ministry of Housing and Urban–Rural Development of the People’s Republic of China (MOHURD) . Code for Thermal Design of Civil Building, 1st ed.; China Construction Industry Press: Beijing, 2016. [Google Scholar]
- Zhang Z. X.Research on Wall Heat Storage Performance and Its Impact on Building Energy Consumption; Chongqing University, 2014. [Google Scholar]
- Li T. Y.Preparation and Heat Transfer Characteristics of Composite Phase Change Cement Board; Southwest Jiaotong University: Chengdu, 2016. [Google Scholar]
- Zhang Z. X.Research on Wall Heat Storage Performance and Its Impact on Building Energy Consumption; Chongqing University: Chongqing, 2014. [Google Scholar]
- Ministry of Housing and Urban–Rural Development of the People’s Republic of China (MOHURD) . Design Standard for Energy Efficiency of Residential Buildings in Hot Summer and Cold Winter Zone, 1st ed.; China Construction Industry Press: Beijing, 2010. [Google Scholar]
- Ministry of Housing and Urban–Rural Development of the People’s Republic of China (MOHURD) . Standard for Design of Heating, Ventilation and Air Conditioning for Civil Buildings, 1st ed.; China Construction Industry Press: Beijing, 2012. [Google Scholar]
- Palafox-Alcantar P. G.; Hunt D. V. L.; Rogers C. D. F. The complementary use of game theory for the circular economy: A review of waste management decision-making methods in civil engineering. Waste Manage. 2020, 102, 598–612. 10.1016/j.wasman.2019.11.014. [DOI] [PubMed] [Google Scholar]