

Abstract
Background
Williams syndrome (WS) is a neurodevelopmental disorder that has been attributed to heterozygous deletions in chromosome 7q11.23 and exhibits a variety of physical, cognitive, and behavioral features. However, the genetic basis of this phenotypic variability is unclear. In this study, we identified genetic clues underlying these complex phenotypes.
Methods
Neurobehavioral function was assessed in WS patients and healthy controls. Total RNA was extracted from peripheral blood and subjected to microarray analysis, RNA‐sequencing, and qRT‐PCR. Weighted gene co‐expression network analysis was performed to identify specific alterations related to intermediate disease phenotypes. To functionally interpret each WS‐related module, gene ontology and disease‐related gene enrichment were examined. We also investigated the micro (mi)RNA expression profiles and miRNA co‐expression networks to better explain the regulation of the transcriptome in WS.
Results
Our analysis identified four significant co‐expression modules related to intermediate WS phenotypes. Notably, the three upregulated WS‐related modules were composed exclusively of genes located outside the 7q11.23 region. They were significantly enriched in genes related to B‐cell activation, RNA processing, and RNA transport. BCL11A, which is known for its association with speech disorders and intellectual disabilities, was identified as one of the hub genes in the top WS‐related module. Finally, these key upregulated mRNA co‐expression modules appear to be inversely correlated with a specific downregulated WS‐related miRNA co‐expression module.
Conclusions
Dysregulation of the mRNA/miRNA network involving genes outside of the 7q11.23 region is likely related to the complex phenotypes observed in WS patients.
Keywords: Williams syndrome, autism spectrum disorder, genetics
Short abstract
Read the Commentary on this article at doi: 10.1111/jcpp.13056
Introduction
Williams syndrome (WS; OMIM: 194050) is a rare genetic neurodevelopmental disorder suspected to be caused by heterozygous microdeletions in approximately 26–28 genes found in the 7q11.23 chromosomal region (Pober, 2010). Physically, patients exhibit characteristic features such as a distinctive ‘elfin’ facial appearance, congenital heart disease, and endocrine disturbances (Pober, 2010). They also often exhibit hypersociability, intellectual disabilities (IDs), and visual‐spatial deficits but typically have relatively preserved verbal skills (Pober, 2010). In addition, accumulating evidence indicates that generalized anxiety disorder and attention deficit hyperactivity disorder (ADHD) are also commonly observed in association with WS (Leyfer, Woodruff‐Borden, Klein‐Tasman, Fricke, & Mervis, 2006; Stinton, Elison, & Howlin, 2010). However, while our understanding of WS is continually increasing, the exact contribution of individual genes to the complex phenotypes observed for this disease is still largely unknown.
As indicated above, genes within the 7q11.23 chromosomal region have long been suspected to play an important role in WS. However, although considerable effort has focused on evaluating the function of these genes, only elastin (ELN) has been shown to be related to WS and appears to be responsible for the development of supravalvular aortic stenosis (SVAS; Curran et al., 1993; Ewart et al., 1993). Animal studies have also shown that some of the genes in this region are associated with behavioral abnormalities (Osborne, 2010), but as these findings are based on nonhuman research in models that do not necessarily reflect the broad phenotypic spectrum observed in human WS patients, they are largely inconclusive. Taken together, these studies suggest that WS is likely a multifactorial disorder and that the diverse phenotypes observed in WS patients are not solely based on deleted genes in the 7q11.23 region.
In addition, recent studies have shown that genomic copy number variation (CNV) can partially affect gene expression (Blumenthal et al., 2014; Luo et al., 2012). On the basis of this idea, several studies have attempted to identify candidate genes related to the diverse WS phenotypes using genome‐wide gene expression analyses, but these efforts have not yet provided conclusive results (Adamo et al., 2015; Antonell, Vilardell, & Perez Jurado, 2010; Chailangkarn et al., 2016; Henrichsen et al., 2011; Khattak et al., 2015; Lalli et al., 2016). This is mostly due to the small sample sizes (ranging from 3 to 8 WS patients), age or gender biases, and the conventional approaches utilized, which largely depend on absolute changes in gene expression.
Furthermore, it is unclear what types of tissue are the most suitable for sampling and analysis to gain insight into the WS gene expression profile. In general, postmortem brain tissues and induced pluripotent stem cell (iPSC)‐derived neurons are the most practical tissues to sample to better understand neuropsychiatric phenotypes, but they have significant drawbacks, including being unscalable and varying in both sample quality and cell heterogeneity (Brennand, Landek‐Salgado, & Sawa, 2014). In contrast, peripheral blood samples can be easily collected in much larger sizes, and sample quality can be better controlled. Multiple studies have also reported significant correlation between certain gene expression profiles in the blood and brain, though the two are not perfectly interrelated (Liew, Ma, Tang, Zheng, & Dempsey, 2006; Sullivan, Fan, & Perou, 2006). Blood sampling also has the added benefit of capturing the gene expression profiles associated with both the immune system and metabolic pathways. This allows changes in peripheral immunity, mediated by microglia and astrocytes, to be analyzed, providing insight into immune‐related learning, memory, and social behaviors, all of which are affected in WS (Filiano et al., 2016; Kipnis, 2016).
In contrast to WS patients, autism spectrum disorder (ASD) patients are genetically heterogeneous and mainly characterized by social impairments (Geschwind & State, 2015). It is conceivable that the opposing social‐behavioral phenotypes of the two disorders may be particularly useful for revealing the neurogenetic bases of social function (Jarvinen, Korenberg, & Bellugi, 2013). Although attention to this field is growing, differences and similarities in the biological pathways between WS and ASD remain to be elucidated.
In this study, we evaluated the gene expression changes related to the complex intermediate phenotypes in WS, focusing on genes outside of the 7q11.23 region. Notably, our weighted gene co‐expression network analysis (WGCNA) was performed using peripheral blood samples. WGCNA is an unbiased approach and is considered more robust than conventional gene expression analyses (Langfelder & Horvath, 2008). Our analysis also involved profiling micro(mi)RNA expression and miRNA co‐expression networks to elucidate the mechanisms underlying transcript upregulation related to WS. Furthermore, we compared gene expression patterns between WS and ASD to understand the molecular basis for their contrasting social behaviors. To our knowledge, this is the first time these complimentary approaches have been used to comprehensively investigate the genotype‐phenotype relationship in WS using peripheral blood samples.
Methods
Study participants
We recruited 152 individuals (66 WS patients, 32 ASD patients, and 54 nonpsychiatric controls) from Kyoto University, Osaka City General Hospital, and Todaiji Ryoiku Hospital for Children. We split the participants into four sets. The overlap between these data sets is shown by a Venn diagram in Figure S1. All participants were free of medication for 6 months or more before blood sample collection. This study was approved by the ethics committees of each participating institution, and written informed consent was obtained from all participants.
Clinical assessment
Using quantitative (q)PCR of isolated genomic DNA (Appendix S1), we confirmed that all patients with WS harbored the full deletion in chromosome 7q11.23 typical for this disease and that this deletion was not present in the controls (Figure S2). The Japanese version of the Child/Adult Behavior Checklist (CBCL/ABCL) was used to evaluate behavioral and psychological problems (Hatton et al., 2002). The Japanese translation of the Social Responsiveness Scale‐2 (SRS‐2) was used to assess social function (Bruni, Constantino, & Gruber, 2014), while the Hyperacusis Questionnaire (HQ) was used to assess the extent of hyperacusis (Khalfa et al., 2002). ASD diagnosis was based on DSM‐5 criteria and was confirmed with the Autism Diagnostic Observation Schedule (ADOS) and the Japanese translation of the High Functioning Autism Spectrum Screening Questionnaire (ASSQ‐R) (Ehlers, Gillberg, & Wing, 1999). Demographic data for the individuals are provided in Table S1.
Microarray analysis
Total RNA and miRNA were extracted from the peripheral blood of participants using a Paxgene Blood RNA and miRNA System (QIAGEN, Tokyo, Japan). RNA quality and the presence of small RNAs were determined using an Agilent 2100 Bioanalyzer (Agilent Technologies, Tokyo, Japan). Samples with RNA integrity number (RIN) values greater than eight were used for subsequent analyses.
To analyze transcriptomic changes, we used an Agilent SurePrint G3 Human GE v2 8x60K Microarray (G4851B) (Agilent Technologies). Briefly, total RNA (100 ng) was labeled with Cy3 using the Low Input Quick Amp RNA Labeling kit (One‐Color) (Agilent Technologies). Labeled cRNA was then purified using an RNeasy mini kit (QIAGEN). Subsequently, 600 ng of Cy3‐labeled cRNA was fragmented and hybridized at 65°C for 17 hr. After hybridization, the slides were scanned on an Agilent Microarray scanner (G2565CA), and data were extracted with the Agilent Feature Extraction software package version 11.0.1.1 (Agilent Technologies). Raw gene expression data were background corrected using the normexp method and quantile normalized using the Limma R package. During preprocessing, all samples were hierarchically clustered to identify array outliers on the basis of mean interarray correlation (IAC; Gold, Wang, & Coombes, 2005). All Agilent control probes and low expressed probes were removed. The signals in replicate spots were averaged with the avereps function. To eliminate batch effects, the ComBat package was applied with the default parameters (Johnson, Li, & Rabinovic, 2007). Agilent probe identifiers were annotated using BioMart (Ensembl version 76). Differentially expressed (DE) genes were calculated based on diagnosis, age, gender, and RIN using the Limma R package (Smyth, 2005). The eBayes function was used to calculate t‐test statistics based on the empirical Bayes method. The Benjamini‐Hochberg method was used to evaluate the false discovery rate (FDR) (Benjamini & Hochberg, 1995). Genes were considered to be DE when the FDR <0.05 and the |fold change (FC)| >1.3.
To analyze miRNA expression in our samples, we used a SurePrint G3 Human miRNA 8x60K Microarray (G4870C) (Agilent Technologies). Briefly, total RNA (100 ng) was labeled and then hybridized for 20 hr at 55°C. Data preprocessing and normalization were carried out with the AgiMicroRna R package (Lopez‐Romero, 2011). A linear model was fitted to each miRNA to assess the differential expression between two groups using the Limma R package (Smyth, 2005). MiRNAs were considered to be DE when the FDR <0.05 and |FC| >1.25. PhenoGram was used to visualize the results for each DE miRNA as previously described (Wolfe, Dudek, Ritchie, & Pendergrass, 2013).
Principal component analysis
After removing the genes within the 7q11.23 region, the DE genes (FDR <0.05 and |FC| ≥1.3) were further evaluated using a Principal Component Analysis (PCA). The PCA was performed using the R package with the prcomp function.
Weighted gene co‐expression network analysis
We performed co‐expression network analysis using the WGCNA package in R (Langfelder & Horvath, 2008). Briefly, to construct signed mRNA co‐expression networks, the soft‐thresholding power was set to 12 to maximize scale‐free topology model fit as it plateaued above 0.9. The initial module assignments were determined with a dynamic tree‐cutting algorithm using the following settings: deepSplit = 2, minModulesize = 100, and dthresh = 0.2. We also constructed signed miRNA co‐expression networks as previously described (Wu, Parikshak, Belgard, & Geschwind, 2016). The soft‐thresholding power was set to 10 to maximize scale‐free topology model fit as it plateaued above 0.8. We utilized more stringent parameters (soft‐thresholding power = 10, deepSplit = 4, minModulesize = 10, dthresh = 0.25) and then performed 200 rounds of bootstrapping. The topological overlap matrix for each of the resampled networks was calculated to construct the network in a way that was robust to outliers. In both networks, the expression profiles of each module were summarized using the module eigengene (ME) as the first principal component (PC1) of the module. The correlations between the MEs and the biological traits were analyzed to identify modules associated with each trait of interest. The linear mixed‐effects model was also used to test the association between MEs and several covariates (sex, age, and RIN). Hub genes were defined as genes with the highest module membership value (kME). The igraph R package was used to visualize the graphs (Csardi & Nepusz, 2006).
Gene set enrichment analysis, gene ontology, and pathway analysis
We performed gene set enrichment analyses using two‐sided Fisher's exact tests with the fisher test function in R. Gene lists were obtained from sources for each set as detailed in Table S2. First, we searched for brain cell type‐specific genes, including known immune and neuronal genes, in each module as described previously (Albright & Gonzalez‐Scarano, 2004; Cahoy et al., 2008). Next, we examined the enrichment of genes associated with neurodevelopmental disorders in each module. ASD‐susceptibility genes were obtained from the Simons Foundation Autism Research Initiative (SFARI) gene database, AutDB (Abrahams et al., 2013). Rare de novo variation (RDNV) genes associated with ASD were previously compiled by Werling, Parikshak, and Geschwind (2016). The ASD‐associated genes in co‐expression modules ASD M12v (downregulated in the brains of subjects with ASD) and ASD M16v (upregulated in the brains of subjects with ASD) were obtained from Voineagu et al. (2011). Genes associated with IDs were obtained from Vissers, Gilissen, and Veltman (2016). Notably, genes associated with both ASD and IDs were excluded from the ID gene list. Genes associated with ADHD were obtained from Cristino et al. (2014). DE genes in other WS samples, including lymphoblasts (LCL), fibroblasts, and iPSCs, were obtained from Antonell et al. (2010), Henrichsen et al. (2011), and Adamo et al. (2015), respectively. Then, we examined the enrichment of nonpsychiatric disorder‐associated genes in each module. The lists of genes associated with atherosclerosis, diabetes mellitus (DM) type 2, and systemic lupus erythematosus (SLE) were obtained from Nardone, Sams, Zito, Reuveni, and Elliott (2017). We performed a mouse phenotype enrichment analysis using the following mouse phenotype (MP) ontology terms from the Mouse Genome Informatics (MGI) database (Eppig, Blake, Bult, Kadin, & Richardson, 2015): abnormal social behavior [MP:0002557], abnormal fear/anxiety behavior [MP:0002065], and abnormal learning/memory [MP:0002063]. Finally, we assessed the enrichment of genes located within the 7q11.23 chromosomal region in each module. Gene Ontology (GO) analysis was performed using GO Elite (Zambon et al., 2012) with the default settings and a Z‐score threshold greater than two. Pathway enrichment analysis was performed using the KEGG database (Kanehisa, Sato, Kawashima, Furumichi, & Tanabe, 2016) with Enrichr (Kuleshov et al., 2016). All of the expressed genes were used as the background gene list.
MiRNA target prediction
Potential targets of the DE miRNAs were predicted using TargetScan 7.1 (Agarwal, Bell, Nam, & Bartel, 2015), an algorithm included in the Ingenuity Pathway Analysis (IPA) miRNA target filter (QIAGEN). To select target genes, we used the following steps. First, we searched the targets for those with a TargetScan total context score of −0.2 or less. We then selected target genes that were negatively correlated with the DE genes (FDR <0.05) between the WS patients and controls. The remaining gene list was used for further analysis as targets.
Integrated mRNA‐miRNA network analysis
We assessed whether mRNA co‐expression modules were regulated by the miRNA co‐expression modules in WS. For this analysis, we calculated the Spearman correlations between the MEs of the upregulated mRNA modules (M4, M6, M11, and M12) and the ME of the downregulated miRNA module (MM7). Then, we analyzed the interactions between the target genes of the top five miRNAs in the downregulated miRNA module (MM7) and the top 250 genes in each upregulated mRNA module. The integrated networks were visualized using Cytoscape software (Shannon et al., 2003).
Statistical analysis
All statistical analyses were performed with R. Statistical differences between two groups were carried out using Student's t‐tests or Mann–Whitney U‐tests. The FDRs were estimated using the Benjamini‐Hochberg method.
Results
Gene expression differences between WS and control patients
We sought to identify gene expression differences between WS patients and controls to distinguish causative changes in the transcriptome. An overview of our analysis is provided in Figure S1. As expected, we found changes both within the 7q11.23 region, and genome‐wide. Most (but not all) genes within the deletion region were significantly downregulated in WS patients and unchanged in controls (Figure 1A), and these findings were validated by qRT‐PCR in a subset of the patients (Figure S3). Consistent with a previous report, we also found that ELN was not downregulated in our data set (Merla et al., 2006). Regarding genome‐wide distribution, we identified several genes that were significantly altered in the WS patients compared to the controls (Figure 1B), with the strongest DE signal being observed within the 7q11.23 region. Furthermore, this result was not affected by blood cell composition in WS patients and controls (Appendix S1 and Figure S4). These findings support an essential role for genes in the 7q11.23 region during disease onset.
Figure 1.

The Williams syndrome (WS) gene expression profile. (A) Differences in gene expression across the 7q11.23 region between WS patients and controls. All of the genes shown had expression deviations of at least two SDs from the mean across all WS patients. (B) Manhattan plot of the genome‐wide distribution of differential gene expression in WS. The −log10 false discovery rate (FDR) values across the genome between WS and controls are shown. (C and D) Principal component analysis (PCA) highlighting expression profile differences between the WS and control patients after removing genes within the 7q11.23 region (FDR <0.05 and |fold change (FC)|≥1.3). The asterisk indicates a significant difference between the groups using a Mann‐Whitney's U‐test (p‐value = 2.2E‐16)
However, our cross validation of the model (Appendix S1) and PCA of the DE genes outside of the 7q11.23 region indicate that robust WS‐specific transcriptomic changes exist in other regions of the genome. Indeed, our receiver operating characteristic analysis revealed a high area under the curve (0.96), which indicates an almost perfect classification (Figure S5). Moreover, our PCA shows a clear separation of groups, and the PC1 was significantly different between groups (p = 2.2E‐16; Figure 1C,D).
Identification of gene co‐expression modules in WS
To identify co‐expression modules associated with WS, we performed a WGCNA, which provides a system‐level view of transcriptional changes. Our analysis identified 22 co‐expression modules (Figure 2A), which were subsequently grouped by their ME. Of these, six were significantly correlated with WS (FDR <0.05; absolute R > .45) (Figure 2B,C; the full list appears in Table S3). Notably, the M11 module appears to have the strongest correlation with WS among these modules (R = .67, FDR = 6E‐10; Figure 2C). We also observed a similar trend when we used the linear mixed‐effects model (Figure S6).
Figure 2.

Williams syndrome (WS)‐associated mRNA modules identified by weighted gene co‐expression network analysis (WGCNA). (A) A dendrogram showing the 22 distinct co‐expression modules. (B) Correlation analysis between the module eigengenes (MEs) and WS. The colored bars represent WS‐associated modules (FDR <0.05; absolute R > .45). (C) A heatmap showing the positive (red) and negative (blue) correlation between the mRNA modules and the specified traits. CBCL/ABCL, Child/Adult Behavior Checklist; IP, internalizing problems; EP, externalizing problems; TP, thought problems; AP, attention problems; SRS‐2, Social Responsiveness Scale‐second edition; HQ, Hyperacusis Questionnaire. (D) Module enrichment analysis for gene lists complied from the literature (Table S2). The false discovery rates (FDRs) <0.01 are shown in parentheses
Gene co‐expression modules associated with known gene sets of interest and intermediate WS phenotypes
We next evaluated the possible association between our co‐expression modules and the observed intermediate WS phenotypes by clinically scoring disease severity. Interestingly, four (M4, M11, M12, and M22) of the six modules appear to be significantly associated with the intermediate phenotypes, especially when scored with SRS‐2, which is typically used to assess social impairment (FDR <0.05; Figure 2C). Furthermore, three modules (M4, M11, and M12) were associated with WS phenotypes scored using the CBCL/ABCL, which is used to assess cognitive‐behavioral problems (FDR <0.05; Figure 2C). We also found that two modules (M4 and M12) are correlated with the HQ scores, which reflect sensory disturbances, in WS patients (FDR <0.05; Figure 2C). Overall, these results strongly suggest that these four modules (M4, M11, M12, and M22) are involved in the observed neuropsychiatric phenotypes of WS.
Interestingly, three of the four modules (M4, M12, and M22) were strongly enriched with glial cell marker genes (FDR <0.01), while only the M11 module was significantly enriched with neuronal marker genes (FDR = 5E‐3; Figure 2D). These results indicate that altered gene expression in the blood may contribute, at least in part, to the observed changes in the brain, supporting the use of peripheral blood samples in our analysis.
Next, we evaluated the enrichment of gene sets known to be associated with neurodevelopmental disorders (ASD, ID, ADHD, and WS). The M4 module is significantly enriched with ASD M16V genes that are known to be upregulated in ASD, most of which are associated with inflammatory processes involving microglia and astrocytes (FDR = 2E‐4), as well as dysregulated genes in fibroblasts and iPSCs in WS (FDR = 2E‐2 and 5E‐3, respectively; Figure 2D). Furthermore, the M12 module appears to be significantly enriched for ID genes (FDR = 3E‐3; Figure 2D). In contrast, none of the modules are significantly enriched with nonpsychiatric disorder (atherosclerosis, DM type 2, and SLE) genes (Figure 2D). To further investigate the correlations between each module and the various neuropsychiatric phenotypes associated with WS, we determined the MP term annotations (abnormal social behavior, fear/anxiety behavior, and learning/memory) using the MGI database. The M11 module, which is enriched with neuronal cell genes, is also significantly enriched with genes related to abnormal learning/memory (FDR = 3E‐8; Figure 2D). Taken together, these results highlight the potential importance of these four WS‐associated modules (M4, M11, M12, and M22) on disease phenotype. It is also important to note that only the M22 module was significantly enriched with genes found within the 7q11.23 region (FDR = 7E‐11; Figure 2D).
Characterization of the WS‐associated co‐expression modules
Among the four WS‐associated modules, M4, M11, and M12 appear to include mostly upregulated genes (Figure 3A‐C), while those in M22 are largely downregulated in WS (Figure 3D). The results of our GO (Figure 3E) and KEGG (Figure 3F) analyses (full list appears in Table S4) show that the M11 module is enriched with genes related to antigen processing and presentation, B‐cell activation, and intestinal immune network IgA production. It also contains BCR signaling‐related genes (BLNK and CD19), with the BCL11A gene as the top hub genes (Figure 3G). In contrast, the M12 module was enriched in genes involved in RNA processing, gene expression, and RNA transport (Figure 3E,F). Of particular note is the identification of ASD candidate genes (CYFIP1 and DPYSL2) as hub genes in the M4 module (Figure 3H). CYFIP1 is involved in cytoskeletal remodeling in neurons (Oguro‐Ando et al., 2015), while DPYSL2 is important for axon outgrowth and mTOR signaling‐related processes (Pham et al., 2016). Furthermore, the M22 module, which included genes within the 7q11.23 region, was enriched in factors related to the regulation of fibroblasts migration and insulin signaling pathway (Figure 3E,F).
Figure 3.

Characterization of the four co‐expression modules associated with the intermediate phenotypes of Williams syndrome (WS). (A‐D) Bar plots of module eigengene (ME) expression for (A) M4 module, (B) M11 module, (C) M12 module, and (D) M22 module. (E) The top three enriched Gene Ontology (GO) biological processes for each module. The red line indicates the Z‐score threshold (Z = 2). (F) The top three enriched KEGG pathways. The red line indicates a false discovery rate (FDR) threshold of 0.05. (G and H) The top 15 hub genes of (G) M11 module and (H) M4 module
To confirm the top hub genes, we compared the gene lists found using RNA‐sequencing (RNA‐seq; Appendix S1) and those found using microarray analysis. Notably, the list of hub genes for each module are similar between the two analyses (R = .8, p = 8.2E‐7) (Figure S7). In addition, the top hub genes in the M11 module were also validated by qRT‐PCR in an independent subset of samples (p < .05; Appendix S1 and Figure S6).
Finally, we constructed protein‐protein interaction (PPI) networks to examine the connections between the WS‐associated modules at the protein level (Appendix S1). Our analysis indicates that there are interactions between the proteins encoded by the genes in each of the four modules, most of which are directly and/or indirectly connected (Figure S7). These results support the interrelated nature of the factors at both the gene and/or protein level in each of the four WS‐associated modules.
Comparison of the gene expression profiles of WS and ASD
In contrast to WS, the core symptoms of ASD involve impairments in sociability (Geschwind & State, 2015). However, there is no clear evidence of a difference in transcriptional dysregulation between WS and ASD. In fact, the pathways represented in the M4 module suggest that WS and ASD partly share the same dysregulated pathways (Figure 2D). However, we found that the number of DE genes between WS and ASD was higher than that between ASD and the controls or WS and the controls (FDR <0.05; |FC| ≥1.3) (Figure S8). These findings mirror the opposite social phenotypes between WS and ASD. A WGCNA was also performed to obtain a system‐level view of these gene expression changes. Unfortunately, this analysis failed to identify significantly associated modules in ASD (Figure S8) or to reveal genetic associations between WS and ASD. A possible explanation for this may be related to the heterogeneity of ASD or the small sample size in this study.
WS‐associated miRNA expression
There is accumulating evidence that miRNAs, which posttranscriptionally regulate the expression of multiple genes, are dysregulated in psychiatric disorders (Geaghan & Cairns, 2015). To investigate the possible involvement of miRNA in the dysregulated gene network in WS, we performed miRNA expression analysis of the same peripheral blood samples obtained from WS and healthy control patients. A total of 21 miRNAs were shown to be significantly dysregulated in WS compared to controls (FDR <0.05; |FC| >1.25) (Figure 4A; the full list appears in Table S5). We also found that the DE miRNAs were located at multiple loci. Interestingly, miR‐590‐5p, which is located in the 7q11.23 region, appears to be significantly downregulated in WS (Figure S9). To validate these results, we performed qRT‐PCR and observed similar changes in expression in each of the DE miRNAs (R = .97, p = 5.3E‐6) (Figure S9; the primers listed in Table S6).
Figure 4.

The genome‐wide micro (mi)RNA profile of Williams syndrome (WS). (A) A volcano plot showing the expression of 21 differentially miRNAs in the WS patients compared to the controls. The red dots indicate a false discovery rate (FDR) <0.05, while the gray dashed lines indicate a |fold change (FC)| = 1.25). (B) A dendrogram showing the 19 distinct miRNA co‐expression modules dysregulated in WS. (C) Correlation analysis of the miRNA co‐expression modules with WS. The colored bars represent a significant correlation (FDR <0.05). (D) Bar plot showing module eigengene (ME) expression for the MM7 module. (E) The top 12 hub miRNAs of the MM7 module
Identification and characterization of miRNA co‐expression modules in WS
A WGCNA was performed to better understand the miRNA co‐expression profiles at a system level (Figure 4B). Among the 19 miRNA co‐expression modules that we detected, only one module (MM7) was significantly correlated (downregulated) with WS (FDR <0.05; Figure 4C,D). One of the top hub miRNAs in this module, miR‐1915‐3p (Figure 4E), has been reported to be associated with major depressive disorder and Alzheimer's disease (Lukiw, Andreeva, Grigorenko, & Rogaev, 2012; Maffioletti et al., 2016). In addition, miR‐590‐5p, which is located in the 7q11.23 region, was also observed in the MM7 module (Table S5). Furthermore, our analysis indicates that the target genes of the miRNAs in the module are related to antigen processing and presentation and regulation of B‐cell apoptosis (Table S4). These GO results for the MM7 miRNA module appear to be similar to those of the M11 module, suggesting a possible correlation between the downregulated miRNAs and the upregulated mRNAs in these modules.
Integrative analysis of the WS‐associated mRNA/miRNA co‐expression modules
To gain insight into the correlation between the MM7 miRNA module and the upregulated mRNA modules (M4, M11, and M12), we performed a Spearman correlation analysis. Our results indicate a negative correlation between the miRNA and mRNA modules (Figure 5A‐D). Notably, the M12 module had the strongest correlation with the MM7 module (R = −.5, p = 9E‐4; Figure 5B). Moreover, as shown in Figure 5E, the top hub miRNAs in the MM7 module were also tightly connected with the top hub genes in these three the mRNA modules. Taken together, our results show that the upregulated WS‐associated mRNA modules, which contain genes outside of the 7q11.23 region, are likely regulated by the miRNA in the MM7 module and the downregulation of these miRNA may modulate the clinical phenotypes observed in WS.
Figure 5.
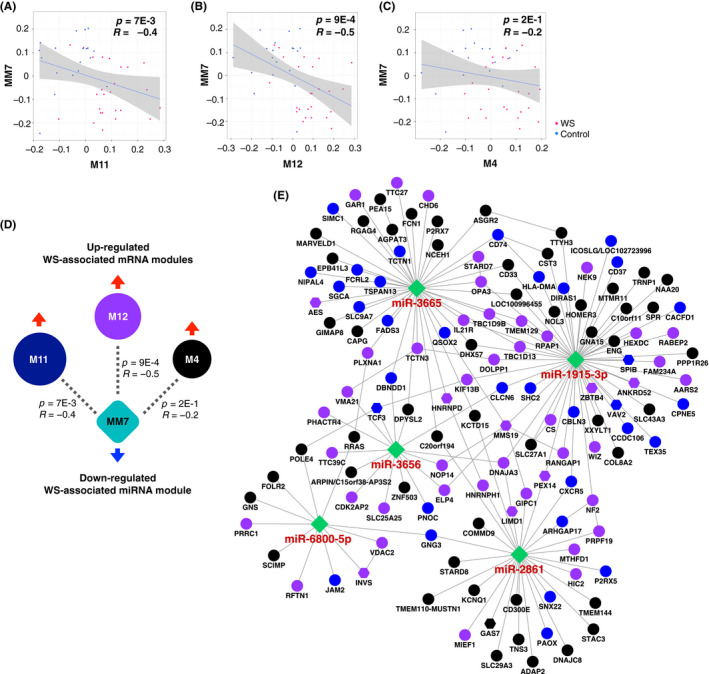
Analysis of the relationship between micro (mi)RNA and mRNA expression changes in Williams syndrome (WS). (A‐C) Correlation between the module eigengenes (MEs) in the upregulated (A) M11, (B) M12, and (C) M4 mRNA modules and those in the downregulated MM7 miRNA module. The Spearman's correlation coefficient (R) and p values are indicated. (D) Summary of the correlation analysis between the three upregulated mRNA modules (M11, M12, and M4) and the downregulated MM7 miRNA module. The size of each circle corresponds to the correlation coefficient of the modules. The dashed lines indicate a negative correlation. The Spearman's correlation coefficient (R) and p values are again indicated. (E) The regulatory network between the three mRNA modules and the MM7 miRNA module highlighting the negative correlations between the top five hub miRNAs in the MM7 miRNA module and their predicted targets in the three mRNA modules. The solid lines represent direct interactions. The color of the circles indicates the mRNA module, while the transcription regulators are shown as hexagons
Discussion
Despite a long‐standing effort, the genotype‐phenotype relationship in WS has not been fully elucidated. In this study, we investigated the contribution of gene expression changes outside of the typical 7q11.23 region to the complex phenotypes observed in WS patients. Our network approach shows that four co‐expression modules (M4, M11, M12, and M22) are associated with the intermediate phenotypes of WS. Notably, three of these (M4, M11, and M12), which contain genes outside of the 7q11.23 region, are upregulated in WS. In addition, we examined the concomitant miRNA expression profiles to elucidate their possible regulatory role. This analysis demonstrated that the key upregulated mRNA modules are inversely correlated with the downregulated miRNA module (MM7) in WS patients. Taken together, our findings provide the first evidence that the dysregulated mRNA and miRNA transcriptomic networks may be associated with the complex phenotypes observed in WS patients.
Williams syndrome has been associated with a number of comorbidities and medical complications. Glucose intolerance, for example, affects approximately 75% of adult WS patients, though the exact cause remains unknown (Pober et al., 2010). In this study, the M22 module was enriched for genes involved in the insulin signaling pathway and the M4 module was related to the negative regulation of glucose import. These results indicate the possibility that our network approach may capture the genetic clues of other issues affecting the WS patient, such as impaired glucose tolerance. Moreover, we also found that the M11 module was enriched for genes involved in B‐cell activation and proliferation. The relevance of these findings may be related to the repeated cases of tumors, mainly Burkitt lymphoma tumors, in WS patients (Decimi et al., 2016). Although it remains unclear whether WS is associated with Burkitt lymphoma, our findings may give mechanistic clues to the process of tumor development in WS.
It is also important to note that most of the WS‐associated modules were enriched for glial cell marker genes despite the study being performed on peripheral blood samples. Glial cells are known to play a pivotal role in brain function, regulating synaptic transmission as well as mediating crosstalk between the central nervous and immune systems (Clarke & Barres, 2013; Prinz & Priller, 2017). Microglia are the resident macrophages of the brain and play roles in the immune response. They also share a common lineage with the macrophages in peripheral blood (Prinz & Priller, 2014). Similarly, astrocytes in the brain have signaling pathways that resemble those of some cell types found in the blood (Sofroniew, 2015). In addition, accumulating evidence indicates that immune system dysfunction is associated with various neurodevelopmental disorders, including ASD and schizophrenia (Estes & McAllister, 2015). Unfortunately, we could not confirm our findings using postmortem brain tissue from WS patients as it is extremely difficult to obtain. Nonetheless, although the evidence is not definitive, our results provide new insights into the possible connection between immune system disturbances, especially the immune‐glial network, and the neuropsychiatric phenotypes in WS.
Recently, the contrasting social behaviors observed in WS and ASD patients have received considerable attention among researchers interested in the neurobiological mechanisms of social abnormalities (Barak & Feng, 2016). Despite the intriguing nature of these two disorders, the similarities and differences in their phenotypes have not been fully elucidated in terms of their underlying mechanisms. In this study, the M4 module appears to be strongly associated with ASD M16V, which consists of upregulated glial cell‐related genes in the brain tissue of ASD patients, and the two ASD candidate genes (CYFIP1 and DPYSL2) were found to be the top hub genes. These findings suggest that some aspects of the neuropsychiatric and behavioral impairments observed for WS and ASD may share some common mechanisms and pathways. Furthermore, the BCL11A gene, one of the hub genes in the M11 module, is a zinc‐finger transcription factor and a critical modulator of hemoglobin switching that has been associated with ASD and IDs (Bauer & Orkin, 2015; De Rubeis et al., 2014; Dias et al., 2016). Intriguingly, de novo microdeletion of BCL11A leads to severe speech problems (Peter, Matsushita, Oda, & Raskind, 2014). Conversely, our data indicate that BCL11A is upregulated in WS. This is not altogether surprising as this condition is characterized by verbal fluency with extensive and expressive speech rich in vocabulary. Thus, it is possible that BCL11A acts as one of the driver genes of the neuropsychiatric phenotypes in WS patients.
It is widely known that epigenetic factors, such as DNA methylation, histone modifications, and noncoding RNAs, contribute to the regulation of gene expression (Issler & Chen, 2015). It has also been reported that disruption of epigenetic regulation is involved in many psychiatric disorders (Geaghan & Cairns, 2015). Although the epigenetic mechanisms underlying WS are not yet clearly understood, a recent study showed that aberrant DNA methylation occurs not only in the 7q11.23 region but also throughout the genomes of WS patients (Strong et al., 2015). Thus, epigenetic dysregulation may play a significant role in the upregulation of the three WS‐associated modules (M4, M11, and M12) in this study. Furthermore, the observed dysregulation of various miRNAs across the entire genome, which appear to interact with their target mRNAs in WS, also support this hypothesis. In addition, BCL7B (in the 7q11.23 deletion region) and BCL11A (in the M11 module) encode subunits of SWItch/sucrose nonfermentable (SWI/SNF) chromatin‐remodeling complexes, which are known to regulate gene expression and play roles in neurodevelopmental disorders (Ronan, Wu, & Crabtree, 2013). Therefore, dysregulation of these genes may also explain the altered gene expression profiles in WS patients.
Several limitations should be considered when interpreting our results. First, our findings were based on samples derived from peripheral blood, and therefore it remains to be determined whether all clinical symptoms seen in WS can be explained by our identified modules. As an additional approach, molecular pathological epidemiology (MPE) (Ogino et al., 2016), which integrates molecular signatures with epidemiological studies may help decipher the etiologies of WS. Second, a previous study involving immortalized lymphoblast lines showed that the parental origin of the deletion contributes to the level of expression of GTF2I, which is located within the deleted region (Collette et al., 2009). Although we could not confirm parental origin owing to the difficulty in obtaining parent samples, it may be useful to examine whether the expression of genes in the deleted region is affected by imprinting.
While additional studies are needed to further elucidate the genetic basis of the complex phenotypes in WS, our study provides novel insight into the global changes in genotype relative to the phenotypic manifestation of the disease and could lead to the development of effective interventions.
Availability of data and materials
The microarray and RNA‐seq datasets supporting the conclusions of this article are available in the GEO (accession numbers GSE89594 and GSE89595) and DDBJ (accession number JGAS00000000132) databases. The code used to analyze the data is available from the corresponding author on reasonable request.
Authors’ contributions
RK, DHG, and MH designed study. KT, SO, YF, TA, TK, KM, TK, TM, and TH recruited participants and collected the clinical data and samples. RK and MN performed the experiments. RK, VS, MJG, NNP, KI, and MN analyzed the data. RK wrote the manuscripts. All authors read and approved the final manuscript.
Ethics approval and consent to participate
This study was approved by the ethics committees of each participating institution (Kyoto University, Osaka City General Hospital, and Todaiji Ryoiku Hospital for Children). Written informed consent was obtained from all participants in accordance with the Declaration of Helsinki.
Key points.
Our results show that the upregulation of multiple co‐expression modules containing genes located outside of the standard 7q11.23 deletion region may significantly contribute to the intermediate and highly variable Williams syndrome (WS) phenotypes.
The effects of the glial cell activation‐mediated mRNA/miRNA regulatory network provide novel insight into the biological mechanisms underlying WS neuropsychiatric phenotypes.
The downregulation of one miRNA module appears to have significant consequences on the transcriptome, leading to the upregulation of three mRNA modules, all of which include genes that are dispersed throughout the genome.
To our knowledge, this is the first time that the dysregulated mRNA and miRNA transcriptomic networks have been broadly evaluated in association with the complex phenotypes observed in WS patients.
Supporting information
Appendix S1. Supplemental Methods.
Figure S1. Study overview.
Figure S2. Copy number variation (CNV) in the Williams syndrome (WS)‐critical region at 7q11.23.
Figure S3. Gene expression in the Williams syndrome (WS)‐critical region at 7q11.23.
Figure S4. Estimated blood cell heterogeneity.
Figure S5. Receiver operating characteristic (ROC) curves.
Figure S6. Evaluation by linear mixed‐effects model.
Figure S7. Independent confirmation of the robustness of our weighted gene co‐expression network analysis (WGCNA) results.
Figure S8. Gene expression profile overlap between Williams syndrome (WS) and autism spectrum disorder (ASD).
Figure S9. Validation of the micro (mi)RNA expression profile in Williams syndrome (WS).
Table S1. Demographic and clinical characteristics of the Williams syndrome (WS), autism spectrum disorder (ASD), and healthy control participants used for our (A) gene expression analysis, (B) RNA‐sequencing analysis, and (C) micro (mi)RNA expression analysis.
Table S2. List of literature and Mouse Genome Informatics (MGI) resources for the specified categories of genes.
Table S3. List of genes in each of the six modules in our weighted gene co‐expression network analysis (WGCNA).
Table S4. List of the top 10 identified enriched biological process (BP) Gene Ontology terms for each module.
Table S5. Differentially expressed miRNAs in Williams syndrome (WS) compared to controls using a (A) genome‐wide microarray analysis (false discovery rate (FDR) <0.05 and |fold change (FC)| >1.25) and (B) weighted gene co‐expression network analysis (WGCNA) of the MM7 module.
Table S6. List of primers used in our (A) miRNA analysis, (B) SYBR green genomic quantitative PCR, and (C) Taqman probe‐based quantitative real‐time (qRT)‐PCR.
Acknowledgements
This work was supported by grants‐in‐aid from the Japan Agency for Medical Research and Development (grant number: JP16gm0510008), the Japan Society for the Promotion of Science (grant number: 16K09965), and the John Mung Program from Kyoto University. The authors are grateful to the Williams Syndrome Association of Japan and the families for their cooperation. They thank the members of the Geschwind Laboratory for their helpful suggestions. They also thank Mayumi Yoshida and Manami Sasaki for their technical assistance. The RNA‐seq and microarray analyses were performed, in part, at the Medical Research Support Center of Kyoto University. The authors have declared that they have no competing or potential conflicts of interest.
Conflict of interest statement: No conflicts declared.
Contributor Information
Ryo Kimura, Email: kimura.ryo.2w@kyoto-u.ac.jp.
Masatoshi Hagiwara, Email: hagiwara.masatoshi.8c@kyoto-u.ac.jp.
References
- Abrahams, B.S. , Arking, D.E. , Campbell, D.B. , Mefford, H.C. , Morrow, E.M. , Weiss, L.A. , … & Packer, A. (2013). SFARI Gene 2.0: a community‐driven knowledgebase for the autism spectrum disorders (ASDs). Molecular Autism, 4, 36. [DOI] [PMC free article] [PubMed] [Google Scholar]
- Adamo, A. , Atashpaz, S. , Germain, P.L. , Zanella, M. , D'Agostino, G. , Albertin, V. , … & Testa, G. (2015). 7q11.23 dosage‐dependent dysregulation in human pluripotent stem cells affects transcriptional programs in disease‐relevant lineages. Nature Genetics, 47, 132–141. [DOI] [PubMed] [Google Scholar]
- Agarwal, V. , Bell, G.W. , Nam, J.W. , & Bartel, D.P. (2015). Predicting effective microRNA target sites in mammalian mRNAs. Elife, 4, e05005. [DOI] [PMC free article] [PubMed] [Google Scholar]
- Albright, A.V. , & Gonzalez‐Scarano, F. (2004). Microarray analysis of activated mixed glial (microglia) and monocyte‐derived macrophage gene expression. Journal of Neuroimmunology, 157, 27–38. [DOI] [PubMed] [Google Scholar]
- Antonell, A. , Vilardell, M. , & Perez Jurado, L.A. (2010). Transcriptome profile in Williams‐Beuren syndrome lymphoblast cells reveals gene pathways implicated in glucose intolerance and visuospatial construction deficits. Human Genetics, 128, 27–37. [DOI] [PubMed] [Google Scholar]
- Barak, B. , & Feng, G. (2016). Neurobiology of social behavior abnormalities in autism and Williams syndrome. Nature Neuroscience, 19, 647–655. [DOI] [PMC free article] [PubMed] [Google Scholar]
- Bauer, D.E. , & Orkin, S.H. (2015). Hemoglobin switching's surprise: The versatile transcription factor BCL11A is a master repressor of fetal hemoglobin. Current Opinion in Genetics and Development, 33, 62–70. [DOI] [PMC free article] [PubMed] [Google Scholar]
- Benjamini, Y. , & Hochberg, Y. (1995). Controlling the false discovery rate ‐ a practical and powerful approach to multiple testing. Journal of the Royal Statistical Society Series B‐Methodological, 57, 289–300. [Google Scholar]
- Blumenthal, I. , Ragavendran, A. , Erdin, S. , Klei, L. , Sugathan, A. , Guide, J.R. , … & Talkowski, M.E. (2014). Transcriptional consequences of 16p11.2 deletion and duplication in mouse cortex and multiplex autism families. American Journal of Human Genetics, 94, 870–883. [DOI] [PMC free article] [PubMed] [Google Scholar]
- Brennand, K.J. , Landek‐Salgado, M.A. , & Sawa, A. (2014). Modeling heterogeneous patients with a clinical diagnosis of schizophrenia with induced pluripotent stem cells. Biological Psychiatry, 75, 936–944. [DOI] [PMC free article] [PubMed] [Google Scholar]
- Bruni, T.P. , Constantino, J.N. , & Gruber, C.P. (2014). Social Responsiveness Scale‐Second Edition (SRS‐2). Journal of Psychoeducational Assessment, 32, 365–369. [Google Scholar]
- Cahoy, J.D. , Emery, B. , Kaushal, A. , Foo, L.C. , Zamanian, J.L. , Christopherson, K.S. , … & Barres, B.A. (2008). A transcriptome database for astrocytes, neurons, and oligodendrocytes: A new resource for understanding brain development and function. Journal of Neuroscience, 28, 264–278. [DOI] [PMC free article] [PubMed] [Google Scholar]
- Chailangkarn, T. , Trujillo, C.A. , Freitas, B.C. , Hrvoj‐Mihic, B. , Herai, R.H. , Diana, X.Y. , … & McHenry, L. (2016). A human neurodevelopmental model for Williams syndrome. Nature, 536, 338–343. [DOI] [PMC free article] [PubMed] [Google Scholar]
- Clarke, L.E. , & Barres, B.A. (2013). Emerging roles of astrocytes in neural circuit development. Nature Reviews Neuroscience, 14, 311–321. [DOI] [PMC free article] [PubMed] [Google Scholar]
- Collette, J.C. , Chen, X.N. , Mills, D.L. , Galaburda, A.M. , Reiss, A.L. , Bellugi, U. , & Korenberg, J.R. (2009). William's syndrome: Gene expression is related to parental origin and regional coordinate control. Journal of Human Genetics, 54, 193–198. [DOI] [PMC free article] [PubMed] [Google Scholar]
- Cristino, A.S. , Williams, S.M. , Hawi, Z. , An, J.Y. , Bellgrove, M.A. , Schwartz, C.E. , … & Claudianos, C. (2014). Neurodevelopmental and neuropsychiatric disorders represent an interconnected molecular system. Molecular Psychiatry, 19, 294–301. [DOI] [PubMed] [Google Scholar]
- Csardi, G. , & Nepusz, T. (2006). The igraph software package for complex network research. InterJournal, Complex Systems, 1695, 1–9. [Google Scholar]
- Curran, M.E. , Atkinson, D.L. , Ewart, A.K. , Morris, C.A. , Leppert, M.F. , & Keating, M.T. (1993). The elastin gene is disrupted by a translocation associated with supravalvular aortic stenosis. Cell, 73, 159–168. [DOI] [PubMed] [Google Scholar]
- De Rubeis, S. , He, X. , Goldberg, A.P. , Poultney, C.S. , Samocha, K. , Cicek, A.E. , … & Buxbaum, J.D. (2014). Synaptic, transcriptional and chromatin genes disrupted in autism. Nature, 515, 209–215. [DOI] [PMC free article] [PubMed] [Google Scholar]
- Decimi, V. , Fazio, G. , Dell'Acqua, F. , Maitz, S. , Galbiati, M. , Rizzari, C. , … & Selicorni, A. (2016). Williams syndrome and mature B‐Leukemia: A random association? European Journal of Medical Genetics, 59, 634–640. [DOI] [PubMed] [Google Scholar]
- Dias, C. , Estruch, S.B. , Graham, S.A. , McRae, J. , Sawiak, S.J. , Hurst, J.A. , … & Turner, C. (2016). BCL11A haploinsufficiency causes an intellectual disability syndrome and dysregulates transcription. The American Journal of Human Genetics, 99, 253–274. [DOI] [PMC free article] [PubMed] [Google Scholar]
- Ehlers, S. , Gillberg, C. , & Wing, L. (1999). A screening questionnaire for Asperger syndrome and other high‐functioning autism spectrum disorders in school age children. Journal of Autism and Developmental Disorders, 29, 129–141. [DOI] [PubMed] [Google Scholar]
- Eppig, J.T. , Blake, J.A. , Bult, C.J. , Kadin, J.A. , Richardson, J.E. , & Mouse Genome Database Group (2015). The Mouse Genome Database (MGD): Facilitating mouse as a model for human biology and disease. Nucleic Acids Research, 43, D726–D736. [DOI] [PMC free article] [PubMed] [Google Scholar]
- Estes, M.L. , & McAllister, A.K. (2015). Immune mediators in the brain and peripheral tissues in autism spectrum disorder. Nature Reviews Neuroscience, 16, 469–486. [DOI] [PMC free article] [PubMed] [Google Scholar]
- Ewart, A.K. , Morris, C.A. , Atkinson, D. , Jin, W. , Sternes, K. , Spallone, P. , … & Keating, M.T. (1993). Hemizygosity at the elastin locus in a developmental disorder, Williams syndrome. Nature Genetics, 5, 11–16. [DOI] [PubMed] [Google Scholar]
- Filiano, A.J. , Xu, Y. , Tustison, N.J. , Marsh, R.L. , Baker, W. , Smirnov, I. , … & Kipnis, J. (2016). Unexpected role of interferon‐gamma in regulating neuronal connectivity and social behaviour. Nature, 535, 425–429. [DOI] [PMC free article] [PubMed] [Google Scholar]
- Geaghan, M. , & Cairns, M.J. (2015). MicroRNA and posttranscriptional dysregulation in psychiatry. Biological Psychiatry, 78, 231–239. [DOI] [PubMed] [Google Scholar]
- Geschwind, D.H. , & State, M.W. (2015). Gene hunting in autism spectrum disorder: On the path to precision medicine. The Lancet Neurology, 14, 1109–1120. [DOI] [PMC free article] [PubMed] [Google Scholar]
- Gold, D.L. , Wang, J. , & Coombes, K.R. (2005). Inter‐gene correlation on oligonucleotide arrays: How much does normalization matter? American Journal of Pharmacogenomics, 5, 271–279. [DOI] [PubMed] [Google Scholar]
- Hatton, D.D. , Hooper, S.R. , Bailey, D.B. , Skinner, M.L. , Sullivan, K.M. , & Wheeler, A. (2002). Problem behavior in boys with fragile X syndrome. American Journal of Medical Genetics, 108, 105–116. [DOI] [PubMed] [Google Scholar]
- Henrichsen, C.N. , Csardi, G. , Zabot, M.T. , Fusco, C. , Bergmann, S. , Merla, G. , & Reymond, A. (2011). Using transcription modules to identify expression clusters perturbed in Williams‐Beuren syndrome. PLoS Computational Biology, 7, e1001054. [DOI] [PMC free article] [PubMed] [Google Scholar]
- Issler, O. , & Chen, A. (2015). Determining the role of microRNAs in psychiatric disorders. Nature Reviews Neuroscience, 16, 201–212. [DOI] [PubMed] [Google Scholar]
- Jarvinen, A. , Korenberg, J.R. , & Bellugi, U. (2013). The social phenotype of Williams syndrome. Current Opinion in Neurobiology, 23, 414–422. [DOI] [PMC free article] [PubMed] [Google Scholar]
- Johnson, W.E. , Li, C. , & Rabinovic, A. (2007). Adjusting batch effects in microarray expression data using empirical Bayes methods. Biostatistics, 8, 118–127. [DOI] [PubMed] [Google Scholar]
- Kanehisa, M. , Sato, Y. , Kawashima, M. , Furumichi, M. , & Tanabe, M. (2016). KEGG as a reference resource for gene and protein annotation. Nucleic Acids Research, 44(D1), D457–D462. [DOI] [PMC free article] [PubMed] [Google Scholar]
- Khalfa, S. , Dubal, S. , Veuillet, E. , Perez‐Diaz, F. , Jouvent, R. , & Collet, L. (2002). Psychometric normalization of a hyperacusis questionnaire. ORL; Journal of Oto‐Rhino‐Laryngology and its Related Specialties, 64, 436–442. [DOI] [PubMed] [Google Scholar]
- Khattak, S. , Brimble, E. , Zhang, W. , Zaslavsky, K. , Strong, E. , Ross, P.J. , … & Ellis, J. (2015). Human induced pluripotent stem cell derived neurons as a model for Williams‐Beuren syndrome. Molecular Brain, 8, 77. [DOI] [PMC free article] [PubMed] [Google Scholar]
- Kipnis, J. (2016). Multifaceted interactions between adaptive immunity and the central nervous system. Science, 353, 766–771. [DOI] [PMC free article] [PubMed] [Google Scholar]
- Kuleshov, M.V. , Jones, M.R. , Rouillard, A.D. , Fernandez, N.F. , Duan, Q. , Wang, Z. , … & Lachmann, A. (2016). Enrichr: A comprehensive gene set enrichment analysis web server 2016 update. Nucleic Acids Research, 44(W1), W90–W97. [DOI] [PMC free article] [PubMed] [Google Scholar]
- Lalli, M.A. , Jang, J. , Park, J.H. , Wang, Y. , Guzman, E. , Zhou, H. , … & Kosik, K.S. (2016). Haploinsufficiency of BAZ1B contributes to Williams syndrome through transcriptional dysregulation of neurodevelopmental pathways. Human Molecular Genetics, 25, 1294–1306. [DOI] [PubMed] [Google Scholar]
- Langfelder, P. , & Horvath, S. (2008). WGCNA: An R package for weighted correlation network analysis. BMC Bioinformatics, 9, 559. [DOI] [PMC free article] [PubMed] [Google Scholar]
- Leyfer, O.T. , Woodruff‐Borden, J. , Klein‐Tasman, B.P. , Fricke, J.S. , & Mervis, C.B. (2006). Prevalence of psychiatric disorders in 4 to 16‐year‐olds with Williams syndrome. American Journal of Medical Genetics Part B: Neuropsychiatric Genetics, 141, 615–622. [DOI] [PMC free article] [PubMed] [Google Scholar]
- Liew, C.C. , Ma, J. , Tang, H.C. , Zheng, R. , & Dempsey, A.A. (2006). The peripheral blood transcriptome dynamically reflects system wide biology: A potential diagnostic tool. Journal of Laboratory and Clinical Medicine, 147, 126–132. [DOI] [PubMed] [Google Scholar]
- Lopez‐Romero, P. (2011). Pre‐processing and differential expression analysis of Agilent microRNA arrays using the AgiMicroRna Bioconductor library. BMC Genomics, 12, 64. [DOI] [PMC free article] [PubMed] [Google Scholar]
- Lukiw, W.J. , Andreeva, T.V. , Grigorenko, A.P. , & Rogaev, E.I. (2012). Studying micro RNA function and dysfunction in Alzheimer's disease. Frontiers in Genetics, 3, 327. [DOI] [PMC free article] [PubMed] [Google Scholar]
- Luo, R. , Sanders, S.J. , Tian, Y. , Voineagu, I. , Huang, N. , Chu, S.H. , … & Geschwind, D.H. (2012). Genome‐wide transcriptome profiling reveals the functional impact of rare de novo and recurrent CNVs in autism spectrum disorders. American Journal of Human Genetics, 91, 38–55. [DOI] [PMC free article] [PubMed] [Google Scholar]
- Maffioletti, E. , Cattaneo, A. , Rosso, G. , Maina, G. , Maj, C. , Gennarelli, M. , … & Bocchio‐Chiavetto, L. (2016). Peripheral whole blood microRNA alterations in major depression and bipolar disorder. Journal of Affective Disorders, 200, 250–258. [DOI] [PubMed] [Google Scholar]
- Merla, G. , Howald, C. , Henrichsen, C.N. , Lyle, R. , Wyss, C. , Zabot, M.T. , … & Reymond, A. (2006). Submicroscopic deletion in patients with Williams‐Beuren syndrome influences expression levels of the nonhemizygous flanking genes. American Journal of Human Genetics, 79, 332–341. [DOI] [PMC free article] [PubMed] [Google Scholar]
- Nardone, S. , Sams, D.S. , Zito, A. , Reuveni, E. , & Elliott, E. (2017). Dysregulation of cortical neuron DNA methylation profile in autism spectrum disorder. Cerebral Cortex, 27, 5739–5754. [DOI] [PMC free article] [PubMed] [Google Scholar]
- Ogino, S. , Nishihara, R. , VanderWeele, T.J. , Wang, M. , Nishi, A. , Lochhead, P. , … & Nan, H. (2016). The role of molecular pathological epidemiology in the study of neoplastic and non‐neoplastic diseases in the era of precision medicine. Epidemiology (Cambridge, Mass.), 27, 602. [DOI] [PMC free article] [PubMed] [Google Scholar]
- Oguro‐Ando, A. , Rosensweig, C. , Herman, E. , Nishimura, Y. , Werling, D. , Bill, B.R. , … & Geschwind, D.H. (2015). Increased CYFIP1 dosage alters cellular and dendritic morphology and dysregulates mTOR. Molecular Psychiatry, 20, 1069–1078. [DOI] [PMC free article] [PubMed] [Google Scholar]
- Osborne, L.R. (2010). Animal models of Williams syndrome. American Journal of Medical Genetics Part C, 154C, 209–219. [DOI] [PMC free article] [PubMed] [Google Scholar]
- Peter, B. , Matsushita, M. , Oda, K. , & Raskind, W. (2014). De novo microdeletion of BCL11A is associated with severe speech sound disorder. American Journal of Medical Genetics Part A, 164, 2091–2096. [DOI] [PubMed] [Google Scholar]
- Pham, X. , Song, G. , Lao, S. , Goff, L. , Zhu, H. , Valle, D. , & Avramopoulos, D. (2016). The DPYSL2 gene connects mTOR and schizophrenia. Translational Psychiatry, 6, e933. [DOI] [PMC free article] [PubMed] [Google Scholar]
- Pober, B.R. (2010). Williams‐Beuren syndrome. New England Journal of Medicine, 362, 239–252. [DOI] [PubMed] [Google Scholar]
- Pober, B.R. , Wang, E. , Caprio, S. , Petersen, K.F. , Brandt, C. , Stanley, T. , … & Gulanski, B. (2010). High prevalence of diabetes and pre‐diabetes in adults with Williams syndrome. American Journal of Medical Genetics Part C, 154C, 291–298. [DOI] [PMC free article] [PubMed] [Google Scholar]
- Prinz, M. , & Priller, J. (2014). Microglia and brain macrophages in the molecular age: From origin to neuropsychiatric disease. Nature Reviews Neuroscience, 15, 300–312. [DOI] [PubMed] [Google Scholar]
- Prinz, M. , & Priller, J. (2017). The role of peripheral immune cells in the CNS in steady state and disease. Nature Neuroscience, 20, 136–144. [DOI] [PubMed] [Google Scholar]
- Ronan, J.L. , Wu, W. , & Crabtree, G.R. (2013). From neural development to cognition: Unexpected roles for chromatin. Nature Reviews Genetics, 14, 347–359. [DOI] [PMC free article] [PubMed] [Google Scholar]
- Shannon, P. , Markiel, A. , Ozier, O. , Baliga, N.S. , Wang, J.T. , Ramage, D. , … & Ideker, T. (2003). Cytoscape: A software environment for integrated models of biomolecular interaction networks. Genome Research, 13, 2498–2504. [DOI] [PMC free article] [PubMed] [Google Scholar]
- Smyth, G.K. (2005). Limma: Linear models for microarray data In R. Gentleman, V. Carey, S. Dudoit, R. Irizarry & Huber W. (Eds.), Bioinformatics and computational biology solutions using R and Bioconductor (pp. 397–420). New York: Springer. [Google Scholar]
- Sofroniew, M.V. (2015). Astrocyte barriers to neurotoxic inflammation. Nature Reviews Neuroscience, 16, 249–263. [DOI] [PMC free article] [PubMed] [Google Scholar]
- Stinton, C. , Elison, S. , & Howlin, P. (2010). Mental health problems in adults with Williams syndrome. American Journal on Intellectual and Developmental Disabilities, 115, 3–18. [DOI] [PubMed] [Google Scholar]
- Strong, E. , Butcher, D.T. , Singhania, R. , Mervis, C.B. , Morris, C.A. , De Carvalho, D. , … & Osborne, L.R. (2015). Symmetrical dose‐dependent DNA‐methylation profiles in children with deletion or duplication of 7q11.23. American Journal of Human Genetics, 97, 216–227. [DOI] [PMC free article] [PubMed] [Google Scholar]
- Sullivan, P.F. , Fan, C. , & Perou, C.M. (2006). Evaluating the comparability of gene expression in blood and brain. American Journal of Medical Genetics. Part B, Neuropsychiatric Genetics, 141B, 261–268. [DOI] [PubMed] [Google Scholar]
- Vissers, L.E. , Gilissen, C. , & Veltman, J.A. (2016). Genetic studies in intellectual disability and related disorders. Nature Reviews Genetics, 17, 9–18. [DOI] [PubMed] [Google Scholar]
- Voineagu, I. , Wang, X. , Johnston, P. , Lowe, J.K. , Tian, Y. , Horvath, S. , … & Geschwind, D.H. (2011). Transcriptomic analysis of autistic brain reveals convergent molecular pathology. Nature, 474, 380–384. [DOI] [PMC free article] [PubMed] [Google Scholar]
- Werling, D.M. , Parikshak, N.N. , & Geschwind, D.H. (2016). Gene expression in human brain implicates sexually dimorphic pathways in autism spectrum disorders. Nature Communications, 7, 10717. [DOI] [PMC free article] [PubMed] [Google Scholar]
- Wolfe, D. , Dudek, S. , Ritchie, M.D. , & Pendergrass, S.A. (2013). Visualizing genomic information across chromosomes with PhenoGram. BioData Mining, 6, 18. [DOI] [PMC free article] [PubMed] [Google Scholar]
- Wu, Y.E. , Parikshak, N.N. , Belgard, T.G. , & Geschwind, D.H. (2016). Genome‐wide, integrative analysis implicates microRNA dysregulation in autism spectrum disorder. Nature Neuroscience, 19, 1463–1476. [DOI] [PMC free article] [PubMed] [Google Scholar]
- Zambon, A.C. , Gaj, S. , Ho, I. , Hanspers, K. , Vranizan, K. , Evelo, C.T. , … & Salomonis, N. (2012). GO‐Elite: A flexible solution for pathway and ontology over‐representation. Bioinformatics, 28, 2209–2210. [DOI] [PMC free article] [PubMed] [Google Scholar]
Associated Data
This section collects any data citations, data availability statements, or supplementary materials included in this article.
Supplementary Materials
Appendix S1. Supplemental Methods.
Figure S1. Study overview.
Figure S2. Copy number variation (CNV) in the Williams syndrome (WS)‐critical region at 7q11.23.
Figure S3. Gene expression in the Williams syndrome (WS)‐critical region at 7q11.23.
Figure S4. Estimated blood cell heterogeneity.
Figure S5. Receiver operating characteristic (ROC) curves.
Figure S6. Evaluation by linear mixed‐effects model.
Figure S7. Independent confirmation of the robustness of our weighted gene co‐expression network analysis (WGCNA) results.
Figure S8. Gene expression profile overlap between Williams syndrome (WS) and autism spectrum disorder (ASD).
Figure S9. Validation of the micro (mi)RNA expression profile in Williams syndrome (WS).
Table S1. Demographic and clinical characteristics of the Williams syndrome (WS), autism spectrum disorder (ASD), and healthy control participants used for our (A) gene expression analysis, (B) RNA‐sequencing analysis, and (C) micro (mi)RNA expression analysis.
Table S2. List of literature and Mouse Genome Informatics (MGI) resources for the specified categories of genes.
Table S3. List of genes in each of the six modules in our weighted gene co‐expression network analysis (WGCNA).
Table S4. List of the top 10 identified enriched biological process (BP) Gene Ontology terms for each module.
Table S5. Differentially expressed miRNAs in Williams syndrome (WS) compared to controls using a (A) genome‐wide microarray analysis (false discovery rate (FDR) <0.05 and |fold change (FC)| >1.25) and (B) weighted gene co‐expression network analysis (WGCNA) of the MM7 module.
Table S6. List of primers used in our (A) miRNA analysis, (B) SYBR green genomic quantitative PCR, and (C) Taqman probe‐based quantitative real‐time (qRT)‐PCR.
Data Availability Statement
The microarray and RNA‐seq datasets supporting the conclusions of this article are available in the GEO (accession numbers GSE89594 and GSE89595) and DDBJ (accession number JGAS00000000132) databases. The code used to analyze the data is available from the corresponding author on reasonable request.