

Abstract
Tumor-associated macrophages (TAMs) usually display the tumor-promoting M2 phenotype rather than the tumoricidal M1 phenotype. Thus, M2-to-M1 repolarization of TAMs has emerged as a promising strategy for tumor immunotherapy nowadays. However, immune side effects remain a great challenge, because phenotypic conversion of macrophages into the proinflammatory M1 phenotype may also be induced in normal tissue. Here, aiming at repolarizing TAMs without altering the M1/M2 polarization balance in healthy organs, we develop a micellar nanodrug with M2-targeting peptides (M2peptide) hidden in the pH-sheddable PEG corona so that an active targeting of M2-like macrophages is triggered only in the acidic tumor microenvironment (TME). The smart nanodrug effectively functions M2-to-M1 repolarization via M2-targeted codelivery of IKKβ siRNA and STAT6 inhibitor AS1517499 (AS), which suppresses the tumor growth and metastasis. Moreover, immune side effects are reduced because the neutral-pH environment in healthy organs does not trigger a “stealth-to-nonstealth” conversion of the nanodrug essential for M2-targeted drug delivery.
Short abstract
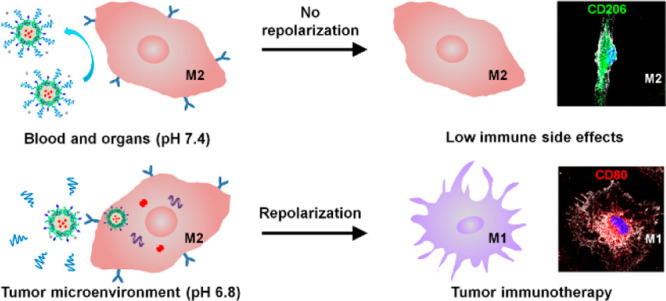
An M2-targeting nanodrug repolarizes M2 macrophages to M1 macrophages for cancer immunotherapy with low immune side effects due to its tumor acidity-triggered stealth-to-nonstealth conversion.
Introduction
Malignant solid tumors are composed of cancer cells and blood vessels, cancer-associated fibroblasts, immune cells, and extracellular matrix and signaling molecules.1,2 Although the major function of immune cells, including macrophages, is to combat cancer cells, immune cells typically have a noticeably dichotomous behavior in the tumor microenvironment. In particular, macrophages demonstrate continuum plasticity between the M1 and M2 subphenotypes in response to microenvironment signals,3−6 and compelling evidence has shown that tumor-associated macrophages (TAMs) abundant in the microenvironment of solid tumors are generally M2-polarized. It is known that the M1-like macrophages are proinflammatory and tumoricidal, whereas the M2-like macrophages are anti-inflammatory and protumoral. To date, the M2-polarized macrophages have been found to be associated with poor prognoses in various cancers.7−10 It exhibits numerous tumor-supportive properties, e.g., promoting angiogenesis by secreting vascular endothelial growth factor (VEGF),11 enhancing tumor invasion and metastasis through overexpressing matrix metalloproteinase (MMP),12 and restricting the adaptive immune response by secreting cytokines of interleukin 10 (IL-10) and transforming growth factor-beta (TGF-β).13,14 Therefore, the M2-polarized TAMs represent a promising target for tumor immunotherapy.
Effective antitumor immunotherapy has been demonstrated via depleting TAMs or reprogramming TAMs from the M2 protumoral phenotype toward the M1 antitumoral phenotype.15−17 Moreover, an M2-targeting delivery strategy can be applied to improve the therapeutic efficiency of administered drugs and to avoid the off-target effects on other leukocytes. For example, Pun et al. reported delayed mortality and selective reduction of the M2-like TAM population in tumor-bearing mice receiving an intravenous injection of a fusion peptide of proapoptotic peptide with an M2-targeting peptide (M2pep).18 However, according to research in other diseases, a depletion of M2-like macrophages or M1 activation may lead to chronic inflammation which causes tissue damage.19−21 For example, although the bisphosphonate (zoledronic acid) can be phagocytosed by TAMs to induce apoptosis and promote M2-to-M1 repolarization,22,23 side effects such as an osteonecrosis of the jaw may also be induced due to the nonspecific distribution and immune regulation.24,25 Therefore, when reprogramming M2-polarized macrophages toward the M1-like phenotype for antitumor immunotherapy, targeted drug delivery to the M2-like TAMs without significantly affecting the tissue-resident M2-like macrophages in normal organs such as the liver, spleen, and lung should be considered.
The macrophage phenotypic polarization is a complex dynamic process regulated by various signal molecules and signaling pathways. The JAK/STAT signaling pathway is pivotal in M1 and M2 macrophage polarization, and STAT6 is the crucial factor in IL-4-mediated immune responses during M2 macrophage activation.26 On the other hand, nuclear factor kappa-B (NF-κB) plays key roles in the PI3K/Akt,27 JNK,28 and Notch29 signaling pathways which are closely associated with inflammation responses and macrophage polarization. Because IKKβ is an important upstream molecule controlling NF-κB activation,30 its silencing may drive the M1 polarization of TAMs.31 Owing to the different mechanisms of STAT6 and NF-κB in promoting the M1 polarization of TAMs,32,33 a combination regulation of STAT6 and NF-κB is likely to achieve an optimal outcome. Hence, given the potential of the synergistic effect between the two different strategies, an M2-targeted codelivery of the STAT6 inhibitor and IKKβ siRNA may be a highly effective strategy to transform the M2-polarized TAMs to the M1-polarized ones.34
We herein describe a dual pH-sensitive nanodrug which can effectively repolarize TAMs for antitumor immunotherapy while minimizing the risk of breaking the M1/M2 polarization balance in healthy organs. As outlined in Figure 1, the nanodrug integrating a STAT6 inhibitor AS1517499 (AS) and IKKβ siRNA was prepared and then coated with sheddable PEG to hide the M2-targeting peptide (M2pep). The pH-sensitive PEG-conjugating structure, 1-amide-2-propionic ester-3-methyl maleic acid (phe), was stable at neutral pH but cleavable in the acidic tumor microenvironment (TME).35 Thus, the PEG corona will remain in the bloodstream and normal organs to render the nanodrug stealth property, whereas the PEG shedding will be triggered inside the tumor to let M2pep be exposed for active M2-targeting. Meanwhile, the sheddable PEG envelope may effectively protect the transported siRNA from enzymatic degradation in the blood circulation, and the pH-sensitive core of the nanodrug may facilitate endolysosomal escape of the nanodrug and rapid release of AS inside M2-like TAMs. The antitumor immunotherapeutic effects via M2-to-M1 repolarization of TAMs and immune side effects of the nanodrug were assessed both in vitro and in vivo.
Figure 1.

Schematic illustration of PEG-sheddable nanodrug targeting M2-like TAMs for antitumor immunotherapy.
Results
Synthesis of Copolymers and Preparation of Micelles
Diblock copolymer (N3–P[Lys(M2pep)-Lys]–PAsp(DIP-co-BZA)) grafted with TAM-targeting peptide was synthesized via multistep reactions as outlined in Scheme S1. The polymer mPEG-phe-DBCO designed as a pH-sensitive coating of the nanodrug was synthesized as shown in Scheme S2. Principally, after the micelle was assembled from N3–P[Lys(M2pep)-Lys]–PAsp(DIP-co-BZA), it was decorated with pH-sheddable PEG via click reaction on the micelle surface,36,37 as shown in Figure 2A. Through such a design, an active targeting of M2-like macrophages may be triggered only in the tumor acidic microenvironment. A triblock copolymer mPEG-P[Lys(M2pep)-Lys]–PAsp(DIP-co-BZA) was also synthesized to prepare the micelle with a nonsheddable PEG corona (Scheme S3). The polymers were characterized by 1H NMR analysis (Figures S1–S10). According to the integration ratio of the peaks at 3.82 ppm (N3CH2−) and 7.16–7.38 ppm (−CH2C6H5 of PBCLLys and PBLAsp), the polymerization degrees of PBCLLys and PBLAsp were both calculated to be 55. After ammonolysis, the disappearance of resonance peaks at 4.93–5.10 ppm (C6H5CH2OOC−) indicated a complete reaction and successful removal of N-benzyloxycarbonyl group in PBCLLys. The residual peaks at 7.16–7.38 ppm (−CH2C6H5) represented the phenyl group in PAsp(DIP-co-BZA). The grafting degree of DIP in PAsp(DIP-co-BZA) was calculated to be 69.10% via analyzing the grafting degree of BZA from the 1H NMR spectra. The molecular weights of polymers are summarized in Table S1.
Figure 2.

Characterizations of the micelleplex with a sheddable PEG corona. (A) Molecular structure of mPEG-phe-P[Lys(M2pep)-Lys]–PAsp(DIP-co-BZA). (B) Electrophoretic mobility of siRNA in agarose gel after complexing with drug-free micelle (T-blank) at various N/P ratios. (C) Effects of N/P ratios on particle sizes and ζ potentials of micelleplex T-Si prepared from polymer N3–P[Lys(M2pep)-Lys]–PAsp(DIP-co-BZA) and siRNA at various N/P ratios. (D) Morphology and size of micelleplex ST-Si (N/P = 15) at pH 7.4 and pH 6.8 revealed by TEM and DLS measurements. (E) 1H NMR spectra of mPEG-phe-DBCO and mPEG-OMA in CDCl3. mPEG-OMA was obtained from mPEG-phe-DBCO after treating in PBS of pH 6.8 for 24 h.
The amphiphilic diblock copolymers N3–P[Lys(M2pep)-Lys]–PAsp(DIP-co-BZA) were self-assembled into M2-targeting micelle with (T-AS) or without (T-blank) encapsulating hydrophobic AS in the micellar core. Using the standard curve of AS established through measuring the characteristic peak of 308 nm with UV–vis spectrophotometry (Figure S11A,B), the AS loading content of T-AS was measured to be 3.02%. The complexation of cationic T-blank with siRNA driven by electrostatic interaction was assessed by the agarose gel electrophoresis assay. As shown in Figure 2B, a complete retardance of siRNA migration was observed above the N/P ratio of 8, which indicated complete siRNA complexation.
The PEG grafting degree of the ST micelle was measured to be 94 ± 3% owing to the extremely high selectivity and reaction rate of the Cu-free click cycloaddition reaction,37−39 which indicated that the PEG density on the surface of the ST micelle was just slightly different from that on the surface of the NT micelle. Thus, these two prepared micelles, ST-Cr6&Cy3 and NT-Cr6&Cy3, were a suitable pair for comparison in the present study.
The particle sizes and ζ potentials of micelleplexes obtained via complexation of siRNA with T-blank at different N/P ratios were determined by dynamic light scattering (DLS). The particle size decreased along with the increase of N/P ratio until N/P 15 because the electrostatic interactions between cationic micelle and negatively charged siRNA led to the outer layer compaction of the micelle (Figure 2C). T-blank showed an averaged hydrodynamic diameter of 232.5 ± 10.5 nm, whereas the micelleplex formed at N/P 15 was decreased to 186.5 ± 6.0 nm. Then, a further increase in N/P ratio above N/P 15 led to a slight increase in particle size, likely because the uncomplexed micelle may exist. The ζ potential of the micelleplex increased to +27.6 mV from +3.1 mV along with the increase of N/P ratio to 50 from 10. In consideration of its relatively small size (186.5 nm) and weak positive charge (+10.6 mV), the micelleplex formed at N/P ratio of 15 was selected for further experiments. At pH 7.4, the micelleplex ST-Si possessed a uniform spherical morphology under transmission electron microscopy (TEM) observation and an averaged hydrodynamic diameter of 214.2 ± 6.8 nm according to the DLS measurement (Figure 2D). At pH 6.8, the micelleplex showed the same morphology but a decreased particle size around 196 nm due to the removal of the sheddable PEG corona.
To further assess the pH sensitivity of the sheddable PEG coating, mPEG5k-phe-DBCO was incubated in PBS (10 mM, pH 6.8) to yield methoxy-poly(ethylene glycol)-2-(3-oxopropyl) maleic acid (mPEG5k-OMA). The two polymers mPEG5k-phe-DBCO and mPEG5k-OMA were characterized by 1H NMR analysis. As shown in Figure 2E, after reaction the characteristic 1H NMR peaks at 7.16–7.38 ppm (phenyl group of DBCO) disappeared, which implied that the PEG corona could be removed from the micelleplex in the acidic tumor microenvironment (pH ∼ 6.8).
Cytotoxicity and Cell Uptake
After treatment with MCS-F and IL-4, more than 95% of the bone marrow derived macrophages were CD206-positive, indicating the M2-like phenotype (Figure S12A). The percentage of CD206-positive cells did not change much no matter whether the macrophages were incubated at pH 7.4 or at pH 6.8 (Figure S12B). The M2-like macrophages showed viabilities above 80% even after incubation with T-blank and ST at concentrations up to 200 μg mL–1 (Figure S13), indicating low cytotoxicities of the micellar carrier and polymer. Furthermore, decoration of the sheddable PEG corona had negligible effect on the cytotoxicity of the micelle.
Cell uptake and intracellular distribution of micelleplexes (ST-Cr6&Cy3 and NT-Cr6&Cy3) in M2-like macrophages were evaluated using confocal laser scanning microscopy (CLSM) and flow cytometry. As shown in Figure 3A, the cells incubated with ST and the cells incubated with NT at pH 7.4 showed no obvious difference in their Cr6 and Cy3 fluorescence intensities. In contrast, at pH 6.8, the cells incubated with ST showed obviously higher Cr6 and Cy3 fluorescence intensities than the cells incubated with NT, which indicated the M2peptide-mediated targeting delivery to M2-like macrophages as a result of PEG shedding at pH 6.8. These results are meaningful because they implied that the PEG shedding allowing M2-targeted delivery would only occur in the acidic tumor microenvironment rather than normal tissues with neutral pH. Flow cytometry was employed to quantitatively measure the uptake levels of micelleplexes by M2-like macrophages, which obtained results in line with the CLSM analyses (Figure 3B). To further evaluate the specificity of M2 peptide-mediated delivery to M2-like macrophages, the M2-like macrophages and GFP-4T1 cancer cells were cocultured with NT-Cr6&Cy3 or ST-Cr6&Cy3 at pH 6.8. As shown in Figure 3C,D, the PEG-sheddable micelleplex ST-Cr6&Cy3 obviously showed a preferential uptake by the M2-like macrophages, whereas the PEG-nonsheddable NT-Cr6&Cy3 showed equivalently low uptake levels by the M2-like macrophages and GFP-4T1 cancer cells. These results further confirmed the feasibility of using the nanodrug with M2peptide hidden underneath the pH-sheddable PEG corona to target the M2-like TAMs in the tumor microenvironment (pH ∼ 6.8).
Figure 3.

Cellular uptake and intracellular distribution of micelleplexes in M2-like macrophages. (A) Confocal laser scanning microscopic (CLSM) imaging of M2-like macrophages incubated with ST-Cr6&Cy3 and NT-Cr6&Cy3 at pH 6.8 or pH 7.4 for 6 h. (B) Quantitative analysis of Cr6- and Cy3-positive M2-like macrophages by flow cytometry after cell incubation with ST-Cr6&Cy3 and NT-Cr6&Cy3 at pH 6.8 or pH 7.4 for 6 h. (C) CLSM imaging of M2-like macrophages and GFP-4T1 cancer cells coincubated with ST-Cr6&Cy3 or NT-Cr6&Cy3 at pH 6.8 for 6 h. Red fluorescence, Cy3-labeled scrambled siRNA (SCR); green fluorescence: GFP protein expressed in GFP-4T1 cancer cells; scale bars represent 10 μm. (D) Relative Cy3 fluorescence intensities in M2-like macrophages and GFP-4T1 tumor cells coincubated with ST-Cr6&Cy3 or NT-Cr6&Cy3 at pH 6.8 for 6 h. The Cy3 fluorescence intensity in GFP-4T1 tumor cells incubated with NT-Cr6&Cy3 was used for normalization. ***P < 0.001 vs ST in M2-like macrophages. Statistical graphs shown in part D are from the CLSM images shown in part C.
Repolarization of M2-Like TAMs in Vitro
The M2-like macrophages were derived from the extracted bone marrow and stimulated by M-CSF and IL-4. The target gene silencing efficiency of IKKβ siRNA in M2-like macrophages was verified using quantitative real-time PCR (qRT-PCR) and Western blot (WB) assays. As shown in Figure S14, the effects of three doses (50, 100, and 200 nM) on macrophage repolarization were compared, and a high siRNA dose may lead to a more efficient repolarization of the M2-like macrophages to the M1-like ones. Increasing the siRNA dose to 100 nM from 50 nM resulted in very significant downregulation of the M2 biomarker CD206 and upregulation of the M1 biomarker CD80. Nevertheless, the effect became much weaker when further increasing the siRNA dose to 200 nM from 100 nM. Moreover, at a constant siRNA concentration (100 nM), increasing the AS concentration to 0.8 μM from 0.1 μM effectively promoted the macrophage repolarization, whereas further increasing the AS concentration above 0.8 μM appeared ineffective in promoting the macrophage repolarization. Therefore, the 100 nM Si and 0.8 μM AS were set for the investigation of macrophage repolarization. Then, the expression levels of the IKKβ gene in the M2-like macrophages incubated at pH 6.8 were significantly downregulated to 39.71% and 36.27% by ST-Si and ST-AS&Si, respectively (Figure 4A). Meanwhile, the WB results showed an obviously suppressed expression of IKKβ protein, which was consistent with the qRT-PCR results. On the other hand, cell incubations with ST-AS and ST-AS&Si both significantly suppressed the expression levels of phospho-STAT6 (pSTAT6) protein in the M2-like macrophages (Figure 4B). In consideration that AS is an effective inhibitor for the phosphorylation of STAT6 protein,40 these results indicated that AS was efficiently delivered into the M2-like macrophages. As shown in Figure 4B, using the PEG-sheddable and M2-targeting nanocarrier, although a single drug treatment with AS or IKKβ siRNA appeared effective in inducing a repolarization of the M2-like macrophages toward M1-like macrophages, the combination treatment using two drugs was the most potent. In the macrophages incubated with ST-AS&Si, the arginase I (Arg I) protein as a typical biomarker of the M2-like macrophages was most significantly downregulated, whereas the inducible nitric oxide synthase (iNOS) protein as a typical biomarker of the M1-like macrophages was markedly upregulated. Moreover, analyses of the M2/M1-associated genes obtained consistent results. As shown in Figure 4C, the expression levels of M2-associated genes including IL-10, CD206, TGF-β, and Arg I were obviously downregulated, whereas the expression levels of M1-associated genes including IL-12, CD80, TNF-α, and IFN-γ were remarkably upregulated upon cell incubations with the three AS/siRNA-incorporated nanodrugs, with ST-AS&Si showing the best effect. The scrambled siRNA formulation (ST-SCR) did not cause a repolarization of the M2-like macrophages. These results strongly demonstrated that ST-AS&Si effectively repolarized the M2-like macrophages to M1-like macrophages via the joint effect of IKKβ gene silencing and STAT6 protein inhibition.
Figure 4.

Repolarization of M2-like macrophages in vitro. (A) IKKβ mRNA levels determined by quantitative real-time PCR (qRT-PCR) in M2-like macrophages incubated with different formulations for 48 h. **P < 0.01. (B) Protein expression levels of IKKβ, STAT6, Arg I, and iNOS determined by Western blot (WB) in M2-like macrophages incubated with different formulations for 48 h. (C) mRNA levels of M2/M1-associated genes determined by qRT-PCR in M2-like macrophages incubated with different formulations for 48 h. *P < 0.05, **P < 0.01, ***P < 0.001. (D) Morphological transformation indicative of phenotypic change of M2-like macrophages incubated with different formulations for 48 h. M2-like macrophages labeled green with anti-CD206 antibody; M1-like macrophages labeled red with anti-CD80 antibody; cell nuclei stained blue; tubulin stained gray. Scale bars represent 5 μm. (E) Schematic illustration of the morphology transformation of M2-like macrophages following the repolarization process. IKKβ siRNA dose, 100 nM; AS concentration if applied, 0.8 μM.
Because the M2-like macrophages and M1-like macrophages exhibit distinct morphologies,17 the phenotypic transformation of macrophages can be indicated by an obvious change of cell morphology. As schematically illustrated in Figure 4E, the M2-like macrophages display a morphology of elongated fusiform while the M1-like ones display a round and flattened cellular morphology. To better visualize the morphological change of macrophages against different nanodrug treatments, the M2-like macrophages and M1-like macrophages were labeled into green and red with anti-CD206 and anti-CD80 antibodies, respectively. As shown in Figure 4D, clear morphological changes from the M2-like phenotype to an M1-like one were observed as a result of AS and/or IKKβ siRNA treatments mediated by the PEG-sheddable and M2-targeting nanocarrier. Notably, the combination treatment using ST-AS&Si seemed to exhibit the best effect to induce the M2-to-M1 morphological change. Again, these results revealed that, using the PEG-sheddable and M2-targeting nanocarrier, both the AS and IKKβ siRNA treatments may cause a repolarization of the M2-like macrophages into M1-like macrophages, and the two drug combination treatment was even more effective to induce such phenotypic transformation.
Immunotherapeutic Effects of Nanodrugs
The in vivo immunotherapies were initiated via tail vein injection of nanodrugs. One tail vein injection was applied every 3 days over 19 days as shown in the treatment schedule of Figure 5A. To explore the in vivo distribution and tumor accumulation of nanodrugs, a fluorescence imaging study was carried out in mice bearing a subcutaneous graft of the 4T1 breast tumor. The micelles labeled with near-infrared fluorescent dye 1,1′-dioctadecyl-3,3,3′,3′-tetramethylindotricarbocyanine iodide (DiR), ST-Dir, and NT-Dir were injected into tumor-bearing mice via the tail vein, and then, the in vivo distribution of Dir fluorescence was monitored against postinjection time. As shown in Figure 5B, both micelles exhibited liver accumulation after intravenous (IV) injection, which is a normal phenomenon for nanoparticles admittedly subjected to clearance by the reticuloendothelial system.41 More importantly, both micelles accumulated gradually in the tumor site to reach the highest Dir fluorescence intensities after IV injections, and the tumor accumulation of ST-Dir was even much better than that of NT-Dir (Figure 5D). Ex vivo imaging studies of major organs and tumors from mice sacrificed at 48 h after micelle injection obtained consistent results (Figure 5C,E). Based on these results, it was likely that the sheddable PEG corona was removed from the micelle surface to expose the M2-tageting ligand (M2peptide) in the acidic tumor microenvironment, which led to an increased tumor retention of the micelle.
Figure 5.

Antitumor immunotherapeutic effect in mice bearing subcutaneous 4T1 grafts. (A) Schematic illustration of immunotherapeutic studies in vivo. (B) In vivo Dir fluorescence imaging of mice bearing the 4T1 tumor after tail vein injection of ST-Dir or NT-Dir and (D) relative Dir fluorescence intensity in tumor tissues at different time points. (C) Ex vivo Dir fluorescence imaging and (E) relative Dir fluorescence intensities in major organs (heart, He; liver, Li; spleen, Sp; lung, Lu; kidney, Ki; tumor, Tu) of the above mice sacrificed at 48 h postinjection. (F) Orthotopic 4T1 tumor growth in mice receiving different treatments (n = 6). The injections were performed every 3 days for a total of seven treatments. (G) Cumulative survival of 4T1 tumor-bearing mice receiving difference treatments (n = 8). (H) Histological analyses of 4T1 tumor sections from mice having undergone a total of 19 days of treatment. In H&E staining, blue indicated nuclei, and red indicated extracellular matrix and cytoplasm. In the TUNEL assay, apoptotic cells were stained brown. Scale bars represent 50 μm. (I) In vivo bioluminescence imaging (BLM) of Luc-4T1 tumor-bearing mice receiving various treatments at different treatment time points to track orthotopic tumor growth and metastases (n = 6). (J) Tumor metastasis potential in mice bearing subcutaneous 4T1 grafts. Representative ex vivo bioluminescent images (BLM) and the H&E staining of livers and lungs obtained from the Luc-4T1 tumor-bearing mice having undergone a total of 19 days of treatment to track tumor metastases. Yellow arrows indicated metastatic tumor nodules. Scale bars represent 50 μm. siRNA dose, 250 μg/kg body weight; AS dose, 60 μg/kg body weight. *P < 0.05; **P < 0.01; ***P < 0.001.
A tumor graft mice model established via subcutaneously implanting luciferase-expressing 4T1 cells, i.e., the mice Luc-4T1 tumor model, was used to verify the effects of nanodrugs on tumor growth and metastasis. As shown in Figure 5F, the mice treated with PBS and ST showed the fastest tumor growth, reaching 1943 ± 87 and 1953 ± 177 mm3 at 16 days, respectively. In comparison, the three nanodrugs incorporating the therapeutic agent (ST-AS, ST-Si, and ST-AS&Si) obviously inhibited the tumor growth. In particular, the treatment with nanodrug integrating AS and siRNA (ST-AS&Si) most effectively inhibited the tumor growth, showing a tumor growth inhibition of 83.94% compared to the PBS treatment at 16 days (312 ± 25 vs 1943 ± 87 mm3). Cumulative survival of the 4T1 tumor-bearing mice was consistent with the tumor growth inhibition results (Figure 5G). That is, although the single drug-incorporated nanodrugs (ST-AS and ST-Si) were effective in prolonging the animal survival, the ST-AS&Si treatment was even much more potent. One additional syngeneic orthotopic tumor model was established to test the antitumor efficacy of nanodrugs. As shown in Figure S15A, the antitumor potential of the pH-sensitive PEGylated AS&Si-encapsulated micelle decorated with scrambled M2pep (scrM2pep), i.e., STscr-AS&Si, was similar to that of NT-AS&Si likely due to the lack of the TAM-targeting ability for both STscr-AS&Si and NT-AS&Si. By contrast, the ST-AS&Si treatment was very potent in inhibiting the syngeneic orthotopic tumor. The animal survival of the ST-AS&Si treatment group was distinctly prolonged compared with the other three treatment groups (Figure S15B). The body weights of each group showed no significant difference (Figure S15C), and serum levels of BUN, CRE, ALT, and AST in tumor-bearing mice receiving various treatments were in the reference range (Table S3), indicating that treatments with all these formulations had negligible adverse effects on the mice. Hematoxylin/eosin (H&E) staining and the TUNEL assay were performed to further confirm the therapeutic effect of nanodrugs. As shown in Figure 5H, the tumor tissues obtained from the animals receiving PBS or ST showed a dense population of atypical cancer cells without signs for apoptosis. By contrast, the ST-AS and ST-Si treatments led to decreased cancer cell density and increased apoptosis in tumor tissues. Moreover, tumor sections from the animals receiving ST-AS&Si showed the fewest cancer cells and the highest cell apoptosis level, which made evident again the best inhibitory effect of ST-AS&Si on tumor growth.
Tumor growth and metastasis in mice receiving different treatments were further monitored with bioluminescence imaging. As shown in Figure 5I, the bioluminescence imaging revealed the same orthotopic tumor growth as measured with the caliper (Figure 5F). Moreover, obvious tumor metastasis was found in mice treated with PBS and ST according to the bioluminescence distribution of the Luc-4T1 tumor. At 19 days, bioluminescence was seen not only in the orthotopic tumor sites but also in other areas. In comparison, tumor metastasis in animals treated with ST-AS, ST-Si, and ST-AS&Si was obviously suppressed. In particular, no bioluminescence for the metastatic tumor other than the orthotopic one was observed in animals receiving ST-AS&Si, even in the ex vivo bioluminescence imaging of liver and lung. The ex vivo bioluminescence imaging and histological studies of the liver and lung achieved the same results. As shown in Figure 5J, severe tumor metastasis was shown in both the lung and liver of the PBS and ST treated mice. Treatments with ST-AS and ST-Si obviously reduced tumor metastasis in the liver and lung. More excitingly, tumor metastasis to the liver and lung was not detectable by the ex vivo bioluminescence imaging in mice treated with ST-AS&Si. Histological studies on tumor sections obtained from the same organs as examined in the ex vivo bioluminescence imaging obtained consistent results. Obviously, it confirmed once again the marked inhibitory effect of ST-AS&Si on 4T1 tumor metastasis; i.e., no metastatic tumor nodule was seen in the liver and lung sections.
Evidence of TAM Repolarization for Effective Immunotherapy
The proportions of M2-like and M1-like TAMs in tumor tissues were analyzed through determining the M2 biomarker CD206 and M1 biomarker CD80 with flow cytometry and immunofluorescence staining (Figure 6). Mice treated with PBS and ST showed high levels of M2-like TAMs (CD206high) reaching 43.1% and 42.2% in CD45+CD11b+F4/80+ cells (absolute percentage of 1.81% and 1.76% in tumor tissue), respectively, which was in line with the fast tumor growth and severe tumor metastasis of the two groups. In comparison, mice treated with ST-AS, ST-Si, and ST-AS&Si showed obviously reduced M2-like TAMs in the tumor tissue. In particular, mice treated with the micelleplex ST-AS&Si showed the lowest M2-like TAMs (0.33%) while the highest M1-like TAMs (2.16%). The highest number of M1-like TAMs in the tumor tissue of mice receiving ST-AS&Si was also shown in the CLSM observation (Figure 6C and Figure S16). Immunohistochemical studies achieved consistent results as well. As shown in Figure 6D, the tumor tissue in mice receiving PBS and the blank micelle ST showed high levels of IKKβ and pSTAT6 protein expressions. Obviously, the treatments with ST-Si and ST-AS&Si effectively suppressed the IKKβ protein expression as an outcome of target gene silencing by siRNA, while the treatments with ST-AS and ST-AS&Si effectively suppressed the pSTAT6 protein expression as a result of the AS-induced STAT6 deactivation. Moreover, the inducible nitric oxide synthase (iNOS) as an M1 biomarker was upregulated, whereas the arginase I (Arg I) as an M2 biomarker was downregulated in the tumor tissues of mice receiving ST-AS, ST-Si, and ST-AS&Si, which revealed once again the repolarization of the M2-phenotype to M1-penotype via the ST and siRNA treatments mediated by the PEG-sheddable micelle. In particular, ST-AS&Si showed the best effect on such phenotypic repolarization of TAMs.
Figure 6.

Repolarization of TAMs and regulation of T cells to reshape the tumor immune microenvironment for effective immunotherapy in vivo. (A) Flow cytometric analysis of M2-like TAMs, M1-like macrophages, CD8+ T cells, Th1 cells, and Tregs in the tumor tissue from mice receiving various treatments at 8 days (see Figure 5A for the in vivo study schedule). M1- and M2-like macrophages were gated on CD45+CD11b+F4/80+ cells. CD8+ T cells, Th1 cells, and Tregs were gated on CD45+CD3+ cells, CD4+ cells, and CD4+CD25+ cells, respectively. (B) Representative flow cytometric analysis displaying the absolute percentage of the tumor-infiltrating M2-like macrophages, M1-like macrophages, CD8+ T cells, Th1 cells, and Tregs in the tumor following various treatments. Data are presented as mean ± SD (n = 3). *P < 0.05; **P < 0.01; ***P < 0.001. (C) Immunofluorescence assays displaying M2-like TAMs, M1-like macrophages, CD8+ T cells, Th1 cells, and Tregs in the tumor tissue at 8 days after various treatments. Scale bars represent 50 μm. See Figures S16 and S17 for unmerged images. (D) Expression levels of target proteins (IKKβ and pSTAT6), and macrophage biomarkers (M2, Arg I; M1, iNOS) in the 4T1 tumor from mice receiving various treatments at 19 days after various treatments. Scale bars represent 50 μm. siRNA dose, 250 μg/kg body weight; AS dose, 60 μg/kg body weight.
Unlike the tumor-promoting M2-like macrophages,42 it is known that M1-like macrophages display tumoricidal effects via producing ROS,43 activating effector T cells,44 promoting cell apoptosis,45 etc. Therefore, the above results indicated that the best inhibition of 4T1 tumor orthotopic growth and metastasis in mice receiving the ST-AS&Si treatment was resulted from the most effective repolarization of TAMs. In addition, the results strongly demonstrated a joint therapeutic effect of AS and siRNA when ST-AS&Si was administered.
To further verify the immunotherapeutic effect of the nanodrugs, the T cell infiltration in tumor tissues of mice receiving various treatments was also investigated. As a result of repolarization of TAMs into M1-like macrophages via treatments with ST-AS, ST-Si, and ST-AS&Si, the tumor infiltration of tumoricidal CD8+ T cells and Th1 cells was elevated obviously (Figure 6A,B). In particular, the ST-AS&Si treatment resulted in the highest infiltration of both CD8+ T cells (0.37%) and Th1 cells (0.26%) in the tumor tissue of mice. Since the regulatory T cells (Tregs) were the typical immune cells contributing to the immunosuppressive microenvironment in tumor tissues, the effects of nanodrugs on Tregs in tumor tissues were also explored. As determined by flow cytometry, the proportion of Tregs in tumor tissues of mice receiving ST-AS&Si was only 0.05%, which was significantly lower than that in the tumor tissue of mice receiving PBS (0.34%). The immunofluorescent staining assay achieved consistent results (Figure 6C and Figure S17), which revealed once again that the ST-AS&Si treatment resulted in the highest tumor infiltration of CD8+ T cells and Th1 cells but the lowest tumor infiltration of Tregs, which apparently contributed to the most effective inhibition of tumor growth and metastasis.
Decreased Proinflammatory Effects in the Liver and Lung via Tumor Acidity-Triggered Targeting Delivery
Although the M2-to-M1 repolarization of macrophages in tumor sites inhibits the tumor growth and metastasis, such activity in healthy organs may break the phenotypic balance of macrophages and leads to proinflammatory side effects. Thus, the M2-to-M1 repolarization and proinflammatory side effects of various treatments in the liver and lung as representative organs were explored, which was believed to be likewise important for our TAM-targeting strategy using the tumor acidity-sensitive PEG-sheddable nanocarriers. First, accumulation of micelles with and without the sheddable PEG corona in the liver and lung was investigated. To visualize the micelles, Nile red (NR) instead of AS was encapsulated. As shown in Figure 7A, T-NR without PEG shielding accumulated more in both the liver and lung than ST-NR according to the stronger NR fluorescence. Moreover, the NR fluorescence marking micelles overlapped nicely with that of CD206 marking the M2-like macrophages, which indicated that the enhanced liver and lung accumulations of T-NR were due to the M2-targeting delivery. In contrast, the M2peptide of ST-NR was unable to bind M2-like macrophages because a PEG shedding to expose M2peptide could not occur at the neutral pH of the liver and lung tissue, which impeded the uptake of ST-NR by M2-like macrophages to enhance liver and lung accumulations. Thus, the sheddable PEG corona introduced onto the M2peptide-modified nanodrugs may function as a pH-sensitive “on–off” for M2-targeting to enhance the tumor accumulation, i.e., M2-targeting “on” at tumor acidity, while lowering the accumulations in healthy organs such as the liver and lung, i.e., M2-targeting “off” at neutral pH.
Figure 7.

Decreased proinflammatory effects in the liver and lung via tumor acidity-triggered targeting delivery. (A) Confocal laser scanning microscopic (CLSM) imaging showing uptake of micelleplex T-NR, NT-NR, or ST-NR by M2-like macrophages in the lung and liver after 24 h postinjection of the micelleplex. Green fluorescence indicates anti-CD206 antibody labeling M2 macrophages, and red fluorescence indicates NR-loaded micelles. Scale bars represent 25 μm. (B) H&E staining and immunohistochemical assay of the lung and liver from mice after receiving treatments of PBS, T-AS&Si, NT-AS&Si, or ST-AS&Si every 2 days for a total of five injections. Red arrows indicate damages of the alveolar wall in lung and hepatic sinusoid well in the liver, and black arrows show inflammatory cells. Amounts of M2- or M1-like macrophages and expressions of M1-associated proinflammatory factor TNF-α in the lung and liver were analyzed by immunohistochemical assay to explore the inflammatory reaction. CD206-positive cells (M2) and CD80-positive cells (M1) counted in the lung (C) and liver (D), *P < 0.05. Scale bars represent 50 μm; siRNA dose, 250 μg/kg body weight; AS dose, 60 μg/kg body weight.
Then, the M2-to-M1 repolarization of macrophages in the liver and lung and resultant proinflammatory effects, which are critical for the nanodrug to be considered as a potential antitumor immunotherapeutic agent, were further investigated. Immunohistochemical assays were performed to analyze the M2 biomarker CD206 and M1 biomarker CD80. In comparison with PBS treatment, T-AS&Si treatment and NT-AS&Si treatment decreased the M2-like macrophages but increased the M1-like macrophages in the liver and lung, indicating M2-to-M1 repolarization in these organs. Excitingly, the ST-AS&Si treatment showed a much lowered effect on the macrophage phenotypes in both the liver and lung (Figure 7B–D). Consequently, the animals receiving ST-AS&Si showed lower expression levels of proinflammatory TNF-α produced by the M1-like macrophages. Finally, the H&E images of lungs and livers from mice receiving T-AS&Si and NT-AS&Si treatment showed some damages of the alveolar wall in the lung and hepatic sinusoid well in the liver accompanying obvious infiltration of inflammatory cells. The inflammatory injuries and the inflammatory cell infiltration turned much less evident in the lungs and livers from mice receiving ST-AS&Si. The above results clearly showed that the sheddable PEG corona introduced onto the M2peptide-decorated nanodrug may lower the immune side effects by reducing the risk of inducing M2-to-M1 repolarization of macrophages in healthy organs.
A further investigation of macrophage repolarization in organs (i.e., liver, lung, spleen, lymph nodes) and blood was performed by flow cytometry analyses. As shown in Figure S18, the T-AS&Si and NT-AS&Si treatments both reduced the M2-like macrophages in the blood, liver, lung, spleen, and lymph nodes and meanwhile increased the M1-like macrophages there. However, the effect of ST-AS&Si treatment to induce the M2-like macrophage repolarization was much weaker, which indicated that the sheddable PEG corona on ST-AS&Si was favorable for lowering the immune-associated side effects in healthy organs including the spleen.
Discussion
As the M2-to-M1 phenotypic transition may be induced by silencing the IκB kinase-β (IKKβ) gene46 or inhibiting the signal transducers and activators of the transcription 6 (STAT6) protein,47 a combination regulation of STAT6 and NF-κB was expected to result in a synergistic effect to promote the M1 polarization of TAMs. In this context, an M2-targeted codelivery of the STAT6 inhibitor and IKKβ siRNA may represent a highly effective strategy to turn the M2-polarized TAMs into the M1-polarized ones.
The nanocarrier, with its unique features in tumor passive targeting and readily available multifunctionality, holds great promise for accomplishing this multipronged therapeutic strategy. Moreover, codelivery of the STAT6 inhibitor and IKKβ siRNA using a pH-sensitive nanocarrier with M2-targeting peptide (M2pep) hidden underneath the pH-sheddable PEG outer layer may bypass the M2-like macrophages in normal organs, thus lowering the systemic immune side effects of the M2-targeted combination treatment.
A block copolymer N3–P[Lys(M2pep)-Lys]–PAsp(DIP-co-BZA) was synthesized and then self-assembled into micelle embedding STAT6 inhibitor AS in the hydrophobic core. The micelle efficiently complexed IKKβ siRNA to form a micelleplex which was then decorated with a pH-sensitive sheddable PEG outer layer through click reaction between the azide groups on the micelle and azadibenzocylooctyne (DBCO) group terminating PEG (mPEG-phe-DBCO). The antitumor immunotherapeutic effects via M2-to-M1 repolarization of TAMs and immune side effects were assessed both in vitro and in vivo. To date, although a PEG sheddable strategy utilizing acidic TME to expose the TAM-targeting ligand on the nanocarrier for TAM-targeted drug delivery was reported,48 the nanodrug showing clear evidence to induce an M2-to-M1 repolarization of TAMs for effective anticancer immunotherapy and meanwhile bypassing the M2-like macrophages in normal organs for reduced side effects has not been documented yet.
The pH-sensitive linker, 1-amide-2-propionic ester-3-methyl maleic acid (phe), between PEG and the micelleplex was broken in the tumor acidic microenvironment to allow PEG shedding, thus exposing M2peptide for M2-tageting delivery. However, the PEG corona was stable in healthy organs with neutral pH, reducing internalization of the micelleplex into the M2-like macrophages. Consequently, the AS and IKKβ siRNA were efficiently delivered into the M2-like TAMs to jointly induced an M2-to-M1 repolarization for effective antitumor immunotherapy, which inhibited orthotopic growth and metastasis of the 4T1 tumor. More excitingly, the reduced uptake of the micelleplex by M2-like microphages in healthy organs such as the lung and liver resulted in less M2-to-M1 repolarization, which decreased inflammatory side effects. Our results show that the pH-sensitive PEG-sheddable micelleplex integrating AS and IKKβ siRNA is potentially a potent nanodrug for anticancer immunotherapy with low immune side effects.
Materials and Methods
Preparation of Micelles
N3–P[Lys(M2pep)-Lys]–PAsp(DIP-co-BZA) (10 mg) and 1 mg of AS were dissolved in 1 mL of DMSO. The solution was added dropwise into 10 mL of pH 7.4 PBS buffer under sonication (Sonics Vibra-Cell, 20 kHz, 60% power level) in an ice–water bath. After dialyzing (MWCO: 7 kDa) against pH 7.4 PBS for 24 h to remove DMSO, the solution was filtered through a syringe filter (pore size: 450 nm) to eliminate large aggregates and obtain the solution of the drug-loaded micelle (T-AS). The targeting blank micelle (T-blank) based on N3–P[Lys(M2pep)-Lys]–PAsp(DIP-co-BZA) was prepared in a similar way without adding AS. According to the predesigned N/P ratio, a certain amount of IKKβ siRNA was added to the T-AS micelle solution, and then, the solution was incubated at room temperature for 30 min to obtain the AS-siRNA-coloaded micelle (T-AS&Si). After the T-AS&Si micelle and mPEG-phe-DBCO were mixed at a 1:1 molar ratio, the solution was stirred overnight at room temperature to obtain the targeting micelle with pH-sensitive PEG coating (ST-AS&Si). The targeting blank micelle with pH-sensitive PEG coating (ST) and micelleplex formed by ST complexation with siRNA (ST-Si) were also prepared. The micelle with pH-insensitive PEG corona (NT-AS&Si) was prepared as a control. The AS&Si-encapsulated PEGy-sheddable micelle decorated with scrambled M2pep (scrM2pep) was denoted as STscr-AS&Si. The coumarin 6 (Cr6)-encapsulated targeting micelle with sheddable PEG corona and the Cr6-encapsulated targeting micelle with nonsheddable PEG corona were complexed with Cy3-labeled SCR at an N/P ratio of 15 to form the micelleplexes of ST-Cr6&Cy3 and NT-Cr6&Cy3 for cell transfection study.
The targeting micelleplex without PEG coating (T-AS&Si) encapsulating IKKβ siRNA and AS was assembled from N3–P[Lys(M2pep)-Lys]–PAsp(DIP-co-BZA) as a control, which exposes M2peptide on the micelleplex surface for studies of proinflammatory side effects. To study the organ accumulation of micelles, micelles loading Nile red (NR) with or without PEG corona (T-NR and ST-NR) were prepared via the same approach as described above. The formulations and their explanations are summarized in Table 1.
Table 1. Summarization of Various Formulations.
| names of formulations | explanations |
|---|---|
| T-blank | M2-targeting blank micelle |
| T-AS | STAT6 inhibitor (AS)-loaded M2-targeting micelle |
| T-Si | IKKβ siRNA (Si)-loaded M2-targeting micelle |
| ST | M2-targeting micelle coating a sheddable PEG corona |
| NT | M2-targeting micelle coating a nonsheddable PEG corona |
| ST-AS | AS-loaded M2-targeting micelle coating a sheddable PEG corona |
| ST-Si | Si-loaded M2-targeting micelle coating a sheddable PEG corona |
| STscr-AS&Si | AS&Si-coloaded micelle modified scrambled M2pep (scrM2pep) coating a sheddable PEG corona |
| ST-AS&Si | AS&Si-coloaded M2-targeting micelle coating a sheddable PEG corona |
| NT-AS&Si | AS&Si-coloaded M2-targeting micelle coating a nonsheddable PEG corona |
| T-AS&Si | AS&Si-coloaded M2-targeting micelle coating a sheddable PEG corona |
| ST-Dir | Dir-loaded M2-targeting micelle coating a sheddable PEG corona |
| NT-Dir | Dir-loaded M2-targeting micelle coating a nonsheddable PEG corona |
| T-NR | Nile red (NR)-loaded M2-targeting micelle |
| ST-NR | Nile red (NR)-loaded M2-targeting micelle coating a sheddable PEG corona |
| ST-Cr6&Cy3 | coumarin 6 (Cr6) and Cy3-labeled scrambled siRNA (Cy3)-coloaded M2-targeting micelle coating a sheddable PEG corona |
| NT-Cr6&Cy3 | Cr6&Cy3-coloaded M2-targeting micelle coating a nonsheddable PEG corona |
Characterization of Nanodrugs
The PEG density on the surface of the ST micelle was investigated. In brief, 5 mL of T-blank in pH 7.4 distilled water (10 mg mL–1) was mixed with mPEG-phe-DBCO at a 1:1 polymeric molar ratio. The solution was slightly stirred overnight at room temperature and then dialyzed (MWCO: 7 kDa) against pH 7.4 distilled water for 24 h to remove unreacted PEG. The obtained solution was finally lyophilized and weighed. The grafting degree of PEG on the ST micelle was calculated based on the 1H NMR analysis.
The size distribution and ζ potential of micelleplexes at 25 °C were analyzed with dynamic light scattering (DLS) using Malvern Zetasizer Nano ZS equipment (Malvern, UK) at a detection angle of scattered light at 90° and 15°, respectively. Each sample was measured three times, and the data were presented as mean ± standard deviation (SD).
The morphology of micelleplexes was analyzed with transmission electron microscopy (TEM). Sample solution (10 μL; 1 mg mL–1) was dropped onto a copper grid coated with amorphous carbon and naturally dried in a desiccator. A drop of 1 wt % aqueous solution of uranyl acetate was dropped onto the copper grid to stain the samples for 1 min. After blotting with a filter paper, the samples were thoroughly dried in a desiccator before TEM observation. The samples were finally observed on a Philips CM120 transmission electron microscope (Philips, Netherlands).
The drug loading content was quantified using the UV–vis spectral measurement on a Unico UV-2000 UV–vis spectrophotometer (PE). First, a series of AS solutions were prepared with DMSO as the solvent to obtain the standard curve at characteristic absorption peak of 308 nm. Then, 5 mL of T-AS micelle solution was lyophilized to yield a solid. After redissolving the solid sample in DMSO, the absorbance of AS at 308 nm was measured, and the drug loading content was calculated by referring to the previously established calibration curve.
Analysis of siRNA Complexation by Gel Electrophoresis Assay
Scrambled siRNA (SCR) was centrifuged at a rate of 12000g for 5 min and dissolved into sterilized water. 0.5 μg of SCR was mixed with T-blank at different N/P ratios and incubated at room temperature for 30 min. The mixture was loaded onto a 1% agarose gel with 0.5 μg mL–1 ethidium bromide and underwent an electrophoresis in TAE (Tris-acetate-EDTA) buffer at a voltage of 150 V for 15 min. The retardation of siRNA mobility was observed and recorded on a UV light of a gel imaging system (Tanon, China).
Extraction and Stimulated Differentiation of Bone Marrow Derived Macrophages
The BALB/C mice, 6–8 weeks of age, were sacrificed and soaked in 75% ethanol for 30 s to sterilize. The bodies were placed on a sterilized operation table, and the hind legs were pulled to dislocate the femur from the hip bone. Then, the leg muscles were separated to expose the femur and tibia. After removing the bones below the knee joint by cutting the ligaments, the separated femurs and tibias were placed into precooled normal saline. Both ends of the femur and tibia were cut, and the marrow cavities were rinsed three times with RPMI 1640 medium containing 10% FBS; the cells were collected. After treating with red blood cell lysis buffer for 2 min, the cells were collected and cultured with 10 mL of DMEM medium containing 10% FBS, 1% penicillin–streptomycin, 10 ng mL–1 M-CSF (macrophage colony stimulating factor, PeproTech) and 10 ng mL–1 IL-4 (interleukin-4, PeproTech) for 3 days to stimulate cells into M2-like macrophages.
Cytotoxicity and TAM Transfection
The M2-like macrophages were cultured in DMEM medium containing 10% FBS, 1% penicillin–streptomycin, 10 ng mL–1 MCS-F, and 10 ng mL–1 IL-4. The cells were trypsinized with 0.25%-EDTA trypsin, seeded into a 96-well plate at a density of 1 × 10⁴ per well, and incubated with T-blank or ST at different concentrations for 24 h. The cell viabilities of each group were detected with the MTT assay using a Synergy 2 modular multimode reader (BioTek).
The M2-like macrophages were incubated with ST-Cr6&Cy3 of N/P 15 for 6 h at pH 7.4 or 6.8 in DMEM medium. After washing with fresh PBS, the cells were treated with 4% paraformaldehyde for 10 min and then treated for 5 min with 1 μg mL–1 DAPI to label the nuclei. The uptake and distribution of ST-Cr6&Cy3 in M2-like macrophages were observed under an SP8 confocal laser scanning microscope (CLSM, Leica, Germany). The M2-like macrophages incubated with NT-Cr6&Cy3 at the same conditions were employed as a control group. The transfection efficiencies of ST-Cr6&Cy3 and NT-Cr6&Cy3 in M2-like macrophages were also analyzed by an Attune NxT flow cytometry instrument (Invitrogen).
In a coculture study, the M2-like macrophages and murine breast cancer cells expressing green fluorescent protein (GFP-4T1) were coincubated with ST-Cr6&Cy3 or NT-Cr6&Cy3 at pH 6.8 in DMEM medium. After incubation for 6 h, the cells were treated with 4% paraformaldehyde for 10 min. The M2-like macrophages were labeled with anti-CD206 antibody (Abcam, UK), and the nuclei were stained with DAPI. The siRNA uptake and distribution in two different cells were observed under CLSM to evaluate the TAM-targeting delivery of micelleplexes. If not otherwise stated, the pH value of culture medium was set to 6.8 in the following experiments.
Repolarization of TAMs in Vitro
Macrophages derived from murine bone marrow were stimulated into M2-like macrophages by treating with MCS-F and IL-4. The M2-like macrophages were seeded into a 12-well plate and incubated for 48 h with PBS, ST, ST-AS, ST-Si, or ST-AS&Si, respectively. After incubation for 48 h, the total RNA and total protein were collected to perform quantitative real-time PCR (qRT-PCR) and Western blot (WB) assays, respectively. Briefly, total RNA was isolated from cells using the Trizol Reagent Kit (Invitrogen). The first strand cDNA was synthesized from the total RNA using a PrimeScript RT reagent kit (Takara, Japan). The indicated mRNA expressions of IKKβ, IL-10, CD206, Arginase I and IL-12, TNF-α, and CD80 associated with M2-like or M1-like macrophages were quantified with a StepOne Plus real-time PCR System (ABI) using a FastStart Universal SYBR Green Master (ROX) kit (Roche, Switzerland). The β-actin gene was utilized as an internal normalization standard. The forward and reverse sequences of each gene primer are listed in Table S2.
After treating with different nanodrugs, the total protein of cells was extracted with RIPM lysis (Beyotime, China) to perform the Western blot assay. 40 μg of protein samples was separated on 12% sodium dodecyl sulfate polyacrylamide gel electrophoresis (SDS-PAGE) and then transferred to polyvinylidene difluoride (PVDF) membranes. After blocking with 5% nonfat milk for 2 h at room temperature, the membranes were incubated with anti-IKKβ antibody (Abcam), Anti-STAT6 (phospho Y641) antibody (Abcam), anti-iNOS antibody (Abcam), anti-Arginase I antibody (Cell Signaling Technology), or anti-β-actin antibody (Abcam) overnight at 4 °C. β-Actin protein was used as an internal normalization standard. The protein signals were detected with a chemiluminescence kit (KeyGEN, China) after treating with horseradish peroxidase (HRP)-conjugated IgG.
The M2-like and M1-like macrophages manifested different morphologies.49 By observing the cellular morphology, the repolarization of M2-like macrophages treated with different nanodrugs was investigated. The M2-like macrophages were labeled with anti-CD206 antibody to show green fluorescence, and the M1-like macrophages were labeled with anti-CD80 antibody to show red fluorescence. For all cells, the nuclei and tubulin were stained blue and gray with DAPI and antitubulin antibody, respectively. The cellular morphologies of different phenotypic macrophages were visualized under CLSM.
Animal Model and in Vivo Fluorescence Imaging
Female BALB/C mice, 6–8 weeks of age, were purchased from Guangdong Medical Laboratory Animal Center and raised in SPF animal center of School of Life Sciences, Sun Yat-sen University. All surgical interventions and postoperative animal care were approved by the Institutional Animal Care and Use Committee of the Sun Yat-sen University, Guangzhou, China. The murine breast cancer cells expressing firefly luciferase (Luc-4T1) were collected at the logarithmic growth stage and subcutaneously injected into the right axillary breast side of the mice at a density of 1 × 10⁷. When the tumor grew to about 100 mm3 after 5 days, the in vivo fluorescence imaging of mice was performed. The Dir-loaded micelle with pH-sensitive PEG coating (ST-Dir) and the Dir-loaded micelle with pH-insensitive PEG coating (NT-Dir) were prepared as described in the Preparation of Micelles section. 100 μL of ST-Dir or NT-Dir solution was injected into tumor-bearing mice via the tail vein at a Dir dose of 0.5 mg kg–1 body weight. The Dir fluorescence intensities in the tumor site at different time points were recorded by a Carestream Multispectral FX Pro in vivo imager (Carestream Health). The excitation and emission wavelengths of Dir were 720 nm and 790 nm, respectively. Moreover, one additional syngeneic orthotopic tumor model was established. Briefly, a mixture (50 μL) of PBS and Matrigel (1:1 v/v) containing 1 × 10⁶ 4T1 cells was injected into the fourth breast fat pad.
Tumor Growth Inhibition Assay
When the tumor volume reached approximately 50 mm3, the mice were randomly divided into 5 groups, i.e., the PBS, ST, ST-AS, ST-Si, and ST-AS&Si groups. Each mouse was injected with 100 μL of nanodrug solution via the tail vein (AS dose, 60 μg/kg body weight; siRNA dose, 250 μg/kg body weight). The width and length of the tumor size were measured using a vernier caliper, and each mouse was weighed. Over a total of seven treatments for each mouse, the injection was performed every 3 days while the tumor size and weight of mice were recorded accordingly. The day of first administration was denoted as Day 1. When the tumor volumes reached 2000 mm3, the mice underwent euthanasia as the humanitarian end point of the study. During the therapeutic process, 100 μL of d-luciferin solution (10 mg mL–1) was intraperitoneally injected into mice for bioluminescence imaging to monitor the tumor growth and metastasis at 1, 10, and 19 days. At 19 days, the mice receiving d-luciferin solution were sacrificed, and tumors and organs were excised. The metastatic tumors in the liver and lung were observed through bioluminescence imaging in vivo and ex vivo. The excised tumors, livers, and lungs were fixed in 4% paraformaldehyde for at least 24 h, and then, the paraffin sections of 2 μm or frozen section of 5 μm was prepared. The tumor nodules were observed from H&E images of the liver and lung to assess the tumor metastasis in different animal groups.
The antitumor efficacy was further tested in one additional syngeneic orthotopic tumor model. The mice were randomly divided into 4 groups for the treatments of PBS, STscr-AS&Si, NT-AS&Si, and ST-AS&Si. The tumor size, mouse body weight, and cumulative survival were recorded.
Histological, Immunohistochemical, and TUNEL Assays
The paraffin sections were sequentially deparaffinized using xylene, hydrated with ethanol of gradient concentrations, and then subjected to H&E, immunohistochemical, and TUNEL staining. A FragEL DNA fragmentation detection kit (Merck, Germany) was used for the TUNEL assay according to the manufacturer’s protocol. Briefly, after permeabilization using proteinase K and inactivation of endogenous peroxidase with 3% H2O2/CH3OH, the samples were treated with terminal deoxynucleotidyl transferase (TdT) for 1.5 h at 37 °C to label the exposed 3′–OH ends of the DNA fragment in apoptotic cells. The positive signals of apoptotic cells were visualized by staining with diaminobenzidine (DAB) and observed under a BX51 microscope (Leica, Germany).
Immunohistochemical (IHC) staining was performed using an IHC Kit (BOSTER, China). After deparaffinization and hydration, the tissue sections were sequentially treated in citrate buffer (10 mM, pH 6.0) for antigen retrieval and 3% H2O2/MeOH for inactivation of endogenous peroxidase. After being blocked with 5% bovine serum albumin (BSA), the sections were incubated with primary antibodies, i.e., anti-IKKβ, anti-pSTAT6, anti-Arg I, and anti-iNOS antibodies, and treated with biotin-labeled goat antimouse IgG secondary antibody. Then, the streptavidin–biotin complex (SABC) was used to magnify the immunohistochemical signal by cascade amplification between streptavidin and biotin. The positive immunoreactivity was visualized by staining with DAB and observed under a BX51 microscope (Leica, Germany).
Repolarization of TAMs into M1-Like Macrophages in Vivo and Activation of Tumor Immunity
Tumor tissues were excised and homogenized into single cells in PBS. The cells were collected and adjusted to a 100 μL solution containing 1 × 10⁶ cells in a vial. The above solutions were treated with 2 μL of Fc blocking antibody (1 mg mL–1) for 10 min on ice; the cells were incubated with corresponding fluorophore-labeled antibodies including anti-CD45-APC-Cy7, anti-CD11b-PerCP-Cy5.5, anti-F4/80-FITC, anti-CD80-APC, anti-CD206-APC, anti-CD3-APC, anti-CD8-PE, anti-CD4-FITC, anti-CD25-BV421, anti-Foxp3-PE, and anti-IFN-γ-APC. All antibodies were purchased from BioLegend (San Diego, CA). The proportions of M1-like macrophages (CD45+CD11b+F4/80+CD80+), M2-like TAMs (CD45+CD11b+F4/80+CD206+), CD8+ T cells (CD45+CD3+CD8+), Th1 cells (CD4+IFN-γ+), and regulatory T cells (CD4+ CD25+Foxp3+) within the tumor tissues of mice receiving different treatments were analyzed using an Attune NxT flow cytometer (Invitrogen).
The frozen sections (5 μm thickness) of the excised tumor tissues were also prepared for immunofluorescence staining. Briefly, after blocking with 5% BSA for 0.5 h at 37 °C, the sections were incubated overnight at 4 °C with anti-CD80 antibody and anti-CD206 antibody (Abcam, UK) to label the M1-like macrophages and M2-like TAMs, respectively. Then, the AF647-labeled secondary antibody and AF488-labeled secondary antibody (Abcam, UK) were utilized to fluorescently label the M1-like and M2-like macrophages within tumor tissues, respectively. After staining the nuclei with DAPI, the tissue sections were observed under CLSM. Moreover, the infiltrated CD8+ T cells, Th1 cells, and regulatory T cells (Tregs) in tumor tissues were also labeled for immunofluorescence imaging.
Proinflammatory Side Effects in the Liver and Lung
The organ accumulation of micelles was investigated. T-NR, NT-NR, or ST-NR, i.e., micelles loading Nile red (NR) with or without sheddable PEG coating, was injected into tumor-bearing mice via the tail vein. After 24 h, the mice were sacrificed, and the livers and lungs were excised to prepare frozen sections. The sections were treated with anti-CD206 antibody to label M2-like macrophages and with DAPI to stain nuclei. The organ accumulation of micelles was evaluated via the fluorescence distribution of NR in livers and lungs under CLSM.
Furthermore, 100 μL of T-AS&Si, NT-AS&Si, or ST-AS&Si solution was injected into tumor-bearing mice via the tail vein at an AS dose of 60 μg/kg body weight and siRNA dose of 250 μg/kg body weight. The injection for each animal was performed once every 2 days for a total of five injections. The mice receiving PBS were used as a control group. After ending treatments, the mice were sacrificed, and the liver and lung were excised to prepare paraffin sections. The sections were subjected to immunohistochemical staining to detect the M2-like and M1-like macrophages. The TNF-α levels indicating inflammatory reaction in the liver and lung were also evaluated by immunohistochemical assay. The organ injury and inflammatory cell infiltration were assessed via the H&E staining. Flow cytometry analysis of macrophage repolarization in the blood, liver, lung, spleen, and lymph nodes was performed.
Statistical Analysis
Statistical analysis of data was performed with the one-way ANOVA analysis (SPSS software, version 19.0, SPSS Inc.). The results were expressed as mean ± SD (standard deviation), and P < 0.05 was considered to be of statistical significance.
Safety Statement
No unexpected or unusually high safety hazards were encountered.
Acknowledgments
This research was supported by the National Basic Research Program of China (2015CB755500), the National Natural Science Foundation of China (51933011, 31971296), the Key Areas Research and Development Program of Guangzhou (202007020006), and Natural Science Foundation of the Guangdong Province (2014A030312018).
Supporting Information Available
The Supporting Information is available free of charge at https://pubs.acs.org/doi/10.1021/acscentsci.9b01235.
Additional materials and methods, synthetic approaches and characterizations of synthetic copolymers, measurement of drug loading content, MTT assay, immunofluorescent staining of immune cells, decreased proinflammatory effects, and sequences of gene primer (PDF)
Author Contributions
∥ H.X., Y.G., and B.L. contributed equally.
The authors declare no competing financial interest.
Supplementary Material
References
- Egeblad M.; Nakasone E. S.; Werb Z. Tumors as Organs: Complex Tissues that Interface with the Entire Organism. Dev. Cell 2010, 18 (6), 884–901. 10.1016/j.devcel.2010.05.012. [DOI] [PMC free article] [PubMed] [Google Scholar]
- Khawar I. A.; Kim J. H.; Kuh H.-J. Improving drug delivery to solid tumors: Priming the tumor microenvironment. J. Controlled Release 2015, 201, 78–89. 10.1016/j.jconrel.2014.12.018. [DOI] [PubMed] [Google Scholar]
- Stout R. D.; Watkins S. K.; Suttles J. Functional plasticity of macrophages: in situ reprogramming of tumor-associated macrophages. J. Leukocyte Biol. 2009, 86 (5), 1105–1109. 10.1189/jlb.0209073. [DOI] [PMC free article] [PubMed] [Google Scholar]
- Fleetwood A. J.; Dinh H.; Cook A. D.; Hertzog P. J.; Hamilton J. A. GM-CSF- and M-CSF-dependent macrophage phenotypes display differential dependence on type I interferon signaling. J. Leukocyte Biol. 2009, 86 (2), 411–421. 10.1189/jlb.1108702. [DOI] [PubMed] [Google Scholar]
- Spiller K. L.; Nassiri S.; Witherel C. E.; Anfang R. R.; Ng J.; Nakazawa K. R.; Yu T.; Vunjak-Novakovic G. Sequential delivery of immunomodulatory cytokines to facilitate the M1-to-M2 transition of macrophages and enhance vascularization of bone scaffolds. Biomaterials 2015, 37, 194–207. 10.1016/j.biomaterials.2014.10.017. [DOI] [PMC free article] [PubMed] [Google Scholar]
- Wang N.; Tan H.; Li S.; Wang D.; Xu Y.; Zhang C.; Xia W.; Che C.; Feng Y. SBP2 deficiency in adipose tissue macrophages drives insulin resistance in obesity. Sci. Adv. 2019, 5 (8), eaav0198 10.1126/sciadv.aav0198. [DOI] [PMC free article] [PubMed] [Google Scholar]
- Lan C.; Huang X.; Lin S.; Huang H.; Cai Q.; Wan T.; Lu J.; Liu J. Expression of M2-polarized macrophages is associated with poor prognosis for advanced epithelial ovarian cancer. Technol. Cancer Res. Treat. 2013, 12 (3), 259–267. 10.7785/tcrt.2012.500312. [DOI] [PubMed] [Google Scholar]
- Kurahara H.; Shinchi H.; Mataki Y.; Maemura K.; Noma H.; Kubo F.; Sakoda M.; Ueno S.; Natsugoe S.; Takao S. Significance of M2-polarized tumor-associated macrophage in pancreatic cancer. J. Surg. Res. 2011, 167 (2), e211–e219. 10.1016/j.jss.2009.05.026. [DOI] [PubMed] [Google Scholar]
- Zhang B.; Yao G.; Zhang Y.; Gao J.; Yang B.; Rao Z.; Gao J. M2-polarized tumor-associated macrophages are associated with poor prognoses resulting from accelerated lymphangiogenesis in lung adenocarcinoma. Clinics 2011, 66 (11), 1879–1886. 10.1590/S1807-59322011001100006. [DOI] [PMC free article] [PubMed] [Google Scholar]
- Chanmee T.; Ontong P.; Konno K.; Itano N. Tumor-associated macrophages as major players in the tumor microenvironment. Cancers 2014, 6 (3), 1670–1690. 10.3390/cancers6031670. [DOI] [PMC free article] [PubMed] [Google Scholar]
- Riabov V.; Gudima A.; Wang N.; Mickley A.; Orekhov A.; Kzhyshkowska J. Role of tumor associated macrophages in tumor angiogenesis and lymphangiogenesis. Front. Physiol. 2014, 5, 75. 10.3389/fphys.2014.00075. [DOI] [PMC free article] [PubMed] [Google Scholar]
- Zhang W.; Zhu X.-D.; Sun H.-C.; Xiong Y.-Q.; Zhuang P.-Y.; Xu H.-X.; Kong L.-Q.; Wang L.; Wu W.-Z.; Tang Z.-Y. Depletion of tumor-associated macrophages enhances the effect of sorafenib in metastatic liver cancer models by antimetastatic and antiangiogenic effects. Clin. Cancer Res. 2010, 16 (13), 3420–3430. 10.1158/1078-0432.CCR-09-2904. [DOI] [PubMed] [Google Scholar]
- Sun H.; Miao C.; Liu W.; Qiao X.; Yang W.; Li L.; Li C. TGF-β1/TβRII/Smad3 signaling pathway promotes VEGF expression in oral squamous cell carcinoma tumor-associated macrophages. Biochem. Biophys. Res. Commun. 2018, 497 (2), 583–590. 10.1016/j.bbrc.2018.02.104. [DOI] [PubMed] [Google Scholar]
- Yeung O. W.; Lo C. M.; Ling C. C.; Qi X.; Geng W.; Li C. X.; Ng K. T.; Forbes S. J.; Guan X. Y.; Poon R. T. Alternatively activated (M2) macrophages promote tumour growth and invasiveness in hepatocellular carcinoma. J. Hepatol. 2015, 62 (3), 607–616. 10.1016/j.jhep.2014.10.029. [DOI] [PubMed] [Google Scholar]
- Van den Bossche d. B. J.; Baardman J.; Otto N. A.; Van d. V. S.; Neele A. E.; Sm V. D. B.; Luque-Martin R.; Chen H. J.; Boshuizen M. C.; Ahmed M. Mitochondrial Dysfunction Prevents Repolarization of Inflammatory Macrophages. Cell Rep. 2016, 17 (3), 684–696. 10.1016/j.celrep.2016.09.008. [DOI] [PubMed] [Google Scholar]
- Sica A.; Mantovani A. Macrophage plasticity and polarization: in vivo veritas. J. Clin. Invest. 2012, 122 (3), 787–795. 10.1172/JCI59643. [DOI] [PMC free article] [PubMed] [Google Scholar]
- Rodell C. B.; Arlauckas S. P.; Cuccarese M. F.; Garris C. S.; Li R.; Ahmed M. S.; Kohler R. H.; Pittet M. J.; Weissleder R. TLR7/8-agonist-loaded nanoparticles promote the polarization of tumour-associated macrophages to enhance cancer immunotherapy. Nat. Biomed. Eng. 2018, 2 (8), 578–588. 10.1038/s41551-018-0236-8. [DOI] [PMC free article] [PubMed] [Google Scholar]
- Cieslewicz M.; Tang J.; Yu J. L.; Cao H.; Zavaljevski M.; Motoyama K.; Lieber A.; Raines E. W.; Pun S. H. Targeted delivery of proapoptotic peptides to tumor-associated macrophages improves survival. Proc. Natl. Acad. Sci. U. S. A. 2013, 110 (40), 15919–15924. 10.1073/pnas.1312197110. [DOI] [PMC free article] [PubMed] [Google Scholar]
- Sun W.; Zhang H.; Wang H.; Chiu Y. G.; Ritchlin C. T.; Kiernan A.; Boyce B. F.; Xing L. Targeting Notch-activated M1Macrophages Attenuates Joint Tissue Damage in a Mouse Model of Inflammatory Arthritis. J. Bone Miner. Res. 2017, 32 (7), 1469–1480. 10.1002/jbmr.3117. [DOI] [PMC free article] [PubMed] [Google Scholar]
- Butterfield T. A.; Best T. M.; Merrick M. A. The dual roles of neutrophils and macrophages in inflammation: a critical balance between tissue damage and repair. J. Athl. Training 2006, 41 (4), 457–465. [PMC free article] [PubMed] [Google Scholar]
- Tacke F.; Zimmermann H. W. Macrophage heterogeneity in liver injury and fibrosis. J. Hepatol. 2014, 60 (5), 1090–1096. 10.1016/j.jhep.2013.12.025. [DOI] [PubMed] [Google Scholar]
- Rogers T. L.; Holen I. Tumour macrophages as potential targets of bisphosphonates. J. Transl. Med. 2011, 9 (1), 177. 10.1186/1479-5876-9-177. [DOI] [PMC free article] [PubMed] [Google Scholar]
- Zeisberger S.; Odermatt B.; Marty C.; Zehnder-Fjällman A.; Ballmer-Hofer K.; Schwendener R. Clodronate-liposome-mediated depletion of tumour-associated macrophages: a new and highly effective antiangiogenic therapy approach. Br. J. Cancer 2006, 95 (3), 272. 10.1038/sj.bjc.6603240. [DOI] [PMC free article] [PubMed] [Google Scholar]
- Ngambenjawong C.; Gustafson H. H.; Pun S. H. Progress in tumor-associated macrophage (TAM)-targeted therapeutics. Adv. Drug Delivery Rev. 2017, 114, 206–221. 10.1016/j.addr.2017.04.010. [DOI] [PMC free article] [PubMed] [Google Scholar]
- Tam Y.; Kar K.; Nowzari H.; Cha H. S.; Ahn K. M. Osteonecrosis of the jaw after implant surgery in patients treated with bisphosphonates-a presentation of six consecutive cases. Clin. Implant. Dent. Res. 2014, 16 (5), 751–761. 10.1111/cid.12048. [DOI] [PubMed] [Google Scholar]
- Lawrence T.; Natoli G. Transcriptional regulation of macrophage polarization: enabling diversity with identity. Nat. Rev. Immunol. 2011, 11 (11), 750–761. 10.1038/nri3088. [DOI] [PubMed] [Google Scholar]
- Arranz A.; Doxaki C.; Vergadi E.; Martinez de la Torre Y.; Vaporidi K.; Lagoudaki E. D.; Ieronymaki E.; Androulidaki A.; Venihaki M.; Margioris A. N.; Stathopoulos E. N.; Tsichlis P. N.; Tsatsanis C. Akt1 and Akt2 protein kinases differentially contribute to macrophage polarization. Proc. Natl. Acad. Sci. U. S. A. 2012, 109 (24), 9517–9522. 10.1073/pnas.1119038109. [DOI] [PMC free article] [PubMed] [Google Scholar]
- Date D.; Das R.; Narla G.; Simon D. I.; Jain M. K.; Mahabeleshwar G. H. Kruppel-like transcription factor 6 regulates inflammatory macrophage polarization. J. Biol. Chem. 2014, 289 (15), 10318–10329. 10.1074/jbc.M113.526749. [DOI] [PMC free article] [PubMed] [Google Scholar]
- Monsalve E.; Ruiz G. A. V.; Ruiz Hidalgo M. J.; Sanchez S. B.; Rivero S.; Garcia Ramirez J. J.; Rubio A.; Laborda J.; Diaz Guerra M. J. Notch1 upregulates LPS-induced macrophage activation by increasing NF-kappaB activity. Eur. J. Immunol. 2009, 39 (9), 2556–2570. 10.1002/eji.200838722. [DOI] [PubMed] [Google Scholar]
- Yu N.; Liu H.; Zhang Y.-F.; Su L.-Y.; Liu X.-H.; Li L.-C.; Hao J.-B.; Huang X.-J.; Di Q. Effects of brain IKKβ gene silencing by small interfering RNA on P-Glycoprotein expression and brain damage in the rat kainic acid-induced seizure model. CNS Neurol. Disord.: Drug Targets 2014, 13 (4), 661–672. 10.2174/18715273113129990106. [DOI] [PubMed] [Google Scholar]
- Gamble C.; McIntosh K.; Scott R.; Ho K. H.; Plevin R.; Paul A. Inhibitory kappa B Kinases as targets for pharmacological regulation. Br. J. Pharmacol. 2012, 165 (4), 802–819. 10.1111/j.1476-5381.2011.01608.x. [DOI] [PMC free article] [PubMed] [Google Scholar]
- Biswas S. K.; Mantovani A. Macrophage plasticity and interaction with lymphocyte subsets: cancer as a paradigm. Nat. Immunol. 2010, 11 (10), 889. 10.1038/ni.1937. [DOI] [PubMed] [Google Scholar]
- Wang N.; Liang H.; Zen K. Molecular mechanisms that influence the macrophage M1-M2 polarization balance. Front. Immunol. 2014, 5, 614. 10.3389/fimmu.2014.00614. [DOI] [PMC free article] [PubMed] [Google Scholar]
- Olefsky J. M.; Glass C. K. Macrophages, inflammation, and insulin resistance. Annu. Rev. Physiol. 2010, 72, 219–246. 10.1146/annurev-physiol-021909-135846. [DOI] [PubMed] [Google Scholar]
- Fan F.; Yu Y.; Zhong F.; Gao M.; Sun T.; Liu J.; Zhang H.; Qian H.; Tao W.; Yang X. Design of Tumor Acidity-Responsive Sheddable Nanoparticles for Fluorescence/Magnetic Resonance Imaging-Guided Photodynamic Therapy. Theranostics 2017, 7 (5), 1290. 10.7150/thno.18557. [DOI] [PMC free article] [PubMed] [Google Scholar]
- Wang Z.; An H.-W.; Hou D.; Wang M.; Zeng X.; Zheng R.; Wang L.; Wang K.; Wang H.; Xu W. Addressable Peptide Self-Assembly on the Cancer Cell Membrane for Sensitizing Chemotherapy of Renal Cell Carcinoma. Adv. Mater. 2019, 31 (11), 1807175. 10.1002/adma.201807175. [DOI] [PubMed] [Google Scholar]
- Wang H.; Wang R.; Cai K.; He H.; Liu Y.; Yen J.; Wang Z.; Xu M.; Sun Y.; Zhou X. Selective in vivo metabolic cell-labeling-mediated cancer targeting. Nat. Chem. Biol. 2017, 13 (4), 415–424. 10.1038/nchembio.2297. [DOI] [PMC free article] [PubMed] [Google Scholar]
- Shea K. J.; Kim J.-S. Influence of Strain on Chemical Reactivity. Relative Reactivity of Torsionally Strained Double Bonds in 1,3-Dipolar Cycloadditions. J. Am. Chem. Soc. 1992, 114 (12), 4846–4855. 10.1021/ja00038a059. [DOI] [Google Scholar]
- Jewett J. C.; Bertozzi C. R. Cu-free click cycloaddition reactions in chemical biology. Chem. Soc. Rev. 2010, 39, 1272–1279. 10.1039/b901970g. [DOI] [PMC free article] [PubMed] [Google Scholar]
- Nagashima S.; Yokota M.; Nakai E.-i.; Kuromitsu S.; Ohga K.; Takeuchi M.; Tsukamoto S.-i.; Ohta M. Synthesis and evaluation of 2-{[2-(4-hydroxyphenyl)-ethyl] amino} pyrimidine-5-carboxamide derivatives as novel STAT6 inhibitors. Bioorg. Med. Chem. 2007, 15 (2), 1044–1055. 10.1016/j.bmc.2006.10.015. [DOI] [PubMed] [Google Scholar]
- Brannon-Peppas L.; Blanchette J. O. Nanoparticle and targeted systems for cancer therapy. Adv. Drug Delivery Rev. 2004, 56 (11), 1649–1659. 10.1016/j.addr.2004.02.014. [DOI] [PubMed] [Google Scholar]
- Gordon S.; Martinez F. O. Alternative Activation of Macrophages: Mechanism and Functions. Immunity 2010, 32 (5), 593–604. 10.1016/j.immuni.2010.05.007. [DOI] [PubMed] [Google Scholar]
- Zhang Y.; Choksi S.; Chen K.; Pobezinskaya Y.; Linnoila I.; Liu Z.-G. ROS play a critical role in the differentiation of alternatively activated macrophages and the occurrence of tumor-associated macrophages. Cell Res. 2013, 23 (7), 898–914. 10.1038/cr.2013.75. [DOI] [PMC free article] [PubMed] [Google Scholar]
- Pozzi L. A. M.; Maciaszek J. W.; Rock K. L. Both Dendritic Cells and Macrophages Can Stimulate Naive CD8 T Cells In Vivo to Proliferate, Develop Effector Function, and Differentiate into Memory Cells. J. Immunol. 2005, 175 (4), 2071–2081. 10.4049/jimmunol.175.4.2071. [DOI] [PubMed] [Google Scholar]
- Weigert A.; Brüne B. Nitric oxide, apoptosis and macrophage polarization during tumor progression. Nitric Oxide 2008, 19 (2), 95–102. 10.1016/j.niox.2008.04.021. [DOI] [PubMed] [Google Scholar]
- Hagemann T.; Lawrence T.; Mcneish I.; Charles K. A.; Kulbe H.; Thompson R. G.; Robinson S. C.; Balkwill F. R. Re-educating” tumor-associated macrophages by targeting NF-kappaB. J. Exp. Med. 2008, 205 (6), 1261–1268. 10.1084/jem.20080108. [DOI] [PMC free article] [PubMed] [Google Scholar]
- Gong M.; Zhuo X.; Ma A. STAT6 Upregulation Promotes M2Macrophage Polarization to Suppress Atherosclerosis. Med. Sci. Monit. Basic Res. 2017, 23, 240. 10.12659/MSMBR.904014. [DOI] [PMC free article] [PubMed] [Google Scholar]
- Zhu S.; Niu M.; O’Mary H.; Cui Z. Targeting of tumor-associated macrophages made possible by PEG-sheddable, mannose-modified nanoparticles. Mol. Pharmaceutics 2013, 10 (9), 3525–3530. 10.1021/mp400216r. [DOI] [PMC free article] [PubMed] [Google Scholar]
- McWhorter F. Y.; Wang T.; Nguyen P.; Chung T.; Liu W. F. Modulation of macrophage phenotype by cell shape. Proc. Natl. Acad. Sci. U. S. A. 2013, 110 (43), 17253–17258. 10.1073/pnas.1308887110. [DOI] [PMC free article] [PubMed] [Google Scholar]
Associated Data
This section collects any data citations, data availability statements, or supplementary materials included in this article.