

Abstract
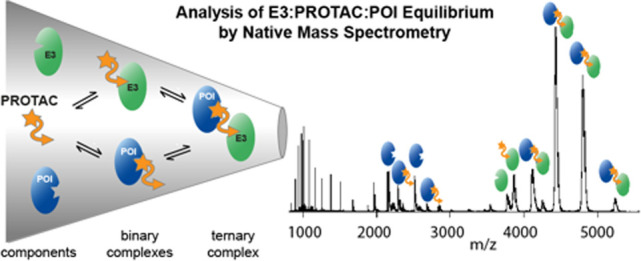
Protein degraders, also known as proteolysis targeting chimeras (PROTACs), are bifunctional small molecules that promote cellular degradation of a protein of interest (POI). PROTACs act as molecular mediators, bringing an E3 ligase and a POI into proximity, thus promoting ubiquitination and degradation of the targeted POI. Despite their great promise as next-generation pharmaceutical drugs, the development of new PROTACs is challenged by the complexity of the system, which involves binary and ternary interactions between components. Here, we demonstrate the strength of native mass spectrometry (nMS), a label-free technique, to provide novel insight into PROTAC-mediated protein interactions. We show that nMS can monitor the formation of ternary E3-PROTAC-POI complexes and detect various intermediate species in a single experiment. A unique benefit of the method is its ability to reveal preferentially formed E3-PROTAC-POI combinations in competition experiments with multiple substrate proteins, thereby positioning it as an ideal high-throughput screening strategy during the development of new PROTACs.
Short abstract
Here, we demonstrate the strength of native mass spectrometry to delineate the complex binding mechanisms of protein degraders, involving the formation of three-component protein−ligand complexes.
Introduction
The development of small molecule degraders, which induce the elimination of a given target protein (Figure 1), is an emerging strategy in drug discovery.1−4 Major advantages of protein degradation over inhibition are the longer-lasting effects and the lower concentrations of the corresponding molecules required to achieve efficacy.5 Moreover, degraders are applicable to a wider spectrum of proteins since degradation is not limited to a specific functional domain or active site.6 Protein degraders have been developed against a variety of medically relevant proteins, such as the tumorigenic androgen receptor and estrogen receptor, as explored in first clinical trials.7−11 To date, the most widely used degraders are the proteolysis-targeting chimeras (PROTACs), discovered in pioneering studies by Crews, Deshaies, and co-workers.12 Aside from these, further compounds have been developed that can induce the degradation of selected target proteins, including the SNIPERs (specific and nongenetic IAP-dependent protein erasers)8,13 as well as compounds reprogramming the autophagy machinery (AUTACS14). In the context of the current work, we will refer to the general protein degraders as PROTACs.
Figure 1.
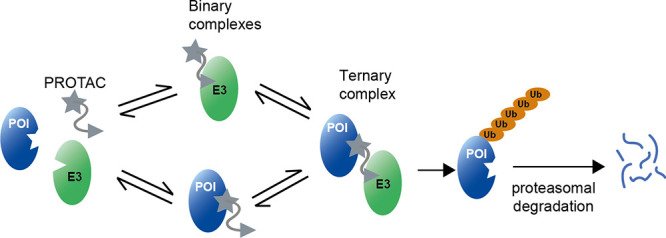
Mechanism of induced protein degradation by a bifunctional PROTAC molecule. PROTAC physically connects a ubiquitin E3 ligase (E3) to a protein of interest (POI), thus inducing its ubiquitination and degradation. The picture illustrates the binary and ternary complexes, showing the POI in blue, the E3 in green, and the PROTAC in gray.
In order to realize the full potential of protein degraders, specialized isothermal titration calorimetry (ITC) and surface plasmon resonance (SPR) protocols have been developed to delineate the complex kinetics of multicomponent degrader systems, which comprise various intermediate states.15−18 A major advantage of ITC is the direct quantification of thermodynamic and binding parameters, while SPR methods can characterize the kinetics of ternary complex formation and dissociation, and the respective lifetimes of ternary complexes. Together, ITC and SPR thus provide a detailed quantitative analysis of individual binding events, as required for drug optimization. However, the traditional biophysical methods are subject to certain limitations that need to be considered in further PROTAC development. Both techniques are referred to as being resource-intensive and low-throughput compared to other methods and, in the case of SPR, requiring labeling of the target protein and/or the E3 ligase. Moreover, the analysis of ternary interactions requires various experimental approximations, such as the use of saturating amounts of one component, and always demands a series of experiments to estimate the basic kinetic parameters of the entire degrader system. The current study presents a complementary mass spectrometry (MS) approach, filling the methodological gaps.
With the use of nanoelectrospray ionization (nESI),19 protein complexes can retain their native topology and stoichiometry during transfer from solution into the gas phase, making protein–protein and protein–ligand interactions amenable to MS analysis.20,21 Key advantages of this “native MS” (nMS) approach22 include the label-free measurement of protein complexes and its capability to report on multiple binding stoichiometries present in dynamic protein mixtures, including molecular species populated to a low extent.23−25 For these reasons, we anticipated that nMS would be particularly applicable for the characterization of PROTAC systems. It could complement ITC and SPR by analyzing the E3, PROTAC, and POI interplay in a single experiment.
Here, we demonstrate that nMS can (1) report on the formation of E3-PROTAC-POI ternary complexes in a semiquantitative manner, (2) delineate the binding specificity of a particular PROTAC molecule, and (3) simultaneously measure PROTAC specificity to multiple substrate proteins in a single measurement. To this end, we used the two established PROTACs AT1 and MZ1, which target bromodomain-containing proteins for degradation via the Von Hippel–Lindau (VHL) E3 ligase, as model compounds. Specificity, affinity, and degradation behavior of AT1 and MZ1 toward different bromodomains have been well characterized,16,18,26,27 providing an excellent test system to benchmark nMS as an analytical tool in PROTAC research.
Results and Discussion
We first tested the capability of nMS to resolve dimeric and trimeric complexes present in a reaction mixture containing PROTAC (P), substrate (S), and an E3 ligase (E3). This initial analysis was focused on Brd4BD2 (S) and its interaction with the VHL/elongin-B/elongin-C complex (VCB, E3), with and without AT1/MZ1 (P). As reference, native mass spectra of Brd4BD2 and VCB (5 μM) were recorded separately, sprayed from 100 mM ammonium acetate, and 100 mM ammonium acetate containing 0.5% DMSO (Figures S1 and S2), the latter condition used in all experiments monitoring complex formation. Expected and measured masses of each species are provided in Table S1. A native mass spectrum of a VCB and Brd4BD2 mixture (Figure 2a) shows that no interaction occurs between the proteins in the absence of a PROTAC molecule. VCB presents in charge states [M + 9H]9+ to [M + 12H]12+, and Brd4BD2 presents in charge states [M + 5H]5+ to [M + 17H]17+, with most of the intensity in charge states [M + 6H]6+ and [M + 7H]7+. Upon the addition of 2.5 μM AT1 (1:0.5:1 ratio of E3:P:S), peaks are present at m/z ratios corresponding to that of the ternary Brd4BD2-AT1-VCB complex in charge states [M + 11H]11+ to [M + 14H]14+. For example, the peak at m/z 5218 (Figure 2b–e) arises due to the intact ternary complex (mass 57 384 Da) carrying 11 protons. Compared to the signal intensity of the ternary complex (0.13 of total intensity), the signal corresponding to the binary VCB-AT1 species (E3:P) is in very low abundance (0.02), while the Brd4BD2-AT1 species (P:S) is not observed at all. While we expect that the signal intensity corresponding to each species is roughly correlated with its abundance in solution, it is highly probable that differences in the efficiency of ionization, transmission, and detection occur upon ternary complex formation.28 Therefore, the obtained results provide a simple quantification of the underlying equilibrium. An increase in AT1 concentration results in a higher relative intensity of the ternary complex (0.27 and 0.65 at 5 μM and 10 μM AT1, respectively) up to 20 μM when the signal becomes slightly lower (0.57), potential reasons for which are discussed below. Interestingly, upon addition of AT1, the intensities of the [M + 6H]6+ and [M + 7H]7+ charge states of Brd4BD2 become lower compared to the charge states [M + 8H]8+ and above. In line with this observation, the Brd4BD2-AT1 binary complex is present only in [M + 6H]6+ and [M + 7H]7+, and no peaks are present corresponding to higher charge states. Lower charge states generally correspond to more compact conformations than higher charge states.29,30 The results therefore infer that a more compact conformation of Brd4BD2 is incorporated into the ternary complex, while a more extended subpopulation, likely representing a partially unfolded protein species, remains unbound.
Figure 2.

Characterization of the equilibrium between VCB, AT1, and Brd4BD2 by nMS. nESI-MS of Brd4BD2 (5 μM, 15 036 Da) and VCB (5 μM, 41 376 Da) sprayed from ammonium acetate (100 mM, pH 6.8) and 0.5% DMSO at AT1 (971 Da) concentrations of 0 μM (a), 2.5 μM (b), 5 μM (c), 10 μM (d), and 20 μM (e). The insets show the estimated fractional ratios of the integrated peaks corresponding to apo-Brd4BD2, apo-VCB, and the indicated binary and ternary complexes, calculated by summing the intensity of each charge state corresponding to a particular species, and normalized to the summed intensity of all annotated peaks in the spectrum. In the case of apo-Brd4BD2 and binary MZ1-Brd4BD2 complex, only charge states [M + 6H]6+ and [M + 7H]7+ are used in the quantitative analysis (right). Bar charts are representative of a single measurement, so no error bars are shown in this case. Expected and measured masses of each species are reported in Table S1. At an equimolar ratio, the signal intensity of Brd4BD2 is higher than that of VCB due to higher ionization efficiency, better transmission inside the mass spectrometer, and/or more efficient detection as a result of its smaller mass and higher charge states.
To compare complex formation with a different PROTAC, equivalent measurements were carried out with MZ1 (Figure S3), and for both PROTAC mixtures, the signal intensity of the ternary complexes is plotted against PROTAC concentration (Figure S4). At 2.5 μM PROTAC concentration, the spectra corresponding to mixtures containing AT1 and MZ1 are very similar, with the same relative signal intensity of the ternary complex (0.13). At PROTAC concentrations ≥5 μM, signal intensity corresponding to the ternary complex is higher for MZ1 than for AT1 (e.g., 0.81 vs 0.65 at 10 μM), reflecting the higher stability of ternary complex initiated by MZ1 relative to AT1, as determined by SPR measurements16 (Table 1). The overall distribution of binary and ternary complexes is similar for mixtures containing AT1 and MZ1, except that no binary complex between Brd4BD2 and MZ1 is observed at 10 μM MZ1 concentration, and then only slightly at 20 μM. For both PROTACs, there is a slight decrease in signal intensity for the ternary complex at 20 μM compared to 10 μM, which we attribute to the onset of the so-called Hook effect: the inhibition of ternary complex formation due to high PROTAC concentrations favoring binary interactions.31 We expected the effect to be stronger for MZ1 than AT1, because of the lower cooperativity of MZ1, whereas in fact we observe the opposite. This could be potentially due to differences in ionization efficiencies of binary Brd4BD2-PROTAC complexes compared to the apo state of the protein. If at 20 μM PROTAC there is more binary complex in solution, but it ionizes less efficiently than the unbound form, the signal intensity of both Brd4BD2 complexes will be lower, thus raising artificially the relative signal of the ternary complex. This would also explain why Brd4BD2 is completely depleted with MZ1 but not AT1. These initial MS measurements demonstrate the strength of nMS for the characterization of protein complexes formed by PROTAC molecules, providing a semiquantitative description of the binding equilibrium between E3, substrate, and PROTAC. Moreover, the method reveals characteristic differences in reaction intermediates formed with different PROTACs, implying mechanistic differences in ternary complex formation.
Table 1. Comparison of Native MS Data on Ternary Complex Formation with Literature Values.
|
KD of VCB binding to [PROTAC + substrate] |
cooperativity | t1/2 of ternary complex | fraction of ternary complex | |||
|---|---|---|---|---|---|---|
| PROTAC | substrate | ITC18 | SPR16 | SPR16 | SPR16 | nMS |
| AT1 | Brd4BD1 | 390 nM | 578 nM | 0.2 | <1 s | 0.65 ± 0.1 |
| AT1 | Brd3BD2 | 79 nM | 163 nM | 0.7 | 3 s | 0.58 ± 0.07 |
| AT1 | Brd4BD2 | 46 nM | 24 nM | 4.7 | 26 s | 0.82 ± 0.06 |
| MZ1 | Brd4BD1 | 28 nM | 30 nM | 0.9 | <1 s | 0.80 ± 0.06 |
| MZ1 | Brd3BD2 | 7 nM | 8 nM | 3.6 | 6 s | 0.83 ± 0.05 |
| MZ1 | Brd4BD2 | 4 nM | 1 nM | 22 | 130 s | 0.92 ± 0.03 |
To investigate whether nMS can report on PROTAC specificity for particular substrate proteins, we took advantage of the preference of AT1 to form ternary complexes with Brd4BD2 over other bromodomain-containing proteins.16,18,26,27 Spectra of VCB:AT mixtures with different bromodomain substrates Brd4BD2, Brd3BD2, and Brd4BD1 respectively, are shown in Figure 3a–c (spectra of isolated Brd4BD2, Brd3BD2, and Brd4BD1 in Figures S2, S5, and S6. Replicate measurements shown in Figures S7–S9). Owing to the different ionization efficiencies of the free substrates, we integrated the signal intensity of apo-VCB, the binary VCB-AT1 complex, and the three ternary complexes. Comparing the relative amounts of ternary complexes reveals the preferential engagement of Brd4BD2 by VCB:AT1 (0.82 ± 0.06), relative to Brd3BD2 (0.58 ± 0.07) and Brd4BD1 (0.65 ± 0.1). These data are consistent with previous ITC experiments, where VCB was mixed with saturated PROTAC-substrate complexes to estimate the Kd of ternary complex formation18 (Table 1). Although the nMS and ITC measurement predict slightly different preferences in binding Brd3BD2 and Brd4BD1, both methods highlight that the VCB:AT1 system most favorably forms a ternary complex with Brd4BD2. We next investigated the PROTAC MZ1, which binds all bromodomain substrates with higher affinity than AT1, but with less selectivity for Brd4BD2 (Figure S10). In this case, the relative amounts of ternary complexes with Brd4BD2, Brd3BD2, and Brd4BD1 are 0.92 ± 0.03, 0.83 ± 0.04, and 0.80 ± 0.06, respectively, pointing to a similar stability of the formed complexes (triplicate measurements shown in Figures S11–S13). For MZ1, the Kd values from ITC are 4, 7, and 28 nM for Brd4BD2, Brd3BD2, and Brd4BD1, respectively, fitting nicely to the nMS data (Table 1). Taken together, the nMS data demonstrate the pronounced selectivity of AT1 toward Brd4BD2, whereas MZ1 is a less selective PROTAC, targeting bromodomains less discriminately.
Figure 3.
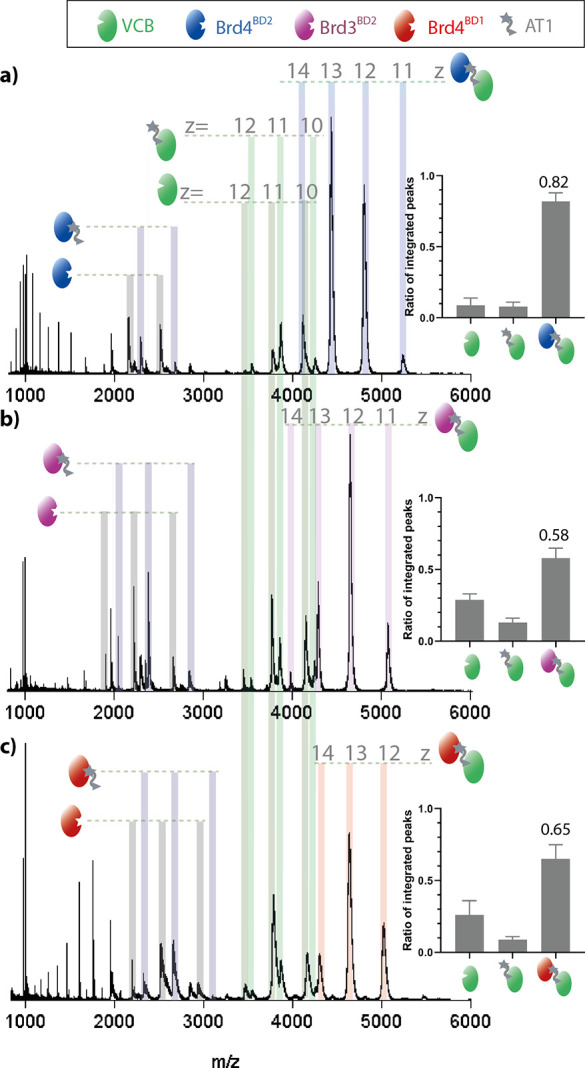
nMS measurements showing the specificity of PROTAC AT1 for Brd4BD2. nESI-MS of VCB (5 μM), AT1 (10 μM), and Brd4BD2 (5 μM, a), Brd3BD2 (5 μM, b), or Brd4BD1 (5 μM, c). Proteins are sprayed from a starting solution of ammonium acetate (100 mM, pH 6.8) and 0.5% DMSO. Inset: estimated relative intensity of summed peaks corresponding to apo-VCB, binary AT1-VCB complex, and ternary complex substrate-AT1-VCB. Samples were analyzed in triplicate (see Figures S7–S9), and the error bars represent the standard deviation of the relative peak intensity. Fractional intensity of the signal corresponding to the ternary complex is shown.
An additional question regarding the mechanism of PROTACs is whether they display cooperative behavior. In a cooperative PROTAC system, the ternary complex will form more readily than either of the binary complexes. To address this point, we measured E3:AT1 and S:AT1 mixtures and compared the binary complex formation to ternary complex formation, using a cooperative (Brd4BD2) and a noncooperative (Brd4BD1) substrate as previously described16,18 (Figure 4). nMS measurements of VCB + AT1 with increasing concentrations of Brd4BD2 are shown in Figure S14, and measurements of Brd4BD2 + AT1 with increasing concentrations of VCB are shown in Figure S15. Binary complex formation of VCB:AT1 is low, below 0.2, and the binary complex formation of Brd4BD2:AT1 and Brd4BD1:AT1 is roughly 0.5 in both cases. When the three components are mixed together, however, the ternary complex is formed to a much higher extent with Brd4BD2 (0.82) than Brd4BD1 (0.65), hinting at cooperativity of this PROTAC system, as proposed by Gadd et al.18 According to these data, nMS analysis allows, in addition to the determination of the most favored ternary complexes, the distinguishing of differences in cooperativity between PROTAC systems.
Figure 4.

nMS method testing PROTAC cooperativity. Top: VCB (5 μM) + AT1 (10 μM). Middle: substrate protein (5 μM) + AT1 (10 μM). Bottom: VCB (5 μM) + AT1 (10 μM) + substrate protein (5 μM). (a) PROTAC cooperativity with Brd4BD2 as substrate protein. (b) PROTAC cooperativity with Brd4BD1 as substrate protein. The insets show the estimated fraction of integrated peaks corresponding to the labeled species. For Brd4BD2, only the peaks which correspond to [M + 6H]6+ and [M + 7H]7+ are used for the quantification and, for Brd4BD1, only [M + 5H]5+, [M + 6H]6+, and [M + 7H]7+. Top and middle panels correspond to single measurements, while those in the bottom panel are the average of three measurements, with error bars representing standard deviations. Values for α (top) are taken from Roy et al.16
Finally, in order to take full advantage of the benefits of nMS over other biophysical methods, we applied our approach to a complex reaction mixture containing an E3, a PROTAC, and multiple substrates. Since nMS was able to distinguish PROTAC specificity in separate experiments, we were curious to what extent PROTACs would recruit the bromodomains in a competition experiment that mimics the in vivo situation more closely. Ternary complex formation was measured using equimolar amounts of Brd4BD2, Brd3BD2, and Brd4BD1 and the PROTAC MZ1 that seemingly promotes ternary complex formation in a rather unselective manner (Figure S10). Initially, an overall substrate concentration (S1 + S2 + S3) equimolar to that of VCB was used, thus avoiding competitive binding. In this case, the relative signal intensity of ternary complex incorporating Brd4BD2 is the highest, with that incorporating Brd3BD2 at a slightly lower intensity and that incorporating Brd4BD1 at an even lower intensity (Figure 5a). When the substrate concentration is increased 3-fold, thereby increasing the competition for binding, the signal intensity of the Brd4BD2-containing ternary complex is more than 3 times higher than complexes containing Brd3BD2 and Brd4BD1 (Figure 5b), clearly outcompeting the other substrates. Together, these data indicate that the competition experiment provides more detailed insight for identification of the best PROTAC substrate. The preference for Brd4BD2 observed by nMS fits to the longest half-life (ln 2/koff) as well as the highest affinity of the respective ternary complex (Table 1 and ref (16)). Moreover, these differences strongly reflect the half-life between Brd4BD2 (130 s) as compared to that with Brd3BD2 (6 s) and Brd4BD1 (<1 s) which is the most strongly varying kinetic parameter among the three bromodomain substrates.16 In fact, the lower half-life of the complex with Brd3BD2 is thought to be the reason for the lower degradation efficiency of Brd3 with respect to Brd4 in cells, despite similar binding affinity.16,18,23,26 When the same MS experiments are performed with AT1, which has higher specificity for Brd4BD2, the signal intensity for the complex containing Brd4BD2 is higher than the other complexes, in both the low-competition and high-competition experiment (Figure 5c,d). This reflects the preference of the formation of the VCB:AT1:Brd4BD2 complex over other substrate complexes.
Figure 5.

nMS analysis of multicomponent E3-PROTAC-POI mixtures reveals preferentially formed ternary complexes. nESI spectra of VCB, PROTAC, and a mixture of bromodomain substrates. (a) VCB (5 μM), MZ1 (10 μM), equimolar mixture of Brd4BD2 (blue), Brd3BD2 (purple), and Brd4BD1 (red) (total Brd concentration 5 μM). (b) As in part a, but total Brd concentration 15 μM. (c, d) As in parts a and b, respectively, but PROTAC is AT1. (e) VCB (2.5uM), MZ1 (5uM), and a mixture of five bromodomain substrates: Brd4BD2, Brd3BD2, Brd2BD2 (yellow), Brd4BD1, BrdT (cyan), total substrate concentration 12.5 μM. (f) As in part e, but PROTAC is AT1. Peaks corresponding to the most intense species are labeled, and fully annotated versions are given in Figure S15.
We next analyzed E3:P:S mixtures of even higher complexity, containing 5 bromodomain substrates and either MZ1 (Figure 5e) or AT1 (Figure 5f). Peaks can be separated for complexes containing Brd4BD2, Brd4BD1, and BrdT. The mass of Brd2BD2 is very close to that of Brd3BD2 (13 351 Da vs 13 279 Da), and therefore, complexes containing these proteins cannot be distinguished from one another. It is, however, clear from the spectra with both PROTACs that the complex containing Brd4BD2 has the highest intensity, inferring that this is the most favorable interaction. Additionally, the difference in intensity between Brd4BD2 and the next most intense peaks is bigger for the sample containing AT1 (Figure 5f) with respect to MZ1 (Figure 5e), further demonstrating the higher specificity of this PROTAC. Such nMS experiments would be highly informative when screening proteins that are recruited by a certain PROTAC. Even if not every protein can be distinguished, as is the case for Brd3BD2 and Brd2BD2, the number of potential interactors can be greatly reduced for further investigation. Measuring the substrate proteins in mixtures is more time-effective than separate measurements and has the added advantage of providing information on competition between substrates forming the ternary complexes. Given the remarkable resolution of nMS, even small size differences in POIs, for instance, introduced by adding short peptide tags, could be resolved, allowing the analysis of even more complex substrate sets as in the current analysis.
Conclusions
To conclude, we have demonstrated, for the first time, that nMS is an effective technique to investigate PROTAC-mediated protein complexes. We can determine differences in specificity of a PROTAC toward different proteins and can measure ternary complex formation of different substrates in a single experiment, which is highly beneficial in the generation of new PROTAC molecules. While SPR and ITC remain the most appropriate methods for obtaining kinetic and thermodynamic data, we envision that nMS will become a popular tool in PROTAC development owing to its fast measurement time, straightforward data analysis, and ability to detect different species in equilibrium. Moreover, nMS bears the unique advantage of performing competition experiments, directly comparing potential substrates and various PROTACs to yield the most efficient degrading system.
Materials and Methods
Protein Expression and Purification
BRD2BD2, BRD3BD2, BRDt, BRD4BD1, and BRD4BD2 were expressed and purified as described by Filippakopoulos et al.32 with final concentrations of 10.2 mg/mL (10 mM Hepes, 500 mM NaCl, 5% glycerin, pH 7.5), 16 mg/mL (25 mM Hepes, 150 mM NaCl, 5 mM DTT, pH 7.5), 39.5 mg/mL (10 mM Hepes, 500 mM NaCl, 10 mM DTT, 5% glycerin, pH 7.4), 13.4 mg/mL (50 mM Hepes, 500 mM NaCl, 5% glycerin, pH 7.5), and 19 mg/mL (10 mM Hepes, 100 mM NaCl, 10 mM DTT, pH 7.5), respectively. Human VHL (54-213), ElonginC (17-112), and ElonginB (1-104) were coexpressed as described previously.6 All protein sequences are provided in Table S2.
Sample Preparation for Native MS Experiments
PROTACs were provided in a 10 mM solution in DMSO, which was diluted 100× in water (100 μM, 1% DMSO). This was further diluted to 2× the working concentration using 1% DMSO in water, to ensure constant DMSO concentration across all experiments. Proteins were buffer exchanged into ammonium acetate using BioRad Micro Bio-Spin 6 columns, and the concentrations were measured with a Bradford assay. Unless described otherwise, 20 μM substrate and 20 μM E3 ligase were mixed in an equimolar concentration (10 μM each) and added to an equivalent volume of PROTAC stock, to give final solution conditions of 5 μM substrate, 5 μM VCB, 5–10 μM PROTAC in 100 mM ammonium acetate, and 0.5% DMSO.
Mass Spectrometry Measurements
Native mass spectrometry experiments were carried out on a Synapt G2Si instrument (Waters, Manchester, UK) with a nanoelectrospray ionization source. Mass calibration was performed by a separate infusion of NaI cluster ions. Solutions were ionized through a positive potential applied to metal-coated borosilicate capillaries (Thermo Scientific). The following instrument parameters were used for PROTAC complexes: capillary voltage 1.3 kV, sample cone voltage 80 V, extractor source offset 60 V, IMS bias voltage 2 V, source temperature 40 °C, trap gas 3 mL/min. For individual proteins, the capillary voltage was set to 1.1 kV, sample cone voltage 40 V, extractor source offset 30 V, IMS bias voltage 2 V, source temperature 40 °C, and trap gas 2 mL/min. Data were processed using Masslynx V4.1 and GraphPad Prism 8.1.1. To determine the estimated ratio of signal corresponding to each species, the relative intensities of peaks involved in the comparison were summed, and the sum of peaks for a particular species was divided by the sum of the total peaks. In Figures 2 and 3 and Figure S2, only the peaks which correspond to [M + 6H]6+ and [M + 7H]7+ of Brd4BD2 are used for the quantification in the bar charts. In Figure 3, only [M + 5H]5+, [M + 6H]6+, and [M + 7H]7+ are used for the quantification of Brd4BD1. No unexpected or unusually high safety hazards were encountered.
Acknowledgments
We are grateful to Karl Mechtler and the Vienna Biocenter Core Facilities for providing the mass spectrometry infrastructure required to perform this research. We are also very appreciative of Dr. Sophie Rebecca Harvey and Dr. Lukasz Migas for critical reading of the manuscript and their useful comments. R.B. acknowledges the Austrian Science Fund for the receipt of a Lise Meitner Postdoctoral Fellowship (Project M2334). The IMP is funded by Boehringer Ingelheim.
Supporting Information Available
The Supporting Information is available free of charge at https://pubs.acs.org/doi/10.1021/acscentsci.0c00049.
Author Present Address
§ R.B.: Department of Pure and Applied Chemistry, University of Strathclyde, Thomas Graham Building, 295 Cathedral Street, Glasgow G1 1XL, United Kingdom
Author Contributions
R.B. and T.C. designed the experiments, which were performed by R.B. Data analyses were performed by R.B., D.K., K.R., P.E., A.M., and T.C. R.B. and T.C. drafted and edited the manuscript.
The authors declare the following competing financial interest(s): D.K., K.R., and P.E. were employees of Boehringer Ingelheim at the time of this work.
Supplementary Material
References
- Collins I.; Wang H.; Caldwell J. J.; Chopra R. Chemical approaches to targeted protein degradation through modulation of the ubiquitin-proteasome pathway. Biochem. J. 2017, 474 (7), 1127–1147. 10.1042/BCJ20160762. [DOI] [PMC free article] [PubMed] [Google Scholar]
- Pei H.; Peng Y.; Zhao Q.; Chen Y. Small molecule PROTACs: an emerging technology for targeted therapy in drug discovery. RSC Adv. 2019, 9 (30), 16967–16976. 10.1039/C9RA03423D. [DOI] [PMC free article] [PubMed] [Google Scholar]
- Wang Y.; Jiang X.; Feng F.; Liu W.; Sun H. Degradation of proteins by PROTACs and other strategies. Acta Pharmaceutica Sinica B 2019, 207. 10.1016/j.apsb.2019.08.001. [DOI] [PMC free article] [PubMed] [Google Scholar]
- Paiva S.-L.; Crews C. M. Targeted protein degradation: elements of PROTAC design. Curr. Opin. Chem. Biol. 2019, 50, 111–119. 10.1016/j.cbpa.2019.02.022. [DOI] [PMC free article] [PubMed] [Google Scholar]
- Bondeson D. P.; et al. Catalytic in vivo protein knockdown by small-molecule PROTACs. Nat. Chem. Biol. 2015, 11, 611. 10.1038/nchembio.1858. [DOI] [PMC free article] [PubMed] [Google Scholar]
- Farnaby W.; et al. BAF complex vulnerabilities in cancer demonstrated via structure-based PROTAC design. Nat. Chem. Biol. 2019, 15 (7), 672–680. 10.1038/s41589-019-0294-6. [DOI] [PMC free article] [PubMed] [Google Scholar]
- Ottis P.; Crews C. M. Proteolysis-Targeting Chimeras: Induced Protein Degradation as a Therapeutic Strategy. ACS Chem. Biol. 2017, 12 (4), 892–898. 10.1021/acschembio.6b01068. [DOI] [PubMed] [Google Scholar]
- Itoh Y.; Kitaguchi R.; Ishikawa M.; Naito M.; Hashimoto Y. Design, synthesis and biological evaluation of nuclear receptor-degradation inducers. Bioorg. Med. Chem. 2011, 19 (22), 6768–6778. 10.1016/j.bmc.2011.09.041. [DOI] [PubMed] [Google Scholar]
- Sakamoto K. M.; Kim K. B.; Verma R.; Ransick A.; Stein B.; Crews C. M.; Deshaies R. J. Development of Protacs to Target Cancer-promoting Proteins for Ubiquitination and Degradation. Mol. Cell. Proteomics 2003, 2 (12), 1350–1358. 10.1074/mcp.T300009-MCP200. [DOI] [PubMed] [Google Scholar]
- Schneekloth A. R.; Pucheault M.; Tae H. S.; Crews C. M. Targeted intracellular protein degradation induced by a small molecule: En route to chemical proteomics. Bioorg. Med. Chem. Lett. 2008, 18 (22), 5904–5908. 10.1016/j.bmcl.2008.07.114. [DOI] [PMC free article] [PubMed] [Google Scholar]
- Flanagan J. J.; Neklesa T. K. Targeting Nuclear Receptors with PROTAC degraders. Mol. Cell. Endocrinol. 2019, 493, 110452. 10.1016/j.mce.2019.110452. [DOI] [PubMed] [Google Scholar]
- Sakamoto K. M.; Kim K. B.; Kumagai A.; Mercurio F.; Crews C. M.; Deshaies R. J. Protacs: Chimeric molecules that target proteins to the Skp1–Cullin–F box complex for ubiquitination and degradation. Proc. Natl. Acad. Sci. U. S. A. 2001, 98 (15), 8554–8559. 10.1073/pnas.141230798. [DOI] [PMC free article] [PubMed] [Google Scholar]
- Naito M.; Ohoka N.; Shibata N. SNIPERs—Hijacking IAP activity to induce protein degradation. Drug Discovery Today: Technol. 2019, 31, 35–42. 10.1016/j.ddtec.2018.12.002. [DOI] [PubMed] [Google Scholar]
- Takahashi D.; Moriyama J.; Nakamura T.; Miki E.; Takahashi E.; Sato A.; Akaike T.; Itto-Nakama K.; Arimoto H. AUTACs: Cargo-Specific Degraders Using Selective Autophagy. Mol. Cell 2019, 76 (5), 797–810. 10.1016/j.molcel.2019.09.009. [DOI] [PubMed] [Google Scholar]
- Hughes S. J.; Ciulli A. Molecular recognition of ternary complexes: a new dimension in the structure-guided design of chemical degraders. Essays Biochem. 2017, 61 (5), 505–516. 10.1042/EBC20170041. [DOI] [PMC free article] [PubMed] [Google Scholar]
- Roy M. J.; Winkler S.; Hughes S. J.; Whitworth C.; Galant M.; Farnaby W.; Rumpel K.; Ciulli A. SPR-Measured Dissociation Kinetics of PROTAC Ternary Complexes Influence Target Degradation Rate. ACS Chem. Biol. 2019, 14 (3), 361–368. 10.1021/acschembio.9b00092. [DOI] [PMC free article] [PubMed] [Google Scholar]
- Zorba A.; et al. Delineating the role of cooperativity in the design of potent PROTACs for BTK. Proc. Natl. Acad. Sci. U. S. A. 2018, 115 (31), E7285–E7292. 10.1073/pnas.1803662115. [DOI] [PMC free article] [PubMed] [Google Scholar]
- Gadd M. S.; Testa A.; Lucas X.; Chan K.-H.; Chen W.; Lamont D. J.; Zengerle M.; Ciulli A. Structural basis of PROTAC cooperative recognition for selective protein degradation. Nat. Chem. Biol. 2017, 13, 514. 10.1038/nchembio.2329. [DOI] [PMC free article] [PubMed] [Google Scholar]
- Fenn J.; Mann M.; Meng C.; Wong S.; Whitehouse C. Electrospray ionization for mass spectrometry of large biomolecules. Science 1989, 246 (4926), 64–71. 10.1126/science.2675315. [DOI] [PubMed] [Google Scholar]
- Sharon M.; Robinson C. V. The Role of Mass Spectrometry in Structure Elucidation of Dynamic Protein Complexes. Annu. Rev. Biochem. 2007, 76 (1), 167–193. 10.1146/annurev.biochem.76.061005.090816. [DOI] [PubMed] [Google Scholar]
- Skinner O. S.; Haverland N. A.; Fornelli L.; Melani R. D.; Do Vale L. H. F.; Seckler H. S.; Doubleday P. F.; Schachner L. F.; Srzentić K.; Kelleher N. L.; Compton P. D. Top-down characterization of endogenous protein complexes with native proteomics. Nat. Chem. Biol. 2018, 14, 36. 10.1038/nchembio.2515. [DOI] [PMC free article] [PubMed] [Google Scholar]
- Heck A. J. R. Native mass spectrometry: a bridge between interactomics and structural biology. Nat. Methods 2008, 5, 927. 10.1038/nmeth.1265. [DOI] [PubMed] [Google Scholar]
- Leney A. C.; Heck A. J. R. Native Mass Spectrometry: What is in the Name?. J. Am. Soc. Mass Spectrom. 2017, 28 (1), 5–13. 10.1007/s13361-016-1545-3. [DOI] [PMC free article] [PubMed] [Google Scholar]
- Eyers C. E.; Vonderach M.; Ferries S.; Jeacock K.; Eyers P. A. Understanding protein–drug interactions using ion mobility–mass spectrometry. Curr. Opin. Chem. Biol. 2018, 42, 167–176. 10.1016/j.cbpa.2017.12.013. [DOI] [PubMed] [Google Scholar]
- Beveridge R.; Migas L. G.; Payne K. A. P.; Scrutton N. S.; Leys D.; Barran P. E. Mass spectrometry locates local and allosteric conformational changes that occur on cofactor binding. Nat. Commun. 2016, 7, 12163. 10.1038/ncomms12163. [DOI] [PMC free article] [PubMed] [Google Scholar]
- Riching K. M.; Mahan S.; Corona C. R.; McDougall M.; Vasta J. D.; Robers M. B.; Urh M.; Daniels D. L. Quantitative Live-Cell Kinetic Degradation and Mechanistic Profiling of PROTAC Mode of Action. ACS Chem. Biol. 2018, 13 (9), 2758–2770. 10.1021/acschembio.8b00692. [DOI] [PubMed] [Google Scholar]
- Zengerle M.; Chan K.-H.; Ciulli A. Selective Small Molecule Induced Degradation of the BET Bromodomain Protein BRD4. ACS Chem. Biol. 2015, 10 (8), 1770–1777. 10.1021/acschembio.5b00216. [DOI] [PMC free article] [PubMed] [Google Scholar]
- Cech N. B.; Enke C. G. Relating Electrospray Ionization Response to Nonpolar Character of Small Peptides. Anal. Chem. 2000, 72 (13), 2717–2723. 10.1021/ac9914869. [DOI] [PubMed] [Google Scholar]
- Beveridge R.; Covill S.; Pacholarz K. J.; Kalapothakis J. M. D.; MacPhee C. E.; Barran P. E. A Mass-Spectrometry-Based Framework To Define the Extent of Disorder in Proteins. Anal. Chem. 2014, 86 (22), 10979–10991. 10.1021/ac5027435. [DOI] [PubMed] [Google Scholar]
- Beveridge R.; Migas L. G.; Das R. K.; Pappu R. V.; Kriwacki R. W.; Barran P. E. Ion Mobility Mass Spectrometry Uncovers the Impact of the Patterning of Oppositely Charged Residues on the Conformational Distributions of Intrinsically Disordered Proteins. J. Am. Chem. Soc. 2019, 141 (12), 4908–4918. 10.1021/jacs.8b13483. [DOI] [PMC free article] [PubMed] [Google Scholar]
- Douglass E. F.; Miller C. J.; Sparer G.; Shapiro H.; Spiegel D. A. A Comprehensive Mathematical Model for Three-Body Binding Equilibria. J. Am. Chem. Soc. 2013, 135 (16), 6092–6099. 10.1021/ja311795d. [DOI] [PMC free article] [PubMed] [Google Scholar]
- Filippakopoulos P.; et al. Selective inhibition of BET bromodomains. Nature 2010, 468, 1067. 10.1038/nature09504. [DOI] [PMC free article] [PubMed] [Google Scholar]
Associated Data
This section collects any data citations, data availability statements, or supplementary materials included in this article.