

Abstract
Focal segmental glomerulosclerosis (FSGS) is a scarring process associated with chronic low‐grade inflammation ascribed to toll‐like receptor (TLR) activation and monocyte migration. We developed synthetic, small‐molecule lecinoxoids, VB‐201 and VB‐703, that differentially inhibit TLR‐2‐ and TLR‐4‐mediated activation and monocyte migration. The efficacy of anti‐inflammatory lecinoxoid treatment on FSGS development was explored using a 5/6 nephrectomy rat model. Five‐sixths of nephrectomized rats were treated with lecinoxoids VB‐201, VB‐703 or PBS, for 7 weeks. Upon sacrifice, albumin/creatinine ratio, glomerulosclerosis, fibrosis‐related gene expression and the number of glomerular and interstitial monocyte were evaluated. Treatment of nephrectomized rats with lecinoxoids ameliorated glomerulosclerosis. The percentage of damaged glomeruli, glomerular sclerosis and glomeruli fibrotic score was significantly reduced following VB‐201 and VB‐703 treatment. VB‐703 attenuated the expression of fibrosis hallmark genes collagen, fibronectin (FN) and transforming growth factor β (TGF‐β) in kidneys and improved albumin/creatinine ratio with higher efficacy than did VB‐201, but only VB‐201 significantly reduced the number of glomerular and interstitial monocytes. These results indicate that treatment with TLR‐2, and more prominently, TLR‐4 antagonizing lecinoxioids, is sufficient to significantly inhibit FSGS. Moreover, inhibiting monocyte migration can also contribute to treatment of FSGS. Our data demonstrate that targeting TLR‐2‐TLR‐4 and/or monocyte migration directly affects the priming phase of fibrosis and may consequently perturb disease parthogenesis.
1. INTRODUCTION
Renal fibrosis is a detrimental disease characterized by connective tissue deposition in the kidney glomeruli leading to glomerulosclerosis and fibrosis within the interstitium.1 Deposition of extracellular matrix (ECM) proteins in glomeruli, that usually consists of fibronectin (FN) and collagen IV, is a highly dynamic process that occurs during the development of focal segmental glomerulosclerosis (FSGS), leading to sclerotic changes in some glomeruli (focal) and in part of the glomerular capillary tuft (segmental).2, 3, 4
Chronic inflammation is central in driving renal fibrosis and is characterized by mononuclear cell infiltration and elevated levels of pro‐inflammatory cytokines 5, 6 that were shown to support the generation and activation of myofibroblasts in the kidney to produce excessive ECM proteins.1 Recent studies suggest that macrophages not only secrete pro‐fibrotic mediators, but additionally may convert into myofibroblasts in a process termed macrophage‐myofibroblast transition to directly produce ECM components.7, 8, 9 Moreover, toll‐like receptor (TLR), a conserved family of pattern recognition receptors that play a fundamental role in innate immunity and present on myeloid cells,10, 11 has been implicated in the pathogenesis of renal fibrosis.12, 13, 14, 15
Lecinoxoids (lecin for lecithin, ie a phospholipid, and oxoid for oxidized) are small molecules with a phospholipid backbone. They are structurally and functionally similar to the naturally occurring oxidized phospholipid (Ox‐PL) molecules, but while native Ox‐PLs are short‐lived due to degradation by phospholipases, lecinoxoids are synthesized in vitro in a manner that offers enhanced stability and activity. This is achieved by replacing the native Ox‐PL ester bonds at sn‐1 and sn‐2 of the glycerol backbone with ether bonds.
We previously reported that VB‐201, a member of the Lecinoxoid family, is an antagonist of ligand binding to CD14 and TLR‐2 on monocytes and DCs, thereby inhibiting all anticipated downstream signalling events.16 VB‐201 was also shown to inhibit monocyte chemotactic capacity in vitro and in vivo.17 VB‐703 is a next generation member the Lecinoxoid family designed in silico for improved efficacy. VB‐703 is known to be equally potent as VB‐201 in antagonizing TLR‐2, but exhibits increased inhibition of TLR‐4 compared with VB‐201. VB‐703 does not affect monocyte migration, but was nonetheless demonstrated to significantly attenuate liver inflammation and fibrosis in a non‐alcoholic steatohepatitis animal model.18
In this study, the anti‐inflammatory effect of VB‐201 and VB‐703 was tested for their potential to attenuate fibrosis development in the 5/6 nephrectomy rat model.
2. MATERIALS AND METHODS
2.1. Animals
Male Sprague Dawley rats (ENVIGO RMS, Jerusalem, Israel) with an initial weight of 200 g were housed in IVC cages (2‐3 per cage) in a dedicated, controlled environment animal facility at a temperature of 22 ± 2°C and RH of 55 ± 15%. Temperature and humidity were monitored continuously. The facility (Rehovot, Israel) had no exposure to outside light, and automatic alternating cycles of 12 hours of light and 12 hours of dark were maintained. Animals were provided with a commercial rodent diet (Harlan Teklad TRM Rat/Mouse Diet) ad libitum and allowed free access to autoclaved water, supplied to each cage via polysulphone bottles with stainless steel sipper tubes. All animal work was approved by the Animal Care and Use Committee of Israel (IL‐13‐03‐027).
2.2. Induction of chronic renal disease by 5/6 nephrectomy
Rats were divided into three groups: (a) Group A: healthy rats (n = 3), (b) Group B: sham‐operated group (n = 3) in which rats were subjected to a surgical process but with no kidney mass reduction. Sham surgery consisted of laparotomy and manipulation of both kidneys before wound closure; and (c) Group C: test group in which rats were induced with chronic renal failure (n = 24). Chronic renal failure was induced by a two‐stage (5/6) nephrectomy (Nx) in which infarction of approximately two‐thirds of the left kidney was induced by selective ligation of two of three to four extrarenal branches of the left renal artery, followed by complete removal of the right kidney one week later. Kidney externalization was performed by gently pulling on the perirenal fat with forceps, taking care to not disturb the adrenal gland. General anaesthesia consisted of intraperitoneal injection of 100 mg/kg ketamine with 20 mg/kg xylazine. Rats were monitored for clinical signs, urination and weight. Humane end‐points were cease of urination or ≥20% total body weight loss.
2.3. Experimental groups
One week following the second surgery, rats were randomly assigned to the following experimental groups:
Healthy, orally administered with vehicle—PBS 0.5% ethanol (Eth); (n = 3)
Sham‐operated, orally administered with vehicle—PBS 0.5% Eth; (n = 3)
Nephrectomized, orally administered with vehicle—PBS 0.5% Eth; (n = 8)
Nephrectomized, orally administered with VB‐703 4 mg/kg; (n = 8)
Nephrectomized, orally administered with VB‐201 4 mg/kg; (n = 8)
BW was monitored throughout the study, and rats were treated by oral gavage once a day for 7 weeks, according to their body weight. Rats were killed by CO2 inhalation 8 weeks after removal of right kidney (second surgery).
One rat from the nephrectomized, orally administered with vehicle—PBS 0.5% Eth, died after 4 weeks of treatment and one rat from the nephrectomized, orally administered with VB‐703, died after 5 weeks of treatment. Accordingly, the number of animals for these groups at sacrifice was n = 7.
2.4. Tested compounds
The bioactive compounds VB‐201 ((R)‐1‐hexadecyl‐2‐ (4‐carboxy)butyl‐sn‐glycero‐3‐phosphocholine) and VB‐703 (1‐(2‐octyl)dodecyl‐2‐(4′‐carboxy)butyl‐glycero‐sn‐3‐phosphoric acid pyridiniumethyl ester) were synthesized in VBL's chemical laboratory (Or Yehuda, Israel). The synthesis of VB‐201 was described previously.16 VB‐703 was synthesized from (S)‐1‐(2‐octyl)dodecyl‐2‐(4′‐carboxy)butyl‐glycerol. The free acid was protected by esterification and reacted with phosphorus oxychloride, followed by the addition of O‐tosyl ethylene glycol. After aqueous hydrolysis, 1‐(2‐octyl)dodecyl‐2‐(4′‐carboxymethyl)butyl‐glycero‐sn‐3‐phosphoric acid tosylethyl ester was obtained. Heating of 1‐(2‐octyl)dodecyl‐2‐(4′‐carboxymethyl)butyl‐glycero‐sn‐3‐phosphoric acid tosylethyl ester in pyridine and purification by chromatography over silica gel yielded 1‐(2‐octyl)dodecyl‐2‐(4′‐carboxy)butyl‐glycero‐sn‐3‐phosphoric acid pyridiniumethyl ester (VB‐703). To prepare dosing solutions, VB‐201 and VB‐703 were dissolved in the solvent (0.5% Eth in PBS).
2.5. Biochemical analysis
Urine specimens were collected over a 24‐hour period, from animals housed in metabolic cages 8 weeks (7 weeks of treatment) after the subtotal nephrectomy (second surgery). Urine samples were analysed for glucose (OSR6170), urea (OSR6134, OSR6234, OSR6534), sodium (66315), potassium (66315), creatinine (OSR6178, OSR6578) and albumin (OSR6167) on a Beckman Coulter AU5800. The ratio of urinary albumin to creatinine (UACR) was calculated.
Plasma was collected at 8 weeks, and HDL cholesterol (OSR6287), LDL cholesterol (OSR6283), total cholesterol (OSR6216) and total triglyceride (OSR61118) levels were determined using an Olympus AU640.
Serum was collected at 8 weeks and analysed for glucose (OSR6221), urea (OSR6134, OSR6234, OSR6534), sodium (66319, 66320), potassium (66319, 66320), creatinine (OSR6178, OSR6578), albumin (OSR6102, OSR6202) and globulin (calculated) on a Beckman Coulter AU5800.
Whole blood was collected for blood count at 8 weeks. Blood count was analysed in an automated cell counter (LH 780 Beckman Coulter).
Creatinine clearance (mL/min) was calculated as urine creatinine (mg/dL) × urine volume collected over 24 hours (1440 minutes) (mL/min) : serum creatinine (mg/dL).
2.6. Kidney collection
Upon sacrifice at 8 weeks, kidneys were collected, weighed and fixed in 4% formaldehyde.
2.7. Renal morphology and morphometric analysis
In preparation for light microscopy, paraffin‐embedded tissue slides of 4‐μm slices were stained with periodic acid‐Schiff (PAS) reagent, Masson's trichrome and haematoxilin and eosin (H&E).
2.7.1. Glomerular Sclerosis Index
Glomerulosclerosis was assessed by PAS‐stained sections using a semiquantitative scoring system according to the method described by Raij et al.19 The extent of glomerulosclerosis was evaluated by examining 75‐100 randomly selected glomeruli at a magnification of ×400 and applying a score system according to the percentage of glomerular area sclerosed. The score ranged from 0 to 4 (0 = 0% of area; 1 = 1%‐25%; 2 = 26%‐50%, 3 = 51%‐75%, 4 = over 76%). The mean of all scored glomeruli was presented. Moreover, the extent of global and segmental glomerulosclerosis was evaluated in the same glomeruli, whereby <80% sclerosis was referred to as segmental sclerosis and >80% was referred to as global sclerosis.
2.7.2. Glomerular area
The glomerular area of 75‐100 randomly selected glomeruli was quantified at a magnification of ×100 by counting squares covered by glomerular area using a grid. The mean glomerulus area was then calculated. Glumerular hyperteophy was calculated as the percentage of hypertrophied glomeruli in all tested groups. Hypertrophied glomeruli was determined as an area 1.5 times the mean area of normal glomeruli (the mean glomeruli area of the healthy and sham‐operated groups).
2.8. Immunohistochemistry
Formalin‐fixed tissues were dehydrated, embedded in paraffin and sectioned at 4 μm. Immunostaining was fully calibrated on a Benchmark XT staining module (Ventana Medical Systems, Oro Valley, AZ, USA). After dewaxing and rehydrating, sections were treated with 1:100 anti‐CD68 (ED‐1, Serotec MCA341R) for 40 minutes. Slides were then incubated at 60°C for 1 hour and processed using a fully automated protocol. Detection was performed using an iView DAB Detection Kit (760‐091; Ventana Medical Systems). Slides were counterstained with haematoxylin (Ventana Medical Systems). After the run on the automated stainer was completed, slides were dehydrated consecutively in 70% Eth, 95% Eth and 100% Eth for 10 seconds each. Before coverslipping, sections were cleared in xylene for 10 seconds and mounted with Entellan.
To quantify interstitial CD68+ staining, the number of positive cells was counted in 20 randomly selected non‐overlapping fields per animal (×100 magnification), and the mean value was presented. For glomerular CD68+ staining, the number of positive cells was counted in 25 glomeruli per animal (×400 magnification). All measurments were conducted in a blinded fashion.
2.9. Immunofluorescence Staining of Podocytes
Podocytes were stained by immunofluorescnce using WT‐1 as a marker. Slices, 4 μm thick, were de‐paraffinized, blocked in goat serum (G9023; Sigma, Rehovot, Israel) and incubated with anti‐WT‐1 Ab conjugated to Alexafluor 647 (sc393498 AF647; Santa Cruz, Dallas, TX, USA 1:500), diluted in PBS with 1% BSA (A2153; Sigma) and left overnight at 4°C. Slides were washed twice in PBS, mounted using VECTASHIELD® HardSet (H‐1400; Vector Labs, Burlingame, CA, USA) and kept at 4°C. Stained sections were examined and photographed by a fluorescence microscope (Eclipse Ni‐U, NiKOn, Tokyo, Japan). The average number of podocytes in three different glomeruli was calculated for each animal.
2.10. Quantitative Real‐Time PCR
Kidney RNA was extracted using an RNeasy Fibrous Tissue Mini Kit (Qiagen, Hilden, Germany), and after DNAse I treatment, single‐stranded cDNA was synthesized from 2 μg total RNA using a qScript cDNA Synthesis Kit (Quanta Biosciences) and diluted for real‐time PCR. The expression of collagen type IV α, fibronectin and TGF‐β normalized to TATA‐box binding protein (Tbp) (Table 1) was quantified using the 7300 Real Time PCR System (Applied Biosystems, Foster City, CA, USA). Assay was performed according to manufacturer's instructions using the primers (Assay ID) supplied by manufacturer. Data are presented as relative mRNA levels compared with sham PBS 0.5% Eth treatment.
Table 1.
Gene expression references
| Assay ID | Gene symbol | Gene name |
|---|---|---|
| Rn01482927_m1 | Col IVα1 | Collagen; type IV; alpha 1 |
| Rn00572010_m1 | TGF‐β1 | Transforming growth factor; beta 1 |
| Rn00569575_m1 | Fn1 | Fibronectin 1 |
| Rn01455646_m1 | TBP | TATA‐box binding protein |
2.11. Statistics
Data are expressed as means ± SE. Statistical significance was determined by one‐way ANOVA or Student's t test where appropriate. Statistical analyses were performed using Sigma Stat software (Systat Software, San Jose, CA, USA).
3. RESULTS
3.1. The effect of VB‐703 and VB‐201 treatment on biochemical and physiological parameters
Figure 1 presents the schematic backbone structure of the lecinoxoids and the structure of VB‐201 and VB‐703. VB‐703 and VB‐201 are members of the Lecinoxoid family, previously shown to inhibit TLR‐2‐ and TLR‐4‐mediated activation as well as monocyte migration. One characteristic of FSGS is the loss of metabolic homeostasis. We first tested the effect of treatment with VB‐201 and VB‐703 on biochemical and physiological parameters in nephrectomized rats. We found that overall, mean body weight was not significantly different among all tested groups (Figure S1).
Figure 1.

The schematic backbone structure of lecinoxoids (A), VB‐201 (B) and VB‐703 (C)
Creatinine clearance, tested by measuring urine level, was reduced in vehicle‐treated nephrectomized rats (Nx PBS 0.5% Eth) compared with healthy (n = 3; not significantly) and sham‐operated control rats (n = 3; P < 0.05), but was similar among all nephrectomized treated groups.
Moreover, albuminuria, which was evaluated in urine at the end of the study, was significantly reduced following VB‐201 and VB‐703 treatment, by 35% (P < 0.05) and 43% (P < 0.005), respectively (Table 2).
Table 2.
Effect of VB‐703 and VB‐201 on urine biochemistry (end of study)
| Treatment | Healthy | Sham | Nx PBS | Nx VB‐703 | Nx VB‐201 |
|---|---|---|---|---|---|
| Parameter | |||||
| Glucose (mg/dL) |
34.7 ± 2.2a (n = 3) P < 0.001 |
41.3 ± 14.9 (n = 3) P < 0.05 |
12.6 ± 2.4 (n = 7) |
9.4 ± 2.3 (n = 7) n.s |
22.3 ± 16.2 (n = 8) n.s |
| Urea (mg/dL) |
5649.7 ± 601.5 (n = 3) P < 0.001 |
6029.4 ± 820.7 (n = 3) P < 0.001 |
1643.6 ± 161.6 (n = 7) |
1789.7 ± 130.9 (n = 7) n.s |
1695.5 ± 117.7 (n = 8) n.s |
| Sodium (meq/L) |
123.7 ± 28.6 (n = 3) P < 0.005 |
133.7 ± 13.9 (n = 3) P < 0.001 |
40.6 ± 2.9 (n = 7) |
28.3 ± 4.6 (n = 7) P < 0.05 |
37.4 ± 3.7 (n = 8) n.s |
| Potassium (meq/L) |
244.3 ± 27.4 (n = 3) P < 0.001 |
224.7 ± 11.7 (n = 3) P < 0.001 |
78.1 ± 6.6 (n = 7) |
81.4 ± 6.5 (n = 7) n.s |
76.3 ± 5.4 (n = 8) n.s |
| Creatinine (meq/L) |
118.3 ± 16.0 (n = 3) P < 0.001 |
109.0 ± 8.5 (n = 3) P < 0.001 |
26.1 ± 2.7 (n = 7) |
38.6 ± 4.2 (n = 7) P < 0.05 |
28.8 ± 4.1 (n = 8) n.s |
| Total protein (g/L) |
3.6 ± 0.9 (n = 3) n.s |
3.1 ± 0.7 (n = 3) n.s |
5.2 ± 0.7 (n = 7) |
5.5 ± 0.7 (n = 7) n.s |
6.7 ± 0.9 (n = 8) n.s |
| Microalbumin (mg/L) |
128.7 ± 54.4 (n = 3) P < 0.05 |
141.5 ± 11.5 (n = 3) P < 0.01 |
231.6 ± 15.1 (n = 7) |
206.3 ± 15.9 (n = 7) n.s |
191.3 ± 19.2 (n = 8) n.s |
| Proteinuria (mg/d) |
32.2 ± 11.8 (n = 3) P < 0.05 |
28.6 ± 4.4 (n = 3) P < 0.05 |
268.4 ± 50.6 (n = 7) |
185.5 ± 40.0 (n = 7) n.s |
235.9 ± 26.7 (n = 8) n.s |
| Albuminuria (mg/d) |
1.2 ± 0.6 (n = 3) P < 0.001 |
1.3 ± 0.1 (n = 3) P < 0.001 |
11.5 ± 1.1 (n = 7) |
6.5 ± 0.7 (n = 7) P < 0.005 |
7.5 ± 1.2 (n = 8) P < 0.05 |
| Creatinine clearance (mL/min) |
3.5 ± 0.1 (n = 3) n.s |
4.3 ± 0.4 (n = 3) P < 0.05 |
2.3 ± 0.4 (n = 7) |
2.1 ± 0.3 (n = 7) n.s |
1.8 ± 0.4 (n = 8) n.s |
| Total urine volume collected over 24 h (mL) |
8.5 ± 1.0 (n = 3) P < 0.001 |
9.6 ± 1.4 (n = 3) P < 0.001 |
48.6 ± 3.2 (n = 7) |
32.3 ± 3.4 (n = 7) P < 0.005 |
37.4 ± 3.3 (n = 8) P < 0.05 |
Number of animals tested per group and P value vs Nx PBS group are presented.
Nx, Nephrectomized.
Data are presented as mean ± SE.
While VB‐703 treatment significantly (P < 0.05) improved UACR at study termination, only a moderate, non‐significant reduction was observed following VB‐201 treatment (Figure 2).
Figure 2.
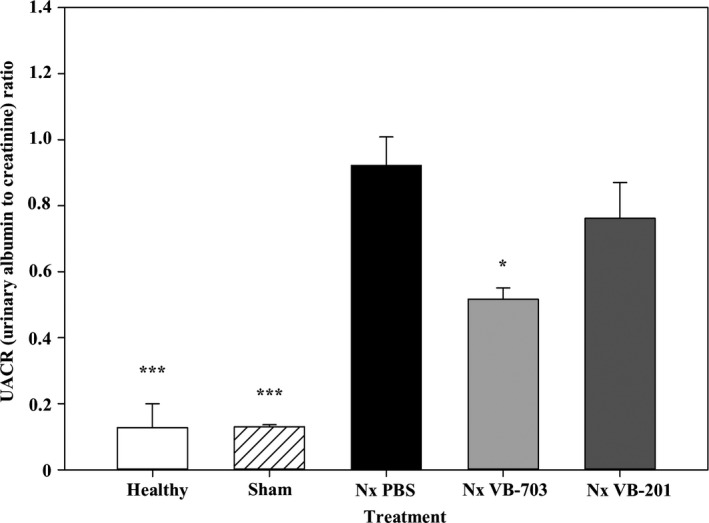
Effect of VB‐703 and VB‐201 on UACR was evaluated at 8 wk in healthy rats (n = 3); sham‐operated rats (n = 3); PBS‐treated nephrectomized rats (n = 7); VB‐703‐treated nephrectomized rats (n = 7); and VB‐201‐treated nephrectomized rats (n = 8). *P < 0.05; ***P < 0.001 vs PBS‐treated nephrectomized rats. Data are presented as mean ± SE. Nx, nephrectomized
Treatment with VB‐201 and VB‐703 had no beneficial effect on other parameters evaluated in urine (Table 2), whole blood (Table 3) and serum (Table 4) (as specified in the materials and methods section). Lipid abnormalities can accelerate chronic kidney disease (CKD) progression and contribute to morbidity and mortality risk.20, 21 We therefore tested the effect of VB‐201 and VB‐703, which themeselves can be identified as lipid moieties, on the lipids profile. Total cholesterol, HDL cholesterol and LDL cholesterol were significantly increased in vehicle‐treated nephrectomized rats (Nx PBS 0.5% Eth) compared with healthy (P < 0.005; P < 0.001; P < 0.005, respectively) and sham‐operated control rats (P < 0.001; P < 0.001; P < 0.005, respectively), but were similar among all nephrectomized treated groups (Table 5).
Table 3.
Effect of VB‐703 and VB‐201 on peripheral blood cells (end of study)
| Treatment | Healthy (n = 3) | Sham (n = 3) | Nx PBS (n = 7) | Nx VB‐703 (n = 7) | Nx VB‐201 (n = 8) |
|---|---|---|---|---|---|
| Parameter | |||||
| Haemoglobin mg/dL |
15.1 ± 0.2a P < 0.01 |
15.1 ± 0.1 P < 0.01 |
12.5 ± 0.5 |
11.4 ± 1.1 n.s |
12.0 ± 0.9 n.s |
| WBC/μL |
5447 ± 1478 n.s |
4253 ± 1650 n.s |
3856 ± 865 |
2581 ± 494 n.s |
2361 ± 404 n.s |
| Lymphocytes/μL |
5147 ± 1531 n.s |
4020 ± 1531 n.s |
2817 ± 735 |
2123 ± 298 n.s |
1834 ± 371 n.s |
Number of animals tested per group and P value vs Nx PBS group are presented.
Nx, Nephrectomized; WBC, White blood cells.
Data are presented as mean ± SE.
Table 4.
Effect of VB‐703 and VB‐201 on serum biochemistry (end of study)
| Treatment | Healthy | Sham | Nx PBS | Nx VB‐703 | Nx VB‐201 |
|---|---|---|---|---|---|
| Parameter | |||||
| Urea (mg/dL) |
42.7 ± 3.2a (n = 3) P = 0.001 |
41.3 ± 2.3 (n = 3) P = 0.001 |
177.4 ± 17.6 (n = 7) |
189.0 ± 29.3 (n = 7) n.s |
273.3 ± 78.1 (n = 8) n.s |
| Creatinine (mg/dL) |
0.453 ± 0.009 (n = 3) P < 0.05 |
0.390 ± 0.029 (n = 3) P < 0.01 |
1.120 ± 0.136 (n = 7) |
1.224 ± 0.197 (n = 7) n.s |
1.590 ± 0.282 (n = 8) n.s |
| Glucose (mg/dL) |
247.3 ± 15.6 (n = 3) P < 0.005 |
270.3 ± 15.2 (n = 3) P < 0.001 |
196.0 ± 5.6 (n = 7) |
187.9 ± 15.5 (n = 7) n.s |
205.5 ± 10.5 (n = 8) n.s |
| Sodium (meq/L) |
142.3 ± 0.3 (n = 3) n.s |
139.7 ± 0.3 (n = 3) n.s |
141.0 ± 0.6 (n = 7) |
142.3 ± 0.8 (n = 7) n.s |
143.5 ± 1.2 (n = 8) n.s |
| Protein (g/dL) |
6.3 ± 0.1 (n = 3) P < 0.01 |
6.3 ± 0.3 (n = 3) n.s |
5.7 ± 0.1 (n = 7) |
5.6 ± 0.1 (n = 7) n.s |
5.3 ± 0.1 (n = 8) P < 0.05 |
| Albumin (g/dL) |
2.93 ± 0.07 (n = 3) P < 0.005 |
2.83 ± 0.12 (n = 3) P < 0.05 |
2.53 ± 0.06 (n = 7) |
2.46 ± 0.04 (n = 7) n.s |
2.39 ± 0.07 (n = 8) n.s |
| Estimated globulin (g/dL) |
3.37 ± 0.03 (n = 3) n.s |
3.43 ± 0.20 (n = 3) n.s |
3.16 ± 0.08 (n = 7) |
3.17 ± 0.14 (n = 7) n.s |
2.93 ± 0.07 (n = 8) P < 0.05 |
| Potassium (meq/L) |
7.0 ± 0.3 (n = 3) P < 0.05 |
6.3 ± 0.4 (n = 3) n.s |
6.1 ± 0.2 (n = 7) |
5.7 ± 0.2 (n = 7) n.s |
6.5 ± 0.2 (n = 8) n.s |
Number of animals tested per group and P value vs Nx PBS group are presented.
Nx, Nephrectomized.
Data are presented as mean ± SE.
Table 5.
Effect of VB‐703 and VB‐201 on lipid profile (end of study)
| Treatment | Healthy | Sham | Nx PBS | Nx VB‐703 | Nx VB‐201 |
|---|---|---|---|---|---|
| Parameter | |||||
| Total cholesterol (mg/dL) |
107.7 ± 1.9a (n = 3) P < 0.005 |
96.0 ± 2.0 (n = 3) P < 0.001 |
163.7 ± 7.6 (n = 7) |
160.1 ± 7.6 (n = 7) n.s |
170.5 ± 7.5 (n = 8) n.s |
| Total triglyceride (mg/dL) |
53.0 ± 6.0 (n = 3) n.s |
63.3 ± 1.9 (n = 3) n.s |
52.1 ± 5.3 (n = 7) |
53.0 ± 14.4 (n = 7) n.s |
76.3 ± 10.6 (n = 8) n.s |
| HDL cholesterol (mg/dL) |
60.0 ± 1.0 (n = 3) P < 0.001 |
51.9 ± 1.2 (n = 3) P < 0.001 |
95.9 ± 4.3 (n = 7) |
96.7 ± 6.0 (n = 7) n.s |
105.1 ± 6.0 (n = 8) n.s |
| LDL cholesterol (mg/dL) |
26.6 ± 1.3 (n = 3) P < 0.005 |
25.3 ± 1.2 (n = 3) P < 0.005 |
46.6 ± 3.0 (n = 7) |
46.0 ± 2.7 (n = 7) n.s |
45.8 ± 2.3 (n = 8) n.s |
Number of animals tested per group and P value vs Nx PBS group are presented.
Nx, Nephrectomized; HDL, High‐density lipoprotein; LDL, Low‐density lipoprotein.
Data are presented as mean ± SE.
3.2. Treatment with VB‐703 and VB‐201 protects against glomerular and podocyte damage
The major pathological feature of FSGS is the sclerotic damage caused to the glomeruli. At study termination, kidneys were collected, sectioned and PAS‐stained. Glomeruli fibrosis was evaluated by scoring and calculating the percentage of glomeruli with segmental sclerosis and global sclerosis. The area of the glomeruli was also measured, and the percentage of hypertrophied glomeruli was calculated. Damaged glomeruli included hypertrophied (at least ×1.5 normal area) and/or sclerotic glomeruli.
The data presented in Figure 3A shows that treatment with VB‐703 and VB‐201 significantly reduced the extent of damaged glomeruli. This was primarily due to the beneficial effect on glomeruli sclerosis, which decreased profoundly by 49% (P < 0.01) and 33% (P < 0.05), respectively (Figure 3B), and was supported by decreases in the corresponding glomeruli fibrotic scores by 54% (P < 0.05) and 31% (n.s), respectively (Table 6). In addition, moderate decreases in the extent of hypertrophied glomeruli by 35% (P < 0.05) and 25% (n.s), respectively, were observed as well (Table 6).
Figure 3.

Effect of VB‐703 and VB‐201 on (A) damaged glomeruli (%). *P < 0.05; **P < 0.01; ***P < 0.001 vs nephrectomized rats PBS‐treated, and on (B) glomerulosclerosis.*P < 0.05; **P < 0.01; ***P ≤ 0.001 vs PBS‐treated nephrectomized rats. Healthy rats (n = 3); sham‐operated rats (n = 3); PBS‐treated nephrectomized rats (n = 7); VB‐703‐treated nephrectomized rats (n = 7); and VB‐201‐treated nephrectomized rats (n = 8). Data are presented as mean ± SE (C) Representative PAS staining (×100). Arrows indicate glomerulosclerotic sites. Nx, nephrectomized
Table 6.
Effect of VB‐703 and VB‐201 on glomerular sclerosis, area and hypertrophy
| Parameter | Treatment | ||||
|---|---|---|---|---|---|
| Glomerular sclerosis | Healthy (n = 3) | Sham (n = 3) | Nx PBS (n = 7) | Nx VB‐703 (n = 7) | Nx VB‐201 (n = 8) |
| Segmental % |
1.00 ± 0.58a P ≤ 0.001 |
1.33 ± 0.88 P ≤ 0.001 |
40.87 ± 4.78 |
22.82 ± 2.80 P < 0.01 |
26.58 ± 4.44 P < 0.05 |
| Global % |
0.00 ± 0.00 n.s |
0.00 ± 0.00 n.s |
7.10 ± 4.44 |
1.87 ± 1.57 n.s |
5.43 ± 3.20 n.s |
| Global and segmental % |
1.00 ± 0.58 P ≤ 0.001 |
1.33 ± 0.88 P ≤ 0.001 |
47.96 ± 5.34 |
24.69 ± 3.73 P < 0.005 |
32.01 ± 4.97 P < 0.05 |
| Glomeruli fibrotic score |
0.013 ± 0.007 P = 0.01 |
0.013 ± 0.009 P = 0.01 |
0.914 ± 0.179 |
0.423 ± 0.098 P < 0.05 |
0.635 ± 0.152 n.s |
| Glomeruli area μm2 × 104 |
1.143 ± 0.003 P < 0.005 |
1.157 ± 0.020 P < 0.005 |
1.864 ± 0.111 |
1.614 ± 0.083 P = 0.097 |
1.669 ± 0.067 n.s |
| Hypertrophied glomeruli (×1.5 normal area) % |
3.7 ± 1.9 P < 0.005 |
3.7 ± 0.7 P < 0.005 |
52.1 ± 6.9 |
33.7 ± 5.9 P < 0.05 |
39.2 ± 4.1 n.s |
| Left kidney weight (g) |
1.517 ± 0.045 P < 0.05 |
1.593 ± 0.029 P < 0.05 |
2.047 ± 0.122 | 1.844 ± 0.112 |
1.475 ± 0.172 P < 0.05 |
Number of animals tested per group and P value vs Nx PBS group are presented.
Nx, Nephrectomized.
Data are presented as mean ± SE.
Figure 3C shows typical sclerotic changes in glomeruli. Normal cellularity, that is no proliferation of mesangial cells or epithelial cells, was demonstrated in the glomeruli from all test groups. In vehicle‐treated nephrectomized animals, glomeruli area increased over twofold (Figure 3C, panel iii) but only up to 1.5‐fold in animals treated with VB‐703 or VB‐201 (Figure 3C, panels iv and v) compared with healthy and sham‐operated animals (Figure 3C, panels i and ii). Segmental sclerosis, expressed by more than 50% fibrosis coverage (marked with arrows), was demonstrated in glomeruli from vehicle‐treated nephrectomized rats (Figure 3C panel iii) and was reduced by treatment with VB‐703 and VB‐201 (Figure 3C, panels iv and v). Podocytes are cells in Bowman's capsule of the kidneys that are crucial in the formation of the glomerula barrier. Any damage inflicted on these cells can result in the development of proteinuria and FSGS thereof.22 To assess the protective effect rendered by VB‐201 and VB‐703 on podocyte injury in nephrectomized rats, kidney sections were stained for WT1 and the number of podocytes was counted. The average number of podocytes counted in vehicle‐treated nephrectomized rats (46.381 ± 7.242) was reduced by ~50% (P < 0.01) compared with healthy (97.556 ± 16.627) and sham‐operated animals (88.667 ± 2.457). While VB‐201 did not protect podocytes from damage (43.958 ± 11.454), treatment with VB‐703 partially prevented podocyte injury (63.048 ± 9.722) (Figures 4A‐B).
Figure 4.

Effect of VB‐703 and VB‐201 on damaged podocytes. (A) Podocytes were stained for WT1, and their number/glomeruli was counted. Healthy rats (n = 3); sham‐operated rats (n = 3); PBS‐treated nephrectomized rats (n = 7); VB‐703‐treated nephrectomized rats (n = 7); and VB‐201‐treated nephrectomized rats (n = 8). **P < 0.01 vs nephrectomized rats PBS‐treated. Data are presented as mean ± SE (B) Representative WT1 staining (×200). Arrows indicate WT1+ podocytes. Nx, nephrectomized
3.3. Treatment with VB‐703 and VB‐201 reduces expression of pro‐fibrotic markers
We next sought to explore the effect of lecinoxoids on the expression level of pro‐fibrotic genes. Kidney RNA was extracted, and mRNA expression levels of collagen type IV α, FN, and transforming growth factor β (TGF‐β) were assessed using quantitative real‐time PCR. The mRNA expression of collagen IV increased seven‐ to eightfold (P < 0.05) in vehicle‐treated nephrectomized rats (7.5 ± 1.5) compared with healthy (1.1 ± 0.1) or sham‐operated animals (1.0 ± 0.3). Treatment withVB‐703 and VB‐201 significantly (P < 0.05) reduced collagen IV expression by 51% (3.7 ± 0.5) and by 42% (4.3 ± 0.3), respectively, compared with vehicle‐treated nephrectomized rats (Figure 5A).
Figure 5.
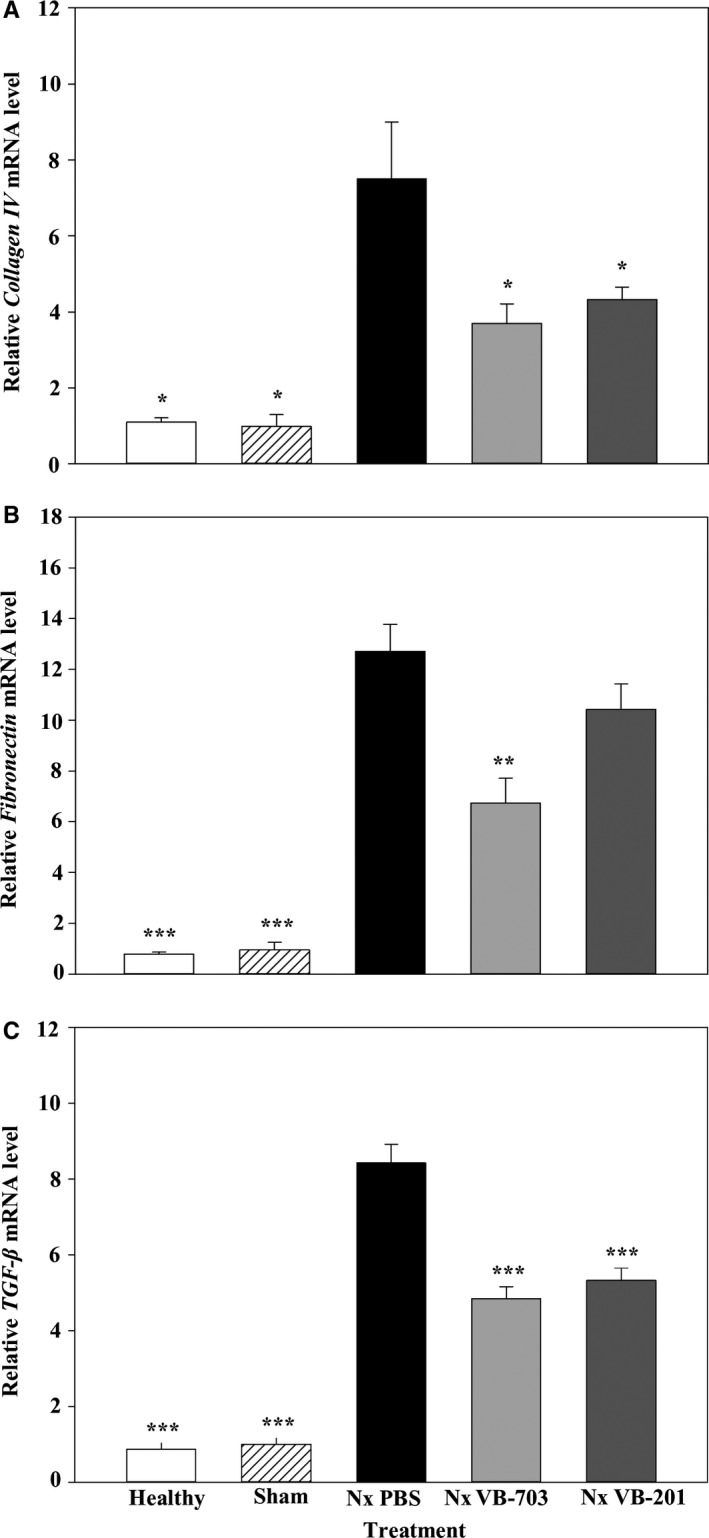
Effect of VB‐703 and VB‐201 on pro‐fibrotic markers. Relative expression of (A) collagen IV, (B) fibronectin and (C) TGF‐β in the kidney was evaluated at 8 wk in healthy rats (n = 3); sham‐operated rats (n = 3); PBS‐treated nephrectomized rats (n = 6‐7); VB‐703‐treated nephrectomized rats (n = 6‐7); and VB‐201‐treated nephrectomized rats (n = 7‐8). *P < 0.05; **P < 0.01; *** P < 0.001 vs PBS‐treated nephrectomized rats. Data are presented as mean ± SE. Nx, nephrectomized
The mRNA expression of fibronectin in vehicle‐treated nephrectomized rats (12.7 ± 1.0) increased 16‐ and 13‐fold (P < 0.001) compared with healthy (0.8 ± 0.1) and sham‐operated animals (1.0 ± 0.3), respectively. VB‐703 treatment significantly (P < 0.01) reduced fibronectin expression by 47% (6.7 ± 1.0), while treatment with VB‐201 had no significant effect on fibronectin expression (Figure 5B).
TGF‐β expression in vehicle‐treated nephrectomized rats (8.4 ± 0.5) increased 10‐ and eightfold (P < 0.001) compared with healthy (0.9 ± 0.2) and sham‐operated animals (1.0 ± 0.2), respectively. Treatment with VB‐703 and VB‐201 significantly (P < 0.001) reduced TGF‐β expression by 42% (4.8 ± 0.3) and 37% (5.3 ± 0.3), respectively (Figure 5C). We also examined the plasma level of cytokines associated with renal disease including TNF‐α, IL‐1β and MCP‐1. While TNF‐α and IL‐1β were under the detection level, we found a significant increase in MCP‐1 concentration in Nx PBS‐treated rats compared with healthy and sham rats. Yet, treatment with VB‐201 or VB‐703 reduced MCP‐1 plasma concentration only marginally (Table 7).
Table 7.
Effect of VB‐703 and VB‐201 on MCP‐1 concentration
| Treatment | Healthy | Sham | Nx PBS | Nx VB‐703 | Nx VB‐201 |
|---|---|---|---|---|---|
| Parameter | |||||
| MCP‐1 (pg/mL) |
409.9 ± 35.8a (n = 3) P < 0.05 |
376.6 ± 19.9 (n = 3) P < 0.01 |
541.2 ± 29.2 (n = 7) |
531.7 ± 33.1 (n = 7) n.s |
503.3 ± 35.1 (n = 8) n.s |
Nx, Nephrectomized.
Data are presented as mean ± SE.
3.4. VB‐703 and VB‐201 differentially regulate glomerular and interstitial monocyte/macrophage prevalence
Kidney fibrosis is associated with chronic interstitial inflammation. Since macrophage infiltration and proliferation contribute functionally to the inflammatory response and to the fibrotic process following injury, the number of interstitial and glomerular monocytes/macrophages was evaluated. To do so, formalin‐fixed kidneys were embedded in paraffin, sectioned and stained for CD68 as a marker for tissue macrophages. Prevalence of glomerular monocytes/macrophages in vehicle‐treated nephrectomized rats (3.669 ± 0.324) was 11‐ and fourfold higher (P < 0.001), compared with healthy (0.320 ± 0.040) and sham‐operated animals (0.880 ± 0.139), respectively. VB‐201 treatment significantly (P < 0.01) reduced the number of glomerular monocytes/macrophages by 42% (2.113 ± 0.374) compared with vehicle‐treated nephrectomized rats, while treatment with VB‐703 had no effect (n.s) on the number of glomerular monocytes/macrophages (3.937 ± 1.099) (Figure 6A‐B and Table 8). Figure 5B shows representative glomeruli (CD68+ staining). Glomeruli with no infiltration of CD68+ cells were demonstrated in kidney sections collected from healthy (Fig. 5Bi) and sham‐operated animals (Fig. 5B panel ii). CD68+ infiltration was observed in vehicle‐treated nephrectomized animals (Fig. 6B panel iii) and in VB‐703‐treated nephrectomized animals (Fig. 6B panel iv); however, in nephrectomized animals treated with VB‐201 (Fig. 6B panel v), infiltration of CD68 + cells was significantly reduced compared with vehicle‐treated nephrectomized animals.
Figure 6.
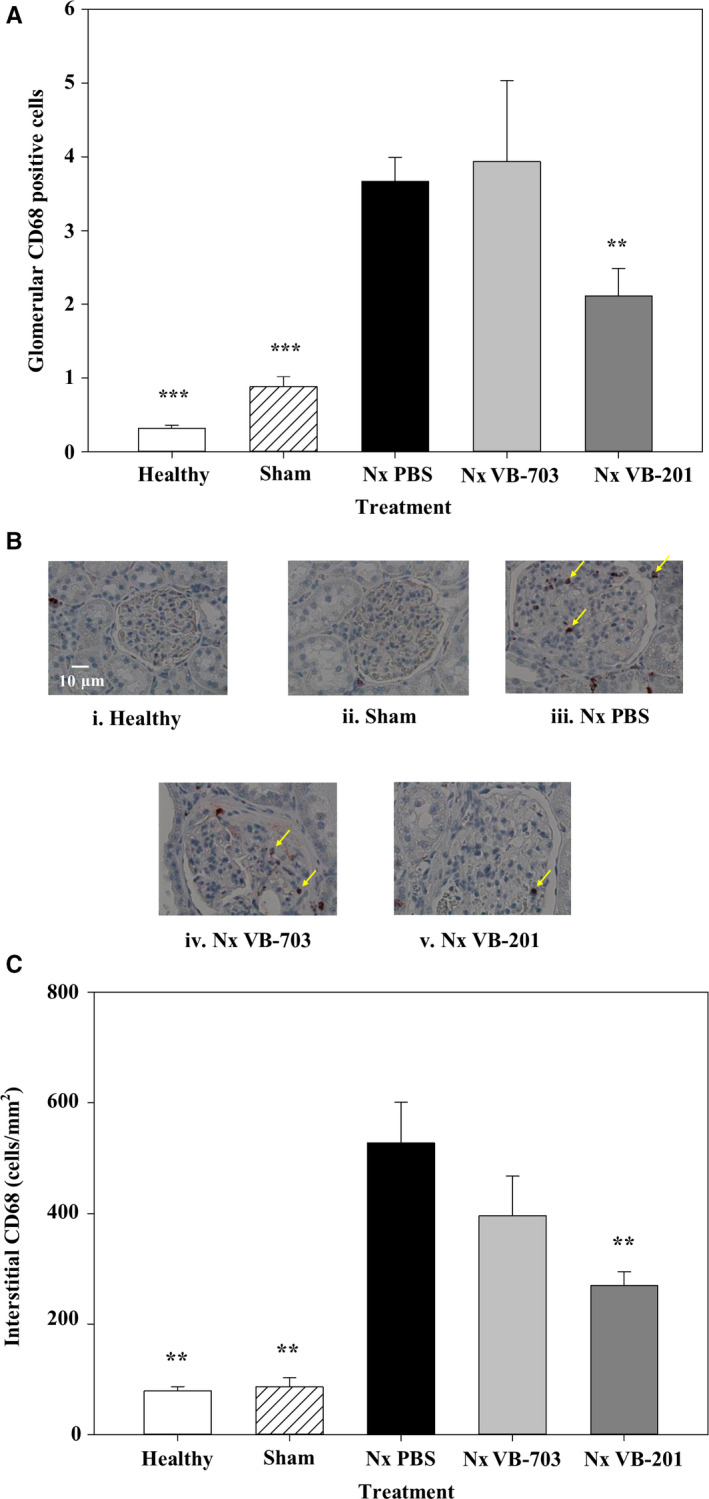
Effect of VB‐703 and VB‐201 on monocyte/macrophage cell infiltration in the glomeruli or the interstitium. CD68‐positive cells in the glomeruli (cells/glomeruli) (A‐B) and in the interstitium (magnification ×400) (cells/mm2) (C) were evaluated at 8 wk in healthy rats (n = 3); sham‐operated rats (n = 3); PBS‐treated nephrectomized rats (black) (n = 7); VB‐703‐treated nephrectomized rats (n = 7); and VB‐201‐treated nephrectomized rats (n = 8). **P < 0.01; ***P < 0.001 vs PBS‐treated nephrectomized rats. Data are presented as mean ± SE. Arrows indicate CD68+ macrophages. Nx, nephrectomized
Table 8.
Effect of VB‐703 and VB‐201 on glomerular and interstitial monocyte/macrophage incidence
| Treatment | Healthy (n = 3) | Sham (n = 3) | Nx PBS (n = 7) | Nx VB‐703 (n = 7) | Nx VB‐201 (n = 8) |
|---|---|---|---|---|---|
| ED‐1/CD68+ | |||||
| Interstitial cells/mm2 |
79.0 ± 7.77a P < 0.005 |
86.7 ± 16.18 P < 0.005 |
527.9 ± 72.93 |
395.7 ± 71.49 n.s |
269.3 ± 25.41 P < 0.005 |
| Glomerularcells/glomeruli |
0.320 ± 0.040 P < 0.001 |
0.880 ± 0.139 P < 0.001 |
3.669 ± 0.324 |
3.937 ± 1.099 n.s |
2.113 ± 0.374 P < 0.008 |
Number of animals tested per group and P value vs Nx PBS group are presented.
Nx, Nephrectomized.
Data are presented as mean ± SE.
The prevalence of interstitial monocytes/macrophages in vehicle‐treated nephrectomized rats (527.9 ± 72.93) was seven‐ and sixfold higher (P < 0.01) compared with healthy (79.0 ± 7.77) and sham‐operated animals (86.67 ± 16.18), respectively. VB‐201 treatment significantly (P < 0.01) reduced the number of interstitial monocytes/macrophages by 49% (269.25 ± 25.41). As expected, treatment with VB‐703 had no significant effect on prevalence of interstitial monocytes/macrophages (395.7 ± 71.49) (Fig. 6C and Table 8).
4. DISCUSSION
Renal fibrosis is the final stage of a temporal phase that underlies loss of function and progression of damage in chronic kidney disease. Although a substantial amount of knowledge on the mechanisms underlying renal fibrosis has been accumulated, it has scarcely been translated into clinically proven therapy. Such therapies that have been developed are mainly directed at the renin‐angiotensin‐aldosterone system and blood pressure regulation, which significantly increase life expectations but do not cure the disease. The process from injury to fibrosis can be divided into four phases: priming, activation, execution and progression,23 wherein the first phase involves activation and recruitment of innate immune cells. VB‐201 and VB‐703 are two oxidized phospholipids that differentially inhibit TLR‐2 and TLR‐4 signalling and monocyte migration. Whereas both lecinoxoids similarly inhibit TLR‐2‐mediated activation, VB‐703 exceeds VB‐201 in TLR‐4 inhibition but, unlike VB‐201, does not restrict monocyte migration. We therefore evaluated an approach according to which oxidized phospholipid small molecules are used to inhibit renal fibrosis.
Supposedly affecting the priming stage, we expected that features characteristic of the ensuing phases will be attenuated with lecinoxoids. To demonstrate the efficacy of lecinoxids in the different phases of fibrosis development and disease progression, the expression of TGF‐β, ECM components and kidney damage was evaluated. TGF‐β production, which could be assigned to the activation phase, plays a central role in the induction of ECM production.24, 25 Studies have shown that TGF‐β expression is increased in renal fibrosis 26, 27, 28 and that inhibiting TGF‐β‐driven activation will attenuate disease progression.29, 30 Treatment with VB‐201 or VB‐703 significantly inhibited TGF‐β in rat kidneys. Excessive accumulation of ECM components is part of the fibrotic processes in FSGS and is associated with glomeruli enlargement.31, 32 The effect of the lecinoxoids on the execution phase was then analysed by measuring the abundance of the ECM components. Treatment with either of the lecinoxoids reduced the expression level of collagen IV and FN. No systemic effect of lecinoxoids on inflammation mediator with detected levels, that is MCP‐1, could be demonstrated, possibly due to a therapeutic effect that does not primarily manifest by alteration in circulating inflammation mediators. Alternatively, other inflammation mediators not tested in this study might be pronouncly affected by lecinoxoid treatment. Studies on the systemic influence on a broader range of cytokine and chemokine concentrations following lecinoxoid treatment using the same model are currently underway. A pathological examination of rat kidneys demonstrated a significant reduction in the damaged glomeruli area, the region covered by scarred tissue, and to some extent decreased podocyte injury. Most important, assessment of renal function showed that VB‐703, and to a lesser extent VB‐201, reduced albumin/creatinine ratio, thus suggesting improved renal function. These results are in line with previous reports that demonstrated a role for TLR‐2 and TLR‐4 in renal fibrosis. In these studies, mice bearing a non‐functional TLR‐4 that were injected with folic acid developed less interstitial fibrosis compared with wild‐type mice.33 Wild‐type mice continuously infused with low‐dose angiotensin II for 4 weeks after 5/6 nephrectomy developed progressive CKD with albuminuria, increased serum levels of blood urea nitrogen and creatinine, glomerulosclerosis and interstitial fibrosis, whereas TLR‐4‐mutant mice were significantly protected from CKD progression.34, 35 Moreover, TLR‐2‐/‐ mice were protected against the development of diabetes nephropathy, exhibiting less albuminuria, inflammation, glomerular hypertrophy and reduced pro‐fibrotic gene expression compared with control mice.36, 37
Overall, VB‐703 out‐performed VB‐201, to various extents, in its effect on all tested parameters, with the exception of reducing the number of renal macrophages in the kidneys of diseased rats. Since both lecinoxoids similarly downregulate TLR‐2 activation, VB‐703's increased efficacy over VB‐201 in this model might be attributed to its superior inhibitory effect on TLR‐4 activation, suggesting a prominent role for TLR‐4 in renal fibrosis initiation.
With regard to monocyte migration, macrophages localize during renal injury to the glomeruli and the interstitium via interaction with several chemokines, thus contributing to the fibrotic process.38, 39, 40 Moreover, macrophages not only infiltrate the kidneys during glomerular and tubule‐interstitium damage, but can also undergo self‐proliferation and convert into ECM‐producing myofibroblasts.8, 39 Accordingly, it is conceivable that attenuation of macrophage infiltration can perturb the pro‐fibrotic effect of macrophages in FSGS. In agreement with our previous data according to which VB‐201 inhibited monocyte migration in vitro and in a peritonitis in vivo model, here VB‐201 significantly reduced interstitial and glomerular monocyte/macrophage prevalence. We therefore suggest that part of VB‐201's efficacy in renal FSGS may be ascribed to the restriction of monocyte/macrophage infiltration.
While impairing monocyte migration can indeed improve CKD, our data and data from other studies support a greater role for TLR‐2 and TLR‐4 in CKD pathogenesis. Taken together, the data demonstrate that treatment with orally available oxidized phospholipids, which target TLR‐2‐TLR‐4 and/or monocyte migration, directly affects the priming phase of renal fibrosis and is perturbing disease parthogenesis in this animal model. Such therapeutic approach may also translate to efficacy in treatment of CKD.
CONFLICT OF INTEREST
All authors, except Alexander Volkov, are employees and stock option holders of VBL Therapeutics.
Supporting information
Yacov N, Feldman B, Volkov A, Ishai E, Breitbart E, Mendel I. Treatment with lecinoxoids attenuates focal and segmental glomerulosclerosis development in nephrectomized rats. Basic Clin Pharmacol Toxicol. 2019;124:131–143. 10.1111/bcpt.13114
REFERENCES
- 1. Meran S, Steadman R. Fibroblasts and myofibroblasts in renal fibrosis. Int J Exp Pathol. 2011;92:158‐167. [DOI] [PMC free article] [PubMed] [Google Scholar]
- 2. Van Vliet A, Baelde HJ, Vleming LJ, de Heer E, Bruijn JA. Distribution of fibronectin isoforms in human renal disease. J Pathol. 2001;193:256‐262. [DOI] [PubMed] [Google Scholar]
- 3. van Vliet AI, van Alderwegen IE, Baelde HJ, de Heer E, Bruijn JA. Fibronectin accumulation in glomerulosclerotic lesions: self‐assembly sites and the heparin II binding domain. Kidney Int. 2002;61:481‐489. [DOI] [PubMed] [Google Scholar]
- 4. Lee HS. Pathogenic role of TGF‐beta in the progression of podocyte diseases. Histol Histopathol. 2011;26:107‐116. [DOI] [PubMed] [Google Scholar]
- 5. Silverstein DM. Inflammation in chronic kidney disease: role in the progression of renal and cardiovascular disease. Pediatr Nephrol. 2009;24:1445‐1452. [DOI] [PubMed] [Google Scholar]
- 6. Shankar A, Sun L, Klein BE, et al. Markers of inflammation predict the long‐term risk of developing chronic kidney disease: a population‐based cohort study. Kidney Int. 2011;80:1231‐1238. [DOI] [PMC free article] [PubMed] [Google Scholar]
- 7. Yang N, Isbel NM, Nikolic‐Paterson DJ, et al. Local macrophage proliferation in human glomerulonephritis. Kidney Int. 1998;54:143‐151. [DOI] [PubMed] [Google Scholar]
- 8. Nikolic‐Paterson DJ, Wang S, Lan HY. Macrophages promote renal fibrosis through direct and indirect mechanisms. Kidney Int Rep. 2014;4:34‐38. [DOI] [PMC free article] [PubMed] [Google Scholar]
- 9. Yang N, Wu LL, Nikolic‐Paterson DJ, et al. Local macrophage and myofibroblast proliferation in progressive renal injury in the rat remnant kidney. Nephrol Dial Transplant. 1998;13:1967‐1974. [DOI] [PubMed] [Google Scholar]
- 10. Akira S, Takeda K. Toll‐like receptor signalling. Nat Rev Immunol. 2004;4:499‐511. [DOI] [PubMed] [Google Scholar]
- 11. Gluba A, Banach M, Hannam S, Mikhailidis DP, Sakowicz A, Rysz J. The role of Toll‐like receptors in renal diseases. Nat Rev Nephrol. 2010;6:224‐235. [DOI] [PubMed] [Google Scholar]
- 12. Anders HJ, Banas B, Schlondorff D. Signaling danger: toll‐like receptors and their potential roles in kidney disease. J Am Soc Nephrol. 2004;15:854‐867. [DOI] [PubMed] [Google Scholar]
- 13. Banas MC, Banas B, Hudkins KL, et al. TLR4 links podocytes with the innate immune system to mediate glomerular injury. J Am Soc Nephrol. 2008;19:704‐713. [DOI] [PMC free article] [PubMed] [Google Scholar]
- 14. Gollapudi P, Yoon JW, Gollapudi S, Pahl MV, Vaziri ND. Leukocyte toll‐like receptor expression in end‐stage kidney disease. Am J Nephrol. 2010;31:247‐254. [DOI] [PubMed] [Google Scholar]
- 15. Yiu WH, Lin M, Tang SC. Toll‐like receptor activation: from renal inflammation to fibrosis. Kidney Int Rep. 2014;4:20‐25. [DOI] [PMC free article] [PubMed] [Google Scholar]
- 16. Mendel I, Feige E, Yacov N, et al. VB‐201, an oxidized phospholipid small molecule, inhibits CD14‐ and Toll‐like receptor‐2‐dependent innate cell activation and constrains atherosclerosis. Clin Exp Immunol. 2014;175:126‐137. [DOI] [PMC free article] [PubMed] [Google Scholar]
- 17. Feige E, Yacov N, Salem Y, et al. Inhibition of monocyte chemotaxis by VB‐201, a small molecule Lecinoxoid, hinders atherosclerosis development in ApoE(‐)/(‐) mice. Atherosclerosis. 2013;229:430‐439. [DOI] [PubMed] [Google Scholar]
- 18. Mendel I, Yacov N, Shoham A, Ishai E, Breitbart E. Treatment with Oxidized Phospholipids Directly Inhibits Nonalcoholic Steatohepatitis and Liver Fibrosis Without Affecting Steatosis. Dig Dis Sci. 2016;61:2545‐2553. [DOI] [PMC free article] [PubMed] [Google Scholar]
- 19. Raij L, Azar S, Keane W. Mesangial immune injury, hypertension, and progressive glomerular damage in Dahl rats. Kidney Int. 1984;26:137‐143. [DOI] [PubMed] [Google Scholar]
- 20. Mikolasevic I, Zutelija M, Mavrinac V, Orlic L. Dyslipidemia in patients with chronic kidney disease: etiology and management. Int J Nephrol Renovasc Dis. 2017;10:35‐45. [DOI] [PMC free article] [PubMed] [Google Scholar]
- 21. Muntner P, Coresh J, Smith JC, Eckfeldt J, Klag MJ. Plasma lipids and risk of developing renal dysfunction: the atherosclerosis risk in communities study. Kidney Int. 2000;58:293‐301. [DOI] [PubMed] [Google Scholar]
- 22. Schell C, Huber TB. New players in the pathogenesis of focal segmental glomerulosclerosis. Nephrol Dial Transplant. 2012;27:3406‐3412. [DOI] [PubMed] [Google Scholar]
- 23. Chuang PY, Menon MC, He JC. Molecular targets for treatment of kidney fibrosis. J Mol Med (Berl). 2013;91:549‐559. [DOI] [PMC free article] [PubMed] [Google Scholar]
- 24. Border WA, Okuda S, Languino LR, Ruoslahti E. Transforming growth factor‐beta regulates production of proteoglycans by mesangial cells. Kidney Int. 1990;37:689‐695. [DOI] [PubMed] [Google Scholar]
- 25. Wilson HM, Reid FJ, Brown PA, Power DA, Haites NE, Booth NA. Effect of transforming growth factor‐beta 1 on plasminogen activators and plasminogen activator inhibitor‐1 in renal glomerular cells. Exp Nephrol. 1993;1:343‐350. [PubMed] [Google Scholar]
- 26. Yamamoto T, Noble NA, Cohen AH, et al. Expression of transforming growth factor‐beta isoforms in human glomerular diseases. Kidney Int. 1996;49:461‐469. [DOI] [PubMed] [Google Scholar]
- 27. Bottinger EP, Bitzer M. TGF‐beta signaling in renal disease. J Am Soc Nephrol. 2002;13:2600‐2610. [DOI] [PubMed] [Google Scholar]
- 28. Murakami K, Takemura T, Hino S, Yoshioka K. Urinary transforming growth factor‐beta in patients with glomerular diseases. Pediatr Nephrol. 1997;11:334‐336. [DOI] [PubMed] [Google Scholar]
- 29. Border WA, Noble NA. Evidence that TGF‐beta should be a therapeutic target in diabetic nephropathy. Kidney Int. 1998;54:1390‐1391. [DOI] [PubMed] [Google Scholar]
- 30. Moon JA, Kim HT, Cho IS, Sheen YY, Kim DK. IN‐1130, a novel transforming growth factor‐beta type I receptor kinase (ALK5) inhibitor, suppresses renal fibrosis in obstructive nephropathy. Kidney Int. 2006;70:1234‐1243. [DOI] [PubMed] [Google Scholar]
- 31. Bergijk EC, Baelde HJ, De Heer E, Killen PD, Bruijn JA. Specific accumulation of exogenous fibronectin in experimental glomerulosclerosis. J Pathol. 1995;176:191‐199. [DOI] [PubMed] [Google Scholar]
- 32. Cai YI, Sich M, Beziau A, Kleppel MM, Gubler MC. Collagen distribution in focal and segmental glomerulosclerosis: an immunofluorescence and ultrastructural immunogold study. J Pathol. 1996;179:188‐196. [DOI] [PubMed] [Google Scholar]
- 33. Souza AC, Tsuji T, Baranova IN, et al. TLR4 mutant mice are protected from renal fibrosis and chronic kidney disease progression. Physiol Rep. 2015;3:pii: e12558. [DOI] [PMC free article] [PubMed] [Google Scholar]
- 34. Devaraj S, Tobias P, Jialal I. Knockout of toll‐like receptor‐4 attenuates the pro‐inflammatory state of diabetes. Cytokine. 2011;55:441‐445. [DOI] [PubMed] [Google Scholar]
- 35. Jialal I, Major AM, Devaraj S. Global Toll‐like receptor 4 knockout results in decreased renal inflammation, fibrosis and podocytopathy. J Diabetes Complications. 2014;28:755‐761. [DOI] [PubMed] [Google Scholar]
- 36. Devaraj S, Tobias P, Kasinath BS, Ramsamooj R, Afify A, Jialal I. Knockout of toll‐like receptor‐2 attenuates both the proinflammatory state of diabetes and incipient diabetic nephropathy. Arterioscler Thromb Vasc Biol. 2011;31:1796‐1804. [DOI] [PMC free article] [PubMed] [Google Scholar]
- 37. Ma J, Wu H, Zhao CY, Panchapakesan U, Pollock C, Chadban SJ. Requirement for TLR2 in the development of albuminuria, inflammation and fibrosis in experimental diabetic nephropathy. Int J Clin Exp Pathol. 2014;7:481‐495. [PMC free article] [PubMed] [Google Scholar]
- 38. Eardley KS, Kubal C, Zehnder D, et al. The role of capillary density, macrophage infiltration and interstitial scarring in the pathogenesis of human chronic kidney disease. Kidney Int. 2008;74:495‐504. [DOI] [PubMed] [Google Scholar]
- 39. Fujinaka H, Yamamoto T, Takeya M, et al. Suppression of anti‐glomerular basement membrane nephritis by administration of anti‐monocyte chemoattractant protein‐1 antibody in WKY rats. J Am Soc Nephrol. 1997;8:1174‐1178. [DOI] [PubMed] [Google Scholar]
- 40. Wu X, Dolecki GJ, Sherry B, Zagorski J, Lefkowith JB. Chemokines are expressed in a myeloid cell‐dependent fashion and mediate distinct functions in immune complex glomerulonephritis in rat. J Immunol. 1997;158:3917‐3924. [PubMed] [Google Scholar]
Associated Data
This section collects any data citations, data availability statements, or supplementary materials included in this article.
Supplementary Materials