

Summary
Myeloid‐derived suppressor cells (MDSCs) have been described as suppressors of T‐cell function in many malignancies. Impaired T‐cell responses have been observed in patients with chronic hepatitis C virus infection (CHC), which is reportedly associated with the establishment of persistent HCV infection. Therefore, we hypothesized that MDSCs also play a role in chronic HCV infection. MDSCs in the peripheral blood of 206 patients with CHC and 20 healthy donors were analyzed by flow cytometry. Peripheral blood mononuclear cells (PBMCs) of healthy donors cultured with hepatitis C virus core protein (HCVc) were stimulated with or without interleukin 10 (IL‐10). Compared to healthy donors and certain CHC patients with sustained viral response (SVR), CHC patients without SVR presented with a dramatic elevation of G‐MDSCs with the HLA‐DR−/lowCD33+CD14−CD11b+ phenotype in peripheral blood. The frequency of G‐MDSCs in CHC patients was positively correlated with serum HCVc, and G‐MDSCs were induced from healthy PBMCs by adding exogenous HCVc. Furthermore, we revealed a potential mechanism by which HCVc mediates G‐MDSC polarization; activation of ERK1/2 resulting in IL‐10 production and IL‐10‐activated STAT3 signalling. Finally, we confirmed that HCVc‐induced G‐MDSCs suppress the proliferation and production of IFN‐γ in autologous T‐cells. We also found that the frequency of G‐MDSCs in serum was associated with CHC prognosis. HCVc maintains immunosuppression by promoting IL‐10/STAT3‐dependent differentiation of G‐MDSCs from PBMCs, resulting in the impaired functioning of T‐cells. G‐MDSCs may thus be a promising biomarker for predicting prognosis of CHC patients.
Keywords: ERK, HCV‐RNA load, IFN‐γ production, sustained virological response, T‐cells
Abbreviations
- CHC
Chronic hepatitis C
- DBIL
direct bilirubin
- GM‐CSF
granulocyte‐macrophage colony‐stimulating factor
- G‐MDSCs
granulocytic myeloid‐derived suppressor cells
- HCV
hepatitis C virus
- HCVc
hepatitis C virus core protein
- IL‐10
interleukin 10
- MDSCs
Myeloid‐derived suppressor cells
- M‐MDSCs
monocytic myeloid‐derived suppressor cells
- NPV
negative predictive value
- PBMCs
Peripheral blood mononuclear cells
- PEG‐IFN
peg‐interferon
- PPV
positive predictive value
- RVR
ribavirin
- SD
standard deviation
- SFC/M
spot‐forming cells per million
- SVR
sustained viral response
- VEGF
vascular endothelial cell growth
- YI
Youden index
1. INTRODUCTION
Chronic hepatitis C (CHC) is a serious global health problem and more than 185 million individuals are estimated to be infected with the hepatitis C virus (HCV) globally.1 CHC is a potential cause of liver cirrhosis and hepatocellular carcinoma.2 Impairment of host immunity, especially the loss of HCV‐specific cellular immune response, may lead to chronic infection.3 HCV‐specific CD4+ and CD8+ T cells exhibit various degrees of functional impairment including impaired proliferation of T‐cells and reduced effector cytokine production.4 However, the precise mechanisms underlying HCV‐mediated T‐cell immune attenuation are not completely understood.
Myeloid‐derived suppressor cells (MDSCs) are a heterogeneous population of immature myeloid precursor cells and have been reported to play important roles in the development of microbial inflammation, infection, autoimmune disorders and cancer.5, 6 Furthermore, enhanced accumulation of MDSCs has been observed in mice with chronic but not acute infection with different strains of lymphocytic choriomeningitis virus.7 Vollbrecht et al8 reported that MDSCs inhibited T‐cell proliferation and were associated with disease progression in HIV‐1‐infected individuals. An increased frequency of MDSCs has also been described in the context of chronic hepatitis B virus infections, and these cells have been shown to suppress the antiviral activities of CD8+ T cells.9 HBV‐associated impairment of T‐cell activation is also correlated with the accumulation of MDSCs, which have been implicated in stimulating the hepatitis B surface antigen (Ag).9 Recent reports showed that HCV promotes MDSC accumulation, which facilitates and maintains the persistent HCV infection.10 A higher percentage of MDSCs, defined as CD33+HLA‐DR−/lowCD11b+, has been detected in the peripheral blood of CHC patients compared with that of healthy control subjects. These cells have been shown to suppress HCV‐specific CD8+ T cell responses.10 However, the mechanisms involved in the expansion of MDSCs in patients with CHC have not been identified.
HCV core protein (HCVc; 21 kDa) is secreted from HCV‐infected hepatocytes and is extracellularly present in the plasma of chronically infected patients.11 The extracellular core exerts an immunomodulatory role in human monocytes, macrophages and dendritic cells resulting in the inhibition of toll‐like receptor‐induced proinflammatory cytokine production including IFN‐α and IL‐10.12 Furthermore, HCVc activates a signal transducer that is critical for the development of regulatory APCs.10 Because the induction of HCVc‐specific T‐cell responses is inversely correlated with the serum HCVc concentration,13 we hypothesized that the high concentration of circulating HCVc found during HCV infection may facilitate the development of MDSCs and be responsible for the attenuation of HCV‐specific T‐cell responses, leading to HCV persistence.14 Therefore, this study aimed to examine the possible involvement and mechanism of HCVc in MDSC expansion and T‐cell suppression in patients with CHC.
2. MATERIAL AND METHODS
2.1. Ethics statement
Ethical approval was obtained from the Human Research Ethics Committee (the First Affiliated Hospital of Zhengzhou University, China). Written informed consent was obtained from all participants.
2.2. Statistical analysis
Statistical analysis was performed using the SPSS software (version 16.0; SPSS Inc., Chicago, IL, USA) and GraphPad Prism software (version 5.0; San Diego, CA, USA). Categorical data were expressed as numbers or proportions of subjects with the specific features. The chi‐square test or Fisher's exact probability test was used to compare categorical data. Normally distributed continuous variables were summarized as mean ± standard deviation (SD), and one‐way ANOVA was used to compare the difference between two groups. Continuous variables not normally distributed were summarized as medians and ranges, and the nonparametric Mann‐Whitney U test was used to compare the difference between two groups. The Kruskal‐Wallis H test was used for the comparison of differences among three or more groups and further comparisons between any two groups within these multiple groups were conducted using the Nemenyi method. Correlations between variables were calculated using the Spearman rank order correlation. All P values were two‐sided. P values < 0.05 were considered as statistically significant in all cases.
3. RESULTS
3.1. Correlations between myeloid‐derived suppressor cells and clinicopathological parameters
In total, 206 treatment‐naive CHC patients and 20 healthy donors were enrolled in this study. The complete study process is summarized in Figure S1. By the end of the study, 180 CHC patients were evaluable for analysis. The clinicopathological parameters of 180 CHC patients and 20 healthy donors are listed in Table S1. In this research, MDSCs were defined as HLA‐DR−/lowCD33+CD14−CD11b+CD15+ cells (G‐MDSCs) and HLA‐DR−/lowCD33+CD14+CD11b+ cells (M‐MDSCs) as reported by Cai et al15 (Figure 1A). After standard antiviral therapy, the frequency of G‐MDSCs in CHC patients without SVR (Non‐SVR; n = 53) was significantly higher than those in CHC patients with SVR (n = 127) and in healthy donors (n = 20; P < 0.05) (Figure 1B). However, there were no statistically significant differences in M‐MDSCs percentages among the three groups (P > 0.05) (Figure 1C). These results revealed that a higher percentage of G‐MDSCs may indicate a worse prognosis in CHC patients.
Figure 1.
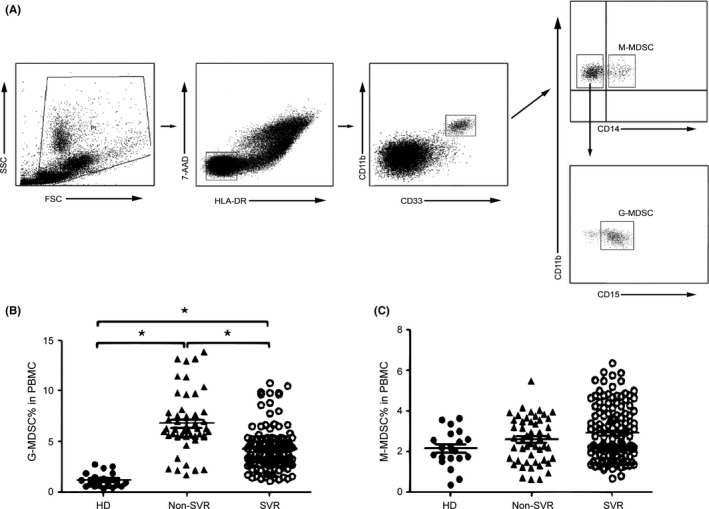
The percentages of myeloid‐derived suppressor cells (MDSCs) were increased in peripheral blood mononuclear cells (PBMCs). A, Representative dot plots; granulocytic myeloid‐derived suppressor cells (G‐MDSCs) were defined as HLA‐DR−/lowCD33+CD11b+CD14− populations; monocytic myeloid‐derived suppressor cells (M‐MDSCs) were defined as HLA‐DR−/lowCD33+CD11b+CD14+ populations; the values in the quadrants indicate the percentages of related subsets of cells. B, Pooled data indicating the percentages of G‐MDSCs in PBMCs from healthy donors (HD, n = 20), CHC patients without sustained virological response (Non‐SVR, n = 53) and CHC patients with SVR (SVR, n = 127). C, Pooled data indicating the percentages of M‐MDSCs in HC and CHC patients with non‐SVR and in CHC patients with SVR
HCV‐RNA, AST, ALT, LSM in the plasma, CD4+ and CD8+ T cell levels are clinical indicators of HCV infection. We therefore examined the associations between the clinical indicators and the frequency of MDSCs (Figure 2). In CHC patients, the percentage of G‐MDSCs was positively correlated with HCV‐RNA load, AST, ALT and LSM (P < 0.01) and was negatively correlated with the percentages of CD4+ T cells and CD8+ T cells (P < 0.01). However, M‐MDSC levels had no significant correlations with the above clinicopathological parameters (P > 0.05). The outcomes indicated that the accumulation of G‐MDSCs, not M‐MDSCs, indicates worse liver function and reduced frequencies of T‐cells and may contribute to chronic HCV infection.
Figure 2.
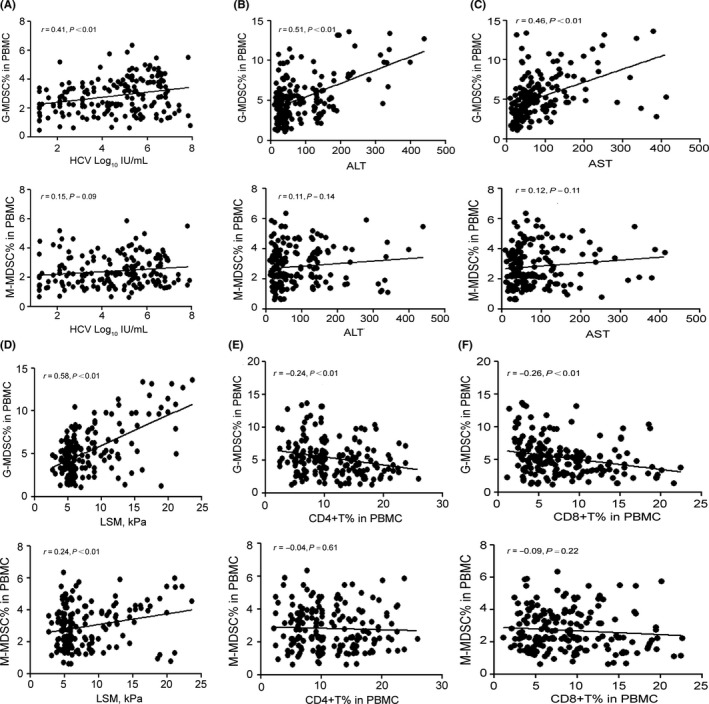
The correlation analysis between MDSCs and clinicopathological parameters of CHC patients. G‐MDSCs were positively correlated with HCV‐RNA (A), ALT (B), AST (C), and LSM (D) and were negatively correlated with CD4+ (E) and CD8+ T cells (F) in PBMCs. M‐MDSCs had no significant correlation with HCV‐RNA (A), ALT (B), AST (C), CD4+ (E) and CD8+ T cells (F) in PBMCs. M‐MDSCs only had a positive correlation with LSM (D). Correlations were evaluated by Spearman rank order correlation analysis
3.2. Myeloid‐derived suppressor cells inhibit T‐cell responses
Myeloid‐derived suppressor cells are known to suppress immune responses in a variety of ways in different kinds of malignancies.16, 17 We wanted to confirm whether MDSCs in the peripheral blood of CHC patients can suppress T‐cell function. PBMCs harvested from CHC patients (n = 12) with or without MDSC depletion (MDSCs were depleted by cell sorting using flow cytometry) were stimulated with anti‐CD3/CD28 antibodies and T‐cell proliferation was measured by CFSE (5, 6 carboxyfluorescein diacetate, succinimidyl ester) dilution after a 3‐day culture. We observed a consistent enhancement of both CD4+ and CD8+ T cell proliferation in response to stimulation after MDSCs depletion (Figure 3A‐B, P < 0.05). The suppressive effect of MDSCs on T‐cells was further confirmed in the MDSC‐T cell co‐culture system, and we found that purified G‐MDSCs from CHC patients efficiently inhibited the proliferation of both CD4+ and CD8+ T cells in a dose‐dependent manner (Figure 3C,D, P < 0.05). However, CHC‐derived M‐MDSCs had poor suppressive ability on T‐cell proliferation (Figure 3C,D). In addition, we found that G‐MDSCs from CHC patients effectively inhibited IFN‐γ production in CD4+ and CD8+ T cells from healthy donors by ELISpot analysis (Figure 4A‐B). Furthermore, we co‐cultured the G‐MDSCs with CD4+ and CD8+ T cells at the ratio of 2:1 and 4:1 respectively and monitored the proliferation and IFN‐γ production of the CD4+ and CD8+ T cells. The proliferation and IFN‐γ production of the CD4+ and CD8+ T cells were inhibited by G‐MDSC in a cell‐cell contact manner at a ratio of 2:1 and 4:1, respectively. In addition, little‐to‐no suppressive function was observed at the ratio of 2:1 in the manner of indirect co‐incubation, but the suppressive function of G‐MDSC was observed at the ratio of 4:1 (Figure 4C‐F). Our observations demonstrated that expansion of G‐MDSCs mainly contributes to T‐cell hyporesponsiveness in CHC patients.
Figure 3.
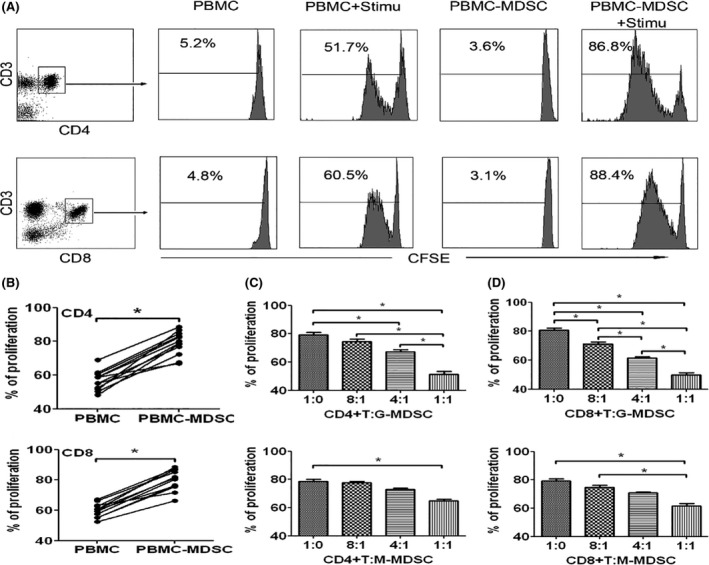
MDSCs could inhibit the proliferation of CD4+ and CD8+ T cells. A, PBMCs and MDSC‐depleted PBMCs (PBMC‐MDSC) from patients with non‐SVR were stimulated with anti‐CD3/CD28 antibodies, and the proliferation of CD4+ or CD8+ T cells was examined by CFSE labelling. Unstimulated PBMCs were used as negative controls. Results were obtained from four individuals. B, Statistical results of CD4+ or CD8+ T cell proliferation in PBMCs or PBMC‐MDSCs from 12 patients with non‐SVR. C‐D, CD4+ or CD8+ T cells from healthy donors were stimulated with anti‐CD3/CD28 antibodies, co‐cultured with MDSCs from patients with non‐SVR at different ratios for 3 d, and evaluated for T‐cell proliferation by CFSE labelling. Results were obtained from 10 paired individuals
Figure 4.
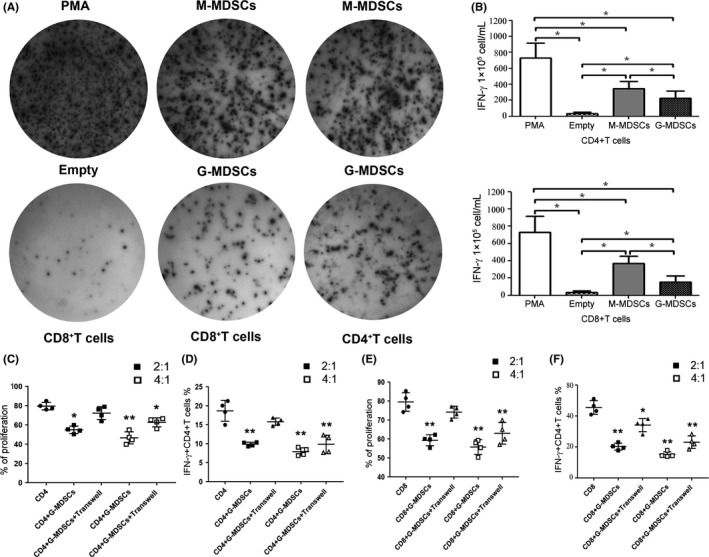
G‐MDSCs could inhibit interferon‐γ secretion of CD4+ and CD8+ T cells through cell‐cell contact. A, CD4+ and CD8+ T cells isolated from healthy donors were co‐cultured with M‐MDSCs or G‐MDSCs for 48 h in an ELISpot plate with serum‐free RPMI‐1640 and were then stimulated with PMA for 12 h. Responses are reported as spot‐forming cells per million (SFC/M). B, The results of five independent experiments showed a similar trend; the spot‐forming cells of five independent experiments were analyzed using GraphPad Prism 5. C‐F, Transwell experiments were performed in 24‐well plates. CD4+ or CD8+ T cells (5 × 10⁵) and MDSCs (1 × 10⁶ and 2 × 10⁶) were either co‐cultured directly or placed in Transwell chambers (Millicell, 0.4 μm; Millipore, Billerica, MA). After 48 h of co‐culture, CD4+ or CD8+ T cells were harvested for analysis of proliferation and IFN‐γ secretion (The ratio of MDSC to T‐cells is 4:1 and 2:1, respectively)
3.3. Hepatitis C virus core protein promotes the differentiation of granulocytic myeloid‐derived suppressor cells from PBMCs
To determine the effects of HCVc on the differentiation of MDSCs, PBMCs obtained from healthy donors were cultured with recombinant HCVc (Virogen, Watertown, MA), β‐galactosidase (β‐gal) (Virogen) or PEG‐IFN (Schering‐Plough, Madison, USA) for 7 days. The levels of HLA‐DR and CD14 on PBMCs cultured with HCVc were significantly decreased compared to those in PEG‐IFN‐treated or β‐gal‐treated control groups, but the level of CD11b in PBMCs cultured with HCVc was distinctly increased than those in the control groups (Figure 5A‐B). Moreover, expansion of G‐MDSCs by HCVc occurred in a time‐dependent manner (Figure 5B). We also found that the frequency of G‐MDSCs was distinctly changed during antiviral therapy, consistent with the level of serum HCVc (Figure 5C‐D). In addition, the frequency of G‐MDSCs in patients with SVR was significantly lower than that in patients without SVR during antiviral therapy (Figure 5E‐F). However, we did not observe similar findings in the frequency of M‐MDSCs in the above experiments (Figure 5A‐F). Taken together, our results suggest that the expansion of G‐MDSCs in CHC patients is induced by HCVc.
Figure 5.
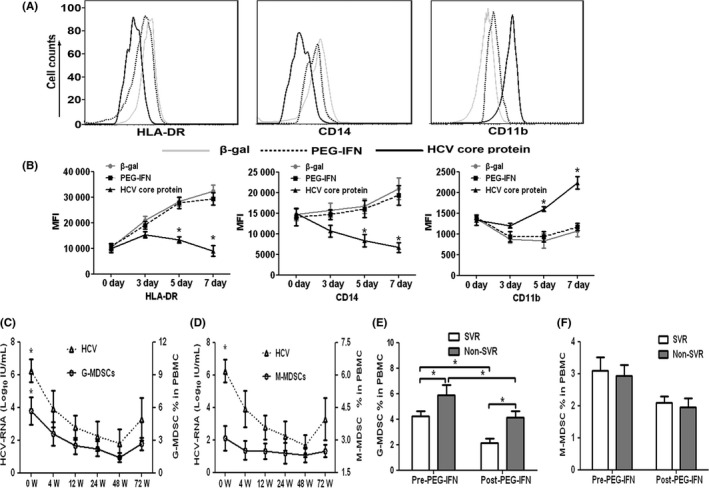
HCVc induced exploration of MDSCs from PBMCs. A, Representative histograms and B, mean fluorescence intensity (MFI) depicting HLA‐DR, CD14 and CD11b expression kinetics on day 0, 3, 5 and 7 of PBMCs of healthy donors (n = 10) cultured with or without HCVc (10 μg/mL). C, Percentages of G‐MDSCs or D, M‐MDSCs in CHC patients and the changes in these percentages with the serum HCV‐RNA loads during antiviral therapy with peg‐interferon and ribavirin (PEG‐IFN/RBV). E, Comparisons of G‐MDSC percentages in SVR and non‐SVR patients before and after antiviral therapy. F, Comparisons of M‐MDSC percentages in SVR and non‐SVR patients before and after antiviral therapy
3.4. Hepatitis C virus core protein‐mediated polarization of granulocytic myeloid‐derived suppressor cells is IL‐10 dependent
Cytokines have been shown to play a role in the expansion of MDSCs in a variety of cancers. We therefore examined the profile of cytokines produced in CHC patients and healthy donors by ELISA and qRT‐PCR. The levels of Arg‐1, COX‐2, iNOS and IL‐10 in CHC patients without SVR were significantly higher than those of CHC patients with SVR and healthy donors by ELISA and qRT‐PCR (Figure 6A‐B). We co‐cultured PBMCs from healthy donors with exogenous HCVc and observed a similar phenomenon as above (Figure 6C). Furthermore, the level of serum IL‐10 positively correlated with the percentage of G‐MDSCs in patients with CHC (Figure 6D). Cytokines including Arg‐1, COX‐2, iNOS and IL‐2 were confirmed to have no effect on the production of MDSCs.9 So, we speculated that the secretion of the cytokine IL‐10, which is induced by HCVc, might lead to the polarization of G‐MDSCs.
Figure 6.
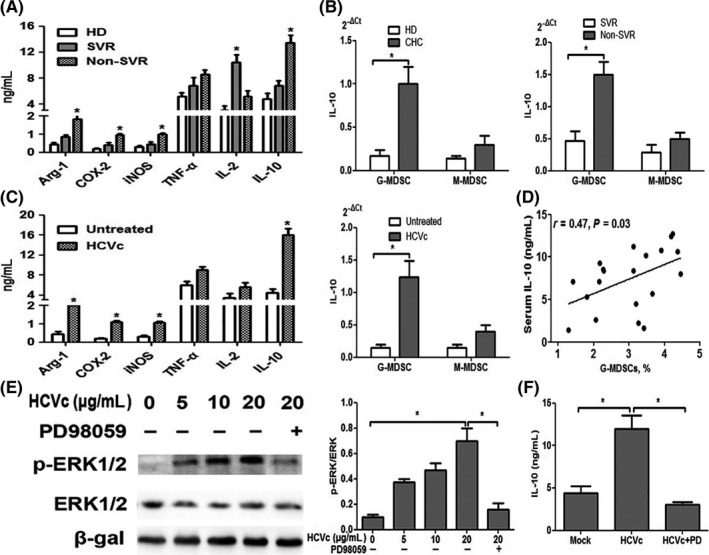
HCVc promotes the development of G‐MDSCs in an IL‐10‐dependent manner. A‐B, The levels of Arg‐1, COX‐2, iNOS and IL‐10 in CHC patients with non‐SVR were significantly higher than those in CHC patients with SVR and in healthy donors, by ELISA and qRT‐PCR. C, Similar results were obtained with PBMCs from healthy donors upon co‐culture with exogenous HCVc (10 μg/mL). D, The level of serum IL‐10 positively correlated with the percentage of G‐MDSCs in patients with CHC. E, ERK1/2 phosphorylation in PBMCs treated with HCVc or a combination of HCVc and PD98059 (PD), an ERK1/2‐specific inhibitor, for 30 min was evaluated by western blotting. Anti–β‐gal was used to ensure equal protein loading. E, Densitometric ratios from three independent experiments were analyzed using GraphPad Prism 5. F, Treatment of MDSCs with 25 mmol/L PD led to inhibition of HCVc‐induced IL‐10 production in the supernatant of PBMCs
To investigate the molecular mechanism of IL‐10 production in HCVc‐induced MDSCs, we examined ERK1/2 MAPK which has been shown to regulate the production of certain cytokines such as IL‐6 and IL‐10 in PBMCs.9, 18 We therefore evaluated the phosphorylation of ERK1/2. As shown in Figure 6E, stimulation of PBMCs with HCVc induced ERK1/2 phosphorylation in a dose‐dependent manner. Moreover, the ERK1/2‐specific inhibitor PD98059 completely inhibited the polarization of G‐MDSCs by HCVc (Figure 6E) and attenuated IL‐10 production to basal levels (Figure 6F). These results show that HCVc‐mediated activation of ERK1/2 plays a role in the production of IL‐10.
3.5. Hepatitis C virus core protein polarizes granulocytic myeloid‐derived suppressor cells from myeloid‐derived suppressor cells via IL‐10/STAT3 signalling
To further delineate the mechanism by which IL‐10 influences the differentiation of G‐MDSCs, we examined the induction of STAT3 activation in HCVc‐treated MDSCs. Stimulation with HCVc induced an increase in STAT3 phosphorylation and the addition of rhIL‐10 effectively improved STAT3 phosphorylation. The addition of S31‐201, which is an inhibitor of STAT3, significantly blocked the STAT3 phosphorylation facilitated by HCVc and rhIL‐10 (Figure 7A‐B), suggesting that STAT3 phosphorylation is mediated by HCVc‐induced IL‐10. Moreover, we observed that stimulation with HCVc induced an increase in Arg‐1, COX‐2 and iNOS, and the addition of rhIL‐10 significantly elevated Arg‐1, COX‐2 and iNOS, by using ELISA (Figure 7C). In addition, IL‐10 could upregulate the expression of p‐STAT3, and Arg‐1 in G‐MDSCs of CHC patients, and the STAT3‐specific inhibitor S31‐201,19 dramatically decreased the percentage of Arg1 in HCVc‐treated PBMCs (Figure 7D). In summary, these results suggest that the HCVc‐mediated development of G‐MDSCs depends on IL‐10/STAT3 signalling.
Figure 7.
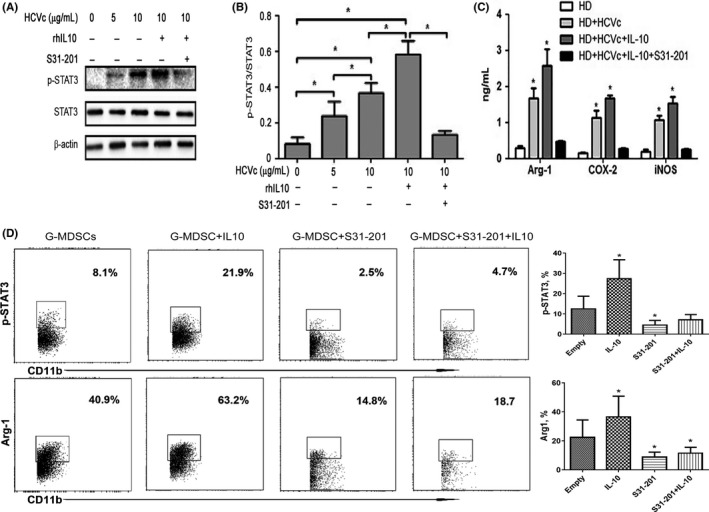
HCVc promotes the development of G‐MDSCs through ERK/IL‐6/STAT3 signalling. A, STAT3 phosphorylation in PBMCs treated with HCVc and/or rhIL‐10 for 30 min was evaluated by western blotting. Inhibition of STAT3 phosphorylation in MDSCs treated with S31‐201 was evaluated by western blotting. B, The results of three independent experiments showing a similar trend. C, Addition of rhIL‐10 improved the HCVc‐induced increase in Arg‐1, COX‐2 and iNOS. S31‐201 could inhibit the STAT3 phosphorylation stimulated by HCVc and rhIL‐10 and significantly decrease the levels of Arg‐1, COX‐2 and iNOS in the supernatant. D, IL‐10 elevated the expression of p‐STAT3, and Arg‐1 in G‐MDSCs of CHC patients, and their progression could be dramatically inhibited by S31‐201
3.6. Myeloid‐derived suppressor cells correlated with prognosis in chronic hepatitis C patients as an independent predictor
To screen the possible predictive factors of SVR, we analyzed the correlations between clinicopathological parameters and the outcomes of 180 CHC patients. Single variable logistic regression analysis revealed that the predictive factors of SVR included age, ALT, AST, ALB, serum HCV‐RNA, HCVc, HCV genotype, HLA‐A*02, LSM, RVR and G‐MDSCs (Table 1A). These significant variables were put into the multivariate logistic regression model to identify the independent predictive factors of SVR, and we found that G‐MDSCs were one of the independent predictors of SVR (Table 1B). Moreover, we evaluated the predictive precision of G‐MDSCs for SVR by ROC analysis. As shown in Table S2 and Figure S2, G‐MDSCs had the largest areas under the ROC curve (AUC = 0.88). Based on the cut‐offs, G‐MDSCs had higher sensitivity (87.4%), specificity (81.13%), Youden index (YI, 68.53%), positive predictive value (PPV, 91.74%) and negative predictive value (NPV, 72.88%) (Table S2A,B). These results suggested that circulatory G‐MDSCs may be a useful biomarker to enhance the predictive accuracy of SVR in CHC patients.
Table 1.
(A) The clinicopathological parameters of CHC patients were associated with the probability of SVR. (B) Analysis of possible predictors for SVR of HCV patients by using multiple variables binary logistic regression model
| Category | Sub‐category | n/N | SVR (%) | RR (CI 95%) | P value |
|---|---|---|---|---|---|
| (A) | |||||
| Sex | M | 54/74 | 72.97 | 1.06 (0.88‐1.28) | 0.62 |
| F | 73/106 | 68.87 | |||
| Age (y) | <50 | 83/107 | 77.57 | 1.29 (1.04‐1.59) | 0.02 |
| ≥50 | 44/73 | 60.27 | |||
| BMI (kg/m2) | <25 | 111/152 | 73.03 | 1.28 (0.91‐1.79) | 0.11 |
| ≥25 | 16/28 | 57.14 | |||
| ALT (U/L) | <100 | 95/124 | 76.61 | 1.34 (1.05‐1.72) | 0.01 |
| ≥100 | 32/56 | 57.14 | |||
| AST (U/L) | <100 | 100/133 | 75.19 | 1.31 (1.00‐1.71) | 0.03 |
| ≥100 | 27/47 | 57.45 | |||
| ALB (g/L) | <35 | 37/63 | 58.73 | 0.76 (0.61‐0.96) | 0.02 |
| ≥35 | 90/117 | 76.92 | |||
| HCV‐RNA (log10 IU/mL) | <5.70 | 71/88 | 80.68 | 1.33 (1.09‐1.61) | <0.01 |
| ≥5.70 | 56/92 | 60.87 | |||
| HCV genotypes | 1b | 68/112 | 60.71 | 0.70 (0.59‐0.83) | <0.01 |
| 2a | 59/68 | 86.76 | |||
| HLA‐A*02 | Positive | 70/89 | 78.65 | 1.26 (1.04‐1.52) | 0.02 |
| Negative | 57/91 | 62.64 | |||
| LSM (kPa) | <12.50 | 100/128 | 78.13 | 1.51 (1.14‐1.99) | <0.01 |
| ≥12.50 | 27/52 | 51.92 | |||
| PEG‐IFN | Alpha‐2a | 84/117 | 71.79 | 1.05 (0.86‐1.29) | 0.61 |
| Alpha‐2b | 43/63 | 68.25 | |||
| RVR | Yes | 64/76 | 84.21 | 1.39 (1.16‐1.67) | <0.01 |
| No | 63/104 | 60.58 | |||
| G‐MDSCs (%) | <5.38 | 105/121 | 86.78 | 2.33 (1.66‐3.26) | <0.01 |
| ≥5.38 | 22/59 | 37.29 | |||
| M‐MDSCs (%) | <2.73 | 78/106 | 73.58 | 1.11 (0.91‐1.36) | 0.32 |
| ≥2.73 | 49/74 | 66.22 | |||
| Variable | β | SE | P value | RR | CI 95% |
|---|---|---|---|---|---|
| (B) | |||||
| HCV genotype 2a | 2.35 | 0.57 | <0.01 | 5.68 | 3.75‐12.33 |
| G‐MDSCs < 5.38 | 1.71 | 0.32 | 0.01 | 2.67 | 1.62‐5.47 |
| RVR | 1.58 | 0.55 | 0.03 | 2.36 | 1.34‐8.48 |
4. DISCUSSION
Many studies have demonstrated that MDSCs are significantly increased in malignancies, autoimmune disease and viral infectious disease.20, 21 Khaled et al22 found that G‐MDSCs, but not M‐MDSCs, were significantly increased in circulation and showed increased tumour infiltration in pancreatic cancer patients. Recent reports have shown that the accumulation of MDSCs may facilitate and maintain persistent HCV infection.10 However, the mechanisms involved in the expansion of MDSCs in CHC patients have not been identified. In this study, we revealed a novel mechanism wherein HCVc‐mediated expansion of G‐MDSCs contributes to immune suppression in CHC patients. We demonstrated a new role of HCVc as an important player in promoting the polarization of MDSCs from PBMCs. Moreover, we revealed a potential mechanism by which HCVc mediates the expansion of G‐MDSCs via activation of ERK1/2 MAPK, resulting in IL‐10 production and IL‐10‐activated STAT3 signalling. We confirmed that HCVc induced G‐MDSCs similar to how the G‐MDSCs from CHC patients suppress autologous T‐cell proliferation and IFN‐γ production. We also found that the frequency of serum G‐MDSCs may be a promising biomarker to predict the prognosis of CHC patients.
Myeloid‐derived suppressor cells are a heterogeneous population of bone marrow‐derived myeloid progenitors and immature myeloid cells that have been prevented from fully differentiating from the progenitor stage under pathological conditions such as cancer, inflammatory diseases and autoimmune disorders.23, 24 In mice, MDSCs are identified as Gr1+ CD11b+ cells. Human MDSCs are less well characterized because no uniform markers are available.25 However, they usually express the common myeloid markers CD33 and CD11b but lack expression of markers for mature myeloid cells, such as HLA‐DR.26 Due to the heterogeneous nature of these cells, MDSCs can be further divided into two major subsets: M‐MDSCs and G‐MDSCs. For human MDSCs, the M‐MDSCs subset mainly express CD14, whereas the G‐MDSCs do not express CD14.26 Although the precise molecular mechanism for the differentiation of MDSCs is yet to be defined, the expansion and accumulation of these cells are known to be mediated by granulocyte‐macrophage colony‐stimulating factor (GM‐CSF), vascular endothelial cell growth (VEGF) and IL‐4.27, 28 In this study, we showed that the frequency of G‐MDSCs was positively correlated with the concentration of serum HCVc in patients with CHC, suggesting that circulating HCVc plays a role in the development of G‐MDSCs and may mediate immune suppression. In support of this finding, it has been demonstrated that the level of circulating HCVc is inversely correlated with the extent of HCV‐specific T‐cell immune responses in patients with CHC.29 Furthermore, our results show that exogenous HCVc also induces the development of G‐MDSCs in healthy PBMCs. A higher frequency of G‐MDSCs was associated with higher levels of HCVc in CHC patients without SVR than in CHC patients with SVR. Hence, high levels of HCVc in patients with CHC may drive the accumulation of G‐MDSCs. In this study, we demonstrate that high levels of circulating HCVc are required to induce the expansion of G‐MDSCs in CHC patients.
Early studies have shown that the frequency of MDSCs is correlated with clinicopathological parameters such as liver function; tumour stage; metastasis; and frequencies of T‐cells, Treg cells, and B cells in malignancies and autoimmune diseases.30 Cai et al15 found that the MDSC levels in peripheral blood have a positive correlation with plasma HCV‐RNA, AST, and DBIL (direct bilirubin) in CHC patients. Lu et al31 showed that MDSCs were positively correlated with ALB in CHB patients. In this study, we found that G‐MDSCs have positive correlations with HCV‐RNA, HCVc, ALT, CD4+T cells, CD8+T cells and LSM. Moreover, the change trend of G‐MDSCs was similar to HCVc in serum of CHC patients during antiviral therapy. The significant correlation between G‐MDSC and HCVc suggests that HCVc may drive G‐MDSC expansion, which is in line with a prior report.10 It is known that HCV infection can lead to inflammation in the liver and the secretion of inflammatory cytokines, which may result in damage to hepatocytes and the release of ALT in the blood.32 Chronic HCV infection activates Kupffer cells, macrophages and dendritic cells, and these lead to a dysfunction in the immune system which promotes hepatic fibrosis.33 In this study, we found that the frequency of G‐MDSCs is positively correlated with the levels of ALT and LSM which reflect liver injury, and these results were in agreement with the report conducted by Cai et al.14 A prior study found that the proliferation and IFN‐γ secretion of CD4+ and CD8+ T cells in the peripheral blood of CHC patients were inhibited by MDSCs.10 In this study, we found that the frequency of G‐MDSCs is negatively correlated with the circulatory CD4+ and CD8+ T cells in CHC patients. After depleting G‐MDSCs from the PBMCs of CHC patients, we found consistent enhancements in the proliferation and IFN‐γ production of CD4+ and CD8+ T cells. Moreover, we demonstrated that the suppressive function of G‐MDSCs on T‐cells requires cell‐cell contact. In contrast, we found that the frequency of M‐MDSCs was not correlated with the above clinicopathological parameters. These results indicated that the level of G‐MDSCs is closely correlated with persistent HCV infection and the immune tolerance of the liver and that therapy aimed at abrogating the expansion and functions of G‐MDSCs may be effective in ameliorating the immune response in patients with CHC.
Expansion of MDSCs has been associated with chronic inflammation and the production of the IL‐6, IL‐10, TNF‐α, and TGF‐β.34, 35, 36 In CHC patients, comparing the responses of immune activation, macrophages and dendritic cells can secrete IL‐6, IL‐10 and TNF‐α, which may inhibit optimal activation and function of the immune system; in addition, these cytokines can also induce G‐MDSC expansion.37 Several studies have reported that IL‐10 and other cytokines, such as IL28, IL12, were associated with chronic inflammation progression. IL‐10 exhibited high level in HCV positive patients,38, 39, 40 but it is unclear whether IL‐10 was associated with immunosuppression cells, such as MDSCs. In this study, we show that induction of autocrine IL‐10 by HCVc is required for driving G‐MDSCs polarization from PBMCs. We demonstrated that IL‐10 production was increased in the supernatants of HCVc‐polarized G‐MDSCs. Supplementation with exogenous IL‐10 efficiently promoted the expansion of G‐MDSCs in PBMCs of healthy donors. Our findings clearly show that HCVc induced the development of G‐MDSCs via IL‐10. In previous studies, signalling molecules, including ERK1/2, AKT, MEK, STAT3, IFN regulatory factor 8 and NF‐kB transcription factors, have been implicated in the regulation of MDSCs differentiation.41, 42, 43 We revealed that the HCVc‐activated ERK/MAPK pathway induces IL‐10 production and that inhibition of ERK phosphorylation blocks the development of G‐MDSCs. Binding of IL‐10 to its cognate receptor on MDSCs usually activates the transcription factor STAT3,31, 44 which has been implicated in MDSC‐mediated immune suppression. We showed that HCVc induced STAT3 phosphorylation in an IL‐10‐dependent manner, whereas inhibition of STAT3 phosphorylation blocked the HCVc‐induced differentiation of G‐MDSCs. In conclusion, our results show a complex mechanism involving a regulatory pathway and two independent signal transduction pathways essential for HCVc‐mediated polarization of G‐MDSCs.
Myeloid‐derived suppressor cells have been associated with disease progression, drug resistance, tumour recurrence, and metastasis.17 Many studies have found that expansion of MDSCs is correlated with reduced survival rate in patients with malignancy.45 Moreover, the prognostic significance of G‐MDSC accumulation has also been reported in melanoma,46 hepatocellular carcinoma,30 as well as non‐small lung cancer.47 However, the prognostic significance of MDSC accumulation in CHC patients treated with antiviral therapy has not been clear. In this study, we found that the frequency of G‐MDSCs was associated with negative prognosis in CHC patients treated with standard antiviral therapy. Accumulation of G‐MDSCs is one of the independent predictive factors of SVR in CHC patients. By using ROC analysis, we found that G‐MDSCs had higher areas under ROC curve, sensitivity, specificity, Youden index, PPV and NPV, and could effectively enhance the predictive accuracy of SVR in CHC patients. These results indicated that the frequency of circulatory G‐MDSCs may be a promising biomarker to predict the prognosis of CHC patients receiving standard antiviral therapy.
In conclusion, our study demonstrates that HCVc maintains HCV persistence and immunosuppression by promoting IL‐10/STAT3‐dependent differentiation of G‐MDSCs from PBMCs, resulting in impaired T‐cell function. We also suggest that G‐MDSCs may be a promising biomarker for predicting the prognosis of CHC patients.
CONFLICT OF INTEREST
The authors do not have any possible conflict of interests.
Supporting information
ACKNOWLEDGEMENTS
We thank the entire clinical staff of the Biotherapy Center for their great help in this study. In addition, we thank the staff of the Department of Infection Disease and the Department of Gastroenterology for their assiduous assistance in collecting blood samples and clinical data. Finally, we are grateful to all the participants and their families for their generous agreement to take part in this study.
Wang M, Ping Y, Li Z, et al. Polarization of granulocytic myeloid‐derived suppressor cells by hepatitis C core protein is mediated via IL‐10/STAT3 signalling. J Viral Hepat. 2019;26:246–257. 10.1111/jvh.13024
Funding information
The work was supported by grants from the National Natural Science Foundation of China (Grant no. 81271815) and Research Grant from the Ministry of Public Health (Grant no. 201501004).
Wang, Ping and Li contributed equally to this work.
REFERENCES
- 1. Zheng Z, Sze CW, Keng CT, et al. Hepatitis C virus mediated chronic inflammation and tumorigenesis in the humanised immune system and liver mouse model. PLoS ONE. 2017;12(9):e0184127. [DOI] [PMC free article] [PubMed] [Google Scholar]
- 2. Kanda T, Moriyama M. Direct‐acting antiviral agents against hepatitis C virus and lipid metabolism. World J Gastroenterol. 2017;23(31):5645‐5649. [DOI] [PMC free article] [PubMed] [Google Scholar]
- 3. Bertoletti A, Tan AT, Koh S. T‐cell therapy for chronic viral hepatitis. Cytotherapy. 2017;19(11):1317‐1324. [DOI] [PubMed] [Google Scholar]
- 4. Wieland D, Kemming J, Schuch A, et al. TCF1+ hepatitis C virus‐specific CD8+ T cells are maintained after cessation of chronic antigen stimulation. Nat Commun. 2017;8:15050. [DOI] [PMC free article] [PubMed] [Google Scholar]
- 5. Li J, Wang L, Chen X, et al. CD39/CD73 upregulation on myeloid‐derived suppressor cells via TGF‐beta‐mTOR‐HIF‐1 signaling in patients with non‐small cell lung cancer. Oncoimmunology. 2017;6(6):e1320011. [DOI] [PMC free article] [PubMed] [Google Scholar]
- 6. Zhang Y, Li L, Wang L, et al. Metformin‐induced reduction of CD39 and CD73 blocks myeloid‐derived suppressor cell activity in patients with ovarian cancer. Cancer Res. 2018;78(7):1779‐1791. [DOI] [PMC free article] [PubMed] [Google Scholar]
- 7. Norris BA, Uebelhoer LS, Nakaya HI, Price AA, Grakoui A, Pulendran B. Chronic but not acute virus infection induces sustained expansion of myeloid suppressor cell numbers that inhibit viral‐specific T cell immunity. Immunity. 2013;38(2):309‐321. [DOI] [PMC free article] [PubMed] [Google Scholar]
- 8. Vollbrecht T, Stirner R, Tufman A, et al. Chronic progressive HIV‐1 infection is associated with elevated levels of myeloid‐derived suppressor cells. AIDS. 2012;26(12):F31‐F37. [DOI] [PubMed] [Google Scholar]
- 9. Fang Z, Li J, Yu X, et al. Polarization of monocytic myeloid‐derived suppressor cells by hepatitis B surface antigen is mediated via ERK/IL‐6/STAT3 signaling feedback and restrains the activation of T cells in chronic hepatitis B virus infection. J Immunol. 2015;195(10):4873‐4883. [DOI] [PubMed] [Google Scholar]
- 10. Tacke RS, Lee HC, Goh C, et al. Myeloid suppressor cells induced by hepatitis C virus suppress T‐cell responses through the production of reactive oxygen species. Hepatology. 2012;55(2):343‐353. [DOI] [PMC free article] [PubMed] [Google Scholar]
- 11. Kanto T, Hayashi N, Takehara T, et al. Density analysis of hepatitis C virus particle population in the circulation of infected hosts: implications for virus neutralization or persistence. J Hepatol. 1995;22(4):440‐448. [DOI] [PubMed] [Google Scholar]
- 12. Dolganiuc A, Chang S, Kodys K, et al. Hepatitis C virus (HCV) core protein‐induced, monocyte‐mediated mechanisms of reduced IFN‐alpha and plasmacytoid dendritic cell loss in chronic HCV infection. J Immunol. 2006;177(10):6758‐6768. [DOI] [PubMed] [Google Scholar]
- 13. Samrat SK, Vedi S, Singh S, Li W, Kumar R, Agrawal B. Immunization with recombinant adenoviral vectors expressing HCV core or F proteins leads to T cells with reduced effector molecules granzyme b and ifn‐gamma: a potential new strategy for immune evasion in HCV infection. Viral Immunol. 2015;28(6):309‐324. [DOI] [PubMed] [Google Scholar]
- 14. Zeng QL, Yang B, Sun HQ, et al. Myeloid‐derived suppressor cells are associated with viral persistence and downregulation of TCR zeta chain expression on CD8(+) T cells in chronic hepatitis C patients. Mol Cells. 2014;37(1):66‐73. [DOI] [PMC free article] [PubMed] [Google Scholar]
- 15. Cai W, Qin A, Guo P, et al. Clinical significance and functional studies of myeloid‐derived suppressor cells in chronic hepatitis C patients. J Clin Immunol. 2013;33(4):798‐808. [DOI] [PubMed] [Google Scholar]
- 16. Orillion A, Hashimoto A, Damayanti N, et al. Entinostat neutralizes myeloid‐derived suppressor cells and enhances the antitumor effect of PD‐1 inhibition in murine models of lung and renal cell carcinoma. Clin Cancer Res. 2017;23(17):5187‐5201. [DOI] [PMC free article] [PubMed] [Google Scholar]
- 17. Chesney JA, Mitchell RA, Yaddanapudi K. Myeloid‐derived suppressor cells‐a new therapeutic target to overcome resistance to cancer immunotherapy. J Leukoc Biol. 2017;102(3):727‐740. [DOI] [PMC free article] [PubMed] [Google Scholar]
- 18. Kulkarni‐Almeida A, Shah M, Jadhav M, et al. A semi‐synthetic natural product blocks collagen induced arthritis by preferentially suppressing the production of IL‐6. Int Immunopharmacol. 2016;33:63‐69. [DOI] [PubMed] [Google Scholar]
- 19. Seo HS, Ku JM, Choi HS, et al. Apigenin induces caspase‐dependent apoptosis by inhibiting signal transducer and activator of transcription 3 signaling in HER2‐overexpressing SKBR3 breast cancer cells. Mol Med Rep. 2015;12(2):2977‐2984. [DOI] [PubMed] [Google Scholar]
- 20. Barnie PA, Zhang P, Lv H, et al. Myeloid‐derived suppressor cells and myeloid regulatory cells in cancer and autoimmune disorders. Exp Ther Med. 2017;13(2):378‐388. [DOI] [PMC free article] [PubMed] [Google Scholar]
- 21. Su L, Xu Q, Zhang P, Michalek SM, Katz J. Phenotype and function of myeloid‐derived suppressor cells induced by porphyromonas gingivalis infection. Infect Immun. 2017;85(8):e00213‐e00217. [DOI] [PMC free article] [PubMed] [Google Scholar]
- 22. Khaled YS, Ammori BJ, Elkord E. Increased levels of granulocytic myeloid‐derived suppressor cells in peripheral blood and tumour tissue of pancreatic cancer patients. J Immunol Res. 2014;2014:879897. [DOI] [PMC free article] [PubMed] [Google Scholar]
- 23. Lee CR, Kwak Y, Yang T, et al. Myeloid‐derived suppressor cells are controlled by regulatory T cells via TGF‐beta during murine colitis. Cell Rep. 2016;17(12):3219‐3232. [DOI] [PubMed] [Google Scholar]
- 24. Leiber A, Schwarz J, Kostlin N, et al. Neonatal myeloid derived suppressor cells show reduced apoptosis and immunosuppressive activity upon infection with Escherichia coli . Eur J Immunol. 2017;47(6):1009‐1021. [DOI] [PubMed] [Google Scholar]
- 25. Peranzoni E, Zilio S, Marigo I, et al. Myeloid‐derived suppressor cell heterogeneity and subset definition. Curr Opin Immunol. 2010;22(2):238‐244. [DOI] [PubMed] [Google Scholar]
- 26. Greten TF, Manns MP, Korangy F. Myeloid derived suppressor cells in human diseases. Int Immunopharmacol. 2011;11(7):802‐807. [DOI] [PMC free article] [PubMed] [Google Scholar]
- 27. Horikawa N, Abiko K, Matsumura N, et al. Expression of vascular endothelial growth factor in ovarian cancer inhibits tumor immunity through the accumulation of myeloid‐derived suppressor cells. Clin Cancer Res. 2017;23(2):587‐599. [DOI] [PubMed] [Google Scholar]
- 28. Ma N, Liu Q, Hou L, Wang Y, Liu Z. MDSCs are involved in the protumorigenic potentials of GM‐CSF in colitis‐associated cancer. Int J Immunopathol Pharmacol. 2017;30(2):152‐162. [DOI] [PMC free article] [PubMed] [Google Scholar]
- 29. Ortiz ML, Lu L, Ramachandran I, Gabrilovich DI. Myeloid‐derived suppressor cells in the development of lung cancer. Cancer Immunol Res. 2014;2(1):50‐58. [DOI] [PMC free article] [PubMed] [Google Scholar]
- 30. Crook KR, Jin M, Weeks MF, et al. Myeloid‐derived suppressor cells regulate T cell and B cell responses during autoimmune disease. J Leukoc Biol. 2015;97(3):573‐582. [DOI] [PMC free article] [PubMed] [Google Scholar]
- 31. Draghiciu O, Lubbers J, Nijman HW, Daemen T. Myeloid derived suppressor cells‐An overview of combat strategies to increase immunotherapy efficacy. Oncoimmunology. 2015;4(1):e954829. [DOI] [PMC free article] [PubMed] [Google Scholar]
- 32. Cento V, Nguyen THT, Di Carlo D, et al. Improvement of ALT decay kinetics by all‐oral HCV treatment: role of NS5A inhibitors and differences with IFN‐based regimens. PLoS ONE. 2017;12(5):e0177352. [DOI] [PMC free article] [PubMed] [Google Scholar]
- 33. Hashemi F, Fathi Ashtiani A, Mirminachi B, et al. Impact of hepatitis C virus infection on cognitive function in patients with covert hepatic encephalopathy. Hepat Mon. 2015;15(7):e30507. [DOI] [PMC free article] [PubMed] [Google Scholar]
- 34. Karakasheva TA, Waldron TJ, Eruslanov E, et al. CD38‐expressing myeloid‐derived suppressor cells promote tumor growth in a murine model of esophageal cancer. Cancer Res. 2015;75(19):4074‐4085. [DOI] [PMC free article] [PubMed] [Google Scholar]
- 35. Pang X, Song H, Zhang Q, Tu Z, Niu J. Hepatitis C virus regulates the production of monocytic myeloid‐derived suppressor cells from peripheral blood mononuclear cells through PI3K pathway and autocrine signaling. Clin Immunol. 2016;164:57‐64. [DOI] [PubMed] [Google Scholar]
- 36. Sato Y, Shimizu K, Shinga J, et al. Characterization of the myeloid‐derived suppressor cell subset regulated by NK cells in malignant lymphoma. Oncoimmunology. 2015;4(3):e995541. [DOI] [PMC free article] [PubMed] [Google Scholar]
- 37. Eggert T, Medina‐Echeverz J, Kapanadze T, Kruhlak MJ, Korangy F, Greten TF. Tumor induced hepatic myeloid derived suppressor cells can cause moderate liver damage. PLoS ONE. 2014;9(11):e112717. [DOI] [PMC free article] [PubMed] [Google Scholar]
- 38. El‐Emshaty HM, Nasif WA, Mohamed IE. Serum cytokine of IL‐10 and IL‐12 in chronic liver disease: the immune and inflammatory response. Dis Markers. 2015;2015:707254. [DOI] [PMC free article] [PubMed] [Google Scholar]
- 39. Naeemi H, Aslam R, Raza SM, et al. Distribution of IL28B and IL10 polymorphisms as genetic predictors of treatment response in Pakistani HCV genotype 3 patients. Adv Virol. 2018;163(4):997‐1008. [DOI] [PubMed] [Google Scholar]
- 40. Sghaier I, Mouelhi L, Rabia NA, Ghazoueni E, Almawi WY, Loueslati BY. IL‐10 and IL‐28B gene variants as predictors of sustained response to peginterferon and ribavirin therapy in chronic HCV infection. Cytokine. 2017; pii: S1043‐4666(17)30073‐X. 10.1016/j.cyto.2017.03.007 [DOI] [PubMed] [Google Scholar]
- 41. Abhishek KS, Chakravarti A, Baveja CP, Kumar N, Siddiqui O, Kumar S. Association of interleukin‐2, ‐4 and ‐10 with dengue severity. Indian J Pathol Microbiol. 2017;60(1):66‐69. [DOI] [PubMed] [Google Scholar]
- 42. Beury DW, Parker KH, Nyandjo M, Sinha P, Carter KA, Ostrand‐Rosenberg S. Cross‐talk among myeloid‐derived suppressor cells, macrophages, and tumor cells impacts the inflammatory milieu of solid tumors. J Leukoc Biol. 2014;96(6):1109‐1118. [DOI] [PMC free article] [PubMed] [Google Scholar]
- 43. Paschall AV, Zhang R, Qi CF, et al. IFN regulatory factor 8 represses GM‐CSF expression in T cells to affect myeloid cell lineage differentiation. J Immunol. 2015;194(5):2369‐2379. [DOI] [PMC free article] [PubMed] [Google Scholar]
- 44. Pinton L, Solito S, Damuzzo V, et al. Activated T cells sustain myeloid‐derived suppressor cell‐mediated immune suppression. Oncotarget. 2016;7(2):1168‐1184. [DOI] [PMC free article] [PubMed] [Google Scholar]
- 45. Aravindaram K, Wang PH, Yin SY, Yang NS. Tumor‐associated antigen/IL‐21‐transduced dendritic cell vaccines enhance immunity and inhibit immunosuppressive cells in metastatic melanoma. Gene Ther. 2014;21(5):457‐467. [DOI] [PubMed] [Google Scholar]
- 46. Chevolet I, Speeckaert R, Schreuer M, et al. Clinical significance of plasmacytoid dendritic cells and myeloid‐derived suppressor cells in melanoma. J Transl Med. 2015;13:9. [DOI] [PMC free article] [PubMed] [Google Scholar]
- 47. Vetsika EK, Koinis F, Gioulbasani M, et al. A circulating subpopulation of monocytic myeloid‐derived suppressor cells as an independent prognostic/predictive factor in untreated non‐small lung cancer patients. J Immunol Res. 2014;2014:659294. [DOI] [PMC free article] [PubMed] [Google Scholar]
Associated Data
This section collects any data citations, data availability statements, or supplementary materials included in this article.
Supplementary Materials