

Abstract
Background and Objectives
More insight into donor health and behaviour may contribute to more efficient and focused strategies regarding donor care and management. Donor InSight (DIS) is a Dutch cohort study of blood and plasma donors. We aimed to outline the objectives and methods of DIS, describe the cohort, and compare it to the active Dutch donor population.
Materials and Methods
In 2007‐2009 (DIS‐I, n = 31 338) and 2012‐2013 (DIS‐II, 34 826, of whom 22 132 also participated in DIS‐I) questionnaire data on demographics, donation, lifestyle, family composition, health and disease were collected. A second follow‐up (DIS‐III, n = 3046), including donors with differing haemoglobin trajectories, was completed in 2015‐2016. DIS‐III includes data on genetic determinants, iron and red cell indices. Representativeness of the DIS‐I sample for the entire Dutch donor population was assessed by comparing characteristics of both.
Results
Donor InSight was initially set up because of a need for more detailed information and evidence as a basis for decision‐making in blood banks. DIS‐I sample is comparable to the total Dutch donor population in terms of age, body mass index, haemoglobin level, blood pressure, blood type and donation behaviour.
Conclusion
Donor InSight is a cohort study representative of the Dutch donor population. It provides evidence to support evidence‐based decision making.
Keywords: blood donors, demographics, donor health, epidemiology, lifestyle
Introduction
Blood donor research is an expanding field in which experts in epidemiology, medicine, psychology and sociology collaborate to safeguard a sufficient and safe blood supply 1, 2, 3, 4. Despite recent decreases in the use of blood products, forecasts of increasing blood demands with concomitantly decreasing numbers of donors due to an ageing population stress the need to investigate donor behaviour and health 5. Greater insight into donor health and donor behaviour could contribute to a more efficient and focused strategy regarding donor care and management and further ensure sufficient blood supply.
It is crucial that a donor pool is stable, healthy, diverse and large enough to ensure availability of all needed blood products. All blood donors are screened prior to each donation, in order to estimate whether a donor (1) can cope with the blood (components) loss associated with donation and (2) can donate blood of adequate quality 6, 7. Two understudied aspects of blood donation are its health effects and donor behaviour. With every donation, fluids and substances like iron, proteins and blood cells are lost and these need to be replaced to maintain homeostasis. A recent study has shown that these replacements can take more time than the widely accepted minimum donation interval of 56 days for whole blood donations 8. Although blood donation is generally considered to be safe, observations of vasovagal reactions, needle reactions, and fatigue have been reported 9, 10. Knowledge of health effects and recovery from donation is needed to make sure that donors can safely continue to donate.
The cohort study ‘Donor InSight’ (DIS) was set up to gain insight into the characteristics and motivation of blood and plasma donors in the Netherlands, and into the health effects of blood donation 11. Knowledge of both health and behavioural effects of donation contributes to keeping donors healthy and reducing the number of deferred and lapsed donors. The aim of this study is to outline the objectives and methods of DIS, describe the cohort, and compare it to the active Dutch donor population.
Materials and methods
Dutch donor population
In 2009, the Dutch donor population consisted of 404 184 registered voluntary non‐remunerated donors aged 18–70 years. Sanquin is the only organisation in the Netherlands authorised to collect and supply blood products. New donors are registered in the blood bank information system (ePROGESA, MAK‐SYSTEM International Group, Paris, France), after which donors are invited for an initial eligibility test and blood is drawn for screening and blood typing purposes. Donors must meet several criteria to be eligible to donate 12. Certain health conditions and high‐risk behaviours can lead to temporary or permanent deferral from donation. From their registration in the system, all donors are continuously registered as ‘active’, except when they are deferred or deregistered. Deregistration either takes place upon the donor's request, or after repeated unsuccessful attempts to contact a donor.
Donor InSight
Donor InSight was initially set up because of a need for more detailed information and evidence as a basis for decision‐making in blood banks. The first round of DIS, DIS‐I, was initiated to set up a representative cohort of the Dutch donor population regarding donor characteristics, donor motivations and health effects of blood donation. At the second round, DIS‐II, the cohort was turned into a dynamic cohort to ensure that new donors would also be represented, by complementing the DIS‐I sample with new randomly selected donors. The most recent round, DIS‐III, aimed specifically to investigate associations of lifestyle behaviours and genetic factors with blood parameters, thereby making use of the data collected in DIS‐I and ‐II.
Donor InSight‐I
Objectives of DIS‐I were to (1) study donor characteristics and differences between new and regular donors; whole blood and plasma donors; and regional differences, (2) identify motivations and barriers of donation among new and current donors and non‐return reasons, and in addition whether these are related to donor characteristics, (3) determine main reasons of temporary and permanent donor deferral and its relation to future donor show behaviour, (4) investigate the effects of different strategies to increase donor show behaviour and (5) study features of the healthy donor effect.
Between April 2007 and April 2009 50 000 ‘active’ donors were invited to participate in DIS‐I (Fig. 1). Each month except for July and December a random sample of approximately 2000 ‘active’ donors was selected. An invitation letter with an information brochure, a reply card and a paper‐and‐pencil questionnaire were sent by mail. After 3 weeks, all non‐responders (n = 22 334) received a reminder. Of all 50 000 donors 5210 (10%) replied that they could not or would not participate, mainly because they were not interested, faced time constraints or had concerns based on principles. No response was obtained from 13 452 (27%) donors. Non‐responders were more often male (52% vs. 47%) and had donated less often (median number of donations 19 vs. 24). In total, 31 338 (63%) participants returned completed questionnaires.
Figure 1.
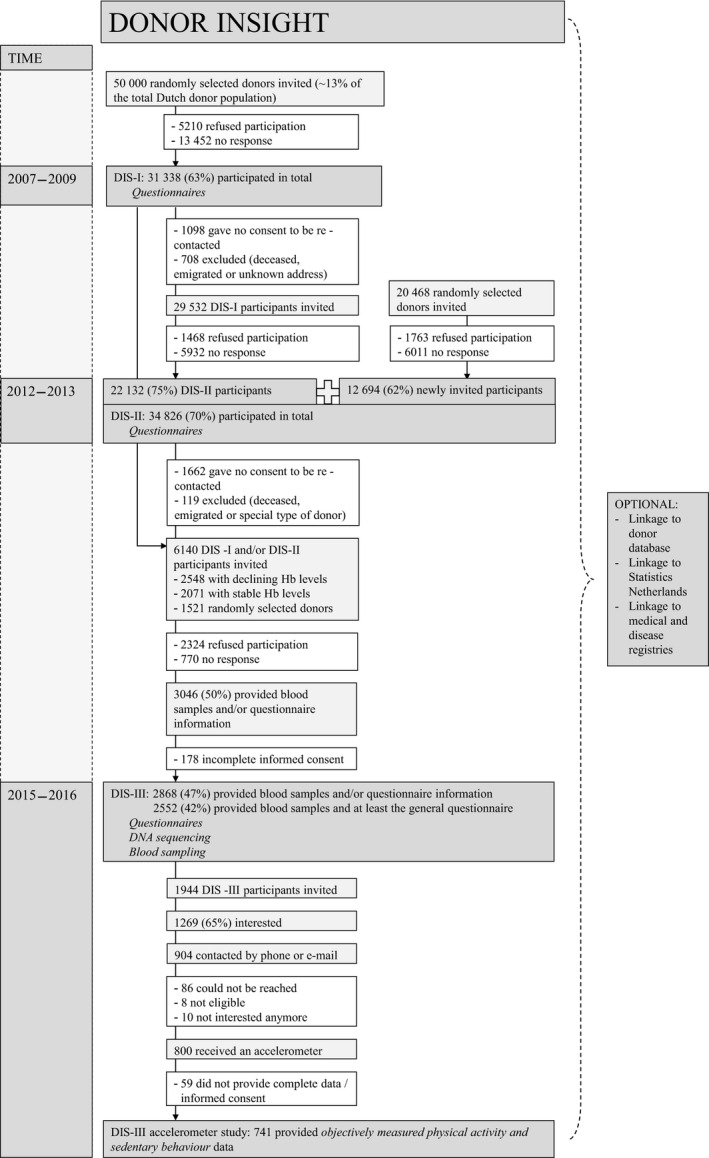
Donor InSight flowchart.
Donor InSight‐II
For DIS‐II objectives from DIS‐I were extended with the aims to (1) investigate strategies to increase and factors that influence donor retention, (2) study health effects of donations and (3) study lifestyle and donor show behaviours.
Between 2012 and 2013 all still eligible 29 532 DIS‐I participants were invited for DIS‐II. DIS‐I donors were considered eligible if they gave consent for participation in future studies, had donated at least once since registration as donor, were not deceased and had not moved to an untraceable address. Of the DIS‐I donors invited, 22 132 (75%) participated in DIS‐II. A new random sample of 20 468 active donors was also invited for DIS‐II, of whom 12 694 (62%) participated. Reminders were sent to all initial non‐responders (n = 21 178). Of all 50 000 donors invited for DIS‐II, 3231 donors replied that they could not or would not participate. In total, 34 826 (70%) participants completed the DIS‐II questionnaire (Fig. 1).
Donor InSight‐III
The objectives of DIS‐III were to (1) investigate genetic and lifestyle behaviour determinants in relation to declining vs. stable Hb levels and donation‐related iron deficiency, (2) assess whether identified genetic factors can improve the performance of previously developed prediction models, (3) study genetic determinants of iron metabolism in relation to their iron status and red blood cell indices and (4) investigate associations of Hb trajectories and iron deficiency with several health symptoms in whole blood donors.
Between April 2015 and December 2016 6140 DIS‐I and/or DIS‐II participants were invited to participate in DIS‐III. DIS participants of whom the Hb level of their first donor screening was known were considered eligible. Three groups of DIS participants were invited. A group of donors with stable (n = 2071) and a group with declining (n = 2548) Hb levels were distinguished by fitting growth mixture models on Hb measurements 13. These models were fitted on whole blood donors who registered between January 1, 2005 and December 31, 2012 and had at least one visit after the first donation. A third group was randomly selected (n = 1521) from DIS‐I and/or DIS‐II participants. An invitation letter with information brochure including a link to online questionnaires, and a pictorial blood loss assessment chart (PBAC) for women only 14 were sent by mail. After 2 weeks, all non‐responders (n = 4530) received a reminder. Starting from 2 weeks after the reminder, remaining non‐responders (n = 3652) were contacted by phone with a maximum of three attempts. Non‐responders of whom e‐mail addresses were known also received a reminder by e‐mail (n = 1331). Of all 6140 donors invited for DIS‐III, 2324 donors replied that they could or would not participate, mainly because of health reasons and time constraints. A total of 770 donors could not be reached. In total 3046 (50%) participants provided blood samples and/or questionnaire information for DIS‐III of whom 2868 (47%) participants provided informed consent. In total 2552 participants provided blood samples and completed at least the general questionnaire (Fig. 1).
Of all DIS‐participants, a vast majority (27 450 (88%) of DIS‐I and 28 790 (83%) of DIS‐II participants) gave informed consent for linkage to the blood bank information system, external databases and public registries such as cancer registries. DIS was approved by the Medical Ethical Committee Arnhem‐Nijmegen in the Netherlands and for DIS‐III by the Medical Ethical Committee of the Academic Medical Center, Amsterdam, the Netherlands. All participants gave their written, informed consent.
Measurements
An overview of all data collected during DIS‐I, ‐II and ‐III is provided in Table 1. The questionnaire for DIS‐I was self‐administered, mainly multiple choice, covered six topics in Dutch. During DIS‐II, the same, slightly updated questionnaire was used. These questionnaires were, with exception of the questions about donation, adapted from the Nijmegen Biomedical Study questionnaire 15. In addition, several psychological constructs were inquired with regard to donation behaviour. This included constructs of the Theory of Planned Behaviour and were based on previously published measures and concepts such as trust and altruism 16, 17, 18.
Table 1.
Donor InSight measurements
| Phase | Measurements | Topic | Item |
|---|---|---|---|
| Continuously updated | Linkage to the Dutch donor database: | Donor and donation(s) information | Number and timing of donation, donor screening, including blood pressure, haemoglobin level and deferral |
| DIS‐I 2007–2009 | Questionnaire: | Demographic characteristics | Age, sex, household composition, ethnicity, education and employment |
| Donation | Experiences with the blood bank and blood donation, including short‐term effects and potential motivators for and barriers to blood donation | ||
| Lifestyle | Diet, smoking, alcohol use, physical activity and travel behaviour | ||
| Health and disease | Current health status, medication use and medical history | ||
| Family | Family composition, family members giving or receiving blood, events of cancer, myocardial infarction and stroke in the family | ||
| Females | Menstruation pattern, contraceptive use, menopause, reproductive organ surgery and pregnancies | ||
| DIS‐II 2012–2013 | Questionnaire: | Demographic characteristics | Age, sex, household composition, ethnicity, education and employment |
| Donation | Experiences with the blood bank and blood donation, including short‐term effects and potential motivators for and barriers to blood donation | ||
| Lifestyle | Diet, smoking, alcohol use, physical activity and travel behaviour | ||
| Health and disease | Current health status, medication use and medical history | ||
| Family | Family composition, family members giving or receiving blood, events of cancer, myocardial infarction and stroke in the family | ||
| Females | Menstruation pattern, contraceptive use, menopause, reproductive organ surgery and pregnancies | ||
| DIS‐III 2015–2016 | Questionnaire: | Demographic characteristics | Age, sex, ethnicity |
| Lifestyle | Diet and iron intake (FFQ), physical activity (IPAQ), smoking, alcohol use | ||
| Health Status | General health (SF‐12), medication use | ||
| Iron‐deficiency‐related symptoms | Restless legs syndrome, cognitive functioning, pica, fatigue | ||
| Females | Menstruation pattern, contraceptive use, menopause, reproductive organ surgery and pregnancies, pictorial blood loss assessment chart (PBAC) | ||
| Measurements: | DNA isolation and sequencing | Single nucleotide polymorphisms | |
| Full blood count and haemolysis | Including Hb, Ht, MCV, MCH, MCHC, RBC, WBC, PLT | ||
| Iron metabolism | Ferritin, zinc protoporphyrin | ||
| Blood lipid profile | High density lipoprotein cholesterol, total cholesterol and triglyceride levels | ||
| Physical activity | Accelerometer data | ||
| Optional | Linkage to: | Databases and disease registries |
Donor InSight‐III participants were requested to complete questionnaires on symptoms associated with iron deficiency; general health (SF12); 19 the international physical activity questionnaire (IPAQ); 20 a shortened version of a food frequency questionnaire (FFQ) 21, designed to estimate iron intake; and questions on alcohol use, smoking and medication, adapted from the DIS‐I and ‐II questionnaires. Furthermore, female participants were again asked to fill out questions about their menstruation patterns, pregnancies and contraceptive use. In DIS‐III the PBAC was used to quantify menstrual blood loss 14.
Blood sampling, genotyping and accelerometers (DIS‐III)
Blood for DIS‐III was sampled at all blood bank collection sites throughout the Netherlands. Four blood samples (12 ml in total) were taken from the sampling pouch during a routine blood donation if donors were eligible. If a donor was deferred from donation or not willing to make a full donation (n = 836, 29% of all blood samples), blood was sampled through venepuncture. Blood samples were sent to Amsterdam and processed within 24 h after donation. Blood samples for zinc protoporphyrin (ZPP; Model 206D, Aviv Biomedical, Lakewood, NJ) were stored in EDTA whole blood at 4–6°C and measured within 10 days after sampling. Full blood counts (XT‐2000, Sysmex, Kobe, Japan) were performed immediately after processing, after which this EDTA whole blood sample was used to determine free haemoglobin (EON plate reader, Biotek, NH, USA) and to determine haemolysis levels 28 days after blood sampling. Ferritin was measured using plasma from lithium heparin tubes (Architect Ci8200, Abbott Laboratories, IL, USA) and were stored at ‐80°C. Total cholesterol, high density lipoprotein cholesterol and triglycerides were also measured from lithium heparin tubes (Cobas C systems, Roche/Hitachi, Mannheim, Germany). Both ferritin and blood lipid levels were measured within 12 months after blood sampling. DNA was extracted from EDTA whole blood samples stored at ‐30°C. A part of the entire genome was analysed, including high‐throughput genotyping using the UK Biobank Axiom Array (Thermo Fisher, Waltham, MA, USA) that contains 820 967 single nucleotide polymorphisms (SNP) and insertion/deletion (INDEL) markers 1, 22.
A subset of DIS‐III participants were invited through the DIS‐III questionnaire to additionally participate in an accelerometer study to objectively assess physical activity and sedentary behaviour (wGT3X‐BT and GT3X Actigraph, Pensacola, FL, USA). Accelerometers provide information on activity as counts per minute (cpm). Activity was categorized as sedentary ≤99; light‐intensity 100–2019; moderate‐intensity 2020–5998; and vigorous‐intensity ≥5999 cpm. according to the well‐established Troiano (2008) cut‐off points 23.
Data used to assess characteristics and representativeness of DIS
For the current analyses, data on demographics, lifestyle, health and disease, and donor and donation information were used. Level of education was defined as the highest level of education completed, being primary education, prevocational secondary education and lower general secondary education (categorized as low education), senior secondary vocational training, senior general secondary education and pre‐university education (categorized as medium education), or higher professional education and university (categorized as high education). Household composition was measured as living alone, living alone with children (categorized as living alone (with children)), living with spouse or partner, living with spouse or partner and children (categorized as living with partner (and children)), living with parents/family/friends, living as a student in a dorm/with roommates and other (categorized as other). Employment was measured using the question “To which group do you belong?” with the options (multiple answers possible): employed, retired, off work due to illness, unemployed/searching for a job, disabled, housewife/‐man, student with a job, student without a job and other (categorized as other). Part‐time and full‐time employment were categorized by using the question “If you have paid work, how many hours do you work during an average week?”. Using information from these two questions, employment was categorized as full‐time (≥36 h/week), part‐time, student/unemployed and retired. Employment, household composition and education were measured once, these questions were asked only in DIS‐II in case the donor did not participate in DIS‐I.
Physical activity regarded medium to high intensity workouts for DIS‐I and ‐II; participants were asked to for instance include mountain biking, but exclude cycling to work or playing chess. The IPAQ‐short form was used in DIS‐III 24 to estimate time spent in moderate to vigorous physical activity (MVPA) and sedentary behaviour. In a subset of the DIS‐III sample sedentary behaviour and physical activity were also objectively measured using accelerometers. MVPA and sedentary behaviour are reported as mean minutes per day.
Smoking was measured as current smoker, former smoker and, never smoked. Alcohol consumption was measured as less than once a week, 1–2 days/week, 3–5 days/week and (almost) every day. The presence of medical conditions was assessed in DIS‐I and DIS‐II by asking whether these conditions had ever been diagnosed by a physician. In DIS‐III name of (prescribed) medication or vitamin, preparations and reason for prescription was requested. Answers were categorized according to the World Health Organization recommended Anatomical Therapeutic Chemical classification system 25. To enable comparison in terms of donor (demographic) and donation information of the DIS‐I sample to the total donor population, data on all active and non‐active donors on the 31st of December 2009, corresponding with the timing of DIS‐I, were extracted including all whole blood and plasma donations made in 2007‐2009. Age at 31‐12‐2009 (years), height (m), weight (kg), body mass index (BMI, kg/m2), mean Hb (mmol/l, mean of measurements in 2007–2009), mean systolic and diastolic blood pressures (SBP and DBP, mm Hg, mean of all measurements in 2007–2009), mean donation interval (mean of all intervals between donations in 2007–2009) and total number of donations in 2007–2009 were obtained or calculated from this database.
Statistics
Descriptive results of the DIS‐I, ‐II and ‐III population in terms of demographic characteristics, donation, lifestyle behaviours and health and disease are reported as numbers and proportions for binary data, or mean values ± standard deviations or medians with interquartile ranges in case of normally distributed or skewed continuous data respectively. Mean values ± standard deviations for age, height, weight, BMI, Hb, SBP and DBP, median donation intervals (with interquartile ranges) and proportions of donors with 0, 1–3, 4–6, 7–9 or 10 or more donations, of participants with blood type A, B, AB or O, and of whole blood donors are presented.
Results
Representativeness DIS‐I
In Table 2, characteristics of both the DIS population and the total active donor population on December 31st 2009 are summarised. This table shows that the DIS population is very similar to the total active donor population. Only the number of donations differed, DIS donors were more likely to have made a larger number of donations in 2007–2009 as compared with all donors.
Table 2.
Characteristics of the Donor InSight I sample and the total active donor population, based on data from the donor database as of on 31‐12‐2009
| DIS‐I sample | Active donor population | |||
|---|---|---|---|---|
| Men (n = 14 782) | Women (n = 16 556) | Men (n = 182 751) | Women (n = 211 794) | |
| Age (years) | 51 ± 12 | 44 ± 13 | 48 ± 13 | 42 ± 15 |
| Height (cm) | 182 ± 7 | 169 ± 6 | 182 ± 7 | 170 ± 6 |
| Weight (kg) | 84 ± 14 | 70 ± 13 | 83 ± 14 | 70 ± 13 |
| BMI (kg/m2) | 26 ± 3 | 25 ± 4 | 26 ± 3 | 25 ± 4 |
| Haemoglobin (mmol/l) | 9·4 ± 0·6 | 8·5 ± 0·6 | 9·3 ± 1·2 | 8·2 ± 1·5 |
| SBP (mm Hg) | 134 ± 13 | 126 ± 14 | 134 ± 13 | 125 ± 14 |
| DBP (mm Hg) | 81 ± 8 | 78 ± 8 | 81 ± 8 | 77 ± 8 |
| Donation interval (days) | 105 (80–161) | 152 (124–209) | 107 (79–168) | 147 (113–208) |
| Donations in 2007–2009 (%) | ||||
| 0 | 507 (3) | 978 (6) | 8599 (5) | 22 254 (11) |
| 1–3 | 2060 (14) | 4213 (26) | 43 167 (24) | 76 325 (36) |
| 4–6 | 3140 (21) | 5501 (33) | 39 260 (22) | 59 975 (28) |
| 7–9 | 2933 (20) | 4126 (25) | 31 512 (17) | 38 110 (18) |
| 10 | 6133 (42) | 1726 (10) | 60 213 (33) | 15 130 (7) |
| Blood type, % | ||||
| A−/A+ | 8/33 | 8/32 | 7/32 | 7/30 |
| B−/B+ | 2/8 | 2/8 | 2/8 | 2/7 |
| AB−/AB+ | 1/3 | 1/3 | 1/3 | 1/3 |
| 0−/0+ | 10/36 | 11/35 | 9/36 | 10/34 |
| Whole blood donors (%) | 11 565 (78) | 13 826 (84) | 143 652 (79) | 165 456 (78) |
DBP, diastolic blood pressure; SBP, systolic blood pressure.
Continuous data are shown as mean ± standard deviation, donation interval as median (interquartile range), numbers of donors n (%) are shown for categories.
Characteristics of DIS‐I, ‐II and ‐III
Characteristics of the DIS‐I, ‐II and ‐III populations are shown in Tables 3, 4 and 5 respectively. Approximately one‐third of the donors participating in DIS‐I and ‐II completed higher professional education or university (34–37% and 36–39% in DIS‐I and ‐II respectively), which is more than in the general Dutch population (32% of the Dutch 25–64 year old) 26.
Table 3.
Demographic and lifestyle characteristics of the Donor InSight I sample
| DIS‐I sample | ||||
|---|---|---|---|---|
| Men (n = 14 782) | Women (n = 16 556) | |||
| Whole blood donors (n = 11 565) | Othera (n = 3217) | Whole blood donors (n = 13 826) | Othera (n = 2730) | |
| Demographic characteristics | ||||
| Education | ||||
| Medium | 3905 (34) | 1072 (34) | 5102 (37) | 939 (35) |
| High | 4232 (37) | 1149 (36) | 4675 (34) | 921 (34) |
| Household | ||||
| Living alone (with children) | 1246 (11) | 349 (11) | 2574 (19) | 592 (22) |
| Living with partner (and children) | 9820 (85) | 2770 (86) | 10 309 (75) | 2008 (74) |
| Other | 499 (4) | 89 (3) | 943 (7) | 118 (4) |
| Employmentb | ||||
| Full‐time | 7935 (68) | 2134 (66) | 2768 (19) | 552 (20) |
| Part‐time | 1528 (13) | 415 (13) | 8067 (58) | 1557 (56) |
| Retired | 1582 (14) | 513 (16) | 589 (4) | 160 (6) |
| Other | 583 (5) | 161 (5) | 2554 (18) | 509 (18) |
| Lifestyle and health status | ||||
| Current smoker | 1935 (17) | 450 (14) | 2244 (16) | 403 (15) |
| Alcohol consumption | ||||
| <once/week | 2281 (20) | 661 (21) | 4993 (36) | 888 (33) |
| 1–2 days a week | 3543 (31) | 936 (29) | 3374 (24) | 663 (24) |
| 3–5 days a week | 2757 (24) | 707 (22) | 1931 (14) | 418 (15) |
| (Almost) every day | 2265 (20) | 692 (22) | 1475 (11) | 311 (12) |
| Physical activity (hours sports/week) | 2·5 (1·5 – 4·0) | 3·0 (2·0 – 4·5) | 2·0 (1·3 – 3·0) | 2·0 (1·5 – 3·5) |
| Hypertensionc | 1880 (16) | 504 (16) | 1751 (13) | 413 (15) |
| High cholesterolc | 1176 (10) | 309 (10) | 664 (5) | 157 (6) |
| Diabetes mellitusc | 193 (2) | 63 (2) | 141 (1) | 38 (1) |
Binary data are shown as numbers (%), continuous data are shown as mean ± standard deviation, or as median (interquartile range) in case of skewed data.
The category ‘other donors’ mainly contains plasmapheresis donors.
Due to the possibility of multiple answers per donor, the sum of the number of donors per categories may exceed the total number of donors.
As diagnosed by a physician.
Table 4.
Demographic and lifestyle characteristics of the Donor InSight II sample
| DIS‐II sample | |||
|---|---|---|---|
| DIS‐I participants (n = 22,132) | Newly recruiteda (n = 12,694) | Total (n = 34,826) | |
| Demographic characteristics | |||
| Educationb | |||
| Medium | 7679 (35) | 4721 (37) | 12 400 (36) |
| High | 7959 (36) | 4967 (39) | 12 926 (37) |
| Household | |||
| Living alone (with children) | 3161 (14) | 1873 (15) | 5034 (14) |
| Living with partner (and children) | 18 529 (84) | 9766 (77) | 28 295 (81) |
| Other | 405 (2) | 1037 (8) | 1442 (4) |
| Employment | |||
| Full‐time | 8322 (35) | 5029 (37) | 13 351 (36) |
| Part‐time | 7741 (33) | 4496 (33) | 12 237 (33) |
| Retired | 3844 (16) | 1307 (10) | 5151 (14) |
| Other | 3806 (16) | 2698 (20) | 6504 (17) |
| Lifestyle and health status | |||
| Current smoker | 2658 (12) | 1704 (13) | 4362 (13) |
| Alcohol consumption | |||
| <once/week | 5685 (29) | 3504 (31) | 9189 (30) |
| 1–2 days a week | 5934 (30) | 3709 (33) | 9643 (31) |
| 3–5 days a week | 4473 (23) | 2405 (21) | 6878 (22) |
| (Almost) every day | 3481 (18) | 1630 (14) | 5111 (17) |
| Physical activity (hours sports/week) | 2 (1–4) | 2 (2–4) | 2 (1–4) |
| Hypertensionc | 3092 (15) | 1227 (10) | 4319 (13) |
| High cholesterolc | 1628 (8) | 540 (4) | 2168 (7) |
| Diabetes mellitusc | 449 (2) | 153 (1) | 602 (2) |
Binary data are shown as numbers (%), continuous data are shown as mean ± standard deviation, or as median (interquartile range) in case of skewed data.
These donors did not participate in DIS‐I and were newly recruited for DIS‐II.
Due to the possibility of multiple answers per donor, the sum of the number of donors per categories may exceed the total number of donors.
As diagnosed by a physician.
Table 5.
Characteristics of the Donor InSight III sample
| DIS‐III samplea | ||||
|---|---|---|---|---|
| Stable Hb levels (n = 744) | Declining Hb levels (n = 987) | Random sample (n = 821) | Total (n = 2552) | |
| Sex | ||||
| Male | 250 (34) | 502 (51) | 393 (48) | 1145 (45) |
| Lifestyle and health status | ||||
| Current smoker | 58 (8) | 81 (9) | 63 (8) | 202 (9) |
| Alcohol consumption | ||||
| <once/week | 291 (39) | 336 (34) | 250 (31) | 877 (34) |
| 1–2 days a week | 190 (26) | 255 (26) | 204 (25) | 649 (25) |
| 3–5 days a week | 125 (17) | 180 (18) | 168 (21) | 473 (19) |
| (Almost) every day | 84 (11) | 116 (12) | 142 (17) | 342 (13) |
| Physical activity | ||||
| MVPA IPAQ (min/day) | 51 (26–116) | 51 (21–108) | 56 (20–124) | 51 (21–113) |
| Sitting IPAQ (min/day) | 480 (300–720) | 480 (300–660) | 420 (240–600) | 480 (300–660) |
| MVPA accelerometer (min/day)b | 31 (22–49) | 28 (18–43) | 29 (17–43) | 29 (19–45) |
| Sedentary behaviour accelerometer (min/day)b | 533 ± 93 | 558 ± 82 | 552 ± 85 | 549 ± 87 |
IPAQ, International Physical Activity Questionnaire; MVPA, moderate to vigorous physical activity.
Binary data are shown as numbers (%), continuous data are shown as mean ± standard deviation or as median (interquartile range) in case of skewed data.
Donors who provided blood samples and completed (at least) the general questionnaire.
Subset of DIS‐III participants with accelerometer data: stable Hb n = 212, declining Hb n = 278, random sample n = 251, total n = 741.
Donor InSight donors were mainly living with a partner (and children), DIS‐I: 74–86% and DIS‐II: 77–84%, and often full‐time employed (DIS‐I: 19–68% and DIS‐II: 35–37%). The percentage of smokers ranged from 8 to 17% (DIS‐I – DIS‐III), which is lower compared with the general Dutch population (23% among adults in 2016) 27 and consumption of alcohol 1–2 days per week ranged from 24 to 33. The prevalence of hypertension, high cholesterol and diabetes was relatively low in comparison with the general Dutch population: ranging from 1% (women with diabetes) to 16% (men with hypertension) in DIS‐I and from 1% (diabetes) to 15% (hypertension) in DIS‐II 11.
Discussion
Donor InSight is a unique cohort study on randomly selected donors from the Dutch donor population and comprises data regarding epidemiological and psychosocial aspects of blood donation. As shown in this study, DIS‐I donors are representative of the Dutch donor population.
Differences in age, number of donations and the larger number of donations in 2007–2009 between the DIS‐sample and the Dutch donor population is probably due to the fact that donors who participated in DIS were randomly selected from the active donor population at different time points in the period 2007–2009. In equal circumstances, a random selection of the active donor population in April 2007 will obviously be older in December 2009 than the active donor population at that point. Furthermore, donors who stopped donating will be present in the DIS population, but not in the active total donor population in December 2009. Vice versa, the total donor population includes recently registered donors who could not have been part of DIS. Indeed, the total donor population includes 2·6% newly registered donors, while only 0·1% of the DIS donors were newly registered.
Multiple other large studies among blood donors have also collected questionnaire and biological data, though with different study aims and study populations. The INTERVAL study, for example, is a randomized controlled trial assigning donors to different donation intervals 1. The Danish Blood Donor study invited all donors visiting the blood bank who had donated at least once 4. Last, the Donor Iron Status Evaluation (RISE) study investigated four groups of donors (male and female, frequent and first‐time/reactivated) 28. So a unique aspect of DIS is that the inclusion into DIS was not directly linked to actual donations, thereby enhancing the participation of potentially less motivated donors and donors with blood types that are less frequently requested 2, 3, 4.
Strengths of DIS include the large study population and high representativeness of the Dutch donor population. This makes the study particularly useful for donation‐related research questions for which the donor database is lacking information. Due to its prospective design and multiple measurements DIS also provides a unique opportunity to study questions in fields like public health, social sciences, epidemiology, (bio)statistics, genetics and haematology. The DIS cohort is a relatively healthy cohort that can serve as control sample 29. Another strength is the objectively measured physical activity and sedentary behaviour in a subset of the DIS‐III sample. Benefits of the study set‐up are that (1) many repeated measurements with different intervals are available from the donor database and (2) additional data can be obtained relatively easily because (still donating) participants return to donation centres and are generally very willing to participate in research which is reflected in the DIS response rates ranging from 42 to 70%. Other strengths include the possibility of linking study results to the donor database and to morbidity and mortality data. A potential weakness is the selective study population because of (1) the voluntary nature of donation, (2) donor screening procedures and (3) non‐response to study invitations 11. As with all studies, but particularly in the present circumstances, one should keep in mind that extrapolation of conclusions to the general population should be done with great caution.
Donor InSight data provide many more research opportunities because of the longitudinal questionnaire information, but also the biomedical and genetic data. Information on genetic markers can be used for research purposes, such as to study associations between Alzheimer's disease and blood donation, between iron indices and autoimmune/inflammatory disorders or between blood donation and cancer common variants.
Donor InSight is a cohort study of a representative sample of the Dutch donor population. The cohort can been used to study donor characteristics, motivations and barriers of donation, donor deferral in relation to future donor show behaviour and the healthy donor effect. Currently the DIS cohort is used to study lifestyle behaviours and genetic determinants of Hb trajectories. The DIS data may provide answers to many research questions that cannot at all be analysed by our research team.
Funding
Donor InSight was initiated by the Unit Donor Services, Division Blood Bank and the Department of Donor Studies, Division Research, of Sanquin and was funded by the peer reviewed grant from Sanquin's Fund for Product and Process Development Cellular Products (PPOC 14‐028; PPOC‐14‐DS‐01).
Author Contributions
KvdH conceived the idea of the paper. KvdH, TCT and RdG wrote, reviewed and edited the manuscript. KH, EMM, FJP, FA, WLAMdK provided critical feedback on the manuscript. All authors read and approved the final manuscript.
Acknowledgements
We are grateful to all participants for their contribution to the study and for their voluntary donations of blood (components) for patients in need. We are thankful to all researchers, research assistants and blood bank personnel for their ongoing commitment to DIS and the donor database.
References
- 1. Moore C, Sambrook J, Walker M, et al: The INTERVAL trial to determine whether intervals between blood donations can be safely and acceptably decreased to optimise blood supply: study protocol for a randomised controlled trial. Trials 2014; 15:363 [DOI] [PMC free article] [PubMed] [Google Scholar]
- 2. Zuck TF, Thomson RA, Schreiber GB, et al: The Retrovirus Epidemiology Donor Study (REDS): rationale and methods. Transfusion 1995; 35:944–951 [DOI] [PubMed] [Google Scholar]
- 3. Ameratunga SN, Norton RN, Whitlock G, et al: The New Zealand Blood Donors’ Health Study: baseline findings of a large prospective cohort study of injury. Inj Prev 2002; 8:66–69 [DOI] [PMC free article] [PubMed] [Google Scholar]
- 4. Pedersen OB, Erikstrup C, Kotze SR, et al: The Danish Blood Donor Study: a large, prospective cohort and biobank for medical research. Vox Sang 2012; 102:271 [DOI] [PubMed] [Google Scholar]
- 5. Williamson LM, Devine DV: Challenges in the management of the blood supply. Lancet 2013; 381:1866–1875 [DOI] [PubMed] [Google Scholar]
- 6. Eder A: Evidence‐based selection criteria to protect blood donors. J Clin Apher 2010; 25:331–337 [DOI] [PubMed] [Google Scholar]
- 7. Zou S, Stramer SL, Dodd RY: Donor testing and risk: current prevalence, incidence, and residual risk of transfusion‐transmissible agents in US allogeneic donations. Transfus Med Rev 2012; 26:119–128 [DOI] [PubMed] [Google Scholar]
- 8. Schotten N, Pasker‐de Jong PC, Moretti D, et al: The donation interval of 56 days requires extension to 180 days for whole blood donors to recover from changes in iron metabolism. Blood 2016; 128:2185–2188 [DOI] [PubMed] [Google Scholar]
- 9. Van Den Hurk K, Peffer K, Habets K, et al: Blood donors’ physical characteristics are associated with pre‐ and post‐donation symptoms ‐ Donor InSight. Blood Transfus 2017; 15:405–412 [DOI] [PMC free article] [PubMed] [Google Scholar]
- 10. Amrein K, Valentin A, Lanzer G, et al: Adverse events and safety issues in blood donation–a comprehensive review. Blood Rev 2012; 26:33–42 [DOI] [PubMed] [Google Scholar]
- 11. Atsma F, Veldhuizen I, de Vegt F, et al: Cardiovascular and demographic characteristics in whole blood and plasma donors: results from the Donor InSight study. Transfusion 2011; 51:412–420 [DOI] [PubMed] [Google Scholar]
- 12. The Commisson of the European Communities : European Parliament and of the Council of community standards and specifications relating to a quality system for blood establishements.; Official Journal of the European Union. 2005: 41‐8.
- 13. Nasserinejad K, van Rosmalen J, van den Hurk K, et al: Prevalence and determinants of declining versus stable hemoglobin levels in whole blood donors. Transfusion 2015; 55:1955–1963 [DOI] [PubMed] [Google Scholar]
- 14. Higham JM, O'Brien PM, Shaw RW: Assessment of menstrual blood loss using a pictorial chart. Br J Obstet Gynaecol 1990; 97:734–739 [DOI] [PubMed] [Google Scholar]
- 15. Galesloot TE, Vermeulen SH, Swinkels DW, et al: Cohort Profile: The Nijmegen Biomedical Study (NBS). Int J Epidemiol 2017; 46:1099–100j [DOI] [PMC free article] [PubMed] [Google Scholar]
- 16. Ferguson E, Farrell K, Lawrence C: Blood donation is an act of benevolence rather than altruism. Health Psychol 2008; 27:327–336 [DOI] [PubMed] [Google Scholar]
- 17. Ajzen I: The theory of planned behaviour. Organ Behav Hum Decis Process 1991; 50:179–211 [Google Scholar]
- 18. Bekkers R: Trust, accreditation, and philanthropy in the Netherlands. Acoust Speech Signal Process Newslett IEEE 2003; 32:596–615 [Google Scholar]
- 19. Ware J Jr, Kosinski M, Keller SD: A 12‐Item Short‐Form Health Survey: construction of scales and preliminary tests of reliability and validity. Med Care 1996; 34:220–233 [DOI] [PubMed] [Google Scholar]
- 20. Mader U, Martin BW, Schutz Y, et al: Validity of four short physical activity questionnaires in middle‐aged persons. Med Sci Sports Exerc 2006; 38:1255–1266 [DOI] [PubMed] [Google Scholar]
- 21. Streppel MT, de Vries JH, Meijboom S, et al: Relative validity of the food frequency questionnaire used to assess dietary intake in the Leiden Longevity Study. Nutr J 2013; 12:75 [DOI] [PMC free article] [PubMed] [Google Scholar]
- 22. Ollier W, Sprosen T, Peakman T: UK Biobank: from concept to reality. Pharmacogenomics 2005; 6:639–646 [DOI] [PubMed] [Google Scholar]
- 23. Troiano RP, Berrigan D, Dodd KW, et al: Physical activity in the United States measured by accelerometer. Med Sci Sports Exerc 2008; 40:181–188 [DOI] [PubMed] [Google Scholar]
- 24. Craig CL, Marshall AL, Sjostrom M, et al: International physical activity questionnaire: 12‐country reliability and validity. Med Sci Sports Exerc 2003; 35:1381–1395 [DOI] [PubMed] [Google Scholar]
- 25. WHO Collaborating Centre for Drug Statistics Methodology : ATC classification index with DDDs, 2018. Oslo, Norway: WHO; 2017. [Google Scholar]
- 26. OECD : Education at a Glance, OECD Indicators. Paris, OECD Publishing, 2014. [Google Scholar]
- 27. WHO : WHO report on the global tobacco epidemic, 2017: monitoring tobacco use and prevention policies. the Netherlands, Geneva, Country profile, WHO, 2017. [Google Scholar]
- 28. Cable RG, Glynn SA, Kiss JE, et al: Iron deficiency in blood donors: the REDS‐II Donor Iron Status Evaluation (RISE) study. Transfusion 2012; 52:702–711 [DOI] [PMC free article] [PubMed] [Google Scholar]
- 29. Zhang B, Shu XO, Delahanty RJ, et al: Height and breast cancer risk: evidence from prospective studies and mendelian randomization. J Natl Cancer Inst 2015; 107:djv29. [DOI] [PMC free article] [PubMed] [Google Scholar]