Abstract
Enzymes are attractive tools for synthetic applications. To be viable for industrial use, enzymes need sufficient stability towards the desired reaction conditions such as high substrate and cosolvent concentration, non‐neutral pH and elevated temperatures. Thermal stability is an attractive feature not only because it allows for protein purification by thermal treatment and higher process temperatures but also due to the associated higher stability against other destabilising factors. Therefore, high‐throughput screening (HTS) methods are desirable for the identification of thermostable biocatalysts by discovery from nature or by protein engineering but current methods have low throughput and require time‐demanding purification of protein samples. We found that nanoscale differential scanning fluorimetry (nanoDSF) is a valuable tool to rapidly and reliably determine melting points of native proteins. To avoid intrinsic problems posed by crude protein extracts, hypotonic extraction of overexpressed protein from bacterial host cells resulted in higher sample quality and accurate manual determination of several hundred melting temperatures per day. We have probed the use of nanoDSF for HTS of a phylogenetically diverse aldolase library to identify novel thermostable enzymes from metagenomic sources and for the rapid measurements of variants from saturation mutagenesis. The feasibility of nanoDSF for the screening of synthetic reaction conditions was proved by studies of cosolvent tolerance, which showed protein melting temperature to decrease linearly with increasing cosolvent concentration for all combinations of six enzymes and eight water‐miscible cosolvents investigated, and of substrate affinity, which showed stabilisation of hexokinase by sugars in the absence of ATP cofactor.
Enzymes
Alcohol dehydrogenase (NADP+) (EC 1.1.1.2), transketolase (EC 2.2.1.1), hexokinase (EC 2.7.1.1), 2‐deoxyribose‐5‐phosphate aldolase (EC 4.1.2.4), fructose‐6‐phosphate aldolase (EC 4.1.2.n).
Keywords: differential scanning fluorimetry, high‐throughput screening, protein folding, solvent tolerance, thermostability
nanoDSF is a valuable tool to rapidly determine thermal stability of native proteins in crude protein extracts. It can be used for high‐throughput screening of enzyme libraries from metagenomic sources or from saturation mutagenesis, for rapid screening of tolerance for water‐miscible organic cosolvent and of substrate affinity, for example, sugar binding by hexokinase even in the absence of ATP.
Abbreviations
- DERA
2‐deoxyribose‐5‐phosphate aldolases
- DSC
differential scanning calorimetry
- DSF
differential scanning fluorimetry
- FSA
fructose‐6‐phosphate aldolase
- HK
hexokinase
- HPTLC
high‐performance thin‐layer chromatography
- HTS
high‐throughput screening
- KRED
ketoreductase
- MTP
microtiter plate
- TK
transketolase
- Tm
protein melting temperature
- TSA
thermal shift assay
Introduction
Enzymes have attracted great attention as catalysts for synthetic applications due to their chemo‐, regio‐ and enantiospecificity, as well as their high turnover number for a wide variety of catalytic reaction types 1. In particular, their activity under ambient reaction conditions and their exceptional compatibility for multistep, one‐pot operations are crucial for the synthesis of sensitive compounds and favourable for lowering the environmental footprint of chemical syntheses. To be useful for industrial applications, enzymes must be robust enough to withstand a number of stress factors under the required reaction conditions such as high substrate concentration, the presence of surfactants and cosolvent, non‐neutral pH and elevated temperatures 2, 3. Thermodynamic stability of proteins is a desirable feature as it allows for protein purification by heat treatment, to run reactions at elevated process temperatures and because it usually is also associated with improved stability against other destabilising forces. Often, thermally stable enzymes also show higher kinetic stability against chemical degradation 4, 5. Enzyme stability has been successfully improved through structure‐guided rational design and random approaches of directed in vitro evolution with high‐throughput screening (HTS) for thermal protein stability by various techniques 6, 7, 8. Using a differential scanning calorimetry (DSC) platform with integrated autosampling it is possible to measure 50 samples per day utilising 300–500 μL samples per measurement. Lower sample consumption is challenging due to the low enthalpy change during the phase transition and only very recently could be achieved by developing a microfabricated DSC system 9. CD spectroscopy can be used to determine thermal stability, but is more suitable to determine chemical stability at a constant temperature 10. CD has been described as a potential HTS method to determine the on‐set temperature of protein denaturation with a capacity of 20 samples per day 11. Turbidity determination and static or dynamic light scattering can quantify ligand interactions and protein stability at various conditions in HTS fashion, which can be used to determine thermal stability of proteins that aggregate upon denaturation 6, 7. Differential scanning fluorimetry (DSF) is used in the so‐called thermal shift assay (TSA) where protein denaturation can be followed in the presence of an added environment‐sensitive fluorescent dye by monitoring the fluorescence increase upon thermal protein unfolding 12, caused by interaction of the dye with the exposed hydrophobic core of the denatured protein. By using real‐time PCR equipment, it is possible to determine 1000 melting points per day. This assay has successfully been used to screen protein libraries utilising protein samples purified from 2 mL expression cultures 13 and is useful for identifying appropriate conditions for protein and protein–ligand crystallisation 14, 15. Label‐free DSF technology is also available by measuring the intrinsic change in tryptophan and/or tyrosine fluorescence of a protein upon unfolding. Recent instrument development for miniaturisation (‘nanoDSF’) allows measuring 48 samples in parallel in 10 μL volumes with < 10 μg of protein per determination. In order to screen protein libraries in a HTS fashion, it is necessary to circumvent lengthy procedures for protein purification. Recently, the nanoDSF technique was the first method used to determine melting points on proteins in crude extracts, which were prepared through cell lysis by French press, sonication or chemical additives followed by centrifugation to remove cell debris 16. Possible HTS feasibility was claimed for cell lysis by simultaneous sonication of 96 samples in a PCR plate 17.
Here, we demonstrate the potential of nanoDSF for the determination of protein melting temperatures under true HTS conditions. First, we screened a commercial library of phylogenetically highly diverse 2‐deoxyribose‐5‐phosphate aldolase (EC 4.1.2.4) samples in a 96‐well plate format containing cell‐free extracts, in order to evaluate the scope and the limitations of this technique when using generic methods of sample preparation. Next we searched for alternative methods for fast protein preparation and found hypotonic extraction of overexpressed protein by freeze–thaw treatment of cells to be very fast, simple and superior for the high sample quality and excellent reproducibility. Using this sample preparation and nanoDSF, we determined 288 melting temperatures per day of single‐site saturation libraries. Furthermore, in a single run we could determine protein cosolvent stability as a matrix of six enzymes by eight water‐soluble organic compounds. Finally, we used nanoDSF to determine the binding constants of hexokinase towards various sugar substrates in the absence of ATP, which is impossible to gain by conventional kinetic assays.
Results and Discussion
High‐throughput screening of protein thermal stability
Both high activity and sufficient stability are critical factors to render enzymes suitable for industrial applications in biotechnology. Biocatalyst stability under the required reaction conditions, essential for maximising total turnover numbers with low quantities of catalyst, is often the limiting factor that defines cost efficiency 18. This feature is becoming even more challenging in multienzymatic and chemo‐enzymatic processes as more catalysts have to fulfil the requirements. Protein stability in vitro is a major concern for biotechnology, food and pharmaceutical industries, and can be divided into a kinetic and a thermodynamic part 5. The kinetic (or long‐term chemical) stability is characterised by an enyme's half‐life and is determined by following the decrease in enzyme activity over time. The thermodynamic (or conformational) stability is given by the resistance of a folded protein against denaturation by thermal unfolding and can be instantly attained by measuring the protein melting temperature (T m). In solution, an enzyme exists in conformational equilibrium with unfolded state(s), where the catalytically active folded state is favoured at ambient conditions. Most proteins undergo a sharp, cooperative transition from the native to the denatured state upon an increase in temperature, which is experimentally observable as a characteristic sigmoidal property curve from which the T m is derived as the inflection point 5. Thermal stability is highly desirable as it is associated with increased tolerance against the presence of destabilising agents and usually also with superior kinetic stability 4. In addition, proteins having high thermal stability allow for simple purification by heat treatment. More stable proteins are preferred starting candidates for protein engineering by rational design or directed evolution, as activity and specificity are often gained at the cost of stability 19, 20. Thus, there is a need for efficient screening methods to probe enzyme libraries for high thermal stability. Several techniques have been developed to facilitate HTS for thermal stability 6, 7. The highest capacity up to now can be achieved by the TSA 21. Protein denaturation is followed by DSF in the presence of an environment‐sensitive fluorescent dye, via fluorescence increase caused by the emergent interaction with hydrophobic portions of the unfolding protein. Real‐time PCR equipment is used for the parallel analysis of up to 96 samples, consuming only 25 μL of 1 g·L−1 protein solution per T m determination. This technique has efficiently been used to screen potential inhibitor and drug libraries, where positive candidates are detected through a stabilising effect upon binding, thus increasing the target protein's melting temperature 12. Thermal stability of mutated protein libraries have also been screened successfully after purification using Ni‐nitrilotriacetic acid magnetic beads 13. However, the need of purified protein for this and other techniques significantly restricts the overall throughput for the T m screening of protein libraries.
The label‐free nanoDSF technique determines the T m by measuring the intrinsic dual‐UV fluorescence change in tryptophan and tyrosine residues in proteins at emission wavelengths of λ = 330 and 350 nm 10. The Prometheus nanoDSF instrument (NanoTemper Technologies, Munich, Germany) can measure 48 samples in parallel with a capillary loading volume of only 10 μL, thereby consuming < 10 μg of protein per determination. This technique was recently tested to determine T m of two different overexpressed proteins in crude extracts. Principle HTS feasibility for application to the screening of protein libraries was suggested by referring to cell lysis potentially performed by simultaneous sonication of 96 samples in a PCR plate 16, 17. In our study, we first used nanoDSF to screen a metagenomics enzyme library from a commercial source for their thermal stability directly from crude lysates without prior purification. Because readings from lower expressing constructs may not yield unambiguous T m data, protein purification cannot always be avoided. Interested in a straightforward method to prepare and screen larger protein ensembles without the need for less common dedicated equipment, we further evaluated different conventional lysis methods for protein sample preparation.
T m screening for metagenomic enzyme orthologues
When a biocatalyst with properties matching the selected process conditions is not readily available, nature is offering a rich source of numerous protein orthologues having similar catalytic activity for the same reaction and diverse physicochemical properties 22. Companies and academic institutions are collecting huge metagenomic libraries from environmental samples and offering distinct enzyme arrays for activity screening in the search for promising variants. Thermostability is another attractive asset as it is associated with better resistance to other destabilising factors 4. Especially, when other enzyme properties are not easy to be screened for in HTS mode, such as for stereoselectivity 23, screening for thermostability might be an interesting alternative as a primary choice of HTS for hit candidates. Thus, we have evaluated the potential of nanoDSF as a promising screening tool requiring only small amounts of native protein samples. In order to test this approach we screened a commercial library containing 96 phylogenetically highly diverse proteins (all members of this panel share a maximum of 80% primary sequence identity) assigned by their sequence homology as 2‐deoxyribose‐5‐phosphate aldolases (DERA). The DERA enzymes are Class I lyases that catalyse the reversible addition of ethanal to d‐glyceraldehyde 3‐phosphate to form 2‐deoxy‐d‐ribose 5‐phosphate 24. DERA can also catalyse the stereoselective sequential addition of ethanal to an acceptor substrate producing a cyclic trimer. Because the latter resembles the HMG‐CoA moiety, DERA catalysis became important for the synthesis of the statin side chain, a key pharmaceutical intermediate of cholesterol‐lowering drugs 25, 26, 27.
The DERA panel (Prozomix Ltd, Haltwhistle, UK) consisted of standard cell‐free extracts (CFEs) in a microtiter plate (MTP) format, containing 1 mg of lyophilised lysate per well. The contents are made up of roughly equal parts of protein and buffer components, including a varying fraction of the respective recombinant DERA variant, as verified by SDS/PAGE analysis (Fig. 1). In crude extracts, all soluble proteins will contribute to the total fluorescence measurement upon thermally induced unfolding, thus the melting curve analysis by nanoDSF will record a cumulative signal composed of that from the desired overexpressed protein together with those of all Escherichia coli host proteins. Although expected to be rather similar for a given host strain and expression mode, this latter background, will depend on various technical factors and with unequal fractions of the target protein can appear rather different, thus cannot be simply subtracted for correction. For the samples shown in Fig. 1, the DERA fraction is estimated to reach 70% of the total protein at the highest overexpression levels (005, 014 and 016), 30–40% with intermediate overexpression (001, 006 and 015) and ≤ 5% in weakly expressing samples (017 and 018). Previously, it had been shown by using a purified protein containing an unusually high number of fluorescent residues (Acinetobacter cyclohexanone monooxygenase, 12 Trp/26 Tyr = 2.2/4.7% out of a total of 558 residues) that at least a 10% overexpression level is required to achieve an efficient T m measurement against the background from a crude extract 16.
Figure 1.
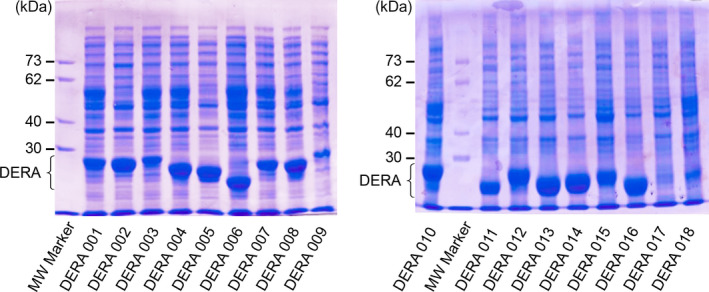
Protein SDS/PAGE analysis showing cell‐free extracts of DERA library members 001–018 for exemplary demonstration of sample quality. DERA proteins have a molecular mass between 20 and 30 kDa. Variants 005, 006, 012, and 015–017 are lacking a tryptophan residue, thus no T m could be determined for these samples. Expression level of variant 018 was too low to yield an accurate T m determination.
Protein samples in the wells were dissolved in 200 μL of buffer (100 mm sodium phosphate, pH 7.5), and screened with the nanoDSF method over a temperature range from 25 °C to 110 °C using a heating gradient of 1 °C·min−1. Samples containing very low expression of DERA protein and/or DERA protein lacking a Trp residue in their primary sequence provided fluorescence readings that reflected the host protein mixture only and therefore could be used as background. A comparison of other measurements against this background indicated clear peaks for T m values corresponding to novel DERA proteins (Fig. 2).
Figure 2.
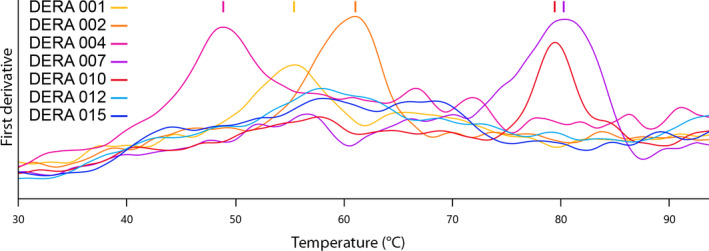
Exemplary nanoDSF measurement of T
m values for five well‐expressing DERA orthologues (DERA 001  , 002
, 002  , 004
, 004  , 007
, 007  , 010
, 010  ), demonstrating the signal quality from lyophilised crude cell extracts in a commercial protein panel. Two curves are from proteins that lack a Trp residue (DERA 012
  , 015
, 015  ) and thus indicate background from host cell proteins.
This first pass resulted in 53 immediate T m readings, and a rescreen at higher excitation energy of 24 candidates that had shown only a weak fluorescence signal resulted in three further successful T m determinations. This set of 56 (out of 96) T m data from the diverse DERA library are presented in the phylogenetic tree in Fig. 3, together with data for a reference set of five in‐house enzymes from E. coli 24, Geobacillus stearothermophilus 26, Lactobacillus brevis 27, Thermotoga maritima 28 and Thermus thermophilus 29. As a single exception, one sample having two Trp residues, showing good overexpression and verified activity in our catalytic assay, did not give a conclusive melting curve; possibly, the T m lies outside of the measuring range (> 110 °C) or the net fluorescence change was too small to be detected against the background. Interestingly, three variants lacking any Trp residue but having a relatively high number (8, 8 and 5 respectively) of Tyr residues in combination with a high level of overexpression produced nice melting curves. Among the other 39 DERA variants not giving a conclusive T m reading, 24 proteins were lacking a Trp residue, which is reflecting the low average statistical abundance of tryptophan in proteins of only 1.1% and the average DERA size of only around 230 residues. For an additional set of 15 samples the target protein was expressed at rather low level only, as revealed in Fig. 1, and the consequent low purity of the sample did not produce a clear melting curve. It can be concluded that T m data can be determined with confidence on crude extracts when the target protein contains at least one Trp residue, or alternatively multiple Tyr residues instead, and makes a significant part (> 20%) of the total protein composition. Low expression level or low protein solubility, which prevents the determination of conclusive T m data, can be seen as a reciprocal type of useful information to be gained from such a screening, as these limiting factors render proteins uninteresting for industrial applications.
Figure 3.
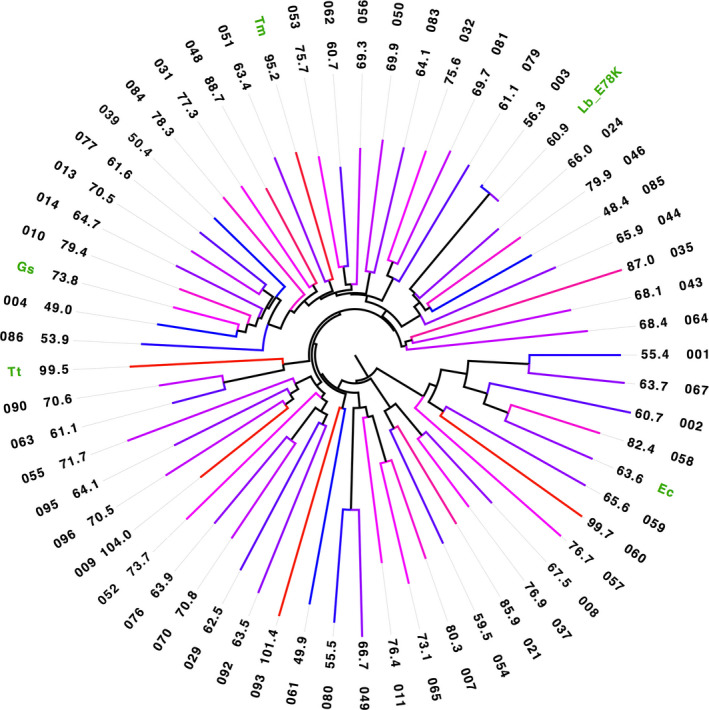
Phylogenetic tree of DERA enzymes from a number‐coded (outer circle) 96‐member, maximum diversity library (from which 56 T m values were obtained) plus five reference enzymes from Escherichia coli, Geobacillus stearothermophilus, L. brevi, Thermotoga maritima and Thermus thermophilus (green label) showing their sequence relation and T m values both in numerical form (inner circle) as well as colour coded in a scale from blue to red for low to high stability respectively.
The DERA variants have T m values ranging from 48 °C to 104 °C, which is colour coded from blue to red, respectively, in Fig. 3 to better illustrate the T m range. As a consequence of the selection principle for library members to cover a maximum diversity of sequence space for this DERA superfamily, closest related variants can have very large differences in protein conformational stability. In agreement with this notion, ΔT m between next neighbours can reach extremes of 31 °C (046 and 085, Fig. 2, top‐right), 34 °C (059 and 060, Fig. 2, right) and 52 °C (061 and 093, Fig. 2, bottom). The corresponding variants indeed only have 62%, 59% and 24% sequence identity, respectively, and thus are too different to expect a meaningful relation of their T m. Altogether, we identified 24 variants with a T m over 70 °C, 6 variants with a T m over 85 °C and 2 variants with a T m over 100 °C. Thus, despite the very limited scope of this study, and although one fourth of the library entries did not even contain a Trp residue required for this type of measurement, it is quite remarkable that around one third of the DERA variants were discovered to have a high to very high T m and, because of their robust nature, are thus of potential interest for industrial applications 3.
To ascertain that the function of each member of the DERA panel was correctly assigned and that the proteins investigated were not only folded in a stable conformation but also active, library members were further screened for both their natural and synthetic activities. As expected from their sequence annotation, most enzymes were active in the native cleavage of D‐deoxyribose 5‐phosphate (data not shown). More importantly in view of the relevance for practical applications, activity screening in direction of synthesis probed the ethanal trimerisation as a model for the non‐natural synthesis of the statin side chain (Scheme 1) 28.
Scheme 1.

DERA catalysed sequential addition of ethanal to produce a cyclic trimer.
The assay measured formation of the cyclic trimer from 200 mm ethanal solutions after 24 h by high‐performance thin‐layer chromatography (HPTLC) with anisaldehyde staining. The coloured product spot intensities were measured densitometrically and referenced against a standard curve (Fig. 4). Under these conditions, about two thirds of all samples (62/96) showed non‐natural synthetic activity. The five most active aldolases (DERA 024, 060, 062, 080, and 081), representing the entire range of thermostability (T m values between 55.5 ° and 99.7 °C), gave more than 25% conversion. Although the two enzymes with the highest thermal stability (DERA 009 and 093; T m 104.0 °C and 101.4 °C respectively) had no trimer synthesis activity, two other enzymes showed both high activity and high thermal stability (DERA 048 and 060; T m 88.7 °C and 99.7 °C respectively), rendering them excellent candidates for potential industrial development. While enzymes with high thermal stability often have low specific activity at ambient conditions because of their rigid structure, DERA enzymes from thermophilic organisms had previously been observed to show good synthetic activity for ethanal trimerisation at room temperature 28.
Figure 4.
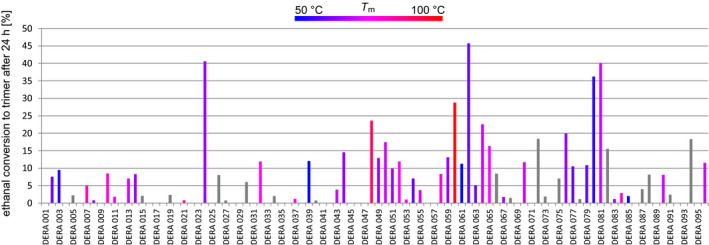
Screening results for synthetic activity of commercial 96‐member DERA library. Synthetic activity of number‐coded enzymes for trimerisation of ethanal is given as % conversion after 24 h reaction time. Value bars are colour coded in a scale from blue to red for low to high enzyme stability respectively (grey: no T m available).
Screening of mutated enzyme libraries
Protein sample preparation for library screening
To establish a practical HTS assay for protein thermal stability it is necessary to have a method for fast and reproducible sample preparation. Most methods for T m determinations require protein samples of high purity, while our studies and others have shown that CFE with a sufficient level of purity or certain fraction of total protein content is satisfactory to achieve a reliable measurement by nanoDSF. T m data quality not only depends on a protein's purity but on its number of fluorescent Trp residues and their individual environment in the protein; therefore, a general rule cannot be specified. However, our experience shows that a target protein containing only a single buried Trp residue should constitute at least 30% of the total protein in the sample. In special cases of proteins with high Trp content a 10% overexpression level can be sufficient 16. Protein purity from recombinant overexpression depends on several factors, including the methods chosen for cell lysis and potential subsequent purification steps. For protein purification, affinity chromatography can be used in a 96‐well MTP format when the target peptide contains an appropriate affinity tag 30. Such purification entails several pipetting steps that introduce variations between wells, and elution steps by using a vacuum manifold, which also has well‐to‐well variation, or by centrifugation, which is more reproducible but more time demanding. Such experimental conditions generally render T m determination less accurate, and, in addition, the affinity tag can affect the enzyme stability. To avoid these variations and to increase the overall throughput, it is desirable to omit tedious extra purification steps altogether.
Cell lysis can be performed by sonication in MTP format using dedicated equipment but can destroy sensitive proteins and requires efficient cooling due to the heat produced. Other mechanical lysis methods such as cell disruption by shear force, by grinding between glass beads or high‐pressure homogenisation are not feasible in MTP format. Cell lysis by treatment with enzymes such as lysozyme (with or without nuclease) and with chelating agents or nondenaturing detergents can be performed in a high‐throughput fashion. Unfortunately, both the foreign proteins and the surfactants used in these methods make the determination of the melting temperature more difficult to impossible, or can strongly affect the protein stability. A certain complication is that most total cell lysis methods will release proteins from all cell compartments while most enzymes of interest for synthetic purpose are soluble. As evident from the screening of the diverse DERA library, a good overexpression level of a soluble target protein is needed for straightforward T m determination in crude extracts. Applying freeze–thaw cycles is an easy and fast method not releasing the endogenous proteins of E. coli, which results in less contaminating proteins 31, and osmotic lysis in a hypotonic solution can be used to selectively release soluble proteins 32. We have combined the two latter methods into a single protocol we call hypotonic extraction, which was compared against a standard protocol for chemical cell lysis using overexpressed DERA from E. coli (DERAEc) as an exemplary case. In parallel, 16 wells in a 96‐well plate containing 800 μL autoinduction media were each inoculated with 150 μL from the same preculture. Cells were harvested, dried and stored in the plate at −20 °C until use. One half of the frozen cell pellets were chemically treated with commercial BugBuster reagent for 20 min at RT, while the other cell pellets were solely suspended in a hypotonic buffer solution (10 mm Tris, pH 7.5) and incubated on ice for 10 min. For all samples, cell debris was removed by centrifugation and the supernatants were transferred to a new plate. Protein analysis showed that, as to be expected, the chemical lysis releases more total protein; total protein content, determined with the bicinchoninic acid assay, was 1.91 ± 0.06 and 1.21 ± 0.05 g·L−1 for the samples from chemical lysis and hypotonic extraction respectively.
Analysis by SDS/PAGE gave similar intensity of protein bands for DERAEc (29 kDa) from both lysis methods, but the target protein in the samples lysed with BugBuster (Fig. 5A) was accompanied by a significantly larger amount of other proteins, effectively diluting its fraction to < 40%, while it was by far the major component (ca. 70%) after the hypotonic extraction (Fig. 5B). The reproducibility was found to be high with both methods.
Figure 5.
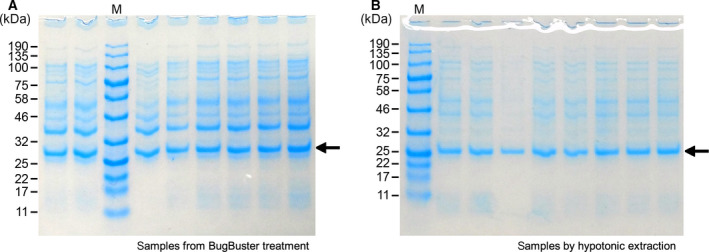
Protein analysis by SDS/PAGE of crude DERAEc extracts. Cell pellets from 950 μL expression cultures all inoculated from the same pre‐culture were prepared in 500 μL volume either by chemical cell lysis using 1× BugBuster in 45 mm sodium phosphate buffer pH 7.4 (panel A) or by hypotonic extraction using low buffer concentration (10 mm Tris, pH 7.4) (panel B), followed by centrifugation to remove cell debris. Protein samples of 5 μL each were loaded on the gel. DERAEc has a molecular mass of 29 kDa.
Using the nanoDSF method, the T m of DERAEc was determined to be 55.0 ± 0.4 and 63.1 ± 0.3 °C in the chemically lysed and the hypotonically extracted samples, respectively, with high reproducibility of the data in both types of samples (Fig. 6). However, the detergent components in the chemical lysis reagent have a large negative impact on the T m, with a destabilisation of the thermal unfolding of more than 8 °C relative to native conditions. Hypotonic extraction is very fast, simple and gives good protein purity. Using this method we could routinely process four MTPs in parallel which, starting from cell pellets, resulted in 384 samples containing 1 g·L−1 of protein of 70% purity within 1 h. Therefore, hypotonic extraction is the method of choice for protein preparation in HTP screening campaigns.
Figure 6.
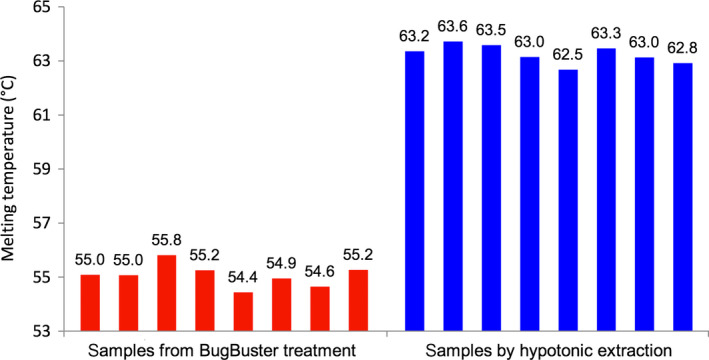
Reproducibility of the T m determination of DERAEc in crude extracts prepared by chemical lysis using BugBuster reagent or by hypotonic extraction using 10 mm Tris buffer, pH 7.5; each measured as eight replicates.
Upon comparing T m data from nanoDSF to those measured by TSA for the same samples, it becomes apparent that the latter can differ significantly, and in a sequence‐dependent manner. In particular, the SYPRO orange fluorogenic dye seems to exert a slight destabilising effect causing T m values to deviate mostly 0.5–2.5 °C lower than when measured by nanoDSF in the absence of any additive (Table 1). This destabilisation is smaller for hydrophobic aliphatic side chains (Ala, Ile, Leu, Val ca. 0.8 °C lower on average), but can be quite pronounced with charged residues (e.g. Arg, Glu up to 2.4 °C lower) or hydrophobic aromatic residues (e.g. Trp, Phe up to 2.2 °C lower). Apparently, the zwitterionic merocyanine structure selectively associates with ionic or aromatic structures and thereby shifts the thermodynamic equilibrium from the folded towards the unfolded state. The nanoDSF method is clearly superior by measuring intrinsic protein fluorescence in the absence of associating additives, giving true undistorted T m values.
Table 1.
Comparison of T m values measured in duplicate for DERAEc by nanoDSF and by TSA in the presence of fluorescent SYPRO orange dye.a
| Mutation site | 30X | 31X | 55X | 59X | 157X | 188X | |
|---|---|---|---|---|---|---|---|
| X = Ile | nanoDSF | 63.9 ± 0.04 | 63.3 ± 0.07 | 63.9 ± 0.02 | 62.8 ± 0.03 | 64.1 ± 0.13 | 63.8 ± 0.13 |
| TSA | 62.9 ± 0.32 | 62.6 ± 0.14 | 63.3 ± 0.29 | 62.0 ± 0.00 | 63.3 ± 0.25 | 63.1 ± 0.38 | |
| X = Arg | nanoDSF | 62.5 ± 0.10 | 63.0 ± 0.04 | 62.6 ± 0.04 | 62.2 ± 0.16 | 60.2 ± 0.04 | 54.5 ± 0.19 |
| TSA | 60.9 ± 0.14 | 61.6 ± 0.14 | 60.4 ± 0.29 | 60.3 ± 0.00 | 58.7 ± 0.25 | 55.2 ± 0.38 | |
| X = Trp | nanoDSF | 62.0 ± 0.07 | n.a.b | 62.5 ± 0.28 | 61.0 ± 0.05 | 61.6 ± 0.07 | 56.2 ± 0.10 |
| TSA | 60.5 ± 0.00 | n.a. | 60.3 ± 0.14 | 59.9 ± 0.14 | 58.7 ± 0.43 | 55.0 ± 0.00 |
ananoDSF measures in 0.05 °C steps and values are unlikely to be identical, while the TSA assay is measured in 0.5 °C steps with interpolation; for matching T m values, there is no standard deviation. bClone not available.
Screening of enzyme libraries from site‐directed mutagenesis
Protein stability can be improved through various means including immobilisation, medium engineering and protein engineering 18. Different rationale exist for protein engineering such as changing flexible residues and promoting electrostatic interactions 33, stabilising quaternary structure 34, consensus engineering 35, introducing cysteine bridges 36, introducing residues from thermophilic organisms 37 and others.
From a project directed at generating experimental data to optimise a software algorithm for predicting protein thermal stability, the 3dm superfamily analysis software suite 38 was used to identify potential hotspots in the DERAEc protein according to criteria of structural flexibility (high B‐factor), low homologous conservation, exclusion of functionally important positions, among others. A set of six sites were selected for experimental study by saturation mutagenesis (Table 1), and a control study was also performed at the corresponding sites of an orthologous protein, the DERA from L. brevis (DERALb), containing the consensus mutation E78K for enhanced stabilisation 27. The latter enzyme contains a single buried Trp residue qualified for nanoDSF studies. The gene coding for DERALb was used to create six single‐site saturation libraries utilising the degenerative codon NNK. The plasmid libraries were introduced into the expression host E. coli BL21(DE3). For each library, 92 randomly picked clones were transferred to a 96‐well MTP, which was completed by adding two controls carrying the template gene and two negative controls. The negative control clones were transformed with the same pET21a(+) plasmid as the library variants, but lacking the DERALb gene. The library was expressed and processed by hypotonic extraction as described above, and the T m of the DERALb variant proteins was determined by nanoDSF in triplicates directly from the crude extracts (Fig. 7). Signal quality of the nanoDSF method proved very high for hypotonic extraction samples of the standard level of pET expression (Fig. 8).
Figure 7.
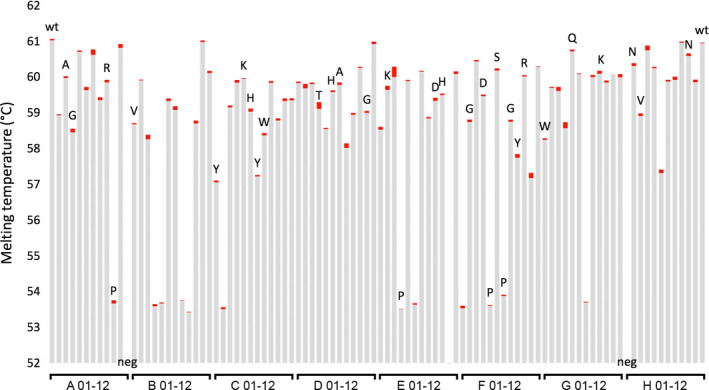
T m data from a 96‐well MTP made up of 92 clones of the saturation library DERALb Q54X, two wild‐type controls (wt) and two negative controls (neg) lacking the gene coding for DERALb and thus not giving a corresponding melting curve. The red bars correspond to the T m values ±1 standard deviation from triplicate determinations. From the entire set 32 clones were sequenced, and these bars are labelled with the amino acid found at position 54. The high reproducibility of triplicate measurements, the good agreement of identical variants and the high yield of positively determined T m data demonstrate the high sample quality and the reliability of the method.
Figure 8.
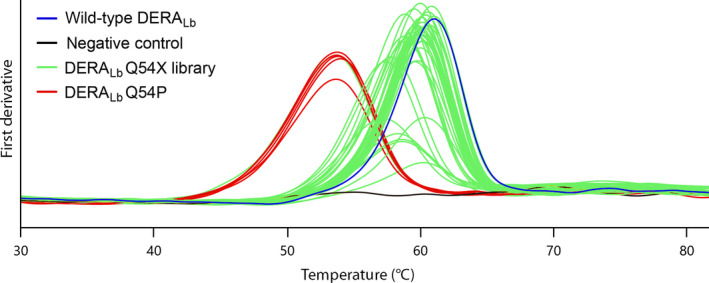
Exemplary T m measurements from a fraction of clones in the saturation library DERALb Q54X (green lines) to demonstrate signal quality from crude protein samples obtained by hypotonic extraction. Black line is host cell background with empty expression plasmid (negative control), and blue curve corresponds to wild‐type; replacement by Pro shows significant protein destabilisation (red lines).
Different clones harbouring identical variants show very good agreement in their T m values. Triplicate measurements obtained directly from crude extracts of the same clone are highly reproducible, generally having a standard deviation below 0.1 °C. Because a single determination is sufficient for accurate data collection this means that in T m screening campaigns the measurement of triplicates is unnecessary, increasing the throughput threefold. The six single‐site saturation libraries, each arrayed as 96‐well MTP, corresponds to 576 samples, which were processed manually in 12 runs of 48 samples each within two working days. Subtracting the four controls on each MTP, the total number of unknown samples accounts to a total of 552; NNK saturation mutagenesis introduces stop codons with a frequency of 3% and should yield around 17 negative clones. Essentially, this leaves 535 variants potentially folding into the native three‐dimensional conformation of full size proteins. Altogether, 525 samples gave clearly observable melting peaks, which corresponds to a calculated 98% yield of T m values and proves the high sample quality generated by the hypotonic extraction method. Starting from cell pellets containing the recombinant protein, we speculate that by using a more focused temperature range, steeper temperature profile and the use of available automatisation systems the overall throughput could easily be increased 10‐fold.
T m screening for solvent stability
Optimal reaction conditions are important for a biotechnology process to be efficient and to match economical constraints. Two of the most desired features of the biocatalyst required for industrial applications are thermostability and organic solvent tolerance 2, 5. Water‐miscible organic cosolvents are often needed in biocatalytic processes for solubilising organic substrates and products to reach an industrially interesting concentration range in a homogenous solvent phase. Enzyme stability on the other hand, is generally negatively influenced by the presence of a hostile cosolvent, which causes a disruption of the hydrophobic protein core and a shift of the conformational equilibrium towards the unfolded denatured state 5. We investigated this effect by nanoDSF for a combinatorial 48‐member matrix made up from combinations of six distinct enzymes and eight different cosolvents. In the study, commercial purified hexokinase from Saccharomyces cerevisiae (HK) was included as received, ketoreductase from L. brevis (KREDLb) 39 was used as CFE from recombinant expression and DERATm was additionally heat treated and dialysed. Transketolase variant L397F/D399G/H479Q from G. stearothermophilus (TK) 40, fructose‐6‐phosphate aldolase from E. coli (FSA) 41 and DERA from E. coli (DERAEc) were available from current synthetic projects. These enzymes represent distinct folding patterns and come from different organisms, including mesophilic and thermophilic, bacterial and eukaryotic origins. For the organic component, we selected from the range of completely water‐miscible compounds the eight most common ones that are used as cosolvent, namely the polar‐protic alcohols, methanol, ethanol and 2‐propanol, as well as polar‐aprotic dimethyl sulfoxide (DMSO), dimethylformamide (DMF), propanone, acetonitrile and tetrahydrofuran (THF). Propanone and the alcohols are also important as enzymatic cosubstrates, such as for redox reactions. Signal quality of the corresponding protein samples at the various fraction of cosolvent was excellent until the cosolvent ratio caused a protein to denature very close to (or below) the start of the temperature gradient. Reliable determinations could be performed even with temperature sensitive enzymes such as HK or KREDLb (native T m = 42 °C and 41 °C respectively), for which cosolvent addition causes thermally induced unfolding already at temperatures close to room temperature (Fig. 9).
Figure 9.
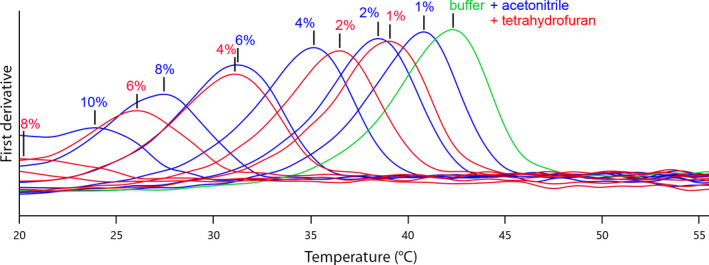
Exemplary T m determinations for hexokinase (green) in the presence of an increasing fraction (1%, 2%, 4%, 6%, 8% and 10% cosolvent respectively) of acetonitrile (blue curves) and THF (red curves).
The loss of protein stability by the addition of cosolvents is a biophysical problem of fundamental interest because many proteins are marginally stable, and thermodynamic information about the stability of the folded state can be obtained only by perturbing the equilibrium to populate the unfolded = denatured state. Enzymes maintain their structural conformation through intramolecular hydrophobic interactions among the component amino acid residues located within the core domains. By introducing an organic solvent, the polarity of the medium around the enzyme molecule is reduced and the hydrophobic domains are able to disperse, resulting in unfolding of the enzyme 42. Indeed, all six enzymes were destabilised by the presence of the eight cosolvents to a certain degree, as shown in Fig. 10.
Figure 10.
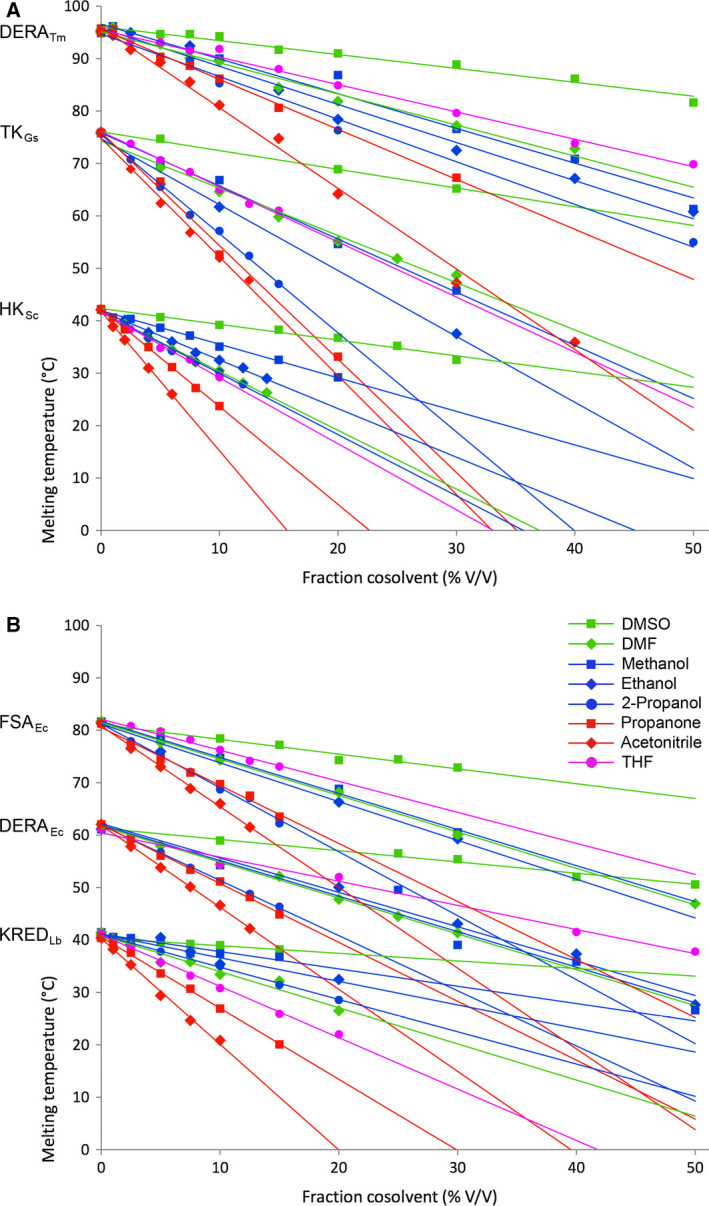
Protein melting temperatures decrease linearly with increasing fraction of water‐miscible cosolvents. (A) From top to bottom: DERATm, TK and HK. (B) From top to bottom: FSA, DERAEc and KRED.  DMSO,
DMSO,  DMF,
DMF,  methanol,
  ethanol,
  2‐propanol,
  propanone,
  acetonitrile,
  THF.
THF.
Interestingly, the effect was found to occur in a strictly linear fashion for all selected enzymes within a wide range of conditions. The cosolvent fraction was studied with percentage increasing up to 50% depending on the stability threshold of the individual enzyme. The slope in Fig. 10 corresponds to the decrease in T m per percent cosolvent added, which corresponds to a kind of empirical ‘solvent response factor’ specific for a given protein/cosolvent combination. An overview of this destabilising effect is presented in Fig. 11 for all the enzymes and cosolvents investigated. From this synopsis it is evident that DMSO has the least destabilising effect, while THF and acetonitrile constitute the two harshest environments. DMF, propanone and primary alcohols seem to have a rather similar, intermediate effect, whereas the secondary alcohol 2‐propanol is slightly less well tolerated. Although it is well established that more hydrophobic solvents (higher log P values) are less harmful to enzymes than polar solvents in biphasic aqueous‐organic solvent systems, no clear correlation of protein stability and solvent hydrophobicity is evident from our data for monophasic aqueous‐organic solvent mixtures. To find the threshold concentration of an organic solvent for protein stability, its denaturing strength seems to be a parameter that needs to be experimentally determined for each individual enzyme‐solvent combination 43, although a certain trend exists. Overall, the data are in accordance with previous empirical observations for cosolvent tolerance of enzymes recorded in the literature, which usually had to be determined by time‐consuming measurement of residual activity after certain exposure to cosolvents 44.
Figure 11.
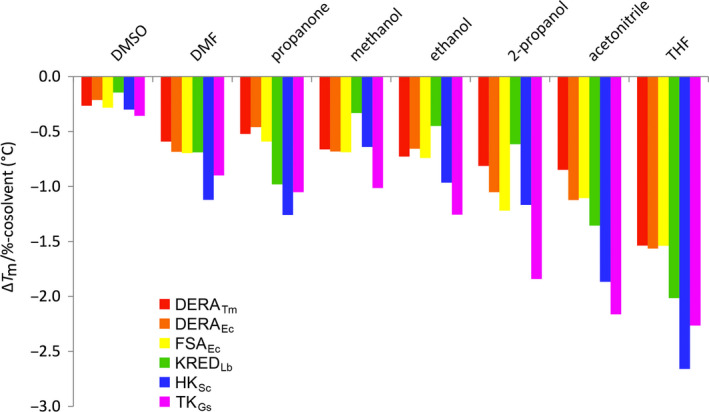
Decrease in protein thermal stability per percent cosolvent.  DERATm,
  DERAEc,
  FSA,
FSA,  KREDLb,
  hexokinase and
  transketolase.
The three selected aldolases, that is, DERAEc, DERATm and FSA, share a (β,α)8 barrel topology in their subunits and apparently have very similar sensitivities (solvent response factors) to any of the organic additives, although their T m values are rather different at 61 °C, 95 °C and 82 °C respectively. Both DERAEc and DERATm occur as dimers 45, while FSA is a dimer of pentamers 45, 46. FSA has a highly condensed structure, which is stabilised by intersubunit domain swapping of a C‐terminal helix, which runs across the barrel of a neighbouring subunit. Interactions from this helix to the second subunit are predominantly hydrophobic and involve the only Trp residue. As this Trp residue will experience a major change in its environment upon subunit dissociation, and because of the similarity in cosolvent sensitivity to the dimeric DERA proteins, it is likely that subunit separation happens simultaneously with protein denaturation. The higher thermal stability of DERATm compared to DERAEc has been explained by a more compact dimer packing and thus less solvent‐exposed surface, preventing thermal unfolding 45. Indeed, it could be shown that designed monomeric variants of DERATm have a significantly lower thermal stability than the dimeric parent 45. However, a more compact packing of subunits apparently does not translate into a different relative solvent tolerance. Rather, the uniform response to cosolvents of all three aldolases seems to indicate that noncovalent binding interactions responsible for inner barrel stability are of comparable size to those stabilising the subunit interfaces in this class of proteins. On the other hand, the different T m data imply they can stand rather different cosolvent concentrations at a specific temperature, thus thermostable variants remain of great interest for synthetic applications.
Transketolase is a dimeric enzyme from a thermophilic bacterium with a rather high T m of 76 °C 47, but it shows the highest cosolvent sensitivity in our investigation. Its high sensitivity could originate in the tertiary structure where the two active sites are composed of amino acids from both subunits at the dimer interface, where also the organic thiamine cofactor is bound, thereby rendering the enzyme less stable 40, 48. Because the TK subunit interface contains several Trp residues, the single peak indicates that subunit dissociation occurs concomitant with unfolding. HK contains two domains that undergo a conformational change upon substrate binding 49. This confers a high flexibility, which could explain the rather high cosolvent sensitivity of HK. The KRED shows a remarkable stability in the presence of all alcohols as cosolvents, both in comparison to the other enzymes and to the other cosolvents. A speculative explanation is that alcohols are the very product of its natural activity, but it is difficult to judge if KREDs are exposed to sufficiently high alcohol concentrations for providing a selective pressure towards higher tolerance. Further investigations of thermal stability in the presence of related cosolvents would be needed before this observation can be fully understood. For each enzyme investigated, only a single, sharp fluorescence peak was observed that corresponds to the exposure of buried Trp residues upon conformational unfolding of an individual subunit; the fact that no other peaks were observable, for example, from potential independent subunit dissociation, is due to the rare occurrence of Trp residues at readily dissociable subunit interfaces.
Our results show a linear correlation between the T m of an enzyme and the concentration of water‐miscible cosolvents, and although empirical we believe this observation is a general rule. In principle, this correlation could be utilised to determine the T m of a protein that unfolds outside of the temperature range accessible for nanoDSF measurements in aqueous solution (> 110 °C) by extrapolating from T m data measured in the presence of appropriate cosolvents. The nanoDSF technique proved to be an excellent tool to rapidly investigate the enzyme stability in the presence of cosolvents with little effort. The same technology could also be used to efficiently investigate effects from further reaction conditions, such as from pH changes, metal ions and salts, complexing agents, surfactants or other additives 50. All enzymes investigated here were destabilised by the tested cosolvents, but proteins can also be stabilised by different additives 12, 42, 51.
Estimation of binding constants by T m screening
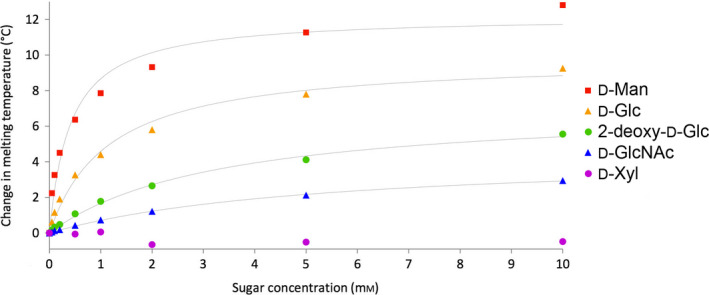
Ligand‐induced conformational stabilisation of proteins is a well‐understood phenomenon in which cofactors, substrates or inhibitors provide enhanced stability of proteins upon binding, leading to an increase in the T m 52, 53. This energetic coupling between ligand binding and conformational protein stabilisation results in changes of the thermally induced melting curves for the ligand complexed relative to the uncomplexed enzyme (ΔT m) that for a substrate are directly proportional to the substrate binding affinity (K M) 12. HK can convert glucose and several other physiological sugar substrates as well as structural analogs via ATP‐dependent phosphorylation. Hexokinase is known to undergo a significant conformational change upon substrate binding, thereby enclosing the sugar moiety between its two domains and making the enzyme more rigid 49. Thus, one can expect a large effect on the thermal stability of HK upon addition of a substrate. We investigated five structurally related monosaccharides representing a scale of very good substrates for phosphorylation to compounds not showing detectable conversion (Fig. 12) 54. The increase in HK T m with increasing sugar concentration follows typical saturation curves of Michaelis–Menten kinetics. Corresponding K M values of hexokinase towards different sugar substrates as well as the maximal stabilisation effect of the sugars ΔT m(max) were calculated utilising the modified Michaelis–Menten kinetics given in Eqn (1).
| (1) |
Figure 12.
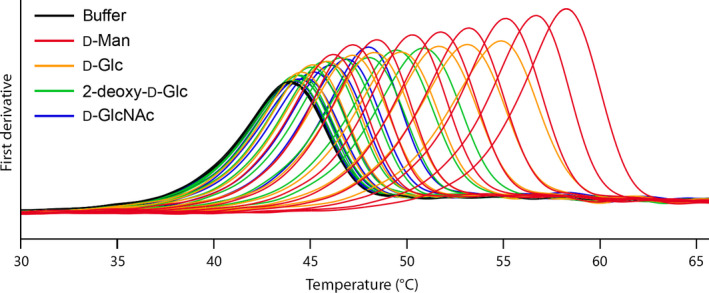
Exemplary T m measurements of HK (black) in the presence of d‐mannose (red), d‐glucose (yellow), 2‐deo‐d‐glucose (green), and N‐acetyl‐d‐glucosamine (blue) in increasing concentrations of 0.05, 0.1, 0.2 0.5, 1, 2, 5, 10 and 20 mm each.
The K M data for binary sugar complexes in the absence of ATP and the corresponding calculated ΔT m(max) values are presented in Table 2 together with literature values for the ternary enzyme constants in the presence of ATP. The trend lines in Fig. 13 are reaching the maximum threshold earlier than the experimental data, an effect that is more pronounced with the better substrates. Sugar additives are known to stabilise proteins in a nonspecific way, but this effect is expected to be minimal at the low concentration levels applied 55. Hexokinase is found in equilibrium of monomer and dimer, which could be shifted towards a more stable dimer when the conformation changes upon binding of a high‐affinity substrate 56. In addition, secondary binding sites of the sugars also stabilising the enzyme could have an additive effect on the T m 12. Interestingly, an attempt to determine the K M value of ATP by using the same nanoDSF method proved futile, probably because the binary complex upon ATP binding does not involve a conformational stabilisation of similar size as resulting from binding of the sugar substrates.
Table 2.
Hexokinase‐binding constants for sugars in the absence of ATP and the maximum T m increase
| Sugar | K M (mm) | ΔT m(max) (°C) | K M (mm)a | K i (mm)a | Rel. ratea |
|---|---|---|---|---|---|
| d‐Mannose | 0.41 ± 0.08 | 12.2 ± 0.6 | 0.05 | 1.5 | |
| d‐Glucose | 1.1 ± 0.2 | 9.9 ± 0.4 | 0.1 | 1 | |
| 2‐Deoxy‐d‐glucose | 3.3 ± 0.3 | 7.2 ± 0.3 | 0.3 | 0.3 | |
| N‐Acetyl‐d‐glucosamine | 5.3 ± 0.3 | 4.5 ± 0.1 | 1 | < 0.001 | |
| d‐Xylose | n.d.b | n.d.b | 10 | < 0.001 |
aLiterature values for the ternary enzyme‐binding constants in the presence of ATP 54; bCould not be determined because no T m change.
Figure 13.
Change in T
m of hexokinase in the presence of different sugars. The trend line was fitted to the modified Michaelis–Menten kinetics given in Eqn (1). The stabilisation effect could be used to estimate affinity of substrates or potential inhibitors (K
M or K
i). Symbols represent  d‐mannose,
  d‐glucose,
  2‐deoxy‐d‐glucose,
  N‐acetyl‐d‐glucosamine and
  d‐xylose.
This method allows for the determination of the binding constants in the absence of the cosubstrate ATP, which is impossible in conventional kinetic assays. The data indicate that binary binding constants are roughly one order of magnitude higher than ternary binding constants determined from kinetic assays in the presence of ATP cosubstrate. In the catalytic cycle ATP has to bind first in an ordered bi–bi mechanism 57, thus it is not surprising that the absence of ATP strongly affects the binding constant of the sugars. However, both the stabilisation effect and the K M values follow the same trend as the ternary literature values. d‐Xylose adopts a predominant pyranoid structure in solution, which lacks a free CH2OH group and has no stabilising effect on hexokinase. Thus, it does not induce the conformational change occurring upon substrate binding and necessary for catalysis, in agreement with kinetic studies showing it is not phosphorylated by HK 54. This method could potentially be used to rapidly evaluate more extended substrate or inhibitor libraries without further chemical additives 58, 59, as well as without a need for any substrate conversion.
Conclusion
Enzyme stability is of both commercial and scientific interest, and thermal stability is a particularly interesting property of an enzyme because it defines the windows of opportunity for the development of synthetic applications, for protein engineering tasks as well as for a quantitative and predictive understanding of the protein folding problem. Also, it is relatively easy to screen for. While previous technology suffered from low throughput, due to the need for significant quantities of purified protein samples, we found that nanoDSF is a valuable tool to rapidly and reliably determine melting points even directly from crude cell lysates, thereby avoiding the need for time‐ and cost‐intensive protein purification steps. Capillary‐based instruments that measure thermal protein unfolding by intrinsic fluorescence changes allowed high throughput, consumed only microscale quantities of protein but maintained the high quality of conventional, cuvette‐based methods.
We could demonstrate the method for the discovery of novel thermostable enzymes from phylogenetically diverse metagenomic DERA library and for the rapid measurements of variants that were created by saturation mutagenesis in a protein engineering project. To avoid intrinsic problems posed by crude protein extracts, we established hypotonic extraction of overexpressed protein from bacterial host cells as an efficient strategy, which resulted in superior sample quality directly from deep‐well plate cultivations with accurate manual determination of several hundred melting temperatures per day with high precision and reproducibility. The use of organic cosolvents is often necessary for synthetic applications to solubilise hydrophobic substrates, and the nanoDSF technology proved highly practical for the screening of cosolvent tolerance with very little protein consumption. This was demonstrated by a combinatorial study involving six enzymes and eight water‐miscible cosolvents applied at five different concentrations each (240 samples), which showed protein denaturation to decrease linearly with increasing cosolvent concentration. Also, nanoDSF is interesting for the affinity ranking of low molecular weight binders, which for the first time enabled quantifying the substrate affinity of hexokinase with various monosaccharides in the absence of the ATP cofactor.
Considering the broad versatility of the label‐free nanoDSF method for the determination of melting curves of proteins, from their discovery and evaluation to engineering their properties, using unpurified samples in HTS mode, it is a promising and highly useful tool for protein research and biotechnology within both academic and commercial settings.
Experimental procedures
Cloning
The gene coding for 2‐deoxyribose‐5‐phosphate aldolase (EC 4.1.2.4) from L. brevis containing the point mutation E78K (DERALb) was ordered codon optimised for E. coli (Thermo Fisher Scientific, Darmstadt, Germany). The corresponding gene coding for 2‐deoxyribose‐5‐phosphate aldolase from E. coli (DERAEc) was cloned from E. coli K12. Both genes were inserted into the plasmid vector pET21a(+) using the restriction enzymes NdeI and XhoI (New England Biolabs, Frankfurt, Germany). Thereby, the sequence CTCGAG and the C‐terminal 6xHis‐tag in the vector were introduced before the stop codon.
Creation of site‐directed mutagenesis libraries
Six saturation libraries of DERALb were created according to the Phusion high‐fidelity PCR protocol (Thermo Fisher Scientific) with 25 μL total reaction volume, no addition of DMSO, 0.75 μL QuikSolution (Agilent, Waldbronn, Germany), and 0.2 μm of the forward and reverse primers listed below. The samples were loaded on a preheated thermocycler and incubated at 98 °C for 30 s, followed by 20 cycles of 98 °C for 10 s, 60 °C for 10 s and 72 °C for 125 s, and a final step of 72 °C for 5 min. The template plasmid was digested by DpnI. From the digested product an aliquot of 4 μL was mixed with 50 μL of chemically competent E. coli DH5α (New England Biolabs) in an Eppendorf tube, incubated for 30 min on ice, 30 s in a water bath at 42 °C and 5 min on ice. Then 900 μL of room tempered super optimal broth with catabolite repression (SOC) 60 was added and the cells were regenerated by rotary shaking at 37 °C and 1000 r.p.m. for 1 h (Eppendorf Thermomixer 5436; Eppendorf, Hamburg, Germany). As a control, 50‐ and 200‐μL aliquots were plated on LB medium 61 containing 50 mg·L−1 ampicillin (LB‐amp) and 1.5 g·L−1 agar, incubated overnight at 37 °C, and resulting in 20–200 colonies per plate. Remaining cells were spun down, the supernatant discarded, and cells redispersed in 1.6 mL LB‐amp medium followed by overnight incubation at 37 °C and 1000 r.p.m. (Eppendorf Thermomixer 5436). Plasmid preparation of the saturation libraries was performed on these cultures, and the introduction of the degenerated codons were confirmed by sequencing (Eurofins GATC Biotech GmbH, Cologne, Germany). Aliquots of 0.5 μL of these plasmid library preparations were mixed with 50 μL electrocompetent E. coli BL21(DE3) and transferred to ice‐cold 2 mm electroporation cuvettes, 2500 V was applied (BTX ECM 399 fitted with a BTX PEP; Harvard Apparatus, Holliston, MA, USA), 900 μL SOC medium of RT immediately added and then the cells were regenerated at 37 °C and shaking for 1 h (Eppendorf Thermomixer 5436). The regenerated cells were diluted 100 times, aliquots of 4 and 20 μL were plated on LB‐amp agar, and incubated at 37 °C overnight.
Codon optimised gene sequence for 2‐deoxyribose‐5‐phosphate aldolase from L. brevis containing the point mutation E78K (DERALb):

Start codon is indicated in bold. The two restriction sites used to clone the gene in to the vector pET21a(+) cut with the same restriction enzymes are in italics. Saturation libraries were created at the six codons labelled in red.
Primer sequence for the creation of the six saturation libraries in DERALb:
Lb DERA K27X f : 5′‐gcagatgcaaccgaagcagatattnnkcagacctgtgatgaggc‐3′
Lb DERA K27X r : 5′‐gcctcatcacaggtctgmnnaatatctgcttcggttgcatctgc‐3′
Lb DERA Q28X f : 5′‐aagcagatgcaaccgaagcagatattaaannkacctgtgatgaggcc‐3′
Lb DERA Q28X r : 5′‐ggcctcatcacaggtmnntttaatatctgcttcggttgcatctgctt‐3′
Lb DERA F50X f : 5′‐gtgaacagctattggattccgnnkgttacagaacagctgaaaggc‐3′
Lb DERA F50X r : 5′‐gcctttcagctgttctgtaacmnncggaatccaatagctgttcac‐3′
Lb DERA Q54X f : 5′‐aacagctattggattccgtttgttacagaannkctgaaaggcaccgatg‐3′
Lb DERA Q54X r : 5′‐catcggtgcctttcagmnnttctgtaacaaacggaatccaatagctgtt‐3′
Lb DERA L148X f : 5′‐gaaattgttcgtgcatgtcagnnkagcgaaaaagccggtgcagat‐3′
Lb DERA L148X r : 5′‐atctgcaccggctttttcgctmnnctgacatgcacgaacaatttc‐3′
Lb DERA T179X f : 5′‐gaagatgttaaactgatgcgtgaannkgttggtgatcgtctgggtgttaaa‐3′
Lb DERA T179X r : 5′‐tttaacacccagacgatcaccaacmnnttcacgcatcagtttaacatcttc‐3′
Protein expression
For each saturation library, aliquots of 950 μL LB‐amp medium in a 96‐deep‐well plate were inoculated with 92 clones randomly picked from plates containing freshly transformed E. coli BL21(DE3) as described under cloning, two wild‐type controls and two negative controls. The negative controls carried the same plasmid but without insert and is thus not expressing the target protein. These precultures were cultivated overnight at 37 °C and 1000 r.p.m. From this culture 100 μL was used to prepare glycerol stocks and 150 μL used to inoculate the expression culture. The remaining volume was centrifuged and the cell pellet stored at −20 °C for later plasmid preparation and subsequent sequencing of interesting variants. The protein variants were expressed in 800 μL autoinduction media (ZYM 5052) 62 lacking trace metals but containing ampicillin (50 mg·L−1) for 5 h at 37 °C and 1000 r.p.m., then the temperature was decreased and incubation (Heidolph Titramax/Inkubator 1000; Heidolph Instruments, Schwabach, Germany) was continued at 30 °C overnight (16 h). The cells containing the overexpressed protein were harvested by centrifugation for 20 min at 2250 g and 4 °C, and then stored at −20 °C until use.
For a comparison of lysis methods DERAEc was expressed as described above. Eight precultures were inoculated from the same glycerol stock stored at −80 °C. The precultures were mixed and from this 16 expression cultures were inoculated.
Cell lysis
For hypotonic extraction the cell pellets stored at −20 °C were resuspended in 500 μL ice‐cold 10 mm Tris buffer pH 7.4 by vortexing and incubated on ice for 10 min. For chemical cell lysis 10× BugBuster (Merck, Darmstadt, Germany) solution was diluted with nine parts 50 mm sodium phosphate buffer pH 7.4, the pellets stored at −20 °C dispersed in 500 μL of this mix by vortexing and then incubated for 20 min at room temperature. The MTPs containing the cell lysates were centrifuged for 20 min at 2250 g and 4 °C. The supernatant containing the overexpressed protein was transferred to a new MTP and immediately used for analysis.
Protein melting temperature determination
The Prometheus NT.48 instrument (NanoTemper Technologies) was used to determine the melting temperatures. The capillaries were filled with 10 μL sample and placed on the sample holder. A temperature gradient of 1 °C·min−1 from 25 to 95 or 110 °C was applied and the intrinsic protein fluorescence at 330 and 350 nm was recorded. For analysis up to 110 °C, the capillaries were sealed using the designated NanoTemper kit in order to avoid evaporation.
Protein concentration determination
Protein concentrations were determined in triplicate with the bicinchonic acid assay kit (Sigma Aldrich, Munich, Germany) according to the protocol for MTP format.
Protein analysis with SDS/PAGE
Analysis of cell‐free extracts (CFEs) from the phylogenetically diverse enzyme library was performed on 10 μL samples of 10 mg·mL−1 CFE, which were loaded on a 12% SDS/polyacrylamide gel.
Comparison of protein sample preparations was performed on 5 μL protein solution, which was loaded on a polyacrylamide gel without extra stacking gel 63. As a control, 5 μL of the Blue Prestained Protein Standard P7706S (New England Biolabs) was loaded. Separation was done at 200 V for 40 min (Biorad Power Pac 3000; Bio‐Rad, Hercules, CA, USA). Staining was performed with Coomassie blue as described earlier 64.
Phylogenetically diverse enzyme library
The phylogenetically diverse 2‐deoxyribose‐5‐phosphate (DERA) library was provided as lyophilised cell‐free extract in a commercial MTP format (Prozomix Limited, Haltwhistle, UK). Wells contained 1 mg material each, whereof 20–80% was protein (bicinchoninic acid assay) and thereof 30–70% DERA protein, with few exceptions having less target protein (estimated from polyacrylamide gels). Lower protein concentration correlates with low DERA content. The material contained in each well was dissolved in 200 μL of 100 mm potassium phosphate buffer (pH 7.5) for determination of the DERA melting temperature.
HPTLC screening of the DERA panel
The DERA panel (Prozomix Ltd) was screened for ethanal oligomerisation with HPTLC monitoring for formation of the trimeric (4R,6R)‐6‐methyltetrahydro‐2H‐pyran‐2,4‐diol. The reactions (250 μL total volume) were performed in a 96‐well MTP at room temperature. A solution of freshly distilled ethanal (0.05 mmol, 200 mm, from a stock solution of 1 m) (Acros, Geel, Belgium) was diluted with triethanolamine buffer (150 μL, 50 mm, pH 7.5), and reactions were started by adding cell‐free extract (50 μL, 2 mg·mL−1 solution in triethanolamine buffer) to the plate. Samples (10 μL) were withdrawn at 24 h reaction time, diluted with 90 μL of water‐methanol (1 : 1, v/v) mix and centrifuged at 3202 g for 30 min at 10 °C to remove precipitated protein. For analysis by HPTLC 2 μL samples of the supernatant were sprayed on a TLC plate (TLC Silica gel 60 F254; Merck) using a CAMAG automatic TLC sampler 4 (CAMAG, Muttenz, Switzerland), then eluted using a mix of toluene‐acetone 1 : 1 and developed with anisaldehyde staining at 120 °C for 2 min. Spot intensities were analysed at 700 nm with a CAMAG TLC Scanner 4 (CAMAG) and compared to standard product concentration (0.5 and 2 mm) with the help of wincats 1.4.7 (CAMAG, Muttenz, Switzerland).
Cosolvent effect on protein stability
The enzyme and cosolvent solutions were prepared to twice the desired concentration and then mixed one to one before determination of the protein melting temperature as described above. DERAEc was purified to homogeneity by Ni‐nitrilotriacetic acid chromatography using its His‐tag, lyophilised, stored at −20 °C until use and then the lyophilisate was dissolved to 2 g·L−1 in 50 mm TEA pH 7.5 for use. Transketolase variant L397F/D399G/H479Q from G. stearothermophilus (TK) 40 and fructose‐6‐phosphate aldolase from E. coli (FSA) 41 were heat treated according to published protocols before lyophilisation, dissolved to 1 and 2 g·L−1, respectively, in 50 mm TEA buffer (pH 7.5). Prozomix provided heat treated, dialysed and lyophilised DERA from Thermotoga maritima (DERATm) and lyophilised ketoreductase from L. brevis (KREDLb). DERATm was dissolved to 2 g·L−1 in 50 mm TEA pH 7.5. These other proteins also carried a His‐tag, but were not further purified. Hexokinase from S. cerevisiae (HK) was purchased from commercial vendor (Sigma Aldrich; product number H4502). KRED and HK were dissolved in 100 mm sodium phosphate (pH 7.5) to 2 and 0.5 g·L−1, respectively, due to higher initial stability in this buffer. Organic solvents were purchased in highest available purity grades from commercial vendors and used as received (DMSO 99.5% puriss, Sigma Aldrich; DMF 99.8%, Acros Organics; MeOH 99.5%, VWR (VWR International GmbH, Darmstadt, Germany); EtOH 96%, Fisher Scientific (Fisher Scientific, Schwerte, Germany); 2‐PrOH, VWR; propanone, Fisher Scientific; MeCN HPLC grade, Fisher Scientific; THF > 99.9%, Fisher Chemical; Thermo Fisher Scientific, Waltham, MA, USA). The solvents were diluted with deionised water to the desired concentrations.
Estimation of binding constants
Solutions of HK and sugars were prepared to twice the desired concentration and mixed one to one before measurement. HK was dissolved to 0.5 g·L−1 in 200 mm sodium phosphate pH 7.5 and the five sugars were dissolved in water. The sugars were purchased of highest available purity; d‐glucose ≥ 99.5% and d‐xylose ≥ 99% (Sigma Aldrich), d‐mannose > 99% and 2‐acetamido‐2‐deoxy‐d‐glucose > 99.5% (Glycon Biochemicals, Luckenwalde, Germany), and 2‐deoxy‐d‐glucose 98% (Thermo Fisher Scientific). Melting temperatures were determined as described above. origin 9.1.0 (OriginLab, Northampton, MA, USA) was used to calculate K M and ΔT m(max) according to the modified Michaelis–Menten Eqn (1).
Author contributions
AOM, AS, H‐JJ and W‐DF planned experiments; AOM performed all experiments and analysed data except for synthetic kinetic studies done by AS; JF and SC contributed essential material; AOM and W‐DF wrote the paper.
Acknowledgements
This project received funding from the European Union's Horizon 2020 research and innovation program under grant no. 635595 (CarbaZymes). Acquisition of the nanoDSF instrument was supported by the BMBF via the HSP2020 programme.
References
- 1. Faber K, Fessner W‐D & Turner NJ (eds) (2015) Science of Synthesis ‐ Biocatalysis in organic synthesis, Vol. 1–3. Georg Thieme, Stuttgart, Germany. [Google Scholar]
- 2. Luetz S, Giver L & Lalonde J (2008) Engineered enzymes for chemical production. Biotechnol Bioeng 101, 647–653. [DOI] [PubMed] [Google Scholar]
- 3. Bornscheuer UT, Huisman GW, Kazlauskas RJ, Lutz S, Moore JC & Robins K (2012) Engineering the third wave of biocatalysis. Nature 485, 185–194. [DOI] [PubMed] [Google Scholar]
- 4. Modarres HP, Mofrad MR & Sanati‐Nezhad A (2016) Protein thermostability engineering. RSC Adv 6, 115252–115270. [Google Scholar]
- 5. Polizzi KM, Bommarius AS, Broering JM & Chaparro‐Riggers JF (2007) Stability of biocatalysts. Curr Opin Chem Biol 11, 220–225. [DOI] [PubMed] [Google Scholar]
- 6. Samra HS & He F (2012) Advancements in high throughput biophysical technologies: applications for characterization and screening during early formulation development of monoclonal antibodies. Mol Pharm 9, 696–707. [DOI] [PubMed] [Google Scholar]
- 7. Chaudhuri R, Cheng Y, Middaugh CR & Volkin DB (2014) High‐throughput biophysical analysis of protein therapeutics to examine interrelationships between aggregate formation and conformational stability. AAPS J 16, 48–64. [DOI] [PMC free article] [PubMed] [Google Scholar]
- 8. Senisterra GA & Finerty PJ Jr (2009) High throughput methods of assessing protein stability and aggregation. Mol BioSyst 5, 217–223. [DOI] [PubMed] [Google Scholar]
- 9. Wang S, Yu S, Siedler M, Ihnat PM, Filoti DI, Lu M & Zuo L (2018) A power compensated differential scanning calorimeter for protein stability characterization. Sens Actuators B 256, 946–952. [Google Scholar]
- 10. lexander CG, Wanner R, Johnson CM, Breitsprecher D, Winter G, Duhr S, Baaske P & Ferguson N (2014) Novel microscale approaches for easy, rapid determination of protein stability in academic and commercial settings. Biochim Biophys Acta 1844, 2241–2250. [DOI] [PMC free article] [PubMed] [Google Scholar]
- 11. Joshi V, Shivach T, Yadav N & Rathore AS (2014) Circular dichroism spectroscopy as a tool for monitoring aggregation in monoclonal antibody therapeutics. Anal Chem 86, 11606–11613. [DOI] [PubMed] [Google Scholar]
- 12. Pantoliano MW, Petrella EC, Kwasnoski JD, Lobanov VS, Myslik J, Graf E, Carver T, Asel E, Springer BA, Lane P et al (2001) High‐density miniaturized thermal shift assays as a general strategy for drug discovery. J Biomol Screen 6, 429–440. [DOI] [PubMed] [Google Scholar]
- 13. Lavinder JJ, Hari SB, Sullivan BJ & Magliery TJ (2009) High‐throughput thermal scanning: a general, rapid dye‐binding thermal shift screen for protein engineering. J Am Chem Soc 131, 3794–3795. [DOI] [PMC free article] [PubMed] [Google Scholar]
- 14. Ericsson UB, Hallberg BM, DeTitta GT, Dekker N & Nordlund P (2006) Thermofluor‐based high‐throughput stability optimization of proteins for structural studies. Anal Biochem 357, 289–298. [DOI] [PubMed] [Google Scholar]
- 15. Groftehauge MK, Hajizadeh NR, Swann MJ & Pohl E (2015) Protein‐ligand interactions investigated by thermal shift assays (TSA) and dual polarization interferometry (DPI). Acta Crystallogr D 71, 36–44. [DOI] [PMC free article] [PubMed] [Google Scholar]
- 16. Wedde S, Kleusch C, Bakonyi D & Groeger H (2017) High‐throughput feasible screening tool for determining enzyme stabilities against organic solvents directly from crude extracts. ChemBioChem 18, 2399–2403. [DOI] [PubMed] [Google Scholar]
- 17. Kwon K & Peterson SN (2014) High‐throughput cloning for biophysical applications. Methods Mol Biol 1140, 61–74. [DOI] [PubMed] [Google Scholar]
- 18. Bommarius AS & Paye MF (2013) Stabilizing biocatalysts. Chem Soc Rev 42, 6534–6565. [DOI] [PubMed] [Google Scholar]
- 19. Bloom JD, Labthavikul ST, Otey CR & Arnold FH (2006) Protein stability promotes evolvability. Proc Natl Acad Sci USA 103, 5869–5874. [DOI] [PMC free article] [PubMed] [Google Scholar]
- 20. Bershtein S, Segal M, Bekerman R, Tokuriki N & Tawfik DS (2006) Robustness‐epistasis link shapes the fitness landscape of a randomly drifting protein. Nature 444, 929–932. [DOI] [PubMed] [Google Scholar]
- 21. Lo M‐C, Aulabaugh A, Jin G, Cowling R, Bard J, Malamas M & Ellestad G (2004) Evaluation of fluorescence‐based thermal shift assays for hit identification in drug discovery. Anal Biochem 332, 153–159. [DOI] [PubMed] [Google Scholar]
- 22. Kaul P & Asano Y (2012) Strategies for discovery and improvement of enzyme function: state of the art and opportunities. Microb Biotechnol 5, 18–33. [DOI] [PMC free article] [PubMed] [Google Scholar]
- 23. Reetz MT (2001) Combinatorial and evolution‐based methods in the creation of enantioselective catalysts. Angew Chem Int Ed 40, 284–310. [PubMed] [Google Scholar]
- 24. Barbas CF III, Wang YF & Wong CH (1990) Deoxyribose‐5‐phosphate aldolase as a synthetic catalyst. J Am Chem Soc 112, 2013–2014. [Google Scholar]
- 25. Patel JM (2009) Biocatalytic synthesis of atorvastatin intermediates. J Mol Catal B Enzym 61, 123–128. [Google Scholar]
- 26. Greenberg WA, Varvak A, Hanson SR, Wong K, Huang H, Chen P & Burk MJ (2004) Development of an efficient, scalable, aldolase‐catalyzed process for enantioselective synthesis of statin intermediates. Proc Natl Acad Sci USA 101, 5788–5793. [DOI] [PMC free article] [PubMed] [Google Scholar]
- 27. Jiao X‐C, Pan J, Xu G‐C, Kong X‐D, Chen Q, Zhang Z‐J & Xu J‐H (2015) Efficient synthesis of a statin precursor in high space‐time yield by a new aldehyde‐tolerant aldolase identified from Lactobacillus brevis . Catal Sci Technol 5, 4048–4054. [Google Scholar]
- 28. Sakuraba H, Yoneda K, Yoshihara K, Satoh K, Kawakami R, Uto Y, Tsuge H, Takahashi K, Hori H & Ohshima T (2007) Sequential aldol condensation catalyzed by hyperthermophilic 2‐deoxy‐D‐ribose‐5‐phosphate aldolase. Appl Environ Microbiol 73, 7427–7434. [DOI] [PMC free article] [PubMed] [Google Scholar]
- 29. Lokanath NK, Shiromizu I, Ohshima N, Nodake Y, Sugahara M, Yokoyama S, Kuramitsu S, Miyano M & Kunishima N (2004) Structure of aldolase from Thermus thermophilus HB8 showing the contribution of oligomeric state to thermostability. Acta Crystallogr D 60, 1816–1823. [DOI] [PubMed] [Google Scholar]
- 30. Schafer F, Romer U, Emmerlich M, Blumer J, Lubenow H & Steinert K (2002) Automated high‐throughput purification of 6xHis‐tagged proteins. J Biomol Tech 13, 131–142. [PMC free article] [PubMed] [Google Scholar]
- 31. Johnson BH & Hecht MH (1994) Recombinant proteins can be isolated from E. coli cells by repeated cycles of freezing and thawing. Bio/Technology 12, 1357–1360. [DOI] [PubMed] [Google Scholar]
- 32. Leung KF, Dacks JB & Field MC (2008) Evolution of the multivesicular body ESCRT machinery; retention across the eukaryotic lineage. Traffic 9, 1698–1716. [DOI] [PubMed] [Google Scholar]
- 33. Cerdobbel A, De Winter K, Aerts D, Kuipers R, Joosten H‐J, Soetaert W & Desmet T (2011) Increasing the thermostability of sucrose phosphorylase by a combination of sequence‐ and structure‐based mutagenesis. Protein Eng Des Sel 24, 829–834. [DOI] [PubMed] [Google Scholar]
- 34. Kaneko H, Minagawa H & Shimada J (2005) Rational design of thermostable lactate oxidase by analyzing quaternary structure and prevention of deamidation. Biotechnol Lett 27, 1777–1784. [DOI] [PubMed] [Google Scholar]
- 35. Lehmann M, Pasamontes L, Lassen SF & Wyss M (2000) The consensus concept for thermostability engineering of proteins. Biochim Biophys Acta 1543, 408–415. [DOI] [PubMed] [Google Scholar]
- 36. Farnoosh G, Khajeh K, Latifi AM & Aghamollaei H (2016) Engineering and introduction of de novo disulphide bridges in organophosphorus hydrolase enzyme for thermostability improvement. J Biosci 41, 577–588. [DOI] [PubMed] [Google Scholar]
- 37. Russell RJM & Taylor GL (1995) Engineering thermostability: lessons from thermophilic proteins. Curr Opin Biotechnol 6, 370–374. [DOI] [PubMed] [Google Scholar]
- 38. Kuipers RK, Joosten H‐J, van Berkel WJH, Leferink NGH, Rooijen E, Ittmann E, van Zimmeren F, Jochens H, Bornscheuer U, Vriend G et al (2010) 3DM: systematic analysis of heterogeneous superfamily data to discover protein functionalities. Proteins 78, 2101–2113. [DOI] [PubMed] [Google Scholar]
- 39. Thai Y‐C, Szekrenyi A, Qi Y, Black GW, Charnock SJ & Fessner W‐D (2018) Fluorogenic kinetic assay for high‐throughput discovery of stereoselective ketoreductases relevant to pharmaceutical synthesis. Bioorg Med Chem 26, 1320–1326. [DOI] [PubMed] [Google Scholar]
- 40. Abdoul‐Zabar J, Sorel I, Helaine V, Charmantray F, Devamani T, Yi D, de Berardinis V, Louis D, Marliere P, Fessner W‐D et al (2013) Thermostable transketolase from Geobacillus stearothermophilus: characterization and catalytic properties. Adv Synth Catal 355, 116–128. [Google Scholar]
- 41. Junker S, Roldan R, Joosten H‐J, Clapés P & Fessner W‐D (2018) Complete switch of reaction specificity of an aldolase by directed evolution in vitro: synthesis of generic aliphatic aldol products. Angew Chem Int Ed 57, 10153–10157. [DOI] [PMC free article] [PubMed] [Google Scholar]
- 42. Canchi DR & Garcia AE (2013) Cosolvent effects on protein stability. Annu Rev Phys Chem 64, 273–293. [DOI] [PubMed] [Google Scholar]
- 43. Khmelnitsky YL, Mozhaev VV, Belova AB, Sergeeva MV & Martinek K (1991) Denaturation capacity: a new quantitative criterion for selection of organic solvents as reaction media in biocatalysis. Eur J Biochem 198, 31–41. [DOI] [PubMed] [Google Scholar]
- 44. Reetz MT, Soni P, Fernandez L, Gumulya Y & Carballeira JD (2010) Increasing the stability of an enzyme toward hostile organic solvents by directed evolution based on iterative saturation mutagenesis using the B‐FIT method. Chem Commun 46, 8657–8658. [DOI] [PubMed] [Google Scholar]
- 45. Dick M, Weiergraeber OH, Classen T, Bisterfeld C, Bramski J, Gohlke H & Pietruszka J (2016) Trading off stability against activity in extremophilic aldolases. Sci Rep 6, 17908. [DOI] [PMC free article] [PubMed] [Google Scholar]
- 46. Thorell S, Schrmann M, Sprenger GA & Schneider G (2002) Crystal structure of decameric fructose‐6‐phosphate aldolase from Escherichia coli reveals inter‐subunit helix swapping as a structural basis for assembly differences in the transaldolase family. J Mol Biol 319, 161–171. [DOI] [PubMed] [Google Scholar]
- 47. Saravanan T, Junker S, Kickstein M, Hein S, Link M‐K, Ranglack J, Witt S, Lorilliere M, Hecquet L & Fessner W‐D (2017) Donor promiscuity of a thermostable transketolase by directed evolution: efficient complementation of 1‐deoxy‐D‐xylulose‐5‐phosphate synthase activity. Angew Chem Int Ed 56, 5358–5362. [DOI] [PubMed] [Google Scholar]
- 48. Lindqvist Y, Schneider G, Ermler U & Sundstroem M (1992) Three‐dimensional structure of transketolase, a thiamin diphosphate dependent enzyme, at 2.5 Å resolution. EMBO J 11, 2373–2379. [DOI] [PMC free article] [PubMed] [Google Scholar]
- 49. Kumar DP, Tiwari A & Bhat R (2004) Effect of pH on the stability and structure of yeast hexokinase A: acidic amino acid residues in the cleft region are critical for the opening and the closing of the structure. J Biol Chem 279, 32093–32099. [DOI] [PubMed] [Google Scholar]
- 50. Pace CN and Shaw KL (2000) Linear extrapolation method of analyzing solvent denaturation curves. Proteins Struct Funct Genet Suppl 4, 1–7. [DOI] [PubMed] [Google Scholar]
- 51. Metrick MA & MacDonald G (2015) Hofmeister ion effects on the solvation and thermal stability of model proteins lysozyme and myoglobin. Colloids Surf A 469, 242–251. [Google Scholar]
- 52. Pace CN & McGrath T (1980) Substrate stabilization of lysozyme to thermal and guanidine hydrochloride denaturation. J Biol Chem 255, 3862–3865. [PubMed] [Google Scholar]
- 53. Senisterra GA, Hong BS, Park H‐W & Vedadi M (2008) Application of high‐throughput isothermal denaturation to assess protein stability and screen for ligands. J Biomol Screen 13, 337–342. [DOI] [PubMed] [Google Scholar]
- 54. Sols A, de la Fuente Sanchez G, Villar‐Palasi C & Asensio C (1958) Substrate specificity and other properties of bakers’ yeast hexokinase. Biochim Biophys Acta 30, 92–101. [DOI] [PubMed] [Google Scholar]
- 55. Beg I, Minton AP, Islam A, Hassan MI & Ahmad F (2017) The pH dependence of saccharides’ influence on thermal denaturation of two model proteins supports an excluded volume model for stabilization generalized to allow for intramolecular electrostatic interactions. J Biol Chem 292, 505–511. [DOI] [PMC free article] [PubMed] [Google Scholar]
- 56. Kuser PR, Krauchenco S, Antunes OAC & Polikarpov I (2000) The high resolution crystal structure of yeast hexokinase PII with the correct primary sequence provides new insights into its mechanism of action. J Biol Chem 275, 20814–20821. [DOI] [PubMed] [Google Scholar]
- 57. Toews CJ (1966) Kinetic studies with skeletal‐muscle hexokinase. Biochem J 100, 739–744. [DOI] [PMC free article] [PubMed] [Google Scholar]
- 58. Jerabek‐Willemsen M, Wienken CJ, Braun D, Baaske P & Duhr S (2011) Molecular interaction studies using microscale thermophoresis. Assay Drug Dev Technol 9, 342–353. [DOI] [PMC free article] [PubMed] [Google Scholar]
- 59. Seidel SAI, Wienken CJ, Geissler S, Jerabek‐Willemsen M, Duhr S, Reiter A, Trauner D, Braun D & Baaske P (2012) Label‐free microscale thermophoresis discriminates sites and affinity of protein‐ligand binding. Angew Chem Int Ed 51, 10656–10659. [DOI] [PMC free article] [PubMed] [Google Scholar]
- 60. Hanahan D (1983) Studies on transformation of Escherichia coli with plasmids. J Mol Biol 166, 557–580. [DOI] [PubMed] [Google Scholar]
- 61. Bertani G (1951) Studies on lysogenesis. I. The mode of phage liberation by lysogenic Escherichia coli . J Bacteriol 62, 293–300. [DOI] [PMC free article] [PubMed] [Google Scholar]
- 62. Studier FW (2005) Protein production by auto‐induction in high‐density shaking cultures. Protein Exp Purif 41, 207–234. [DOI] [PubMed] [Google Scholar]
- 63. Ahn T, Yim S‐K, Choi H‐I & Yun C‐H (2001) Polyacrylamide gel electrophoresis without a stacking gel: Use of amino acids as electrolytes. Anal Biochem 291, 300–303. [DOI] [PubMed] [Google Scholar]
- 64. Wondrak EM (2001) Process for fast visualization of protein. US Patent Application No. US6319720B1.


