

Abstract
Objectives
The fraction of the population that reaches the age of 100 years is growing. At this age, dementia incidence is high and cognitive functioning is highly variable across individuals. Normative data for neuropsychological tests are lacking in centenarians, which hampers the ability to evaluate their cognitive functioning for both research and clinical practice. Here, we generated norms for neuropsychological tests in a sample of cognitively healthy centenarians while taking sensory impairments into account.
Design
Cross‐sectional cohort study.
Setting
Centenarians who participate in the prospective 100‐plus Study.
Participants
A total of 235 centenarians (71.5% female), who self‐reported to be cognitively healthy, which was confirmed by an informant and a trained researcher.
Measurements
We generated normative data for 15 cognitive tests, measuring global cognition (Mini‐Mental State Examination [MMSE]), premorbid intelligence, attention, language, memory, executive function, and visuospatial function by multiple linear regressions and/or by reporting percentiles.
Results
Normative data for global cognition resulted in a mean MMSE score of 25.6 ± 3.1 (range = 17‐30; interquartile range = 24‐28). Vision problems and fatigue often complicated the ability to complete tests, and these problems explained 41% and 22% of the missing test scores, respectively. In contrast, hearing problems (4%) and task incomprehension (6%) rarely complicated test performance. While educational level was associated with performance on the majority of the tests, sex and age were only weakly associated with test performance.
Conclusions
We generated normative data for 15 common neuropsychological tests in a large sample of cognitively healthy centenarians, while taking age‐related sensory impairments into consideration. These normative data allow the detection of deficits across a wide range of cognitive domains. Our results suggest that, next to education level, vision ability and the level of fatigue should be taken into account when evaluating cognitive functioning in centenarians. J Am Geriatr Soc 67:759–767, 2019.
Keywords: normative data, oldest‐old, centenarians, neuropsychological tests, cognitive functioning
In the next 30 years, the number of centenarians worldwide is expected to increase almost 20‐fold to 3.2 million people.1 Dementia incidence increases exponentially with age and reaches approximately 40% per year at the age of 100 years.2 Previous studies indicated that, an estimated 25% of the centenarians have retained their cognitive health, while 25% have symptoms of cognitive impairment and 50% may be regarded as having dementia.3, 4 To evaluate cognitive impairment in this heterogeneous group, it is important to implement suitable instruments that consider the specific characteristics of centenarians.5
Cognitive test performance of centenarians is often evaluated relative to normative data generated in younger adults. However, norms derived in younger samples may not account for cognitive decline as part of the normal aging process.6 Applying these norms to evaluate cognitive functioning in centenarians may lead to misclassifications of cognitive impairment.7 Indeed, relative to 80 and 90 year olds, centenarians appear to have significantly lower test scores in multiple cognitive domains, while showing a larger variability in their performance.8, 9, 10 This suggests that cognitive performance of the oldest‐old can only be accurately assessed relative to norms generated in cohorts with narrow age bands.11
Thus far, normative data for centenarians is available for the Mini‐Mental State Examination (MMSE),9, 12, 13, 14, 15 which measures global cognitive functioning. However, to evaluate a broad spectrum of cognitive domains, application of additional tests is required.
The Georgia Centenarian Study evaluated test performance of centenarians across multiple cognitive domains, among which, the Controlled Oral Word Association Test, the Fuld Object Memory Evaluation and Severe Impairment Battery, and the Behavioral Dyscontrol Scale.9, 10, 16, 17 However, these norms were not adjusted for loss of hearing and sight and were generated in population‐based samples, possibly including centenarians with cognitive impairment.18 This may lead to lower norm ranges for cognitive tests, which complicates making a distinction between cognitive impairment and cognitive health in a clinical setting.18
Therefore, cognitive test performance of centenarians should be evaluated relative to normative data generated in a cognitively intact sample, while taking sensory disabilities into account. The 90+ Study previously included nondemented people from different age bands (90‐91, 92‐94, and 95 years and older) to provide suitable normative data.19 Despite test adaptations that compensated for sensory losses, some tests could not be completed due to sensory impairments. This emphasizes that it is important to consider the decline of these faculties when establishing normative data.
Here, we aim to generate robust normative data for the evaluation of cognitive functioning in centenarians, while considering sensory impairments. For this, we used a large sample of cognitively healthy centenarians from the Dutch 100‐plus Study.20
Methods
Population
Subjects were part of the 100‐plus Study, a longitudinal cohort study of people (1) aged 100 years or older, (2) who self‐reported to be cognitively healthy, which was confirmed by the study partner. For this study, we implemented the following exclusion criteria: (1) cognitive impairment, as estimated by a trained researcher; and (2) no neuropsychological test scores available, which leaves a total sample of N = 235 (see flowchart in the supplementary). Furthermore, depending on the test requirements, we additionally excluded centenarians with poor‐very poor vision and hearing.
Participants were recruited by searching different types of (online) media that mention centenarians and by mouth‐to‐mouth advertisement. A further description of inclusion and recruitment procedures can be found elsewhere.20 This study was approved by the Medical Ethics Committee, and all participants provided informed consent.
Procedure
The centenarians were visited at home by researchers with neuropsychological and/or medical training. The researchers estimated the cognitive health of the centenarians based on semi‐objective criteria. Centenarians were estimated to be cognitively impaired when they continually repeated themselves, had difficulty understanding or remembering questions, and had difficulty with naming and/or word finding. Vision and hearing were categorized into “good,” “moderate,” “poor,” and “very poor” based on the observations of the study researcher and the self‐reported rating of hearing and vision abilities (see supplementary). Centenarians with poor to very poor vision were excluded for the generation of normative data of the MMSE, the Key Search test, the Dutch Adult Reading Test (DART), the Visual Association Test (VAT), the Trail Making Test (TMT), Number Location, and the Clock Drawing Test (CDT). Centenarians with poor to very poor hearing were excluded from reporting normative data of the MMSE, Digit Span, and the Rivermead Behavioral Memory Test (RBMT).
Neuropsychological Testing
As some participants were frail and depended on help from caregivers or family members, we encouraged a close relation to be present during our visits. We requested the close relation to not interfere during test administration. The test battery took approximately 1.5 hours to complete, and we took short breaks whenever centenarians showed signs of fatigue. We encouraged participants to use all available devices to support their vision and/or hearing. Tests were aborted when sensory problems clearly interfered with test performance. Based on the observations of the study researcher and the self‐report of the centenarians, we annotated the reasons for interference with test completion: physical, vision or hearing problems, fatigue, or incapable of understanding tasks or instructions.
Measures
Neuropsychological Tests
The neuropsychological test battery consisted of 15 tests measuring global cognition, premorbid intelligence, attention and/or concentration, language, memory, executive function, and visuospatial function. See supplementary data for more detailed information on properties of these tests. At the start of the study, the test battery was limited to the MMSE and CDT but expanded gradually over the course of the study with tests that allow the evaluation of specific cognitive domains. For this reason, not all centenarians were presented with the same battery or the same number of tests.
The MMSE was used to evaluate global cognition.21 We addressed premorbid intelligence using the DART,22, 23, 24 in which subjects are asked to read out loud 50 words with atypical phonemic pronunciation. These words were presented in an enlarged font size to take into account possible visual difficulties. The Digit Span was used to evaluate attention/concentration (forward condition) and working memory (backward condition).25 The forward condition requires subjects to repeat sequences of digits that increase in length, whereas in the backward condition, sequences of digits have to be repeated in reverse order. We evaluated processing speed and attention using the TMT A, and mental flexibility using the TMT B, which respectively requires subjects to connect dots of numbers in numerical order and alternate between numbers and letters in numerical and alphabetical sequence.26 If the centenarians were not determined to proceed after 180 seconds (TMT A) and 300 seconds (TMT B), the test was aborted and scores were extrapolated based on the last finished item (number or letter) and the time spent on the test. The Dutch version of the Controlled Oral Word Association Test (naming words from initial letters) and Category fluency (naming animals) were administered to evaluate executive functioning and language, the latter also assessing semantic memory.27, 28 To evaluate executive functioning, we administered the Key Search subtest of the Behavioral Assessment of the Dysexecutive Syndrome Test Battery29 involving a problem‐solving task instructing subjects to think of a strategy to find a lost key. Memory was measured with the story recall subtest of the Dutch version of the RBMT and the VAT.30, 31, 32 The RBMT requires subjects to immediately repeat all items they remember from two stories read out loud, and again after a 15‐minute interval. When necessary, a cue was given for helping them recall the story line, which was considered when calculating the total score. We made two adaptations to the test procedure: (1) two stories were read instead of one to improve reliability; (2) during recall, all remembered items were scored, whether they belonged to the appropriate story line or not. The VAT involves subjects to name two visual items shown in one picture (eg, a hedgehog on a chair), of which one item (hedgehog) needs to be recalled afterwards while the other (the chair without the hedgehog) is used as a cue. We used naming of the items as an additional measure of language functioning. Visuospatial orientation was assessed with the Number Location subtest of the Visual Object and Space Perception Battery,33 which required subjects to indicate a specific number that corresponded with the exact location of a dot. For evaluating visuospatial construction, subjects were instructed to draw a clock with the hands at 10 past 11 (CDT). Because of common tremors in centenarians, the CDT was offered with a predrawn circle and was scored according to a method that does not consider the drawing of the circle.34, 35
Demographic and Clinical Measures
Education level was determined based on the International Standard Classification of Education 199736 and was divided into “low” (upper secondary education or less) and “high” (post‐secondary non tertiary education or more). Independence in activities of daily living (ADLs) was evaluated with the Barthel Index.37 Scores range from 0 to 20, with scores of 15 or greater indicating independence in ADLs. The 15‐item version of the Geriatric Depression Scale (GDS) was administered to investigate depression.38 Scores range from 0 to 15, with scores greater than 5 suggesting depressive symptoms.
Data Analysis
We generated normative data by applying multiple linear regression models to the data, and by representing test scores in percentiles. Regression analyses with age, sex, and education as independent variables and scores as dependent variables were performed for each test separately. TMT scores were log‐transformed as they were not normally distributed and inverted, such that higher scores indicated better performance. Because of ceiling effects, the VAT, Number Location, and the CDT were not analyzed using regression models. For all tests, scores were standardized into z‐scores to (I) correlate the number of tests the centenarians were able to complete with their overall mean z‐score and (II) visualize the distribution of the scores using boxplots. P < .05 was considered significant. Statistical analyses were performed using SPSS 22.0 (IBM Corp., Armonk, NY) and R 3.4.2 (The R Foundation, https://www.r-project.org/).
Results
Demographic and Clinical Characteristics
The 235 centenarians had a median age of 100.4 years (range = 100‐107 years) and included 168 females (72%). The majority of the centenarians (59%) lived independently, 79% were independently mobile, and 54% were independent in ADLs. Most of the centenarians retained moderate‐good vision (77%) and hearing capacities (88%). The majority (62%) had a basic‐low education level. Most centenarians (92%) did not show depressive symptoms, as measured with the GDS. Clinical and demographic characteristics are summarized in Table 1.
Table 1.
Demographic and Clinical Characteristics of the Sample (n = 235)a
| Characteristic | Value |
|---|---|
| Age, y | |
| Median (IQR) | 100.4 (100.2‐102) |
| Mean (SD) | 101.1 (1.4) |
| Range | 100‐107 |
| Female sex, No. (%) | 168 (72) |
| Education, No. (%)b | |
| High level | 90 (38) |
| Low level | 145 (62) |
| Vision, No. (%) | |
| Good | 153 (65) |
| Moderate | 27 (12) |
| Poor | 29 (12) |
| Very poor | 22 (9) |
| Hearing, No. (%) | |
| Good | 134 (57) |
| Moderate | 73 (31) |
| Poor | 21 (9) |
| Very poor | 4 (2) |
| Living situation, No. (%) | |
| Independent without assistance, or in a residence with available service | 138 (59) |
| In a residential care center | 85 (36) |
| In a nursing home | 2 (1) |
| With family | 10 (4) |
| Barthel Index, No. (%)c | |
| ≥15, Independent in ADLs | 126 (54) |
| <15, Dependent in ADLs | 80 (34) |
| GDS >5, depressive symptoms, No. (%)d | 19 (8) |
| Mobility, No. (%) | |
| Able to walk independentlye | 185 (79) |
| Able to walk with help of another person | 8 (3) |
| Able to move independently in a wheelchair | 14 (6) |
| Not able to move independently in a wheelchair | 12 (5) |
Abbreviations: ADLs, activity of daily living; GDS, Geriatric Depression Scale; IQR, interquartile range; SD, Standard Deviation.
There were 3 missing values for hearing, 4 for vision, 16 for mobility, 45 for the GDS, and 29 for the Barthel Index.
High education level indicates post‐secondary non tertiary education or higher; low education level, upper secondary education or lower.
Scores range from 0 to 20.
Scores range from 0 to 15.
With or without help of a walking stick or walker.
Influence of Age‐Related (Sensory) Impairments on Test Incompletion
Across all tests applied, an average of 79% of the tests were completed by the centenarians (Table 2). While greater than 95% of the centenarians completed both fluency tasks, only 45% were able to complete TMT B. Difficulties with vision (41%) and fatigue (22%) were the most common reasons for not being able to complete a test, whereas hearing impairment only rarely complicated test completion (4%). In some cases, not understanding the test and/or test instructions was a reason for not completing the Number Location (16%), Key Search (14%), and TMT B (23%). Overall, we found a positive correlation between the number of tests the centenarians were able to complete and the mean z‐score across all completed tests (Pearson's correlation, r = 0.35, P < .001), see supplemental data.
Table 2.
Overview of Number of Tests Used for Generating Normative Dataa
| Tests | No. of Tests Presented | No. (%) of Tests Completed | Reasons for Test Incompletion, % | No. of Tests After Exclusion for Sensory Losses | |||||
|---|---|---|---|---|---|---|---|---|---|
| No Compr. | Fatigue | Hearing | Vision | Several | Otherb | ||||
| MMSE | 235 | 177 (75) | 0 | 0 | 9 | 60 | 12 | 19 | 151c, d |
| RBMT | 201 | 175 (87) | 0 | 23 | 42 | 0 | 0 | 35 | 167d |
| Number Location | 201 | 152 (76) | 16 | 10 | 0 | 63 | 0 | 10 | 142c |
| Key Search | 209 | 152 (73) | 14 | 19 | 0 | 47 | 4 | 16 | 138c |
| Clock Drawing Test | 234 | 181 (77) | 0 | 13 | 0 | 60 | 6 | 21 | 162c |
| Letter Fluency | 226 | 214 (95) | 0 | 50 | 0 | 0 | 0 | 50 | 214 |
| Animal Fluency 1 min | 203 | 196 (97) | 0 | 43 | 0 | 0 | 0 | 57 | 196 |
| Animal Fluency 2 min | 204 | 196 (96) | 0 | 50 | 0 | 0 | 0 | 50 | 196 |
| VAT Memory | 229 | 178 (78) | 0 | 22 | 0 | 57 | 0 | 22 | 156c |
| VAT Naming | 206 | 153 (74) | 0 | 19 | 0 | 53 | 0 | 28 | 132c |
| Digit Span Forward | 218 | 178 (82) | 0 | 40 | 13 | 0 | 3 | 45 | 163d |
| Digit Span Backward | 218 | 180 (83) | 0 | 47 | 13 | 0 | 3 | 37 | 165d |
| TMT A | 202 | 133 (66) | 1 | 26 | 0 | 49 | 7 | 16 | 127c |
| TMT B | 202 | 91 (45) | 23 | 19 | 0 | 32 | 8 | 19 | 90c |
| DART | 228 | 169 (74) | 0 | 24 | 0 | 58 | 2 | 17 | 153c |
| Average | 214 | 168 (79) | 6 | 22 | 4 | 41 | 4 | 23 | |
Abbreviations: DART, Dutch Adult Reading Test; MMSE, Mini‐Mental State Examination; No Compr., no comprehension of tests and/or test instructions; RBMT, Rivermead Behavioral Memory Test; TMT, Trail Making Test; VAT, Visual Association Test.
Columns represent, respectively: total number of tests that the centenarians were subjected to, total number of tests that could be completed, reasons for inability to complete tests, and total number of tests used for generating normative data after exclusion for sensory losses.
Other includes problems with test equipment, reasons were not reported, physical impairments (tremor or motor), or when there was no time left to finish the whole test battery.
Centenarians with poor to very poor vision were excluded.
Centenarians with poor to very poor hearing were excluded.
Normative Data and Cognitive Test Performance In Centenarians
Per test, the number of centenarians whose test performance was used to generate normative data is shown in Table 2. Centenarians with poor to very poor vision (21%) and hearing (11%) were excluded for tests for which these faculties were required.
We present percentiles and means of all test scores stratified by education level to define the normative data (Table 3). Figure 1 shows the distribution of the performances on each test. Overall, most test scores showed wide distributions, while the VAT, Number Location, and the CDT had strong ceiling effects (Table 3). Correlations between the test scores are displayed in the supplement.
Table 3.
Percentiles and Means for Cognitive Test Scores for the Total Sample and Stratified by Education Levela
| Test | Group | No. | Mean | SD | Percentiles | ||||||
|---|---|---|---|---|---|---|---|---|---|---|---|
| 5th | 10th | 25th | 50th | 75th | 90th | 95th | |||||
| MMSE | Total | 151 | 25.6 | 3.1 | 20 | 21 | 24 | 26 | 28 | 29 | 30 |
| HE | 51 | 26.5 | 3.0 | 20 | 22 | 25 | 27 | 29 | 30 | 30 | |
| LE | 100 | 25.2 | 3.1 | 19 | 20 | 23 | 26 | 28 | 29 | 30 | |
| RBMT Immediate Recall | Total | 167 | 8.8 | 4.7 | 2 | 3.5 | 5 | 8 | 12 | 15 | 18 |
| HE | 64 | 10.0 | 5.2 | 2 | 4 | 6 | 9 | 12.5 | 18.5 | 21 | |
| LE | 103 | 8.0 | 4.1 | 2 | 3 | 5 | 7 | 11 | 13.5 | 16 | |
| RBMT Delayed Recall | Total | 167 | 5.3 | 4.4 | 0 | 0 | 2 | 4.5 | 7.5 | 11.5 | 14 |
| HE | 64 | 6.3 | 5.0 | 0 | 1 | 2.5 | 6 | 9 | 13 | 16.5 | |
| LE | 103 | 4.6 | 3.9 | 0 | 0 | 1.5 | 3.5 | 7 | 11 | 12.5 | |
| Number Location | Total | 142 | 8.5 | 2.0 | 4 | 5 | 8 | 9 | 10 | 10 | 10 |
| HE | 47 | 9.0 | 1.2 | 6 | 7 | 9 | 9 | 10 | 10 | 10 | |
| LE | 95 | 8.2 | 2.2 | 4 | 4 | 7 | 9 | 10 | 10 | 10 | |
| Key Search | Total | 138 | 6.7 | 3.6 | 2 | 3 | 4 | 5 | 9 | 13 | 14 |
| HE | 44 | 8.4 | 3.3 | 4 | 4 | 6 | 9 | 11 | 13 | 15 | |
| LE | 94 | 5.8 | 3.5 | 2 | 3 | 3 | 5 | 7 | 12 | 14 | |
| Clock Drawing Test | Total | 162 | 3.4 | 1.3 | 1 | 2 | 2 | 3 | 5 | 5 | 5 |
| HE | 55 | 3.8 | 1.3 | 1 | 2 | 3 | 5 | 5 | 5 | 5 | |
| LE | 107 | 3.2 | 1.3 | 1 | 2 | 2 | 3 | 4 | 5 | 5 | |
| Letter Fluency (letters D‐A‐T) | Total | 214 | 24.4 | 10.5 | 9 | 11 | 17 | 24 | 32 | 38 | 43 |
| HE | 79 | 29.2 | 10.8 | 10 | 16 | 21 | 28 | 35 | 45 | 47 | |
| LE | 135 | 21.6 | 9.3 | 7 | 9 | 14 | 21 | 30 | 33 | 38 | |
| Animal Fluency 1 min | Total | 196 | 11.4 | 4.3 | 6 | 6 | 8 | 11 | 15 | 17 | 19 |
| HE | 71 | 12.2 | 4.7 | 5 | 6 | 8 | 12 | 16 | 19 | 20 | |
| LE | 125 | 10.9 | 3.9 | 6 | 6 | 8 | 11 | 14 | 16 | 18 | |
| Animal Fluency 2 min | Total | 196 | 17.2 | 6.7 | 8 | 9 | 12 | 17 | 21 | 26 | 30 |
| HE | 70 | 18.6 | 7.9 | 7 | 8 | 12 | 18 | 24 | 30 | 33 | |
| LE | 126 | 16.4 | 5.7 | 8 | 9 | 12 | 17 | 20 | 25 | 27 | |
| VAT Memory | Total | 156 | 9.0 | 3.3 | 2 | 4 | 7 | 10 | 12 | 12 | 12 |
| HE | 50 | 9.9 | 2.9 | 2 | 5 | 9 | 11 | 12 | 12 | 12 | |
| LE | 106 | 8.6 | 3.4 | 2 | 4 | 6 | 10 | 12 | 12 | 12 | |
| VAT Naming | Total | 132 | 11.5 | 1.1 | 10 | 10 | 11 | 12 | 12 | 12 | 12 |
| HE | 43 | 11.7 | 0.6 | 11 | 11 | 12 | 12 | 12 | 12 | 12 | |
| LE | 89 | 11.4 | 1.2 | 9 | 10 | 11 | 12 | 12 | 12 | 12 | |
| Digit Span Forward score | Total | 163 | 7.1 | 1.8 | 4 | 5 | 6 | 7 | 8 | 10 | 10 |
| HE | 64 | 8.0 | 1.8 | 4 | 6 | 7 | 8 | 9 | 10 | 11 | |
| LE | 99 | 6.6 | 1.6 | 4 | 5 | 5 | 6 | 8 | 9 | 10 | |
| Digit Span Forward span | Total | 160 | 5.1 | 1.1 | 3 | 4 | 4 | 5 | 6 | 6 | 7 |
| HE | 63 | 5.5 | 1.0 | 3 | 4 | 5 | 6 | 6 | 7 | 7 | |
| LE | 97 | 4.8 | 1.0 | 3 | 4 | 4 | 5 | 6 | 6 | 6 | |
| Digit Span Backward score | Total | 165 | 4.6 | 1.4 | 2 | 3 | 4 | 5 | 5 | 6 | 8 |
| HE | 64 | 5.0 | 1.4 | 3 | 3 | 4 | 5 | 6 | 7 | 8 | |
| LE | 101 | 4.4 | 1.4 | 2 | 3 | 3 | 4 | 5 | 6 | 7 | |
| Digit Span Backward span | Total | 163 | 3.8 | 0.9 | 2 | 3 | 3 | 4 | 4 | 5 | 5 |
| HE | 64 | 3.9 | 0.7 | 3 | 3 | 3 | 4 | 4 | 5 | 5 | |
| LE | 99 | 3.7 | 1.0 | 2 | 3 | 3 | 4 | 4 | 5 | 5 | |
| TMT A time | Total | 127 | 113.1 | 66.9 | 258 | 199 | 134 | 92 | 70 | 58 | 51 |
| HE | 40 | 104.8 | 63.9 | 260 | 202 | 109 | 85 | 65 | 56 | 55 | |
| LE | 87 | 116.9 | 68.3 | 266 | 199 | 140 | 98 | 70 | 60 | 49 | |
| TMT B time | Total | 90 | 310.9 | 171.9 | 753 | 567 | 376 | 286 | 178 | 130 | 113 |
| HE | 34 | 267.0 | 154.6 | 591 | 436 | 299 | 258 | 162 | 122 | 92 | |
| LE | 56 | 337.5 | 177.7 | 763 | 628 | 417 | 303 | 221 | 132 | 118 | |
| DART IQ score | Total | 153 | 98.4 | 13.9 | 75 | 79 | 87 | 99 | 108 | 118 | 122 |
| HE | 52 | 110.6 | 9.9 | 94 | 98 | 104 | 112 | 119 | 124 | 126 | |
| LE | 101 | 92.1 | 11.3 | 74 | 78 | 84 | 92 | 101 | 106 | 110 | |
Abbreviations: DART, Dutch Adult Reading Test; HE, high education; IQ, intelligence quotient; LE, low education; MMSE, Mini‐Mental State Examination; RBMT, Rivermead Behavioral Memory Test; TMT, Trail Making Test; VAT, Visual Association Test.
Score range of the MMSE, 0 to 30; Digit Span Forward and Backward, 0 to 16 (raw score) and 0 to 8 (span); RBMT, 0 to 42 (both Immediate and Delayed Recall); VAT, 0 to 12 (trial 1 + 2); Key Search, 0 to 16 (no time limit); Number Location, 0 to 10; and Clock Drawing Test, 0 to 5. Higher scores indicate better performance, except for the TMT.
Figure 1.
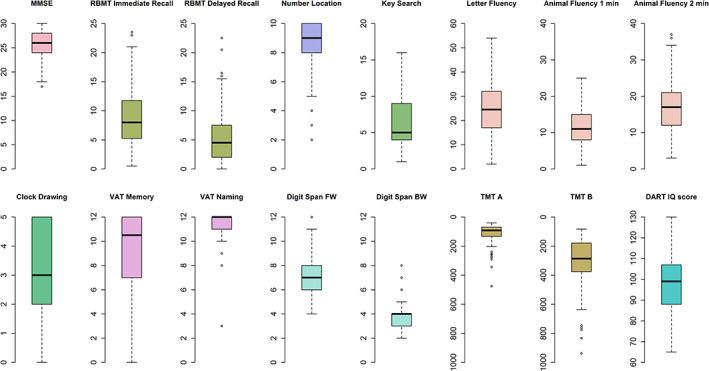
Distribution of test scores. Boxplots represent raw test scores. See footnote in Table 3 for possible range of scores for each test.
BW, backward; DART, Dutch Adult Reading Test; FW, forward; IQ, intelligence quotient; MMSE, Mini‐Mental State Examination; RBMT, Rivermead Behavioral Memory Test; TMT, Trail Making Test; VAT, Visual Association Test.
The regression‐based norms adjusted for sex, age, and education can be obtained from the β values derived from the linear‐regression models (Table 4 and see supplementary for methods). In addition, we provide an Excel file in which these norms can be calculated (see supplementary).
Table 4.
Multiple Linear Regression Analyses With Sex, Age, and Education as Independent Variables and Cognitive Test Outcome as Dependent Variable
| Tests | R 2 | Sex | Age | Education | ||||||
|---|---|---|---|---|---|---|---|---|---|---|
| Unstandardized β | SE | P Value | Unstandardized β | SE | P Value | Unstandardized β | SE | P Value | ||
| MMSE | 0.08 | −0.60 | 0.58 | .30 | −0.28 | 0.23 | .23 | 0.51 | 0.17 | <.001 |
| RBMT Immediate Recall | 0.05 | −0.64 | 0.79 | .42 | −0.10 | 0.31 | .73 | 0.61 | 0.24 | .01 |
| RBMT Delayed Recall | 0.03 | −0.70 | 0.76 | .36 | −0.10 | 0.29 | .73 | 0.45 | 0.23 | .05 |
| Key Search | 0.16 | −1.71 | 0.65 | .01 | −0.04 | 0.26 | .86 | 0.75 | 0.19 | <.001 |
| Letter Fluency | 0.16 | 3.74 | 1.50 | .01 | −0.01 | 0.51 | .98 | 2.66 | 0.43 | <.001 |
| Animal Fluency | ||||||||||
| 1 min | 0.05 | 1.24 | 0.67 | .06 | −0.17 | 0.23 | .46 | 0.54 | 0.20 | .01 |
| 2 min | 0.05 | 1.72 | 1.05 | .10 | −0.26 | 0.36 | .47 | 0.94 | 0.31 | <.001 |
| Digit Span Forward | ||||||||||
| Score | 0.16 | −0.59 | 0.29 | .04 | 0.09 | 0.12 | .43 | 0.41 | 0.09 | <.001 |
| Span | 0.11 | −0.15 | 0.18 | .40 | 0.03 | 0.07 | .64 | 0.23 | 0.05 | <.001 |
| Digit Span Backward | ||||||||||
| Score | 0.06 | 0.20 | 0.24 | .42 | 0.01 | 0.10 | .92 | 0.23 | 0.07 | <.001 |
| Span | 0.04 | 0.12 | 0.16 | .44 | −0.04 | 0.06 | .52 | 0.12 | 0.05 | .01 |
| TMT A time a | 0.07 | 0.05 | 0.09 | .63 | −0.10 | 0.04 | .01 | 0.05 | 0.03 | .09 |
| TMT B time a | 0.07 | 0.23 | 0.12 | .06 | −0.05 | 0.05 | .38 | 0.06 | 0.03 | .08 |
Abbreviations: MMSE, Mini‐Mental State Examination; RBMT, Rivermead Behavioral Memory Test; TMT, Trail Making Test.
TMT scores were log transformed.
Significant values (P <.05) are marked in bold.
Association of Education, Sex, and Age With Cognitive Test Performance
Across all tests, education level was positively associated with test performance when adjusted for age and sex. Exceptions to this are the RBMT delayed recall and TMT A and B. Males obtained higher scores on the Digit Span Forward (mean ± SD = 7.7 ± 1.8 vs 6.9 ± 1.8) and the Key Search (mean ± SD = 8.1 ± 4.1 vs 6.1 ± 3.3) relative to females. On the other hand, males performed worse on the Letter Fluency (mean ± SD = 22.9 ± 10.6 vs 25.0 ± 10.4). Age was only associated with the performance on the TMT A when adjusted for sex and education. The results of these analyses are presented in Table 4.
Discussion
We generated normative data of 15 common neuropsychological tests in a sample of cognitively healthy centenarians, whilst taking sensory impairments into account. Vision impairments and fatigue complicated test completion, while hearing impairments or task incomprehension rarely did. Educational attainment was associated with the performance on almost all tests.
Cognitive Test Performance in Centenarians
Most scores were widely distributed, indicating heterogeneity in cognitive functioning among centenarians. This is in accordance with previous studies, which reported that the variability in cognitive test performance increased with age.8, 9 We observed ceiling effects in VAT, Number Location, and CDT scores, suggesting that these tests are relatively easy to complete, and might be limited in the ability to capture differences in cognitive functions. In line with previous studies, some centenarians had difficulty in completing executive functioning tests, supporting the theory that this domain is particularly vulnerable to decline with normal aging.6, 19 In contrast, almost all centenarians completed the fluency tests with varying results, implying that these are suitable tests for application.
The centenarians within our sample scored, on average, 25.6 ± 3.1 points on the MMSE, which is well above the cut‐off score of 23 points for cognitive impairment in people aged 97 years or older.39 The centenarians within our cohort scored considerably higher than centenarians from population‐based studies, who scored on average between 12.5 to 20 points on the MMSE,9, 12, 13, 40, 41, 42 but similar to US cognitively intact centenarians, who scored on average 24 points.14 Compared to nondemented people older than 95 years from the 90+ Study, the centenarians in our study acquired similar scores on the MMSE, Category and Letter Fluency, Digit Span Backward, and TMT B, while performing worse on the Digit Span Forward and TMT A.19 This suggests that processing speed and attention may decline in the years between 95 and 100 and older, while other domains remain stable.
Influence of Age‐Related (Sensory) Impairments on Test Incompletion
Overall, the ability to complete tests associated with the performance on tests. This emphasizes the importance of considering factors that interfere with test completion when assessing cognitive functions in centenarians. In agreement with previous reports, visual impairment, more so than hearing loss, was the most common reason for test incompletion.19 Hence, we caution that tests that require intact vision ability are not fully applicable in centenarians. Also, fatigue commonly led to test incompletion, suggesting that our battery may have been too extensive for a subset of the centenarians. Therefore, to prevent fatigue from interfering with test performance, tests and test batteries for the oldest‐old should be kept as short as possible.19, 43
Influence of Education, Sex, and Age on Cognitive Test Performance
Consistent with previous findings, education was associated with performance on almost all tests, except for the delayed recall and the TMT.7, 19 Accordingly, we assume that scores of centenarians who attained lower levels of education are represented in the lower range of test scores. Previous studies showed that older adults with lower educational attainment often scored below cut‐off scores on cognitive screening tests, causing an overestimation of cognitive impairment.44, 45, 46 This might explain that some centenarians, while appearing cognitively healthy during study visits, scored less than 23 points on the MMSE, or had lower scores on tests on which the majority obtained high scores. To evaluate cognitive impairment in centenarians, performance on individual tests should be interpreted in context of other test scores on several cognitive domains.
Population‐based centenarian studies indicated that males had an overall better performance on cognitive tests,16, 47 possibly reflecting the higher dementia prevalence in centenarian females.48, 49 Our inclusion criteria may introduce a selection bias for cognitively healthy males and females, which might explain why we observed no clear sex difference in test performance.
Likewise, whereas age is seen to have a major effect on cognitive decline, age was not predictive for cognitive performance in our sample. We expect that, in combination with our inclusion criteria of cognitive health, the interquartile age range of 100 to 101 years was too narrow to identify an effect of age on cognitive performance.
Strengths, Limitations, and Recommendations for Future Research
The availability of a relatively large sample of centenarians allowed us to select centenarians based on cognitive health and to consider sensory difficulties.
Considering the high risk of cognitive impairment in centenarians, we selected the cognitively healthy centenarians based on three semi‐objective criteria. For this, we relied (1) on self‐reported cognitive health, which was (2) confirmed by the study partner and (3) a study researcher. The value of using the clinical impression of the study researcher as a selection criterion was evidenced by previous results of the 100‐plus Study. Centenarians who were estimated to be cognitively impaired by the study researcher had significantly lower test scores compared to those who were regarded cognitively healthy.20
As a result, our cohort represents a high‐performing subselection of centenarians, which is therefore not representative for the general population of centenarians. This may result in higher norm ranges for cognitive tests compared to norm ranges determined in a population‐based sample. The advantage of using these normative data is that they will be more sensitive and robust in distinguishing between cognitively healthy and cognitively impaired centenarians.
Besides sensory impairments, we suggest that fatigue should be considered in the cognitive evaluation of centenarians. In addition, we speculate that some centenarians were anxious for the cognitive assessment, which may have further influenced test performance, especially for the first few tests. We propose that future normative data should be adjusted for symptoms of fatigue and nervousness as they may differentially influence test performance according to the order in which tests are administered. Our finding that impaired vision is the most prevalent reason for test incompletion indicates that new tests should be designed to be applicable regardless of vision impairments.
Conclusion
The normative data generated in the current study allow clinicians and researchers to distinguish between cognitively healthy and cognitively impaired centenarians. When assessing cognitive functioning in centenarians, vision impairment, fatigue, and education level should be considered.
Supporting information
Table S1. Categorization of Vision and Hearing.
Table S2. Measurement Properties of the Neuropsychological Tests.
Table S3. Regression Coefficients for Sex, Age, and Education.
Table S4. Regression Formulas to Calculate Regression‐Based Norms.
Table S5. Pearson Correlations Among Cognitive Test Scores.
Figure S1. Flowchart of study inclusion.
Figure S2. Associations between the number of completed tests and overall cognitive test performance.
Supplementary Data. Calculating regression‐based normative data.
Acknowledgments
We are grateful for the collaborative efforts of all participating centenarians and their family members and/or relations. We acknowledge the people who visited and/or recruited the centenarians. We thank Sven van der Lee, Niccolò Tesi, and Wiesje van der Flier, who advised on the analyses and presentation of the normative data.
Financial Disclosure: Research of the Alzheimer Center Amsterdam is part of the neurodegeneration research program of Amsterdam Neuroscience. This work was funded by Stichting Alzheimer Nederland (WE09.2014‐03), Stichting Dioraphte (VSM 14 04 1402), and Stichting VUmc Fonds.
Conflicts of Interest: The authors have no conflicts of interest to report.
Author Contributions: Study concept and design: N.B., S.A.M.S., M.H., B.S., and H.H. Acquisition of subjects and/or data: N.B., M.H., and H.H. Analysis and interpretation of data: N.B., S.A.M.S., M.H., B.S., and H.H. Preparation of manuscript: N.B., S.A.M.S., M.H., B.S., P.S., and H.H.
Sponsor's Role: None.
References
- 1.United Nations, New York, NY. Department of Economic and Social Affairs. (2002). World population ageing, 1950‐2050. United Nations Publications.
- 2. Corrada MM, Brookmeyer R, Paganini‐Hill A, Berlau D, Kawas CH. Dementia incidence continues to increase with age in the oldest old: the 90+ study. Ann Neurol. 2010;67:114‐121. [DOI] [PMC free article] [PubMed] [Google Scholar]
- 3. Peltz CB, Corrada MM, Berlau DJ, Kawas CH. Cognitive impairment in nondemented oldest‐old: prevalence and relationship to cardiovascular risk factors. Alzheimer's Dementia. 2012;8:87‐94. [DOI] [PMC free article] [PubMed] [Google Scholar]
- 4. Poon LW, Woodard JL, Stephen Miller L, et al. Understanding dementia prevalence among centenarians. J Gerontol A Biol Sci Med Sci. 2012;67:358‐365. [DOI] [PMC free article] [PubMed] [Google Scholar]
- 5. Arosio B, Ostan R, Mari D, et al. Cognitive status in the oldest old and centenarians: a condition crucial for quality of life methodologically difficult to assess. Mech Ageing Dev. 2017;165:185‐194. [DOI] [PubMed] [Google Scholar]
- 6. Harada CN, Natelson Love MC, Triebel KL. Normal cognitive aging. Clin Geriatr Med. 2013;29:737‐752. [DOI] [PMC free article] [PubMed] [Google Scholar]
- 7. Beeri MS, Schmeidler J, Sano M, et al. Age, gender, and education norms on the CERAD neuropsychological battery in the oldest old. Neurology. 2006;67:1006‐1010. [DOI] [PMC free article] [PubMed] [Google Scholar]
- 8. Hagberg B, Bauer Alfredson B, Poon LW, Homma A. Cognitive functioning in centenarians: a coordinated analysis of results from three countries. J Gerontol Ser B Psychol Sci Soc Sci. 2001;56:P141‐P151. [DOI] [PubMed] [Google Scholar]
- 9. Miller LS, Mitchell MB, Woodard JL, et al. Cognitive performance in centenarians and the oldest old: norms from the Georgia centenarian study. Neuropsychol Dev Cogn B Aging Neuropsychol Cogn. 2010;17:575‐590. [DOI] [PMC free article] [PubMed] [Google Scholar]
- 10. Mitchell MB, Miller LS, Woodard JL, et al. Norms from the Georgia centenarian study: measures of verbal abstract reasoning, fluency, memory, and motor function. Neuropsychol Dev Cogn B Aging Neuropsychol Cogn. 2013;20:620‐637. [DOI] [PMC free article] [PubMed] [Google Scholar]
- 11. Miller IN, Himali JJ, Beiser AS, et al. Normative data for the cognitively intact oldest‐old: the Framingham Heart Study. Exp Aging Res. 2015;41:386‐409. [DOI] [PMC free article] [PubMed] [Google Scholar]
- 12. Engberg H, Christensen K, Andersen‐Ranberg K, Jeune B. Cohort changes in cognitive function among Danish centenarians: a comparative study of 2 birth cohorts born in 1895 and 1905. Dement Geriatr Cogn Disord. 2008;26:153‐160. [DOI] [PMC free article] [PubMed] [Google Scholar]
- 13. Gondo Y, Hirose N, Arai Y, et al. Functional status of centenarians in Tokyo, Japan: developing better phenotypes of exceptional longevity. J Gerontol A Biol Sci Med Sci. 2006;61:305‐310. [DOI] [PubMed] [Google Scholar]
- 14. Holtsberg PA, Poon LW, Noble CA, Martin P. Mini‐Mental State Exam status of community‐dwelling cognitively intact centenarians. Int Psychogeriatr. 1995;7:417‐427. [DOI] [PubMed] [Google Scholar]
- 15. Inagaki H, Gondo Y, Hirose N, et al. Cognitive function in Japanese centenarians according to the Mini‐Mental State Examination. Dement Geriatr Cogn Disord. 2009;28:6‐12. [DOI] [PubMed] [Google Scholar]
- 16. Davey A, Elias MF, Siegler IC, et al. Cognitive function, physical performance, health, and disease: norms from the Georgia centenarian study. Exp Aging Res. 2010;36:394‐425. [DOI] [PMC free article] [PubMed] [Google Scholar]
- 17. Rahman‐Filipiak A, Woodard JL, Miller LS, et al. Octogenarian and centenarian performance on the Fuld object memory evaluation. Neuropsychol Dev Cogn B Aging Neuropsychol Cogn. 2015;22:438‐451. [DOI] [PubMed] [Google Scholar]
- 18. De Santi S, Pirraglia E, Barr W, et al. Robust and conventional neuropsychological norms: diagnosis and prediction of age‐related cognitive decline. Neuropsychology. 2008;22:469‐484. [DOI] [PMC free article] [PubMed] [Google Scholar]
- 19. Whittle C, Corrada MM, Dick M, et al. Neuropsychological data in nondemented oldest old: the 90+ study. J Clin Exp Neuropsychol. 2007;29:290‐299. [DOI] [PMC free article] [PubMed] [Google Scholar]
- 20. Holstege H, Beker N, Dijkstra T, et al. The 100‐plus study of cognitively healthy centenarians: rationale, design and cohort description. Eur J Epidemiol. 2018;33:1229‐1249. [DOI] [PMC free article] [PubMed] [Google Scholar]
- 21. Folstein MF, Folstein SE, McHugh PR. "Mini‐Mental State": a practical method for grading the cognitive state of patients for the clinician. J Psychiatr Res. 1975;12:189‐198. [DOI] [PubMed] [Google Scholar]
- 22. Nelson HE, O'Connell A. Dementia: the estimation of premorbid intelligence levels using the new adult reading test. Cortex. 1978;14:234‐244. [DOI] [PubMed] [Google Scholar]
- 23. Schmand B, Bakker D, Saan R, Louman J. The Dutch reading test for adults: a measure of premorbid intelligence level. Tijdschr Gerontol Geriatr. 1991;22:15‐19. [PubMed] [Google Scholar]
- 24. Schmand B, Lindeboom J, van Harskamp F. Dutch Adult Reading Test. Lisse, The Netherlands: Swets & Zeitlinger; 1992. [Google Scholar]
- 25. Wechsler D. WAIS‐III: Wechsler Adult Intelligence Scale. San Antonio, TX: Psychological Corporation; 1997. [Google Scholar]
- 26. Reitan RM. Validity of the Trail Making Test as an indicator of organic brain damage. Percept Mot Skills. 1958;8(3):271‐276. [Google Scholar]
- 27. Benton AL, Hamsher KD, Sivan A. Multilingual Aphasia Examination. Iowa City, IA: AJA Associates; 1989. [Google Scholar]
- 28. Van der Elst W, Van Boxtel MP, Van Breukelen GJ, Jolles J. Normative data for the animal, profession and letter M naming verbal fluency tests for Dutch speaking participants and the effects of age, education, and sex. J Int Neuropsychol Soc. 2006;12:80‐89. [DOI] [PubMed] [Google Scholar]
- 29. Wilson BA, Alderman N, Burgess PW, Emslie H, Evans JJ. Behavioural Assessment of the Dysexecutive Syndrome. St Edmunds, UK: Thames Valley Test Company; 1996. [Google Scholar]
- 30. Balen HGG, Groot Zwaaftink AJM. The Rivermead Behavioural Memory Test. Nederlandstalige Bewerking. Handleiding. Lisse, The Netherlands: Swets & Zeitling; 1987. [Google Scholar]
- 31. Wilson BA, Cockbum J, Baddeley AD. The Rivermead Behavioural Memory Test. Bury St Edmunds, UK: Thames Valley Test Company; 1985. [Google Scholar]
- 32. Lindeboom J, Schmand B, Tulner L, Walstra G, Jonker C. Visual association test to detect early dementia of the Alzheimer type. J Neurol Neurosurg Psychiatry. 2002;73:126‐133. [DOI] [PMC free article] [PubMed] [Google Scholar]
- 33. Warrington EK, James M. The Visual Object and Space Perception Battery. Bury St Edmunds, UK: Thames Valley Test Company; 1991. [Google Scholar]
- 34. Munang L, Chan M, Lim W. Diagnostic performance of the clock drawing test using a pre‐drawn circle in persons with early dementia. Asian J Gerontol Geriatr. 2010;5:54‐61. [Google Scholar]
- 35. Shulman KI. Clock‐drawing: is it the ideal cognitive screening test? Int J Geriatr Psychiatry. 2000;15:548‐561. [DOI] [PubMed] [Google Scholar]
- 36.Unesco E. (1997). International Standard Classification of Education‐ISCED 1997: November 1997. Unesco.
- 37.Mahoney, F., & Barthel, D. (1965). Functional evaluation: The Barthel Index. Maryland State Medical Journal, 12, 61‐65. [PubMed]
- 38. Yesavage JA, Sheikh JI. Geriatric Depression Scale (GDS) recent evidence and development of a shorter violence. Clin Gerontol. 1986;5(1‐2):165‐173. [Google Scholar]
- 39. Kahle‐Wrobleski K, Corrada MM, Li B, Kawas CH. Sensitivity and specificity of the mini‐mental state examination for identifying dementia in the oldest‐old: the 90+ study. J Am Geriatr Soc. 2007;55:284‐289. [DOI] [PMC free article] [PubMed] [Google Scholar]
- 40. Baldelli MV, Salvioli G, Neri M, Pradelli JM. A survey of a centenarian population in Italy, focusing on self‐sufficiency and cognition. Arch Gerontol Geriatr. 1996;22(suppl 1):345‐354. [DOI] [PubMed] [Google Scholar]
- 41. Bauco C, Borriello C, Cinti AM, et al. Correlation between MMSE performance, age and education in centenarians. Arch Gerontol Geriatr. 1998;26:23‐26.18653123 [Google Scholar]
- 42. Mossakowska M, Broczek K, Wieczorowska‐Tobis K, et al. Cognitive performance and functional status are the major factors predicting survival of centenarians in Poland. J Gerontol A Biol Sci Med Sci. 2014;69:1269‐1275. [DOI] [PubMed] [Google Scholar]
- 43. Brumback‐Peltz C, Balasubramanian AB, Corrada MM, Kawas CH. Diagnosing dementia in the oldest‐old. Maturitas. 2011;70:164‐168. [DOI] [PMC free article] [PubMed] [Google Scholar]
- 44. Tombaugh TN, McIntyre NJ. The mini‐mental state examination: a comprehensive review. J Am Geriatr Soc. 1992;40:922‐935. [DOI] [PubMed] [Google Scholar]
- 45. Mitchell AJ. A meta‐analysis of the accuracy of the mini‐mental state examination in the detection of dementia and mild cognitive impairment. J Psychiatr Res. 2009;43:411‐431. [DOI] [PubMed] [Google Scholar]
- 46. Marcopulos BA, McLain CA, Giuliano AJ. Cognitive impairment or inadequate norms? A study of healthy, rural, older adults with limited education. Clin Neuropsychol. 1997;11:111‐131. [Google Scholar]
- 47. Sachdev PS, Levitan C, Crawford J, et al. The Sydney Centenarian Study: methodology and profile of centenarians and near‐centenarians. Int Psychogeriatr. 2013;25:993‐1005. [DOI] [PubMed] [Google Scholar]
- 48. Corrada MM, Brookmeyer R, Berlau D, Paganini‐Hill A, Kawas CH. Prevalence of dementia after age 90: results from the 90+ study. Neurology. 2008;71:337‐343. [DOI] [PubMed] [Google Scholar]
- 49. Yang Z, Slavin MJ, Sachdev PS. Dementia in the oldest old. Nat Rev Neurol. 2013;9:382‐393. [DOI] [PubMed] [Google Scholar]
Associated Data
This section collects any data citations, data availability statements, or supplementary materials included in this article.
Supplementary Materials
Table S1. Categorization of Vision and Hearing.
Table S2. Measurement Properties of the Neuropsychological Tests.
Table S3. Regression Coefficients for Sex, Age, and Education.
Table S4. Regression Formulas to Calculate Regression‐Based Norms.
Table S5. Pearson Correlations Among Cognitive Test Scores.
Figure S1. Flowchart of study inclusion.
Figure S2. Associations between the number of completed tests and overall cognitive test performance.
Supplementary Data. Calculating regression‐based normative data.